 Yannick Bernhardt
 Dmitry Solodov
 Dieter Müller
 Marc Kreutzbruck1
- 1IKT, University of Stuttgart, Stuttgart, Germany
- 2National University of Science and Technology MISiS, Moscow, Russia
- 3Wölfel Monitoring Systems, Höchberg, Germany
Resonant air-coupled emission (RACE) is a new method of detecting damage based on local damage resonance (LDR). Resonant vibrations in defects excite airborne acoustic wave, which emanates from the damaged area, and therefore could be used for diagnostic imaging. A conventional approach to RACE imaging uses C-scanning of flat surfaces with a microphone and provides high-resolution imaging in the near-field zone. In this paper, some features of RACE field are studied experimentally to recognize the possibility of imaging in transition zone between the near- and far-fields. A modification of the RACE scanning mode by using a robot is investigated to be applied to complex shape components. An alternative imaging technique proposed uses a microphone array and provides full-field visualization of RACE field. The 64-microphone acoustic camera array is applied for express testing and imaging. Multiple case studies are given to demonstrate the potential of the both modes for diagnostic imaging of simulated and realistic defects in polymers and composite materials.
Introduction
Lightweight, fiber-reinforced composite materials have been a continually growing industry in recent years. Due to increasing demand of light parts in automotive and aviation, it is expected that production of composite materials will ramp up even more (Sauer et al., 2018). Unlike metallic structures, hidden manufacturing defects, and accidental damage are critical threats for composites. The most important damage in the materials composed of laminated plies is due to weak bonds/disbonds (delaminations) and foreign object impacts. Both usually are more extensive than that seen on the surface and require peculiar non-destructive testing (NDT) and structural health monitoring (SHM) methods to be developed and adapted to these new materials.
A widely-used NDT inspection method is based on monitoring transient elastic excitations in solids [acoustic emission (AE)] that occurs when a material undergoes irreversible changes in its internal structure (Wevers and Surgeon, 2000). The waves are generated by momentary release of strain energy due to material micro-cracking and are traditionally detected by using ultrasonic transducers attached to the test surface. To determine the damage location, the transducers are arranged in arrays to apply beamforming computation tool (McLaskey et al., 2010).
Recent studies show that conventional (internal) acoustic emission can also be accompanied by “external” AE events and, therefore, can be detected remotely, e.g., by air-coupled transducers (Matsuo and Hatanaka, 2019). An alternative approach for detecting and locating sound sources in air is concerned with the use of the beamforming method in acoustic microphone arrays (acoustic cameras) (CAE Software and Systems, n.d.). The algorithm represents the region of interest as a grid of virtual sound sources whose signals are phase-shifted due to various time delays. By drawing the root mean square of the signals over the area in question, an acoustic image is generated. Most applications of acoustic cameras are focused on monitoring noise outside and inside transportation vehicles (from cars to trains and airplanes).
For this reason, commercial acoustic cameras mainly operate in an audible frequency range and cannot be directly applied for conventional ultrasonic imaging of defects where the frequencies of some 100 kHz are required for reasonable resolution (Movahed et al., 2019). Nonetheless, the feasibility of acoustic camera imaging was demonstrated in (Pfeiffer et al., 2013) for a guided wave scattered by an impact damage in a honeycomb composite sandwich. Due to the low efficiency of scattering, the signal-to-noise-ratio (SNR) of the direct image was quite poor, and some additional signal processing was required to visualize the defect fairly.
This paper proposes a new version of AE that differs from its traditional counterparts. It is based on detecting specific airborne sound of damage [resonant air-coupled Emission (RACE)] (Solodov et al., 2017) activated by its resonant vibrations due to local defect resonance (LDR). The LDR develops when the driving frequency matches the particular characteristic frequency of the defect (Solodov et al., 2011). Under LDR condition, the input acoustic energy is delivered and trapped selectively in the defective area that increases dramatically its vibration amplitude. In recent years, the LDR approach has generated much interest in development and applications of efficient resonant techniques for NDT and imaging of defects in composites (Fierro et al., 2017; Hettler et al., 2017; Rahammer and Kreutzbruck, 2017; Pieczonka et al., 2018; Segers et al., 2018; Roy et al., 2019).
The following specific merits of the resonance sound emission by defects are of great value to upgrade the applications in acoustic diagnostic imaging. Firstly, the resonance manifold increase on damage vibrations boosts the efficiency of acoustic emission from the faulty area. The efficient sound radiation occurs only locally in this area in the background of the low-amplitude tremble of the rest of the specimen that naturally provides high SNR of RACE image. For moderate severity damage in composites (cm-sized defects), the LDR frequencies lie in a low-kHz range, implying an opportunity of high-resolution imaging in sonic frequency range.
The RACE pattern is, therefore, an acoustic footprint of damage detected in ambient air and, thus, could be readily used to detect, locate and visualize it, e.g., by 2D-scanning of a receiving microphone. A modification of the RACE scanning mode by using a robot is investigated to be applied to complex shape components. An alternative imaging technique proposed uses a microphone array (SoundCam) and provides express full-field imaging of the RACE field. Multiple case studies are given to demonstrate the potential of the both modes for diagnostic imaging of simulated and realistic defects.
Experimental Procedure
RACE Field Features
Previous study of the RACE performance has showed high-resolution defect imaging in the deep near-field zone of radiation (Foote, 2014). These measurements, however, require high precision of microphone alignment at small distances above the specimen, which is barely applicable in the industrial environment. Our study is aimed at finding more flexible conditions for RACE testing by determining the dependence of defect-imaging quality on the distance between the sound sensor and the specimen surface.
In the experiments, commercial piezo-actuators (isi-sys, Kassel, Germany) with a frequency response extended from low kHz (below 1 kHz) into high kHz range (above 100 kHz) are used. The actuators are driven by a CW voltage generated by the HP 33120A arbitrary waveform generator. Transducers are vacuum-attached to one of the sides of the sample while RACE vibrations are measured on the opposite side of the specimen. To receive the RACE signal, we used a 1/2-inch condenser microphone (B&K 4130, sensitivity 10 mV/Pa) connected to 40-dB preamplifier type B&K 2642 and power supply B&K 2810 (from Brüel & Kjær, Nærum, Denmark). The microphone is attached to a micrometric screw to provide precise positioning above the surface of the specimen.
To experimentally study the RACE field features, the defects are simulated as circular Flat Bottom Holes (FBH) of different sizes (radius and residual back wall thickness) in Polymethylmetacrylat (PMMA) plates. To ascertain the resonance of the defect, the wide-band piezoelectric excitation with a chirp signal (1–150 kHz) is combined with a laser vibrometer (PSV 300 Polytec, Waldbronn, Germany) C-scan of the specimen surface. It enables us to indicate all the resonances in every point of the specimen with a sharp increase of vibration amplitude in the defective area due to LDR. The LDR frequency is identified as the frequency of maximal vibration amplitude for the laser beam position in the center of FBH (~12,400 Hz in Figure 1). After the resonance frequency range has been found, the bandwidth is narrowed around the LDR frequency (10,500–14,100 Hz in Figure 1) to increase spectral resolution, and LDR frequency response is measured (solid line in Figure 1). To measure the RACE frequency response, the microphone is also positioned in the center of the defect and the frequency varies stepwise (100 Hz step in Figure 1) over the LDR frequency range determined. The correlation between RACE and LDR is clearly validated in Figure 1: the increase of the RACE signal coincides with the maximum of the frequency response of FBH resonant LDR vibration.
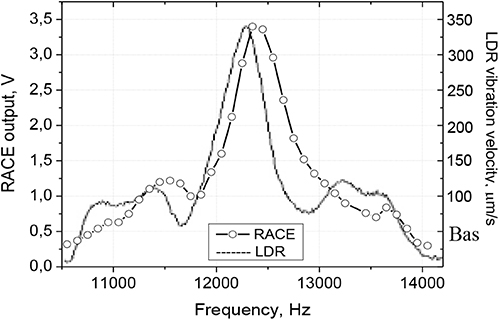
Figure 1. Comparison of RACE and LDR frequency responses for FBH in PMMA plate.
The RACE signal as a function of the microphone position above the surface (h) is shown in Figure 2 for FBH of different LDR frequencies. All FBH have the same radii R = 1 cm and different residual back wall thickness. At low frequency (5,670 Hz), the RACE field displays a sharp decrease and then decays monotonically, while, for the higher frequencies, it manifests an oscillating pattern.
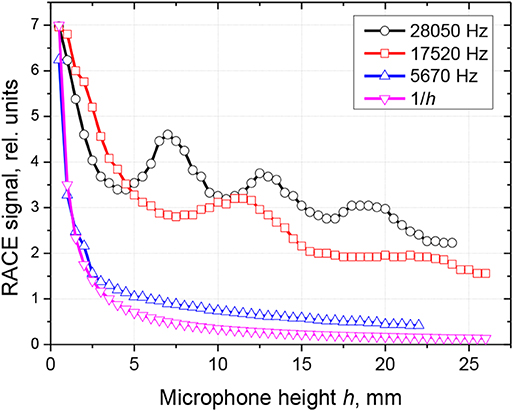
Figure 2. RACE signal as a function of microphone height for different LDR frequencies.
To analyze these features, we recall that for a circular piston projector (a model for FBH radiator) the near-far field transition distance is estimated as D = 4R2/λ (Fierro et al., 2017). At frequencies below 10 kHz, the wavelength λ > > R, and one would expect the far-field pattern even at the distances of the order of a few mm. In this case (5,670 Hz curve, Figure 2), the far-field diffraction reduces the RACE signal, which decays with the distance from the surface close to 1/h dependence characteristic of the spherical wave.
For the higher frequencies in Figure 2, λ ~ R, thus the radiated near field extends over a few-cm distance and becomes quite inhomogeneous along the aperture due to interference. A finite size receiver/reflector (microphone), however, smoothes out the interference ripples so that its output signal matches up with a quasi-plane standing wave. This field manifests half-wave resonances in the gap between the microphone and the specimen that causes the oscillations of the output signal in Figure 2. The first maximum position, h ≈ 7 mm, at the highest frequency (28,050 Hz) is close to the half wavelengths of airborne wave at this frequency in air, λ/2 = c/2f ≈ 6.1 mm, while the position of the second maximum, h ≈ 13 mm, matches well to the wavelength at this frequency, λ = 12.2 mm. A similar conclusion is readily noticed from the plot at 17,520 Hz. Thus, in the higher kHz frequency range, the RACE field can be readily detected in the transition zone between near- and far- fields that extends well beyond mm-range.
Scanning RACE Modes
2D-Scanning Version
The quasi-plane wave RACE signal in the near- and/or transition zones is a footprint of the emission source and can be used for imaging of damage area. To illustrate this opportunity, the measurements of the RACE signal generated by a circular FBH (R=10 mm) at LDR frequency of 17,520 Hz are implemented along the diameter line at different vertical positions (from 0.5 to 20.5 mm) of the microphone (Figure 3). As shown in the figure, the variation of the vertical position changes the amplitude of the RACE signal, however, the size of the RACE area remains basically unchanged and corresponds to the FBH position (shown in the bottom of Figure 3).
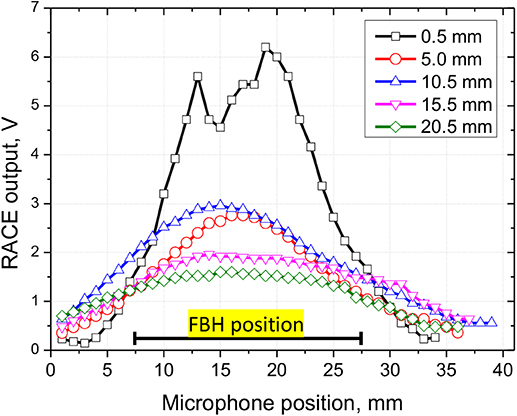
Figure 3. RACE scans along the diameter of FBH at different vertical positions.
The impact of the receiver position on imaging of the defect is further demonstrated in Figure 4 for another FBH in PMMA plate. To visualize the RACE area the microphone is attached to a 2D scanner (Isel-automation) to produce the C-scan image. The data acquisition system for imaging is triggered by the stepped motor encoders and is running under UT-TOFD View-E software by Dasel Sistemas, Madrid, Spain. The LDR for the FBH is found to be 12,700 Hz, so that the transition zone for this frequency extends up to D ≈ 15 mm. Images a–c are taken at the distances of 0.5, 4, and 10 mm, respectively, corresponding to the positions between the near-field and the transition zones. As one would expect from the above measurement (Figure 3), the image distortion is fairly low, so that precise alignment of the receiver close to the surface becomes unessential.
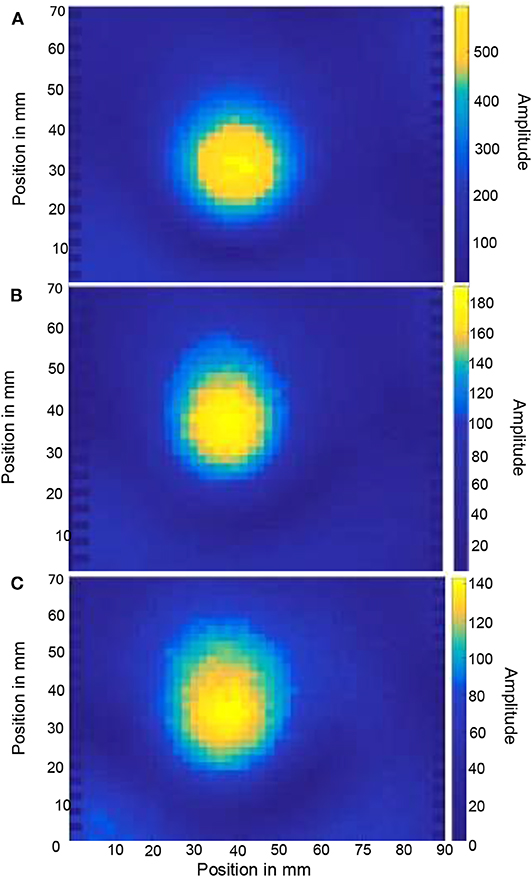
Figure 4. RACE FBH images at various receiver heights: (A) 0.5 mm; (B) 4 mm; (C) 10 mm.
The application of RACE field to imaging of real defects is demonstrated in Figure 5 for a 20-J impact in the non-crimp fabric carbon fiber-reinforced polymer (CFRP) plate (150 mm × 100 mm × 4.5 mm). The defect is mainly internal and is barely visible damage (BVID) on the reverse side (Figure 5a). The interior damage induced by the impact is further characterized by LDR spectrum (Figure 6), obtained using laser vibrometer. Unlike a single-peak LDR characteristic of a fully loose (or tight) defect, the damage, which combines multiple tight and loose parts (with different stiffness), manifests multiple LDR peaks (fractional LDR resonances). They are caused by resonant vibrations of the defect elements and reveal a serious apparently depth-dependent damage. The vibrations of the defect parts are coupled so any of these LDR resonances can be chosen to excite the resonance in the total area of the defect. For this purpose, commercial low-cost piezo-element distributed by Conrad Elektronik GmbH (Hirschau, Germany, Piezokeramische Schallwandler FT-Serie) is used for acoustic activation of defects. The result of the BVID imaging for the microphone positioned in the RACE transition zone (mm/cm range) at one of the fractional LDR frequency selected (18 kHz) is shown in Figure 5b and clearly visualizes the real defect.
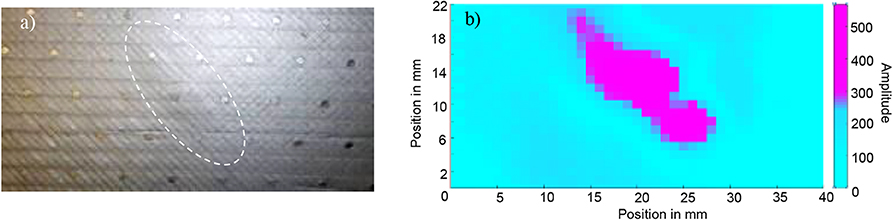
Figure 5. RACE imaging of BVID defect in CFRP plate: (a) photo of the defect; (b) RACE scanning image.
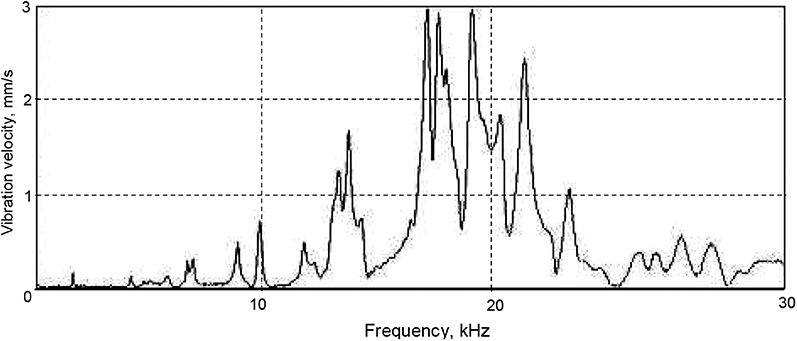
Figure 6. Spectrum of fractional LDR for BVID defect in CFRP plate (Figure 5a).
Robotic RACE Scanning
Unlike the 2D-RACE scanning of flat specimens, the use of robots combined with the methods for optometrical analysis of the surface provides fully autonomous detecting and imaging the defective area in arbitrary shape components. In the experiments, the feasibility of robotic scanning is tested by using the six-axis robot IRB 120 from the supplier ABB, Switzerland. In order to use the same ultrasound recorder as for the three-axis table, the robot control unit IRC 5, ABB, Switzerland was instructed to send pulses over IO-card to emulate encoder signals for virtual the y- and z-axes. To detect the RACE signal the microphone in a special holder is attached to the robot flange (Figure 7).
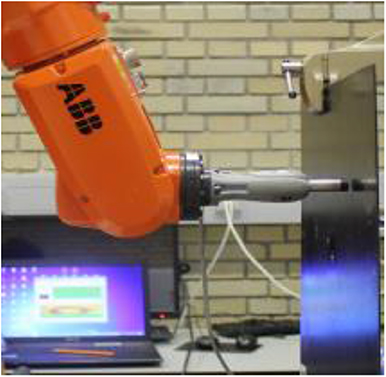
Figure 7. Robotic scanning setup.
To avoid initial search for LDR frequency via laser vibrometry, the wideband (1–100 kHz, chirp/ noisy signal) LDR excitation (isi-sys transducer) was applied in the robotic scanning mode. In this mode, each point of the defect vibrates over a total bandwidth so that LDR (if it is inside this frequency range) is inevitably excited and visualized. Since the phases of the excited resonant vibrations are different, the image has a noisy structure. Figure 8b illustrates the potential of using robotic RACE scanning for simulated circular FBH defects of equal radii, R = 10 mm, but of different back-wall thicknesses in PMMA. For this reason, their LDR frequencies are substantially different (from 13,950 to 21,300 Hz). Nonetheless, the wideband mode chosen (1–100 kHz) enables us to activate all of them in a single C-scan. As one can see from Figure 8, the quality of similar laser vibrometry images is higher; however, the positions and the sizes of the defects, obtained by the RACE scanning, are readily noticeable.
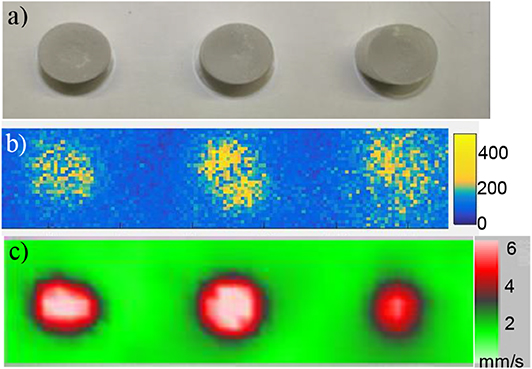
Figure 8. (a) photo of three FBH in plexiglass; (b) multiple RACE images in a single scan noisy mode; (c) laser vibrometer image of FBH excited on their LDR frequencies.
The fundamental LDR frequencies for cm-sized defects are usually in the range of 10 kHz–100 kHz. Therefore, the wider bandwidth used (100 kHz), in addition to the fundamental LDR, also activates the higher-order resonances, which have different vibration patterns but eventually cover a total defective area. That is why the superposition of multiple-order LDR is known to readily reproduce the shape of the defects (Rahammer and Kreutzbruck, 2017). This is illustrated in Figure 9 for a set of four square (20 mm × 20 mm) Teflon sub-surface inserts positioned at different depths in a CFRP plate (5 mm × 290 mm × 330 mm). The RACE robotic imaging demonstrates a decent quality of visualization for both the positions and the shapes of the defects.
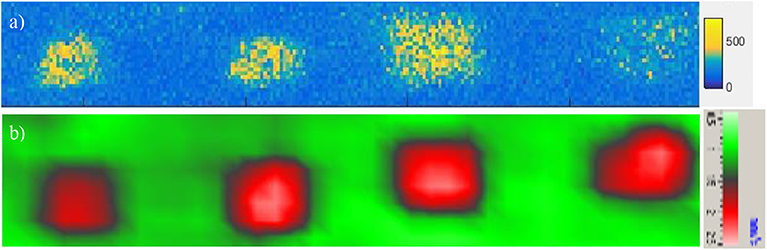
Figure 9. Noisy mode of LDR imaging applied to four square inserts in CFRP: (a) RACE imaging; (b) wideband laser vibrometry.
The wideband robotic mode can also be used to reproduce the defects of much more complex shapes. Figure 10 demonstrates the wideband RACE image (noisy signal) of the Teflon ring delamination (outer diameter 55 mm) in CFRP plate (400 mm × 400 mm × 2 mm) compared with vibrometric picture obtained for chirp (1–100 kHz) excitation. For this defect, the laser vibrometry reveals multiple fractional LDR in the range of 10–50 kHz. Each fractional resonance shows a particular part of the defect, while the whole picture of the ring delamination is reconstructed in the wideband RACE mode.
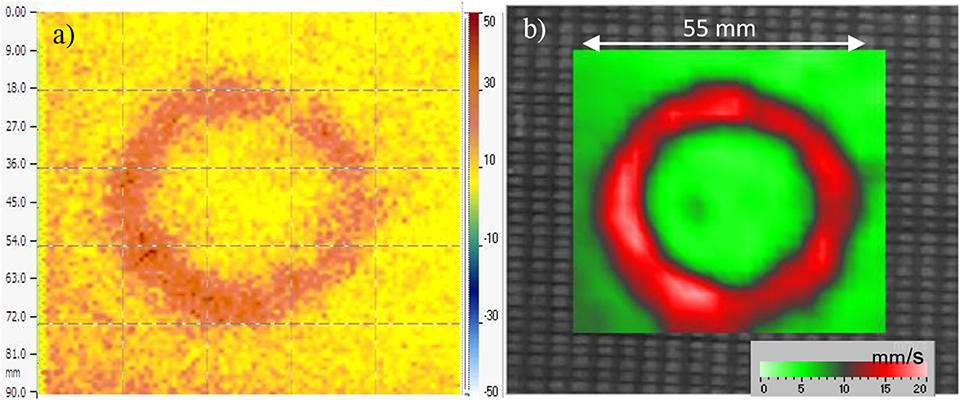
Figure 10. (a) robotic scanning image of a ring delamination in CFRP; (b) wideband chirp laser vibrometry image.
Full-Field RACE Mode Imaging
The results obtained in the experiments above show that the scanning method visualizing of the defects is useful and provides reasonable RACE imaging. However, this process is rather time-consuming. For example, in the robotic experiment the scanning speed was 10 mm/s, and it took 10–20 min to scan the area of the defects. This drawback is avoided in a new full-field RACE imaging method whereby an acoustic camera is used for instant detection and imaging of the defect.
The feasibility of this technique is demonstrated below using the acoustic camera SoundCam by CAE Systems (Gütersloh, Germany) provided by Wölfel GmbH (Würzburg, Germany). It contains 64 MEMS-microphones, the data acquisition system with 24-bit resolution, sample rate of 48 kHz, with an operating frequency range of 10–24 kHz. The setup to provide full-field RACE imaging is shown in Figure 11. The camera operation included the adjustment of the distance to the sound source, the dynamic range and the frequency of the receiver.
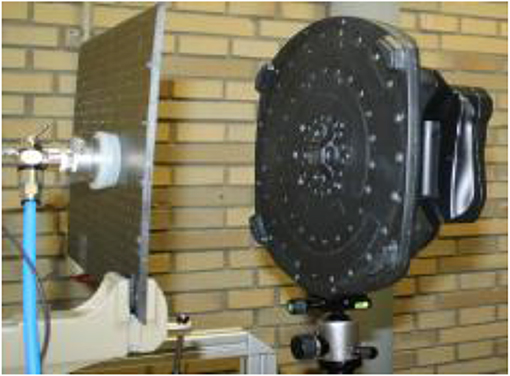
Figure 11. SoundCam setup for full field RACE imaging.
To test the acoustic camera operation, the acoustic field of the piezo-actuator (isi-sys) was visualized first (Figure 12). As one can see from the picture, the active zone of acoustic field of the vacuum-attached transducer (diameter of 5 mm) is highlighted with a bright spot. This circular spot indicates the position where the sound amplitude is maximal, which matches to the real active zone of the transducer. The SoundCam interface, also shown in Figure 12, indicates reasonably high (>10 dB) dynamic range of the image and a fundamental frequency radiated (≈ 13,100 Hz).
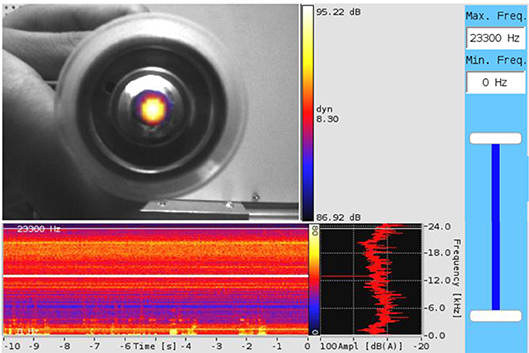
Figure 12. The interface of SoundCam and full-field image of acoustic field for isi-sys transducer (frequency 13100 Hz).
The vacuum-attached transducer was then used in the noisy mode for the RACE excitation in a PMMA plate with two FBH (Figure 13). The laser vibrometry test reveals different LDR frequencies for those holes (Figures 13a,b). The frequency bandwidth of the SoundCam receiver was then narrowed down around the value of the LDR frequency (12,200–13,300 Hz, Figure 13d) to demonstrate consecutive frequency-selective RACE imaging of the defects.
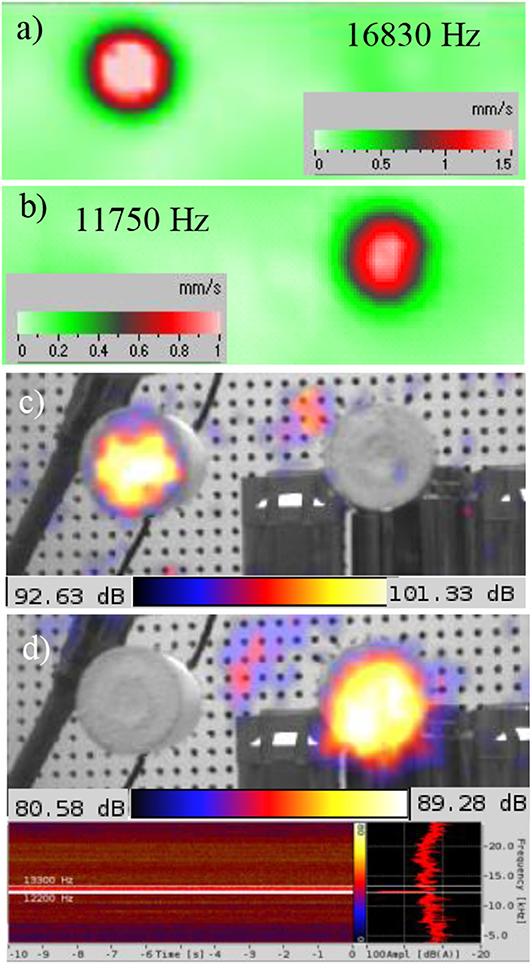
Figure 13. Frequency-selective full-field RACE imaging (c,d) and laser vibrometry (a,b) for a pair of circular FBH of different LDR frequencies.
Full-field scanning can be applied for imaging of not only simulated but also some realistic defects, as demonstrated in Figures 14a,b, for an elliptic delamination above the actuator embedded in a glass fiber-reinforced polymer (GFRP) plate. The active part of the delamination responds to LDR excitation at frequency of 18,900 Hz and is seen in the laser vibrometry scan (Figure 14b). Full-field RACE excited at this frequency (Figure 14a) clearly indicates the resonance part of the delamination but requires much less time for testing.
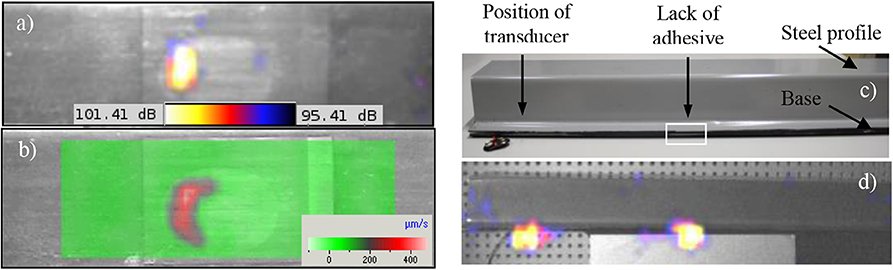
Figure 14. SoundCam imaging of a delamination in piezo-actuator embedded in GFRP plate (a), 18,900-Hz LDR laser vibrometry image of the delamination (b), steel profile with adhesive disbond (c), and full-field RACE image of the disbonded area (d).
An application of RACE for full-field imaging of defects in a lap joint is shown in Figures 14c,d. The joint is made by gluing the flanges of the rectangular steel profile (500 mm × 50 mm × 65 mm) to 1.5-mm steel base. The disbond (length ≈ 40 mm) is simulated by the lack of adhesive between the flange and the base (inside the white rectangular in Figure 14c). A piezoelectric transducer is attached to the reverse side of the base and excited with 20 V noise signal. The two bright spots in Figure 14d) disclose the acoustic waves generated by the transducer (left) and the RACE field radiated by the disbonded area (right).
Two other examples of full-field imaging of real impact-induced defects in CFRP are shown in Figure 15. The impact damage in the stringer-reinforced CFRP plate results in a clearly visible crack on the reverse side (Figure 15a) and is closely visualized with laser vibrometry scan at LDR frequency 17,940 Hz (Figure 15b). Interestingly, similar to the full-field ultrasonic thermography imaging (Stoessel et al., 2000), where the vibration of the crack tips leads to the dissipation of energy and the temperature rise, the vibration around the tips area also produces specific RACE pattern readily detected by the acoustic camera (Figure 15c).
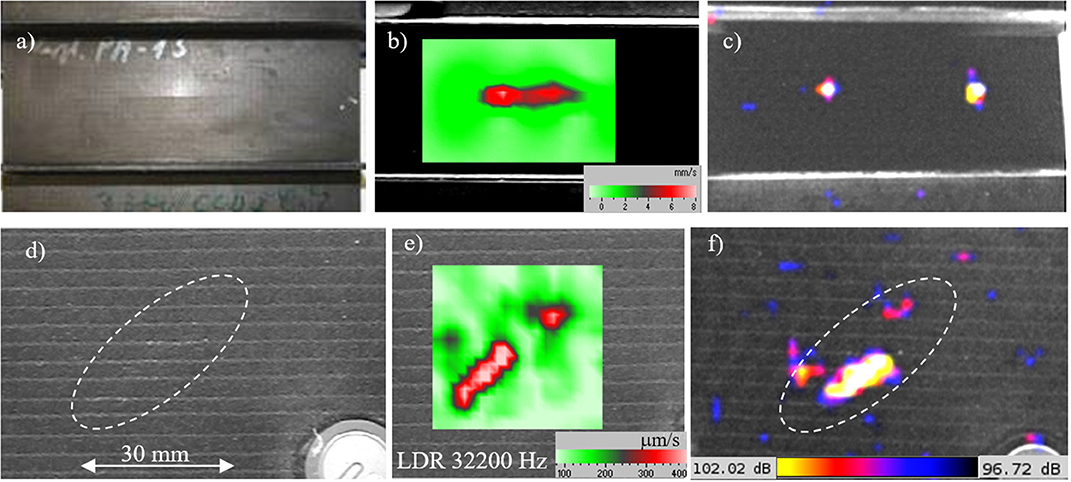
Figure 15. (a) Crack in CFRP stringer-reinforced sample, laser vibrometer LDR image (b), SoundCam image (c), 20-J-impact-induced BVID in non-crimp fabric CFRP plate (d), vibrometry image at fractional LDR frequency 32200 Hz (e), and full-field visualization using acoustic camera (f).
Another impact-induced BVID shown in Figure 15d is a result of 20-J-impact in non-crimp fabric CFRP sample (150 mm × 100 mm × 3 mm). The damage becomes barely visible only because of slight bleaching of the stitching yarn. The laser vibrometry, nonetheless, reveals the damage most clearly seen at fractional LDR frequency 32,200 Hz (Figure 15e). This value is outside the bandwidth of the SoundCam; for this reason, the acoustic camera image in the noisy mode (Figure 15f) is obviously not as good as the laser vibrometry scan, however, it still indicates the presence and the position of the defect.
Conclusions
Study of the RACE features implemented in the paper confirms that the RACE field is produced by the resonant vibrations of a defect (LDR). In the higher kHz frequency range, the RACE field can be readily detected in the transition zone between near- and far-fields that extends well beyond mm-range, and precise alignment of the receiver closely to the surface becomes unessential. This enables us to apply conventional RACE scanning for imaging of serious defects in composites (including BVID) with modest restrictions on the microphone distance from the defect. Unlike 2D-RACE scanning of flat specimens, the use of industrial robots provides fully autonomous detecting and imaging of the defects in complicated shape components. The robotic RACE scanning combined with wideband noisy excitation proves the feasibility of simultaneous imaging of multiple defects without prior search for LDR frequencies.
A new full-field RACE imaging method with an array of microphones as a receiver avoids the drawback of time-consuming scanning modes and is used for express detection and imaging of defects. This case study of the full-field RACE mode with acoustic camera array validates reliable imaging of various defects in composites and disbonds in a steel lap joint.
Data Availability Statement
The data presented in this article are stored in an internal system according to the guidelines of the German Research Foundation (DFG). The raw data supporting the conclusions of this article will be made available by the authors, without undue reservation.
Author Contributions
YB was responsible for operation of the robot and creation of the data acquisition system for robotic scanning. DS implemented the major bulk of RACE measurements in both scanning and full-field modes. DM provided the SoundCam instrument and advised on the methodology of full-field imaging. MK initiated and coordinated experimental work and perception of the results.
Conflict of Interest
DM was employed by company Wölfel Group, Höchberg, Germany.
The remaining authors declare that the research was conducted in the absence of any commercial or financial relationships that could be construed as a potential conflict of interest.
Acknowledgments
The authors acknowledge support of this study in the framework of DFG funded project KR 31 2131/12-1.
References
CAE Software and Systems (n.d.). Acoustic Camera/Sound Source Localization-Noise Inspector. Available online at: https://www.cae-systems.de (accessed May 18, 2020).
Fierro, G. P. M., Ginzburg, D., Ciampa, F., and Meo, M. (2017). Impact damage on a complex composite stiffened panel using a nonlinear ultrasound stimulated thermography approach. J. Nondestr. Eval. 36:4. doi: 10.1007/s10921-017-0449-x
Foote, K. G. (2014). Discriminating between the nearfield and the farfield of acoustic transducers. J. Acoust. Soc. Am. 136, 1511–1517. doi: 10.1121/1.4895701
Hettler, J., Tabatabaeipour, M., Delrue, S., and Van Den Abeele, K. (2017). Detection and characterization of local defect resonances arising from delaminations and flat bottom holes. J. Nondestr. Eval. 43:36. doi: 10.1007/s10921-016-0380-6
Matsuo, T., and Hatanaka, D. (2019). Development of non-contact fatigue crack propagation monitoring method using air-coupled acoustic emission system. Eng. Trans. 67, 185–198. doi: 10.24423/EngTrans.1009.20190405
McLaskey, G., Glaser, S. D., and Grosse, C. U. (2010). Beamforming array techniques for acoustic emission monitoring of large concrete structures. J. Sound Vib. 329, 2384–2394. doi: 10.1016/j.jsv.2009.08.037
Movahed, A., Washckies, T., and Rabe, U. (2019). Air ultrasonic signal localization with a beamforming microphone array. Adv Acoustics Vib. 2019:12. doi: 10.1155/2019/7691645
Pfeiffer, H., Böck, M., Pitropakis, I., Szewieczek, A., Hillger, W., Glorieux, C., et al. (2013). Identification of impact damage in sandwich composites by acoustic camera detection of leaky Lamb wave mode conversions. e-J. NDT 1435–4934.
Pieczonka, L., Zietek, L., Klepka, A., Staszewski, W. J., Aymerich, F., and Uhl, T. (2018). Damage imaging in composites using nonlinear vibro-acoustic wave modulations. Struct. Contr. Health Monitor. 25:e2063. doi: 10.1002/stc.2063
Rahammer, M., and Kreutzbruck, M. (2017). Fourier-transform vibrothermography with frequency sweep excitation utilizing local defect resonances. NDT E Internat 86, 83–88. doi: 10.1016/j.ndteint.2016.11.012
Roy, B., Bose, T., and Debnath, K. (2019). Detection of local defect resonance frequencies using bicoherence analysis. J. Sound Vib. 443, 703–716. doi: 10.1016/j.jsv.2018.12.006
Sauer, M., Kühnel, M., and Witten, E. (2018). Composites-Marktbericht 2018. Federation of Reinforced Plastics.
Segers, J., Kersemans, M., Hedayatrasa, S., and Tellez, J. A. C. (2018). Towards in-plane local defect resonance for non-destructive testing of polymers and composites. NDT E Internat 98, 130–133. doi: 10.1016/j.ndteint.2018.05.007
Solodov, I., Bai, J., Bekgulyan, S., and Busse, G. (2011). A local defect resonance to enhance acoustic wave-defect interaction in ultrasonic nondestructive testing. Appl. Phys. Letts. 99:211911. doi: 10.1063/1.3663872
Solodov, I., Dillenz, A., and Kreutzbruck, M. (2017). A new mode of acoustic NDT via resonant air-coupled emission. J. Appl. Phys. 121:245101. doi: 10.1063/1.4985286
Stoessel, R., Dillenz, A., Krohn, N., and Busse, G. (2000). Zerstörungsfreie Prüfung mit defekt-selektiven Abbildungsverfahren. Materialprüfung 42, 38–44
Keywords: resonant air-coupled emission, local defect resonance, structural health monitoring, beamforming, non-destructive testing
Citation: Bernhardt Y, Solodov D, Müller D and Kreutzbruck M (2020) Listening for Airborne Sound of Damage: A New Mode of Diagnostic Imaging. Front. Built Environ. 6:66. doi: 10.3389/fbuil.2020.00066
Received: 11 December 2019; Accepted: 17 April 2020;
Published: 28 May 2020.
Edited by:
Francesco Ciampa, University of Surrey, United KingdomReviewed by:
Christos Panagiotopoulos, Foundation for Research and Technology Hellas, GreeceGian Piero Malfense Fierro, University of Bath, United Kingdom
Copyright © 2020 Bernhardt, Solodov, Müller and Kreutzbruck. This is an open-access article distributed under the terms of the Creative Commons Attribution License (CC BY). The use, distribution or reproduction in other forums is permitted, provided the original author(s) and the copyright owner(s) are credited and that the original publication in this journal is cited, in accordance with accepted academic practice. No use, distribution or reproduction is permitted which does not comply with these terms.
*Correspondence: Yannick Bernhardt, eWFubmljay5iZXJuaGFyZHQmI3gwMDA0MDtpa3QudW5pLXN0dXR0Z2FydC5kZQ==