- 1Department of Earth Sciences, Western University, London, ON, Canada
- 2Department of Statistical & Actuarial Sciences, Western University, London, ON, Canada
Quantitative seismic risk assessments involve hazard characterization, exposure database, vulnerability assessment, and uncertainty modeling, and promote consistent risk management actions, when conducted systematically across a country. This study implements a performance-based earthquake engineering methodology to develop a nationwide earthquake risk model for Canadian wood-frame houses by integrating probabilistic seismic hazard analysis results provided by the Geological Survey of Canada and seismic fragility functions derived from incremental dynamic analysis. To facilitate the implementation of the seismic risk analysis method, an in-house probabilistic seismic hazard analysis tool for Canada is developed and used to verify the accuracy of the adopted approach of approximating the upper tail of the seismic intensity measure distribution and to generate detailed seismic disaggregation results for ground motion record selection and seismic fragility modeling purposes. By integrating the preceding two elements via Monte Carlo methods, a full seismic risk curve can be obtained in a computationally efficient manner. The approach is applied to 1,620 representative locations used for the 2016 Canadian Census and thus facilitates the development of seismic risk maps of key risk metrics that are derived from exceedance probability curves in terms of earthquake damage/loss ratio. The developed seismic risk maps serve as valuable decision-support tools to implement risk-based management strategies consistently across Canada.
Introduction
Quantitative risk assessments are essential tools for disaster risk management and reduction and play critical roles in disaster risk financing (Mitchell-Wallace et al., 2017). A general risk analysis involves hazard characterization, exposure database, and vulnerability assessment, and requires incorporation of uncertainties associated with key model components. State-of-the-art methods for quantifying earthquake risk impact (i.e., earthquake catastrophe models) are based on a performance-based earthquake engineering (PBEE) framework (e.g., Goulet et al., 2007; Tesfamariam and Goda, 2015). In the context of seismic risk, the hazard module is typically based on probabilistic seismic hazard analysis (PSHA), the exposure module is based on building stock and population information (e.g., census), whereas vulnerability assessment is mainly concerned with seismic fragility of buildings and infrastructure. Risk assessment results are usually expressed as exceedance probability curves and risk metrics (e.g., annual expected loss and maximum probable loss) and can be used for making risk management decisions (Yoshikawa and Goda, 2014).
Canada is a large country with diverse seismic hazards—active crustal and subduction earthquakes in the west vs. stable continental intraplate earthquakes in the east. About 40% of the population in Canada live in active seismic regions, and in Quebec, 70% of its population is concentrated in a major rift region along St. Lawrence River. Historically, different types of earthquakes contributed to earthquake disasters in Canada (Cassidy et al., 2010). In western Canada, historical records/experiences of major seismicity are limited due to a short history of human settlements. Major earthquakes include the 1918 (M6.9) and 1946 (M7.3) earthquakes in Vancouver Island, and the 2001 (M6.8) Nisqually earthquake in Washington. One of the major concerns is the Cascadia subduction event in Pacific Northwest (Hyndman and Rogers, 2010), which can result in a moment magnitude (Mw) exceeding 9. In eastern Canada, several major events are observed in the St. Lawrence rift region and the Western Quebec region. Major damaging events between M6 and M7 occurred in the Charlevoix seismic zone of Quebec (in 1663, 1860, 1870, 1925, and 1971), while more recent moderate events caused non-negligible losses (e.g., M5.9 1988 Saguenay earthquake; Mitchell et al., 1990).
A uniform nationwide seismic risk assessment promotes consistent risk management actions. For Canada, national seismic hazard maps are developed by the Geological Survey of Canada (GSC). Halchuk et al. (2014, 2015) provide site-specific values of uniform hazard spectra (UHS) for eight return period levels between 50 and 2,475 years at circa 10 km grids across Canada, although seismic disaggregation results are not available. The latter is valuable for selecting ground motion records in developing seismic fragility functions (Baker, 2011; Goda and Atkinson, 2011), especially for a country with diverse seismic hazard characteristics. The national seismic hazard maps reflect the current scientific understanding of seismicity and ground motions in Canada and form the basis of seismic design provisions for the National Building Code of Canada (NBCC; Mitchell et al., 2010; Humar, 2015). However, such risk assessments for general building typologies (e.g., wooden houses and masonry buildings) are not available across Canada [note: regional seismic risk assessments were conducted, e.g., Onur et al. (2006)]. In other words, nationwide seismic hazard information has not yet been integrated with exposure and vulnerability to derive comprehensive earthquake risk assessments.
Wooden frames are common constructions for residential houses in Canada. Seismic performances of wood-frame houses may not be uniform, because different construction practices have been adopted, depending on built years and relevant seismic design codes which have evolved over years. For instance, according to Ventura et al. (2005), 56% of buildings in British Columbia are wood-frame houses, 40% of which were built before 1970, indicating that the majority of old residential houses can be considered as “not seismically engineered” since seismic provisions of the NBCC were adopted and enforced in British Columbia after 1973. In evaluating seismic performances of Canadian wooden houses via seismic fragility analysis, the UBC-SAWS models, which were developed and validated through an extensive experimental program at the University of British Columbia (White and Ventura, 2006), can be considered as most applicable structural models. Moreover, consideration of exposure information, such as the 2016 Canadian Census (https://www12.statcan.gc.ca/census-recensement/2016/dp-pd/index-eng.cfm), is useful to put hazard-vulnerability assessments of Canadian residential wooden constructions in perspectives of nationwide earthquake risk management. For example, the annual expected loss can be evaluated for representative census locations (i.e., Forward Sortation Areas, FSA) and displayed as nationwide seismic risk maps.
This study implements a PBEE-based seismic risk methodology to develop a nationwide earthquake risk model for wood-frame houses in Canada. It integrates PSHA results provided by the GSC (Halchuk et al., 2015) and seismic fragility functions that are derived from incremental dynamic analysis (IDA; Vamvatsikos and Cornell, 2002). More specifically, two practical outputs related to hazard modeling and vulnerability modeling are generated: (1) surrogate statistical seismic hazard models for the GSC's PSHA results as the best fitting model among the lognormal, Gumbel, Frechet, and Weibull distributions, and (2) seismic fragility models of typical wood-frame houses, having four different configurations of wooden shear-walls, subjected to different sets of ground motion records that reflect local seismic hazard characteristics. The accuracy of the former is examined by comparing with an in-house PSHA tool beyond the return period levels that are considered by the GSC (i.e., 2,475 years and longer). By utilizing the in-house PSHA tool, seismic disaggregation results at specific locations can also be obtained, thus facilitating a ground motion record selection based on multiple-event conditional mean spectra (CMS; Baker, 2011; Goda and Atkinson, 2011). To capture a broad range of seismicity in Canada, detailed PSHA calculations are carried out at 64 sites (eight major city locations, namely, Victoria, Vancouver, Calgary, Toronto, Ottawa, Montreal, Quebec City, and La Malbaie, and 56 locations that correspond to centroids of seismic sources zones as defined by the GSC), and site-specific seismic fragility functions are derived from IDA of the four UBC-SAWS models subjected to up to 50 record pairs, selected from a ground motion database containing 721 record pairs. For a given location, a site-specific UHS is used to assign the most suitable seismic fragility model based on the results at the 64 locations. By integrating the preceding two elements via Monte Carlo methods, one can obtain a full seismic risk curve in a computationally efficient manner. This nationwide earthquake catastrophe model for wood-frame houses in Canada facilitates the development of site-specific exceedance probability curves in terms of earthquake damage/loss ratio as well as seismic risk maps that display annual expected damage/loss and probability of experiencing seismic damage exceeding a certain extent. Although the implemented seismic hazard approximation and the seismic fragility modeling are not new from methodological viewpoints, this study presents, for the first time, a workable approach of generating nationwide seismic risk maps to cover a whole geography of Canada. It also produces a comprehensive list of model parameters of the approximated seismic hazard distribution and the assigned seismic fragility functions for wooden houses at 1,620 FSA locations of the 2016 Canadian Census (see Supplementary Materials). The significance of this study is the outputs from the developed nationwide earthquake risk model for wood-frame houses in Canada, which are currently unavailable and is needed for consistent earthquake risk management actions.
Methodology
Quantitative Seismic Risk Assessment
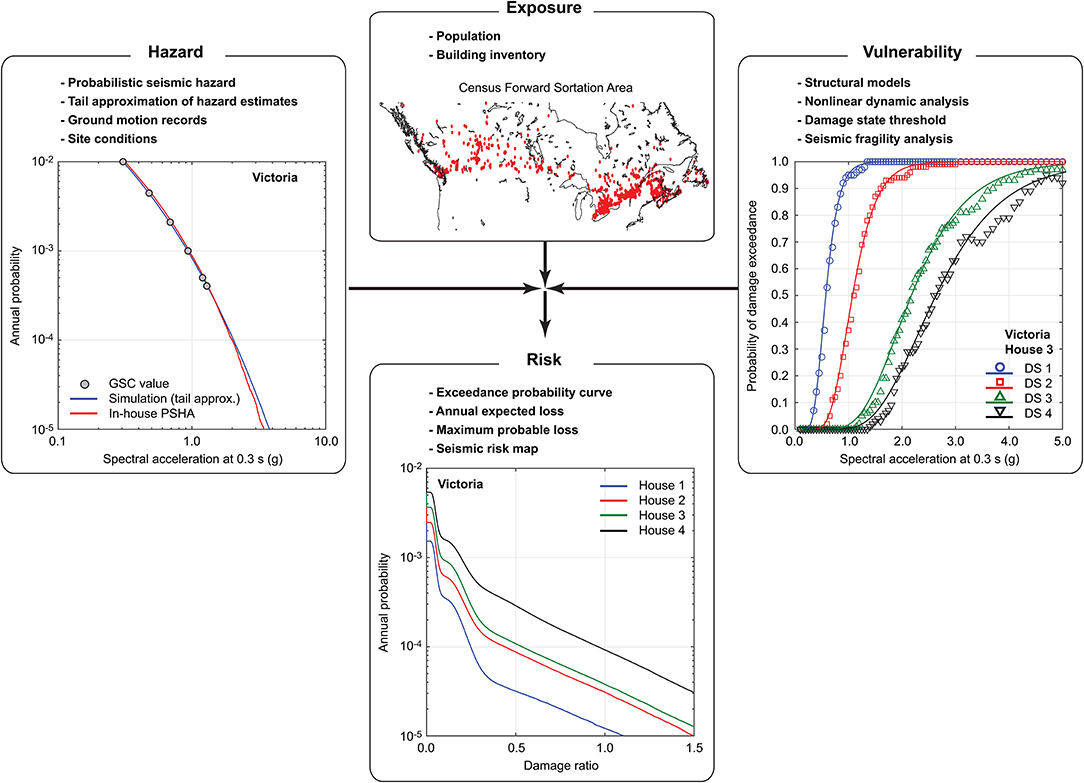
An adopted approach for quantitative seismic risk assessments of typical wooden houses in Canada is a generic risk equation: i.e., risk = hazard × exposure × vulnerability. The framework of the seismic risk analysis implemented in this study is illustrated in Figure 1.
The seismic hazard module is primarily based on the GSC's PSHA results that are available for more than 200,000 locations across Canada (at about 10 km grids). The GSC's PSHA results, which are listed as UHS at eight return period levels between 50 and 2,475 years, are insufficient to capture more extreme ground motions that could cause building damage and disruption, and are not accompanied by seismic disaggregation results. The latter is essential to conduct detailed ground motion record selection in developing seismic fragility functions. In other words, with the GSC's results alone one cannot evaluate a full probabilistic seismic risk curve reliably. To overcome these deficiencies, an in-house Monte Carlo simulation-based PSHA tool for Canada is developed, and its accuracy is verified against the GSC's PSHA values. Subsequently, a surrogate statistical distribution is fitted based on eight seismic hazard estimates of a given intensity parameter by considering four candidate distributions (i.e., lognormal, Gumbel, Frechet, and Weibull) and by choosing a distribution with the highest correlation coefficient with the GSC's seismic hazard values. The chosen distribution should approximate the site-specific seismic hazard curve beyond the return period of 2,475 years (i.e., upper tail) well; this proximity is examined by comparing the fitted statistical model and the results from the in-house PSHA tool. Moreover, the in-house PSHA tool generates seismic disaggregation results (Hong and Goda, 2006); these outputs can be used for ground motion record selection purposes. The procedures of the upper-tail approximation of the GSC's PSHA results and its accuracy are described in section Upper-Tail Approximation of Geological Survey of Canada's Hazard Results.
For vulnerability assessments, seismic fragility functions of four wood-frame house types in Canada, each represented by the UBC-SAWS model, are developed. Descriptions of the four UBC-SAWS models are given in section Structural Models of Canadian Wooden Houses. IDA of the UBC-SAWS models is implemented by considering a large set of 721 ground motion records (each consisting of two horizontal components) that were observed from shallow crustal earthquakes as well as subduction earthquakes (both interface and inslab). The consideration of different earthquake types in developing seismic fragility functions is important to capture realistic seismic hazard characteristics (e.g., long duration and frequency content) beyond the seismic intensity parameters (Koduru and Haukaas, 2010; Pan et al., 2018). Non-linear dynamic analyses of the four UBC-SAWS models are conducted for all ground motion records, followed by the CMS-based record selection to develop seismic fragility functions for a site of interest (Baker, 2011). For sites in southwestern British Columbia, the multiple-event CMS procedure (Goda and Atkinson, 2011) is implemented to capture different earthquake types. More specifically, 64 locations (i.e., eight major cities and 56 locations that encompass different seismicity across Canada) are considered for seismic fragility modeling. The seismic fragility functions for four damage states (slight, moderate, extensive, and collapse) derived for the 64 locations are assigned to the 1,620 FSA locations by examining the similarity of UHS amplitudes and shapes. The procedure for developing seismic fragility functions via IDA is described in section Development of Seismic Fragility Functions, whereas the main results of the seismic fragility analysis are presented in section Seismic Fragility Analysis of Canadian Wooden Houses.
For the exposure component, the most recent census data for Canada are considered. To focus on locations where Canadian populations reside, centroids of 1,620 FSA locations, which typically correspond to the first three letters/numbers of Canadian postal codes, are considered. At the FSA locations, the approximate statistical models of the seismic hazard intensity measure and the applicable seismic fragility functions of the four UBC-SAWS models are obtained to facilitate the development of nationwide seismic risk mapping of residential wood-frame houses in Canada.
Finally, for each FSA location, seismic hazard-vulnerability integration is carried out via Monte Carlo simulations, and exceedance probability curves for the four house types are obtained. Subsequently, quantitative seismic risk metrics, such as annual expected damage ratio and probability of experiencing seismic damage exceeding a certain extent, are derived and are shown on maps to display the spatial distribution of earthquake risk to typical residential building stock across Canada. The results of the quantitative seismic risk assessments for wood-frame houses are discussed in section Seismic Risk Assessments of Canadian Wooden Houses.
Upper-tail Approximation of Geological Survey of Canada's Hazard Results
This section describes a procedure to approximate the GSC's seismic hazard estimates (Halchuk et al., 2015) by a suitable probability distribution, and evaluates the accuracy of the approximation. Because the GSC's hazard values are available at eight return period levels only and the longest return period level of 2,475 years is not sufficiently extreme to cause severe damage to buildings in Canada, one needs to be equipped with a PSHA tool that can reproduce the GSC's results closely and use this tool for verification purposes.
The in-house PSHA tool is based on Monte Carlo simulations (Atkinson and Goda, 2013), and implements all major components of the GSC's national seismic hazard model as described in Halchuk et al. (2014). MATLAB is used as a computational platform. Differences of calculated seismic hazard values between the GSC and this work can result from differences in how numerical evaluations are performed—the in-house tool evaluates seismic hazard integration via Monte Carlo simulations by utilizing a synthetic earthquake catalog, whereas the GSC seismic hazard tool uses numerical integration by discretizing main variables of seismic hazard analysis (e.g., earthquake magnitude, spatial source zone, and ground motion variability). Evaluations of distance measures for fault sources could lead to discrepancy in the calculated hazard values, depending on how finite fault sources are represented and how uncertainties of the fault source parameters are accounted for.
Figure 2A shows a map of Canada, where 64 locations (i.e., eight major cities and 56 source-zone-based sites) are indicated, whereas Figures 2B,C show zoom-up panels for western and eastern Canada, respectively. In Figures 2B,C, regional seismic source zones that are considered by the GSC are included. It is noted that in the in-house PSHA tool, multiple source zone models with proper logic-tree weights, as specified by Halchuk et al. (2014), are taken into account. The seismicity of the source zones is based on a Gutenberg-Richter relationship and its parameters (i.e., a-value, b-value, and lower and upper truncation magnitudes as well as their logic-tree weights) are set identical to those described in Halchuk et al. (2014). Seismic events occurring in areal sources (i.e., solid-line polygons in Figure 2) are treated as point sources, whereas those from specific large-scale faults and subduction zones (i.e., broken-line polygons in Figure 2) are represented as finite-fault sources. Ground motion models are based on the tabulated version, as provided by Halchuk et al. (2014), with specified logic-tree weights. The ground motions for unspecified values of magnitude and distance are obtained by interpolation, and the effects of aleatory variability of ground motion parameters are taken into account by simulating normally distributed error terms. Different sets of ground motion models are implemented for different types of earthquakes (e.g., shallow crustal earthquakes in west vs. east as well as crustal versus inslab versus interface earthquakes) to capture epistemic uncertainty for a given earthquake type (Atkinson and Adams, 2013). In the simulation procedure, for finite-fault sources, a hypothetical rupture plane is generated by accounting for uncertainty of the overall fault geometry (as implemented in the GSC's logic-tree model), and is used to calculate the source-to-site distance based on the finite-fault representation of the rupture.
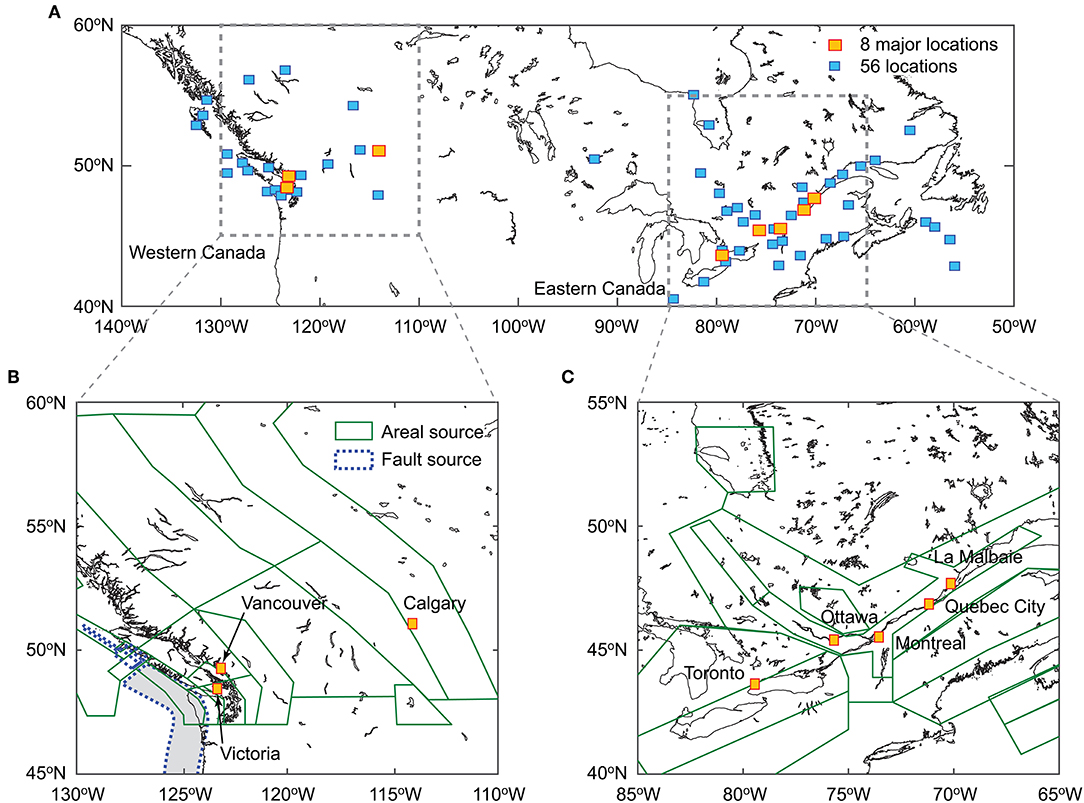
Figure 2. (A) Map of Canada, (B) seismic source zones for western Canada, and (C) seismic source zones for eastern Canada.
In the simulation-based PSHA, a synthetic earthquake catalog is first generated by sampling occurrence times, locations, and magnitudes of earthquakes according to the source models and by taking into account logic-tree weights for epistemic random variables, and then a set of 10 ground motion parameters, which is the same as in the 2015 GSC seismic hazard model, i.e., peak ground acceleration and spectral accelerations (SA) at the vibration period of 0.1, 0.2, 0.3, 0.5, 1, 2, 3, 5, and 10 s, is evaluated for all events in the synthetic earthquake catalog. Subsequently, the annual maximum ground motion values are identified from the simulated ground motion intensities, and annual frequency of exceedance is assigned, after sorting them in an ascending order. A plot of ground motion intensity values at the same return period level (i.e., reciprocal of annual frequency) is a UHS, whereas a plot of the annual maximum ground motion intensity and the annual frequency of exceedance is a seismic hazard curve. A seismic disaggregation plot can also be obtained by gathering information of seismic events that contribute to a specified return period level (Hong and Goda, 2006). Overall, the agreement between the GSC's hazard estimates and those obtained from the in-house PSHA tool is satisfactory. For the 64 locations indicated in Figure 2A, the differences of the UHS values for the 10 ground motion parameters are typically <3% (note: detailed comparisons can be found in Supplementary Materials).
To show the comparisons of the seismic hazard values based on the GSC and the in-house tool, UHS at the 2,475-year return period and seismic hazard curves for SA at 0.3 s are presented in Figure 3 for Victoria, Vancouver, Montreal, and La Malbaie (note: these four locations are used for illustration hereafter; see Figure 2). Figure 3 also includes seismic disaggregation plots for SA at 0.3 s at the 2,475-year return period; for Victoria and Vancouver, seismic hazard contributions from crustal, interface, and inslab events are distinguished by colors. For the seismic hazard curve and disaggregation plot, SA at 0.3 s is focused upon because the fundamental vibration periods of the UBC-SAWS models (see section Structural Models of Canadian Wooden Houses) are in the range between 0.25 and 0.4 s and the anchor vibration period for deriving the CMS for record selection is set to 0.3 s. The comparisons shown in Figures 3A,B demonstrate the seismic hazard values based on the in-house tool match well with those by the GSC.
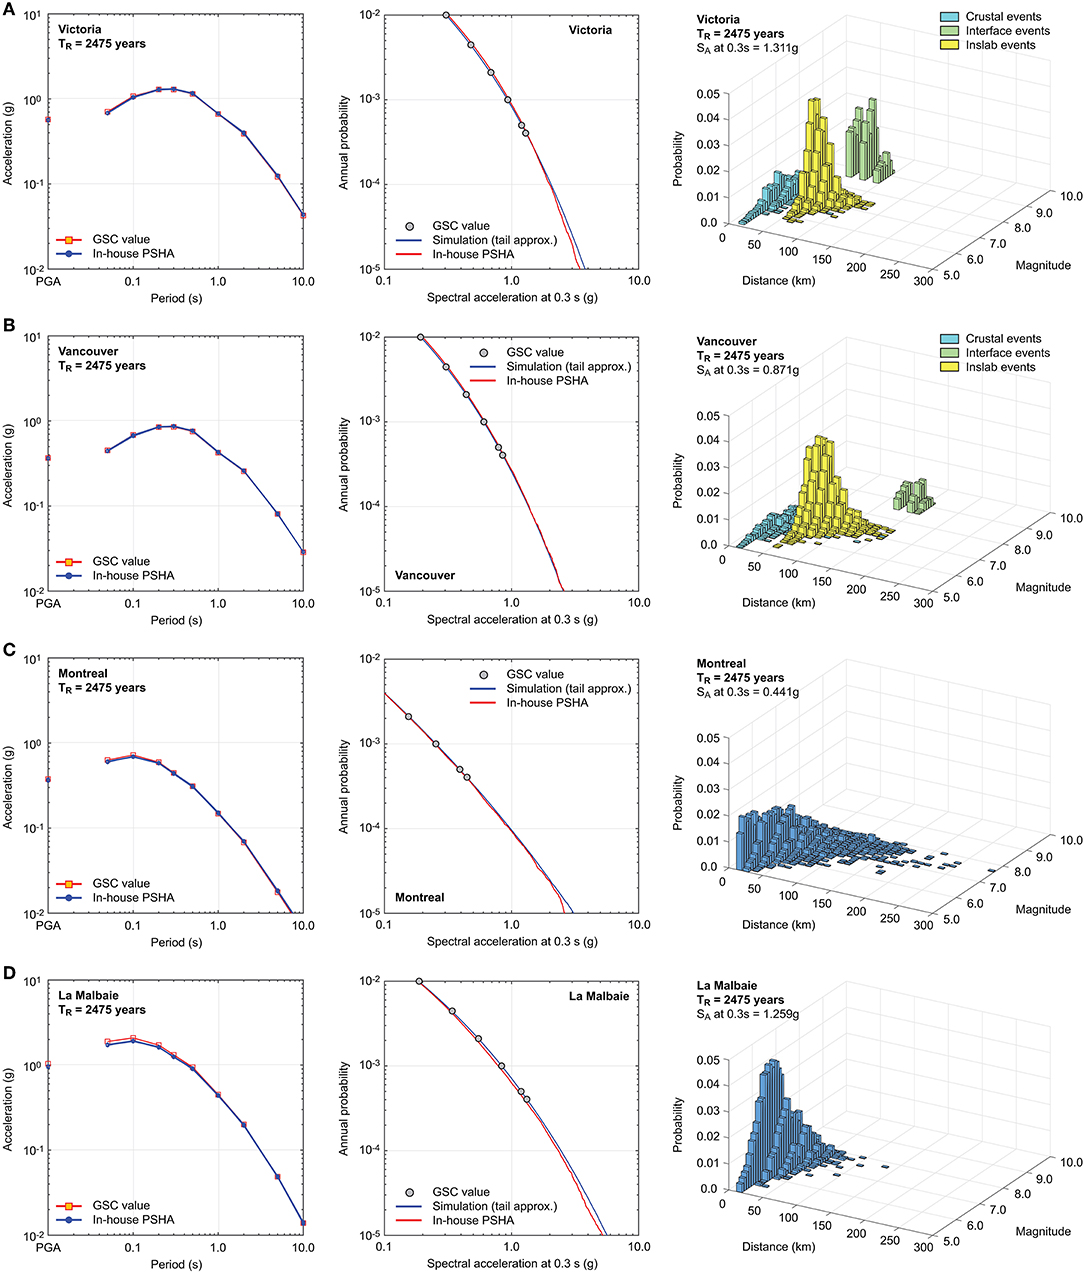
Figure 3. Uniform hazard spectrum at the 2,475-year return period, seismic hazard curve for spectral acceleration at 0.3 s, and seismic disaggregation plot for spectral acceleration at 0.3 s at the 2,475-year return period: (A) Victoria, (B) Vancouver, (C) Montreal, and (D) La Malbaie.
Building upon the good agreement between the GSC's results and the in-house tool, the upper-tail approximation of the GSC's PSHA results (i.e., eight hazard values at different return period levels) is carried out. This is implemented by utilizing probability paper plots of the GSC's hazard estimates and by fitting a probability distribution based on the least squares method. Four candidate models, i.e., lognormal, Gumbel, Frechet, and Weibull, are considered. The horizontal and vertical plotting positions (x and y, respectively) of the lognormal, Gumbel, Frechet, and Weibull distributions are:
where ln represents the natural logarithm, P represents the cumulative probability, and Φ−1(•) represents the inverse standard normal distribution function. To select the most suitable model among the four candidates, the linear correlation coefficient between the GSC's values and the fitted model is used.
By denoting the intercept and slope of the fitted linear line by c1 and c2, respectively, on a probability paper (i.e., y = c1 + c2 × x), simulation formula for the four distributions are given by:
where N(0,1) is a standard normal random number, and U(0,1) is a standard uniform random number.
Figure 4 shows an example of the above-mentioned upper-tail approximation of the GSC's estimates of SA at 0.3 s for Victoria, and the results from the in-house PSHA tool are also included for reference. For the case considered, the Weibull distribution outperforms other distributions based on the linear correlation coefficients indicated in the figure panels. Importantly, the comparisons between the tail-approximated statistical model of SA at 0.3 s and the in-house PSHA results show good match for very high probability levels, indicating that the fitted statistical model can be extrapolated to more extreme ground motion levels. This conclusion is applicable to 63 other cases where detailed PSHA calculations are carried out; the middle figure panels of Figure 3 show such comparisons in the seismic hazard curve space (rather than probability paper) for Victoria, Vancouver, Montreal, and La Malbaie.
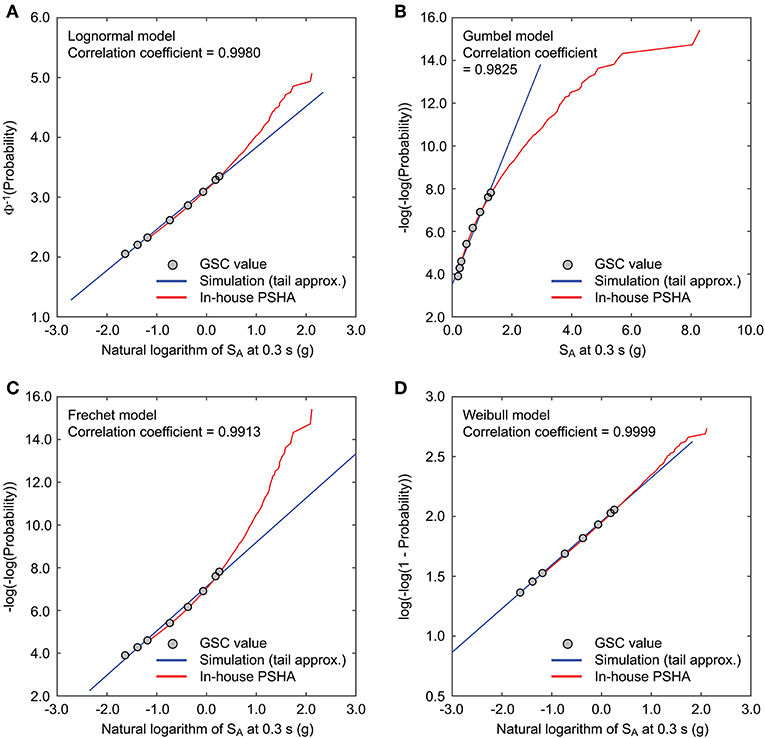
Figure 4. Probability paper plot of PSHA results: (A) lognormal distribution, (B) Gumbel distribution, (C) Frechet distribution, and (D) Weibull distribution.
In Supplementary Materials, the intercept and slope parameters of the best fitting probability distribution for the 1,620 FSA locations are provided; therefore, interested readers can reproduce the results presented in this paper by implementing Equations (4)–(8) and can simulate the annual maximum values of SA at 0.3 s at all population centers across Canada.
Structural Models of Canadian Wooden Houses
The UBC-SAWS model is a structural model of typical wood-frame houses in British Columbia, Canada (White and Ventura, 2006), and is based on the SAWS model (Folz and Filiatrault, 2004) with modifications of model parameters for Canadian wooden house construction. The basic assumptions of the UBC-SAWS model are: (1) floor and roof diaphragms are rigid, (2) shear walls are represented by non-linear springs, hysteresis of which is characterized by the Cyclic Analysis SHEar Walls (CASHEW) model (Folz and Filiatrault, 2001), and (3) bi-directional horizontal seismic excitations are considered but ignoring vertical excitations. The parameters of the UBC-SAWS model are calibrated from static and dynamic tests of wall panels with different configurations and full-scale shake-table tests that were conducted at the University of British Columbia (White and Ventura, 2006). The sheathing materials of the shear wall include horizontal board (shiplap), gypsum wallboard (GWB), plywood, oriented strand board (OSB), and stucco. The analytical results from the UBC-SAWS model showed a good agreement with experimental results for the maximum inter-story drift ratios up to 0.04 (White and Ventura, 2006).
Based on different shear-wall configurations, four types of two-story wood-frame houses are defined in the UBC-SAWS model: (1) House 1 with stucco/engineered OSB/GWB, (2) House 2 with engineered OSB/GWB, (3) House 3 with non-engineered OSB/GWB, and (4) House 4 with horizontal boards/GWB. The term “engineered” for Houses 1 and 2 indicates that hold-downs and blocking of the wall panel are used to increase its seismic resistance and to meet the seismic code requirements. Due to the layout of the house model (Figure 5A), the stiffness along X-axis is smaller than that along Y-axis, and the expected failure mode of the house models is the soft-story collapse of the ground floor level due to larger openings. The fundamental vibration periods along X-axis of Houses 1 to 4 are 0.25, 0.3, 0.35, and 0.4 s, respectively, whereas those along Y-axis are about 0.22 s for all houses (White and Ventura, 2006). In total, sixteen walls, which are represented by springs, are present along X-axis and Y-axis on the ground and first floors. The pushover analysis results of Houses 1 to 4 by using the inverse triangle load distribution are shown in Figure 5B. The base shear ratio is the ratio of the base shear force and the total weight of the house. In terms of pushover curves, House 1 has the highest seismic capacity; Houses 2 and 3 have similar seismic resistance; and House 4 has the lowest seismic capacity. House 1 may be considered to be of upgraded constructions from seismic viewpoints, whereas Houses 2 and 3 may be considered to be typical seismically engineered houses in Canada. On the other hand, House 4 is not applicable to high seismic regions (Pan et al., 2018) and thus may be regarded as not seismically engineered. By considering a range of wood-frame houses having different seismic capacities in seismic fragility and risk analyses, the effects of superior, standard, and poor seismic resistance can be investigated.
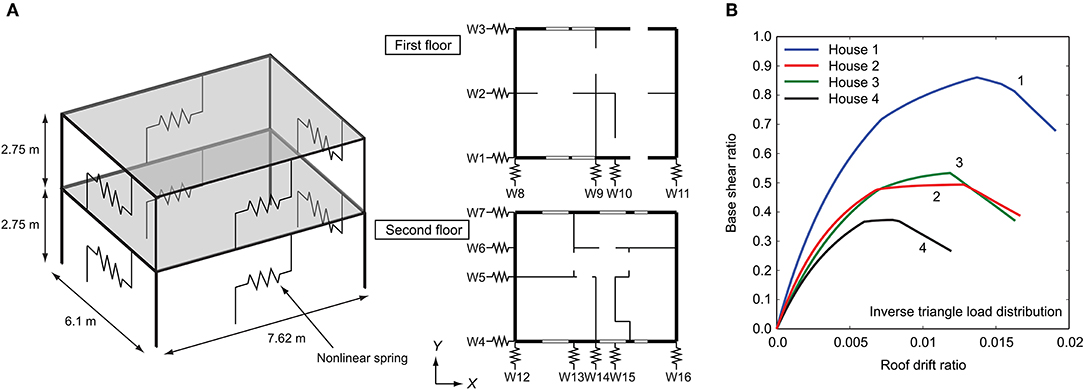
Figure 5. (A) Generic representation of the UBC-SAWS model and (B) pushover curves of the four house models.
Development of Seismic Fragility Functions
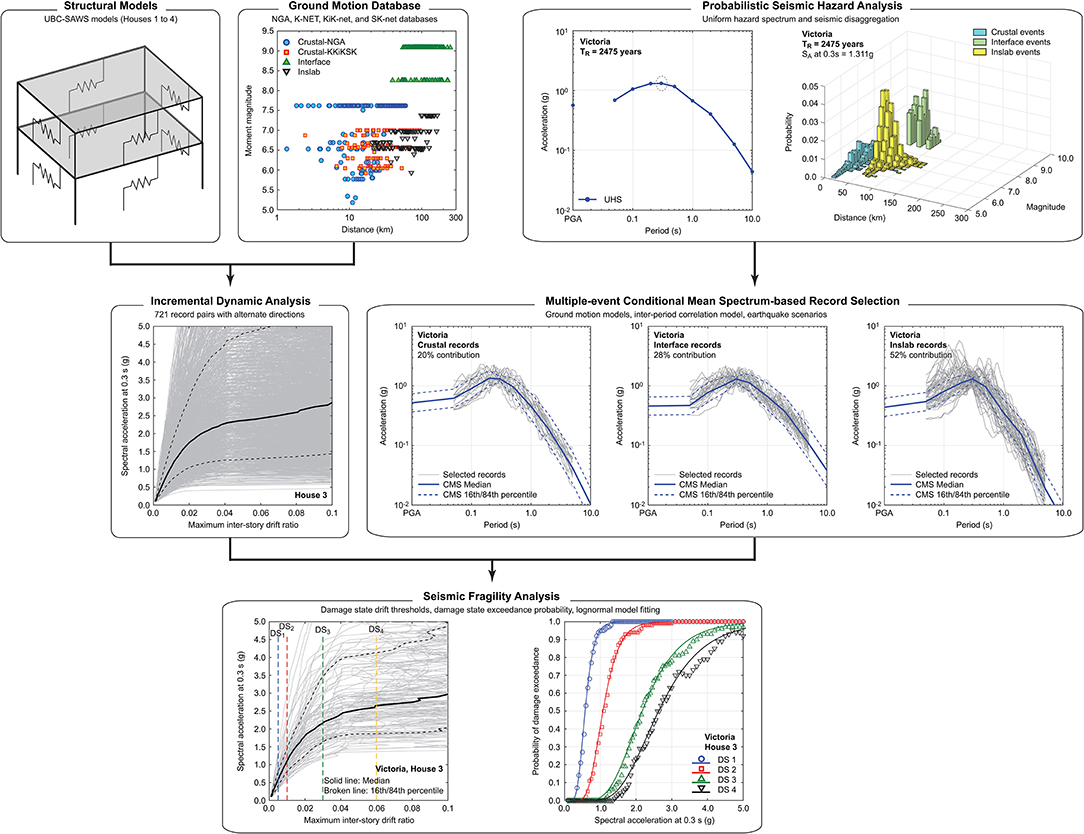
Developing seismic fragility functions based on numerical simulations of non-linear dynamic responses of structural models involves various steps. The main steps are: (1) preparation of strong ground motion record databases that are applicable to the seismic environments, (2) ground motion record selection for a given location by reflecting dominant characteristics of local seismic hazard, (3) non-linear dynamic analysis of the structural model using the selected records, and (4) seismic fragility analysis and modeling by comparing induced seismic demands with specified damage state thresholds and by fitting fragility functions (e.g., Baker, 2015). It is noteworthy that with the aim of developing seismic fragility functions for various sites in Canada, the order of the steps 3 and 4 can be exchanged; i.e., numerous runs of non-linear dynamic analysis of a structural model can be performed for all ground motion records to establish a pooled database of engineering demand parameters, such as maximum inter-story drift ratio, and then a ground motion record selection can be conducted to develop site-specific seismic fragility functions. This is the approach that has been implemented in this study, and is illustrated in Figure 6.
The step 1 is important and requires a special attention for Canada because of its diverse seismic environments; in southwestern British Columbia, three types of earthquakes, i.e., shallow crustal, megathrust interface, and deep inslab, contributed significantly to the hazard values (see Figures 3A,B). To establish a large pool of ground motion records that are originated from different earthquake types, a database for real mainshock-aftershock record sequences that was considered by Tesfamariam and Goda (2015) has been expanded (note: the focus on mainshock-aftershock record sequences is for future investigations and is beyond the scope of the current study). The expanded database of the real mainshock-aftershock records contains: 172 sequences from the PEER-NGA database (Goda and Taylor, 2012), 521 sequences from the Japanese K-NET, KiK-net, and SK-net databases (Goda et al., 2015), and 28 sequences for the 2016 Kumamoto earthquakes from the Japanese K-NET and KiK-net databases (Goda et al., 2016)—in total, there are 721 sequences, in comparison with the 606 sequences as previously considered in Tesfamariam and Goda (2015). The Ground Motion Database panel of Figure 6 shows the magnitude-distance distribution of the newly compiled database by distinguishing earthquake types. Among the 721 sequences, 275, 330, and 116 sequences are classified as shallow crustal, megathrust interface, and deep inslab events, respectively. The interface records that are contained in the database are based on the two major subduction earthquakes in Japan, i.e., Mw8.3 2003 Tokachi earthquake and Mw9.0 2011 Tohoku earthquake. It is also noteworthy that all deep inslab records are from Japan. The issue related to dominant influence of ground motion records from Japan may be mitigated when actual record selection is conducted using the multiple-event CMS method (see below). This is because the target CMS for different earthquake types are derived from the detailed PSHA results and their amplitudes as well as frequency content are indeed based on the current knowledge of regional seismicity and ground motion characteristics that are deemed to be applicable to southwestern British Columbia. Nonetheless, it is important to be cautious about the potential bias due to the fact that ground motion databases are not directly based on those for southwestern British Columbia or Canada.
The step 2 is to carry out numerous runs of non-linear dynamic analysis of the four UBC-SAWS models subjected to all 721 ground motion records (note: although each record sequence contains aftershock ground motions, these are not included in the analyses). To account for the orientation effects of seismic excitations (note: the vibration periods of the UBC-SAWS models along X-axis and Y-axis are different), orientations of two horizontal components of a ground motion record are alternated (i.e., 1,442 simulations, instead of 721). For characterizing the seismic fragility of the wooden houses, IDA is performed (Vamvatsikos and Cornell, 2002; Christovasilis et al., 2009). The anchor vibration period, at which record scaling of input ground motions is carried out, is set to 0.3 s based on the fundamental vibration periods of the UBC-SAWS models (section Structural Models of Canadian Wooden Houses). Main reasons for adopting SA at 0.3 s as seismic intensity measure for IDA include that it is considered in the current and past national seismic hazard maps and that a common measure for the four structural models facilitates the direct comparisons of the developed seismic fragility models. In IDA, input ground motions are scaled from SA at 0.3 s = 0.1 g to 8.0 g (in total, 109 values within the range). In total, 157,178 (= 721 × 2 × 109) runs of non-linear dynamic analysis are conducted for each of the four UBC-SAWS models. The engineering demand parameter that is adopted for quantifying the seismic demand effect is the maximum inter-story drift ratio at the ground floor level; the choice of the ground-floor response can be justified because of soft-story behavior of the structural models. The Incremental Dynamic Analysis panel of Figure 6 shows IDA results for House 3, demonstrating significant variability of the structural responses due to input ground motion records.
The step 3 is to perform the record selection using the multiple-event CMS method on site-specific basis. This requires the detailed information from PSHA. To reflect different scenario characteristics due to crustal, interface, and inslab earthquakes in southwestern British Columbia, three target CMS are developed using the ground motion models used for PSHA (Atkinson and Adams, 2013), dominant earthquake scenarios from seismic disaggregation analysis, and the inter-period correlation model (Baker and Cornell, 2006). For sites where seismic hazard contributions due to subduction events are negligible (i.e., locations in western Canada far from the coast and locations in central and eastern Canada), a target CMS for shallow crustal events alone is considered. The return period for the target CMS is set to 2,475 years. Subsequently, N record pairs, selected from the developed ground motion database in the step 1, are selected by matching response spectra of the scaled records with the target CMS, permitting the record amplitude scaling at the anchor vibration period up to a factor of 5 (i.e., excessive record scaling is prohibited). The goodness of fit of candidate ground motion records is evaluated by computing the sum of differences of the response spectral ordinates and the target response spectrum over the vibration period range between 0.1 and 5.0 s in logarithmic scale, and records that have the smaller total logarithmic differences are selected. For sites with significant seismic hazard contributions from the subduction events, N is set to 50, otherwise N is set to 30. When the multiple target CMS for different earthquake types are considered, the numbers of record pairs to be selected from different earthquake types are determined in proportion to the relative seismic hazard contributions.
The above-mentioned procedure is illustrated in the Multiple-event Conditional Mean Spectrum-based Record Selection panel of Figure 6 for Victoria. As seen in Figure 3A, three earthquake types have significant contributions to the overall seismic hazard; thus, multiple target CMS need to be developed. An important observation is that response spectral shapes of the three CMS are different, particularly for interface events having richer long-period spectral content, compared with the other two. The numbers of record pairs to be selected from respective earthquake types are determined based on the seismic disaggregation results as 10, 14, and 26 for crustal, interface, and inslab events, respectively (they sum to N = 50). The selected ground motions have similar response spectra (when scaled) with the target CMS.
Finally, in the step 4, seismic fragility functions are developed. The IDA results for the selected record pairs in the step 3 are used to capture record-to-record variability of non-linear responses of the structural models. To evaluate the extent of seismic damage for a given seismic response level, four damage states are considered: slight, moderate, extensive, and collapse. The damage thresholds for slight and moderate damage states (DS1 and DS2, respectively) for the four UBC-SAWS models are set to be identical: 0.005 and 0.01 in terms of the maximum inter-story drift ratio. On the other hand, the damage thresholds for extensive and collapse damage states (DS3 and DS4, respectively) are varied, depending on the UBC-SAWS models: for House 1, the maximum inter-story drift ratio thresholds for DS3 and DS4 are set to 0.035 and 0.07, respectively; for Houses 2 and 3, the DS3 and DS4 thresholds are set to 0.03 and 0.06, respectively; and for House 4, the DS3 and DS4 thresholds are set to 0.025 and 0.05, respectively. The damage thresholds for DS4 are chosen based on White and Ventura (2006), Christovasilis et al. (2009), and Pan et al. (2018) and reflect the pushover curves obtained for the four UBC-SAWS models (see Figure 5B), whereas those for DS3 are set to 50% of DS4. By counting the number of cases where seismic demand exceeds a certain damage threshold for different seismic intensity levels and repeating this procedure for different damage states, seismic fragility data points can be obtained. Subsequently, a lognormal model is fitted to the seismic fragility data points based on the maximum likelihood method (Baker, 2015):
where P(DS ≥ ds|SA) is the probability of DS exceeding a particular damage state ds, Φ(•) is the standard normal distribution function, and α and β are the model parameters of the seismic fragility function.
In the Seismic Fragility Analysis panel of Figure 6, the preceding analysis is illustrated. The left-hand-side figure shows the IDA results of the selected ground motion records together with the damage thresholds for DS1 to DS4. In the right-hand-side figure, seismic fragility data points and fitted lognormal fragility models for the four damage states are illustrated. By taking the differences of the exceedance probabilities for the adjacent damage states, the probability of experiencing a particular damage state can be calculated. Moreover, by considering that the damage/loss ratio for a given damage state is uncertain and by assigning representative damage ratios and associated variability, one can simulate the damage/loss ratio for each seismic event. In this study, the damage/loss ratio for a given damage state is assumed to be lognormally distributed. The central damage/loss ratios for DS1 to DS4 are assigned as 0.05, 0.2, 0.5, and 1.0, respectively, with respect to the full replacement of the building, whereas the coefficient of variations of the damage/loss ratios for DS1 to DS4 are assigned as 0.3, 0.3, 0.3, and 0.5, respectively.
Seismic Risk Integration
The seismic risk evaluation involves integration of seismic hazard and fragility for a house type at a given location. This is performed based on Monte Carlo methods as follows. The total simulation number NR is selected (e.g., NR = 5,000,000). The NR samples of the annual maximum SA at 0.3 s are simulated from the suitable statistical distribution (section Upper-Tail Approximation of Geological Survey of Canada's Hazard Results). To account for situations where different site conditions from the site class C in the 2015 NBCC, which is represented by the average shear-wave velocity in the upper 30 m (Vs30) of 450 m/s, site amplification factors as specified in the 2015 NBCC (Humar, 2015) are applied to the simulated values of SA at 0.3 s. For given values of SA at 0.3 s, probabilities of experiencing particular damage states are evaluated using seismic fragility functions (section Development of Seismic Fragility Functions); by sampling a standard uniform random number and comparing it with the calculated damage state probabilities, the corresponding damage state can be determined for each of the NR samples. Subsequently, the extent of structural damage can be sampled from the assumed lognormal distribution for the damage/loss ratio. The preceding simulation procedure generates NR samples of the damage/loss ratio, each corresponding to the annual maximum seismic event, and thus they can be used to develop exceedance probability curves and also to calculate the related risk metrics, such as annual expected damage/loss. It is important to highlight that the above simulation is very fast, for instance, less than a minute per location for NR = 5,000,000. Therefore, the simulations can be repeated for numerous locations to produce nationwide seismic risk maps, displaying different risk metrics for seismic risk management purposes.
Seismic Fragility Analysis of Canadian Wooden Houses
This section presents the main results of the seismic fragility analysis for wooden houses in Canada, represented by the four UBC-SAWS models, following the procedures described in section Development of Seismic Fragility Functions. Four locations, namely, Victoria, Vancouver, Montreal, and La Malbaie, are focused upon. The detailed PSHA results for the four locations are presented in Figure 3. Note that Victoria and Vancouver are located in active subduction regions of southwestern Canada; hence, influenced by different earthquake types. On the other hand, Montreal is located in the Western Quebec region, while La Malbaie is near the very active Charlevoix region at the river mouth of St. Lawrence.
The CMS-based record selection method requires the determination of the target CMS; for Victoria and Vancouver, three target CMS are defined, while for Montreal and La Malbaie, a single CMS is obtained. The CMS for the four locations are shown in Figure 7. In the figure, the median as well as 16th/84th percentile CMS are overlaid over response spectra of the selected ground motion records. The matching of the response spectra of the selected records with the target is satisfactory. The results shown in Figure 7 demonstrate that the consideration of different earthquake types is indeed important, allowing to capture realistic response spectral shapes and record-to-record variability with respect to the target.
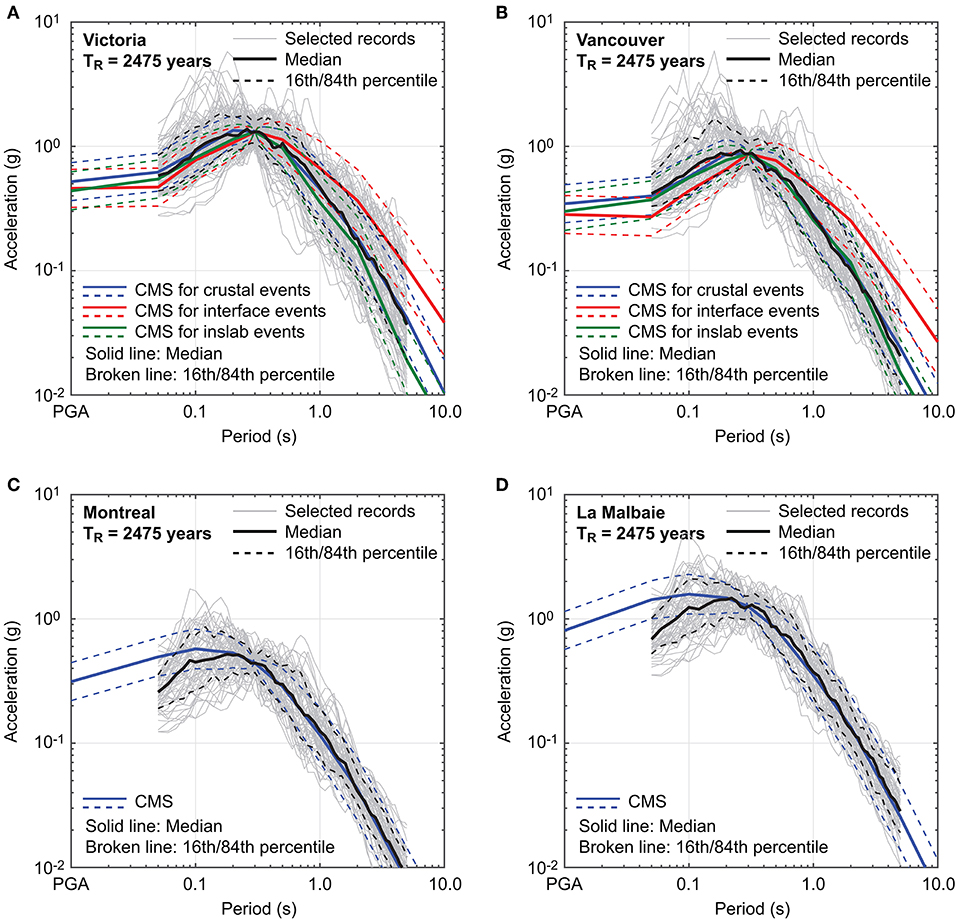
Figure 7. Conditional mean spectrum-based record selection: (A) Victoria, (B) Vancouver, (C) Montreal, and (D) La Malbaie.
Using the selected ground motion records, IDA results for a house model can be analyzed to obtain seismic fragility data points for developing seismic fragility functions corresponding to DS1 to DS4. Taking House 3 as an example, IDA plots and the corresponding seismic fragility functions for Victoria, Vancouver, Montreal, and La Malbaie are shown in Figures 8, 9, respectively. From Figure 8, it can be observed that the median curves for Victoria, Vancouver, and La Malbaie are positioned lower (i.e., greater fragility) than that for Montreal. This can be explained by the dominant earthquake scenarios, particularly from large magnitude earthquakes, shown in Figure 3 and by the response spectral shapes of the selected records shown in Figure 7, in interaction with elongated vibration periods of the structural models due to their non-linear behavior. The hazard for Victoria is strongly influenced by megathrust subduction earthquakes of Mw8 to Mw9; the hazard for Vancouver is more influenced by deep inslab events (thus less long-period spectral content compared with megathrust interface events); the hazard for La Malbaie is dominated by Mw7-class events at short distances (originating from the Charlevoix seismic zone), and in contrast, the hazard for Montreal is dominated by Mw6-class local events from the Western Quebec seismic zone. The comparisons of the developed seismic fragility functions for the four locations indicate that the differences that are revealed in the IDA results can be translated into the differences in the seismic fragility functions for DS3 and DS4, and hence, seismic fragility functions for Victoria, Vancouver, and La Malbaie are positioned on the left-hand-side of those for Montreal. Note that seismic fragility functions for DS1 and DS2 are almost identical for the four locations because at these damage levels, the structural model behaves in a nearly linear-elastic manner.
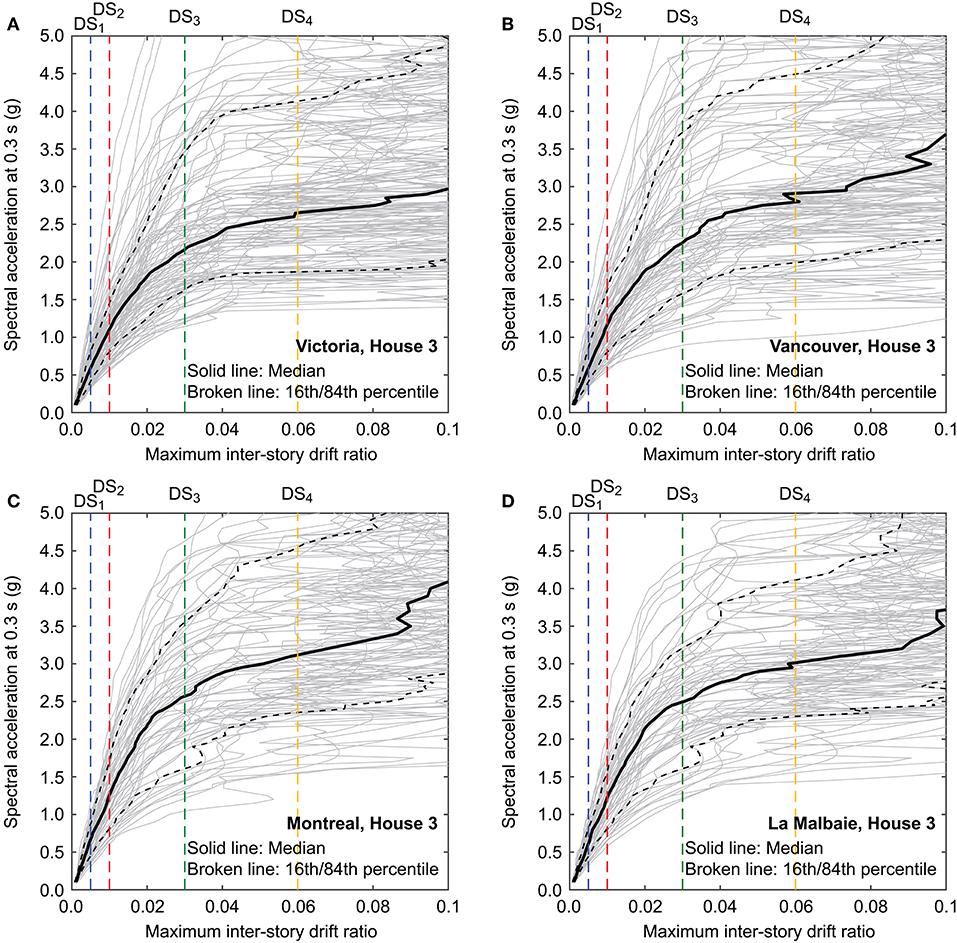
Figure 8. Incremental dynamic analysis results for House 3: (A) Victoria, (B) Vancouver, (C) Montreal, and (D) La Malbaie.
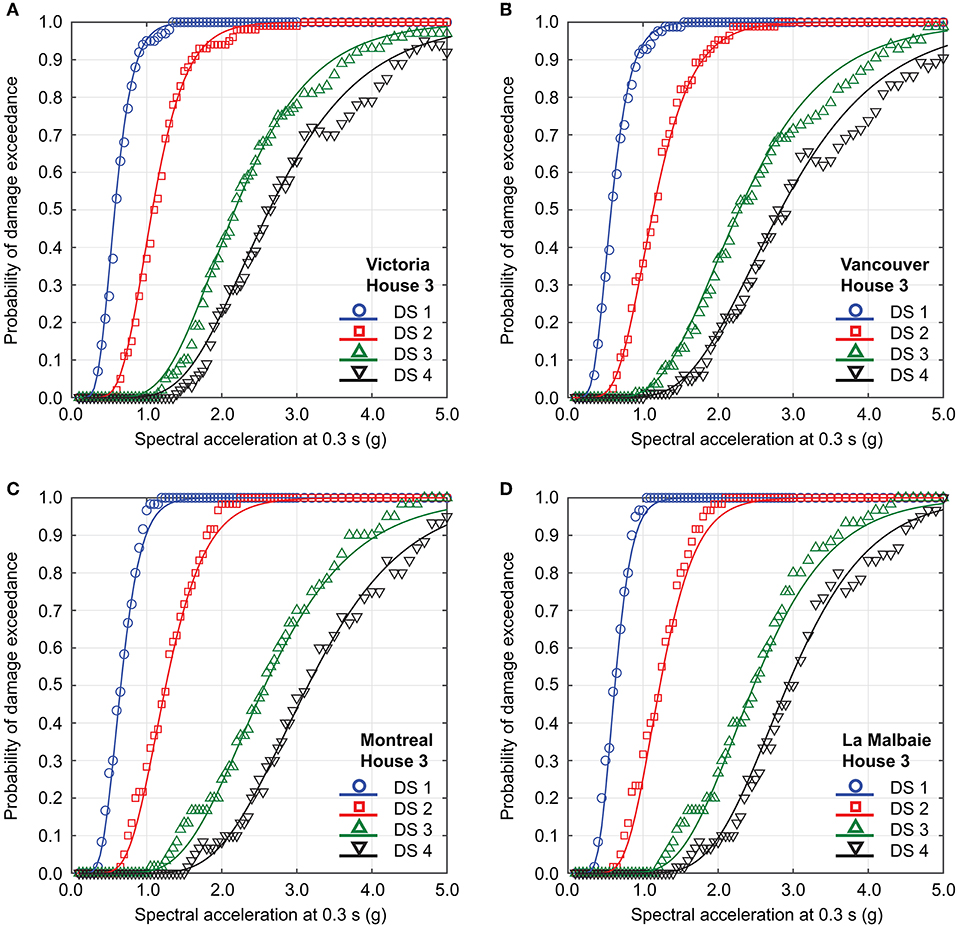
Figure 9. Seismic fragility functions for House 3: (A) Victoria, (B) Vancouver, (C) Montreal, and (D) La Malbaie.
To examine the influences of local seismicity and selected records on the seismic vulnerability assessments, collapse seismic fragility functions for the eight major cities (Figure 2) are compared in Figure 10 for the four UBC-SAWS models. From House 4 to House 1 (i.e., increasing seismic resistance), groups of seismic fragility functions shift toward left (i.e., greater fragility). For a given house type, seismic fragility functions for Victoria are positioned leftmost (highest seismic hazard among the eight locations), while those for Toronto are positioned rightmost (second lowest hazard among the eight locations after Calgary). The reversed order of the fragility functions for Toronto and Calgary, although their differences are relatively small, is related to the response spectral shapes of the target CMS, which are in turn affected by the ground motion models used for western and eastern Canada (note: for the same earthquake scenario, ground motion models for eastern Canada show more rapid decay of response spectra than those for western Canada). Although detailed results for 56 other locations where PSHA results are available are not presented in this section due to space limitations, the observations that are made for the eight major cities are generally applicable. The parameters α and β for these locations for all four UBC-SAWS models are available in Supplementary Materials.
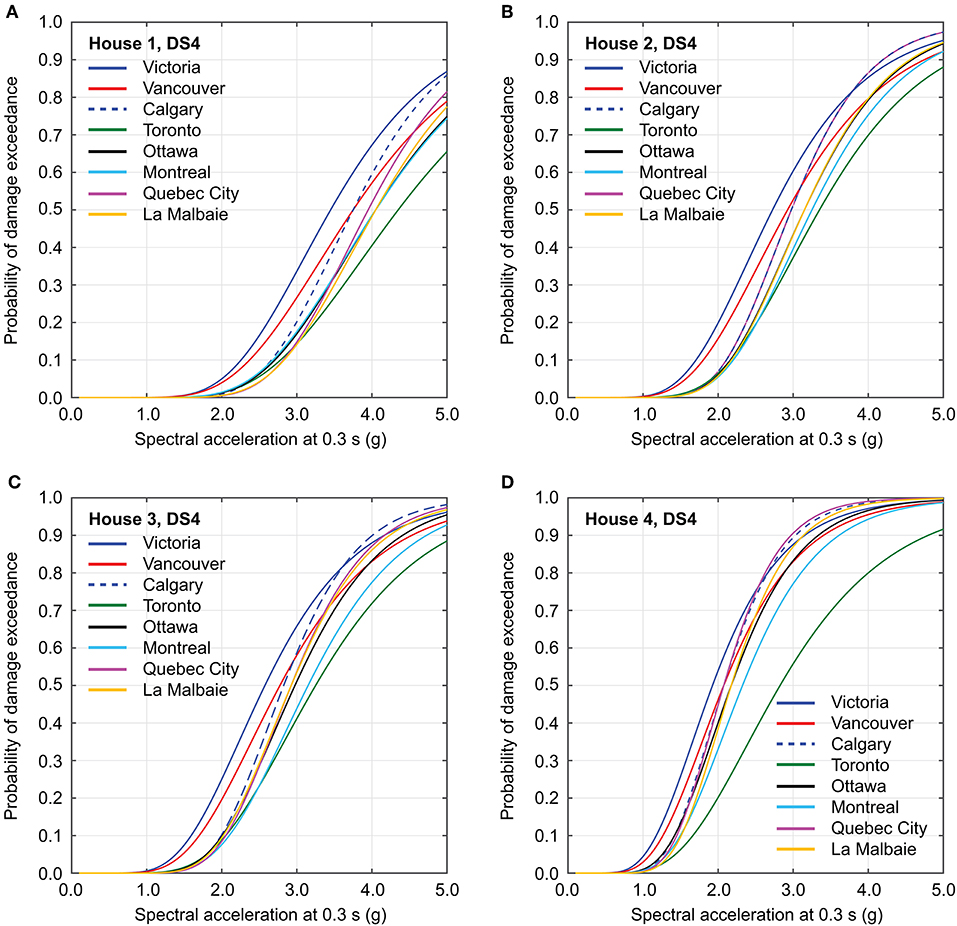
Figure 10. Seismic fragility functions for the damage state 4 (collapse) for eight major cities: (A) House 1, (B) House 2, (C) House 3, and (D) House 4.
Seismic Risk Assessments of Canadian Wooden Houses
The main aim of this section is to present quantitative seismic risk analysis results for the typical wood-frame houses in Canada by adopting the Monte Carlo methods described in section Seismic Risk Integration. In section Exceedance Probability Curves and Seismic Risk Metrics for Single Locations, results for single locations, focusing upon the eight major cities, are presented, whereas in section Seismic Risk Maps for Western and Eastern Canada, the analyses are applied to the 1,620 FSA locations and various seismic risk maps are produced to discuss their use in the context of earthquake risk management.
Exceedance Probability Curves and Seismic Risk Metrics for Single Locations
An exceedance probability curve, expressed in terms of seismic damage ratio, provides rich information of the resulting seismic loss due to anticipated seismicity surrounding a building of interest. The benefit of performing probabilistic seismic risk analysis, in addition to conventional PSHA, is that the main variable is expressed in terms of more practical variable, such as damage/loss ratio, and hence the result is more relevant to seismic risk management. One of the most fundamental metrics that can be computed from the exceedance probability curve is the annual expected damage ratio. This quantity forms the basis for earthquake insurance pure premium as full insurance case (note: when an earthquake insurance policy is specified, the damage ratio needs to be adjusted for deductible, con-insurance factor, and limit; Yoshikawa and Goda, 2014). Other common metrics that can be derived from the exceedance probability curve are value at risk, which is identical to a fractile of the damage ratio corresponding to a chosen probability level, and probability of exceeding a particular damage ratio level. The two kinds of metrics view a seismic risk distribution from a fixed probability or a fixed consequence level, and both are useful for seismic risk management.
Figure 11 shows damage-ratio exceedance probability curves for the four house models for Victoria, Vancouver, Montreal, and La Malbaie. The site condition is the GSC's reference of Vs30 = 450 m/s. The number of simulations is set to NR = 108. The results clearly show the effects of seismic resistance (i.e., Houses 1 to 4) as well as seismic characteristics (i.e., locations). For a given location, the exceedance probability curve for House 4 precedes, followed by those for House 3, House 2, and House 1 in this order; this is consistent with the pushover curves shown in Figure 5B and the seismic fragility functions shown in Figure 10. Regarding the locations, the exceedance probability curves (for the same analysis set-up) can be ordered based on seismic hazard levels (see Figure 3).
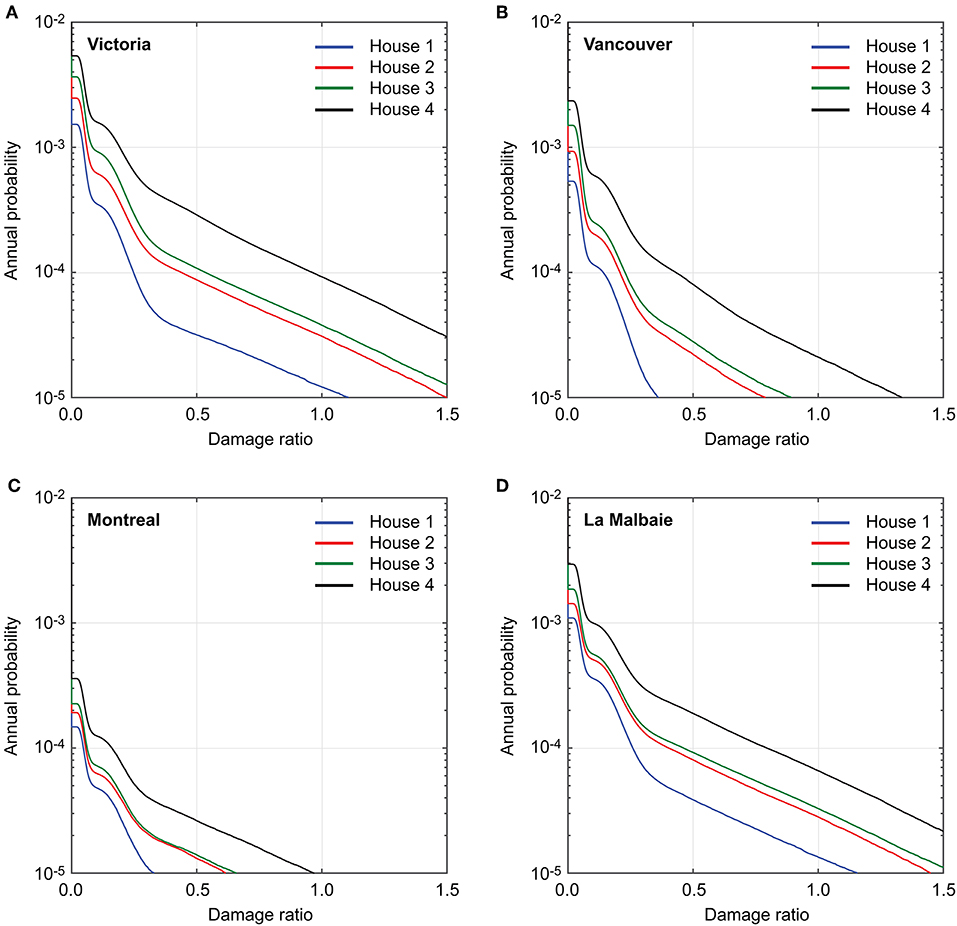
Figure 11. Exceedance probability curves in terms of damage ratio for Houses 1 to 4: (A) Victoria, (B) Vancouver, (C) Montreal, and (D) La Malbaie.
To inspect the key risk metrics for the eight major cities under different site conditions, the annual expected damage ratio and damage occurrence probability for the four houses are computed by considering Vs30 = 450 m/s (site class C) and Vs30 = 250 m/s (site class D), and the results are summarized in Table 1. The results shown in Table 1 confirm that the previous observations made for Figure 11 are applicable to all eight locations. The considerations of the soft site conditions generally lead to increases in annual expected damage ratio and damage occurrence probability. The effects of the site conditions depend on seismic characteristics at a location of interest, and are influenced by the ground motion models used for different regions and site amplification factors adopted in this study (i.e., those indicated in Humar, 2015, which incorporate the site response de-amplification for soft soils of site class D when peak ground acceleration is >0.5 g). The results are also affected by the slope of the seismic hazard curve; the hazard curves for eastern sites are generally flatter than those for western sites (see Figure 3). The complex interplay of various factors determine the effects of site conditions on the seismic risk analysis results.
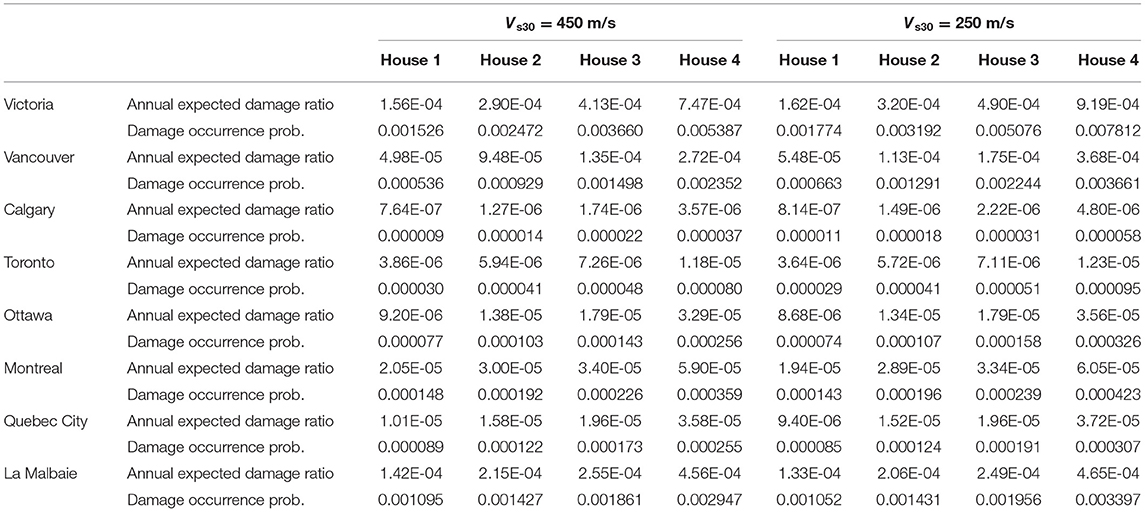
Table 1. Annual expected damage ratio and damage occurrence probability for the four house models located at two site conditions corresponding to Vs30 = 450 m/s and Vs30 = 250 m/s.
To put the calculated annual expected damage ratios into practical context, it is useful to compare them with typical earthquake insurance rates around the world (NLIRO, 2008; OECD, 2008). It is noteworthy that since insurance premiums usually include not only pure premiums (which is equivalent to the annual expected damage ratio when full insurance contract is considered) but also risk premium (i.e., overcharges) and transaction fees, the direct comparison is not possible. For instance, in California, the premium rates range from 0.00036 to 0.0090, depending on zip code, structural type, built year, and number of stories, while in Japan, the rates range from 0.0005 to 0.00313, depending on structural type and geographical region. The calculated annual damage ratios for the eight Canadian cities range approximately from 10−6 to 10−3 (Table 1). Broadly speaking, the calculated annual damage ratios are compatible with (but certainly less than) the earthquake insurance rates in active seismic regions around the world.
Seismic Risk Maps for Western and Eastern Canada
The seismic risk assessments that are carried out for the eight major cities in section Exceedance Probability Curves and Seismic Risk Metrics for Single Locations are expanded to the 1,620 FSA locations. To reflect site conditions of the FSA locations, Vs30 values for these locations are obtained from the USGS's Vs30 database (Wald and Allen, 2007) and are applied to individual locations. In this section, two kinds of nationwide seismic risk maps are considered: one for the annual expected damage ratio, while the other for the 50-year probability of experiencing a damage ratio of 0.1, 0.3, or 0.5. A 50-year period is a suitable duration for seismic risk concerns by house owners. The results are shown by focusing upon British Columbia and Ontario-Quebec. The computed values of these seismic risk metrics for the FSA locations are provided in Supplementary Materials.
Figure 12 shows annual expected damage ratio maps for western and eastern Canada for the four house models. The annual expected damage ratio is color-coded (see the legend shown at the top of the maps). The risk maps indicate the effects of seismic resistance clearly; more reddish colors appear as the seismic capacities of the houses are decreased. In western Canada, higher risks are concentrated near Puget Sound, where Victoria and Vancouver are located, and as the locations become far from the Pacific coast, seismic risk levels decrease significantly. In eastern Canada, risk levels around Toronto-Niagara Falls are elevated (light blue to green) compared to the surrounding areas (blue), and the Western Quebec region (which contains Ottawa and Montreal) shows elevated risk levels (light blue to green). Near the river mouth of St. Lawrence, high risk levels (orange) are observed due to the proximity to the Charlevoix seismic zone, and are comparable to those seen near Vancouver. Inspecting the seismic risk maps that are generated consistently for the national scale is particularly valuable in prioritizing disaster risk reduction actions, and informing consistent risk-based policy across Canada.
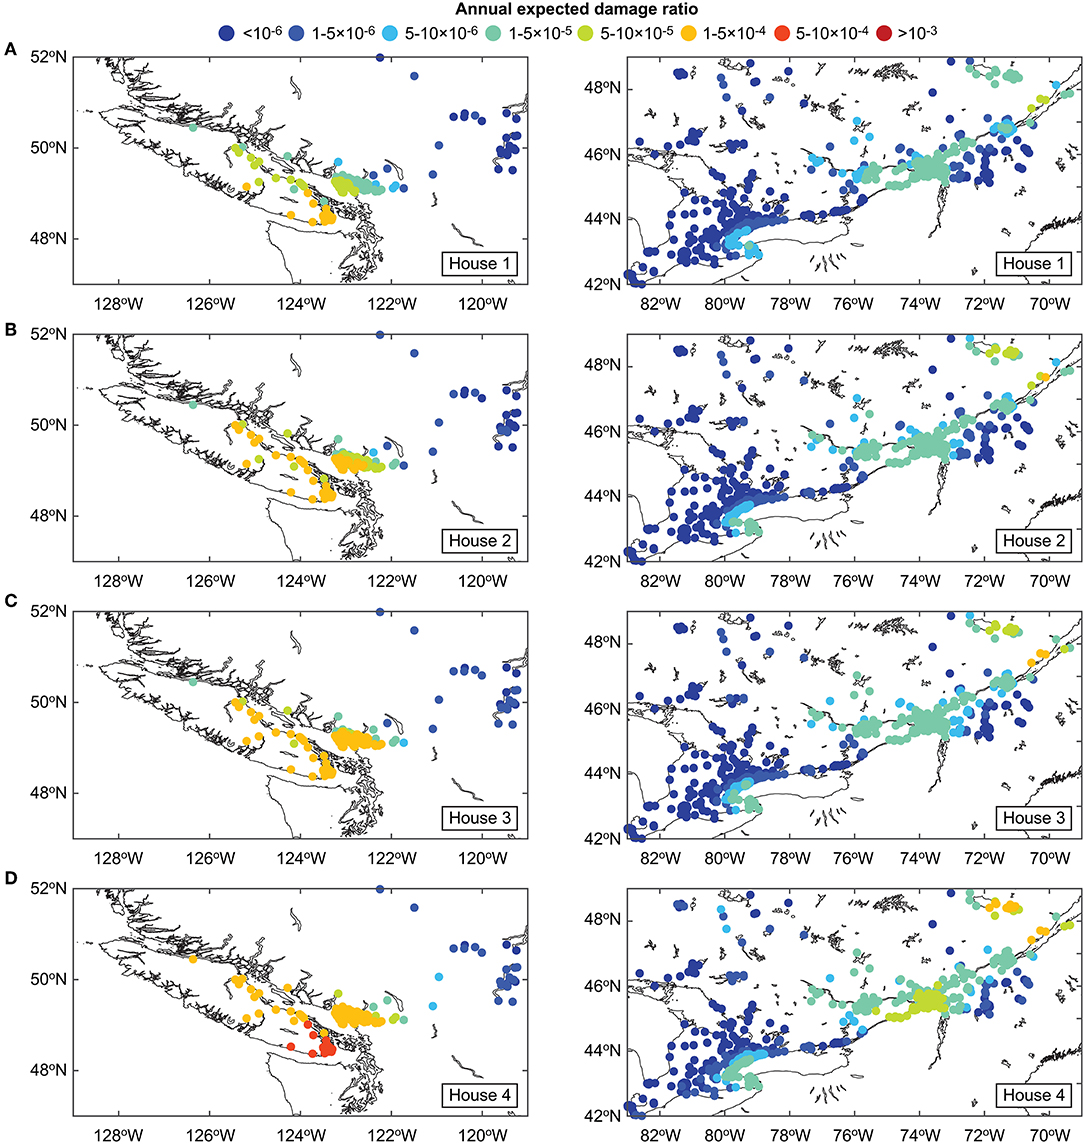
Figure 12. Seismic risk maps in terms of annual expected damage ratio for western and eastern Canada: (A) House 1, (B) House 2, (C) House 3, and (D) House 4.
To provide different perspectives on existing seismic risks on Canadian households, the 50-year probability of experiencing a damage ratio of 0.1 is calculated for the FSA locations and is mapped in Figure 13. Although risk metrics are different for Figures 12, 13, the observations that can be drawn from these two figures are similar with regard to relative seismic risks levels for different house types and different locations. The maps identify the Puget Sound region and the Charlevoix region as hot spots for seismic risk. To further inspect how the risk levels change with increase of the damage ratio threshold level, seismic risk maps that display the 50-year probability of experiencing a damage ratio of 0.1, 0.3, or 0.5 for House 3 are shown in Figure 14. With the increase in the damage ratio threshold, the 50-year probability of experiencing earthquake damage decreases. For the considered thresholds and the house model, chances of sustaining extensive damage in southwestern British Columbia are significantly higher than the majority of locations in Ontario and Quebec. Such risk maps with different damage thresholds can be used to capture the upper-tail behavior of the exceedance probability curves.
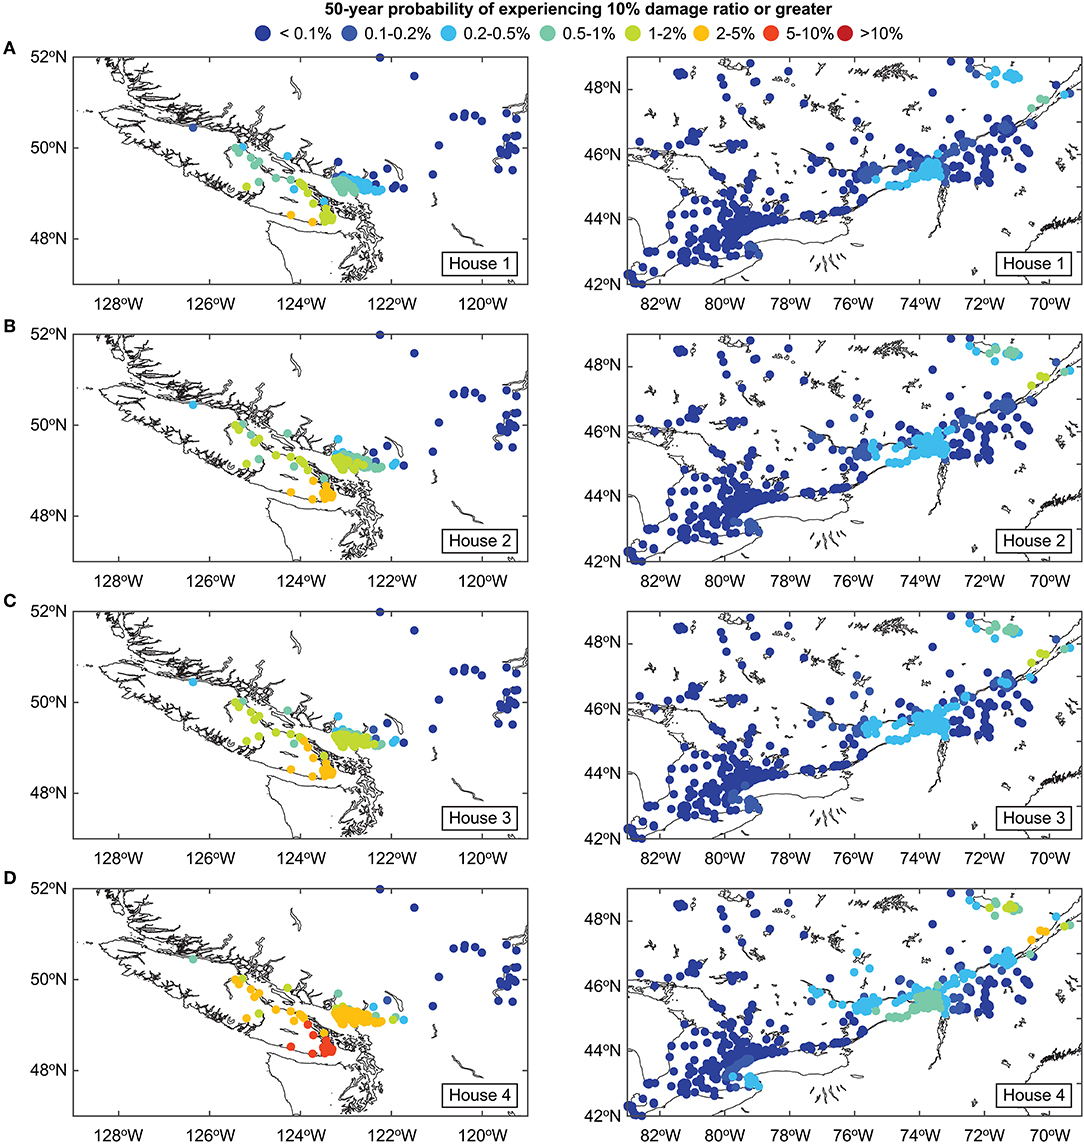
Figure 13. Seismic risk maps in terms of 50-year probability of experiencing 0.1 damage ratio or greater for western and eastern Canada: (A) House 1, (B) House 2, (C) House 3, and (D) House 4.
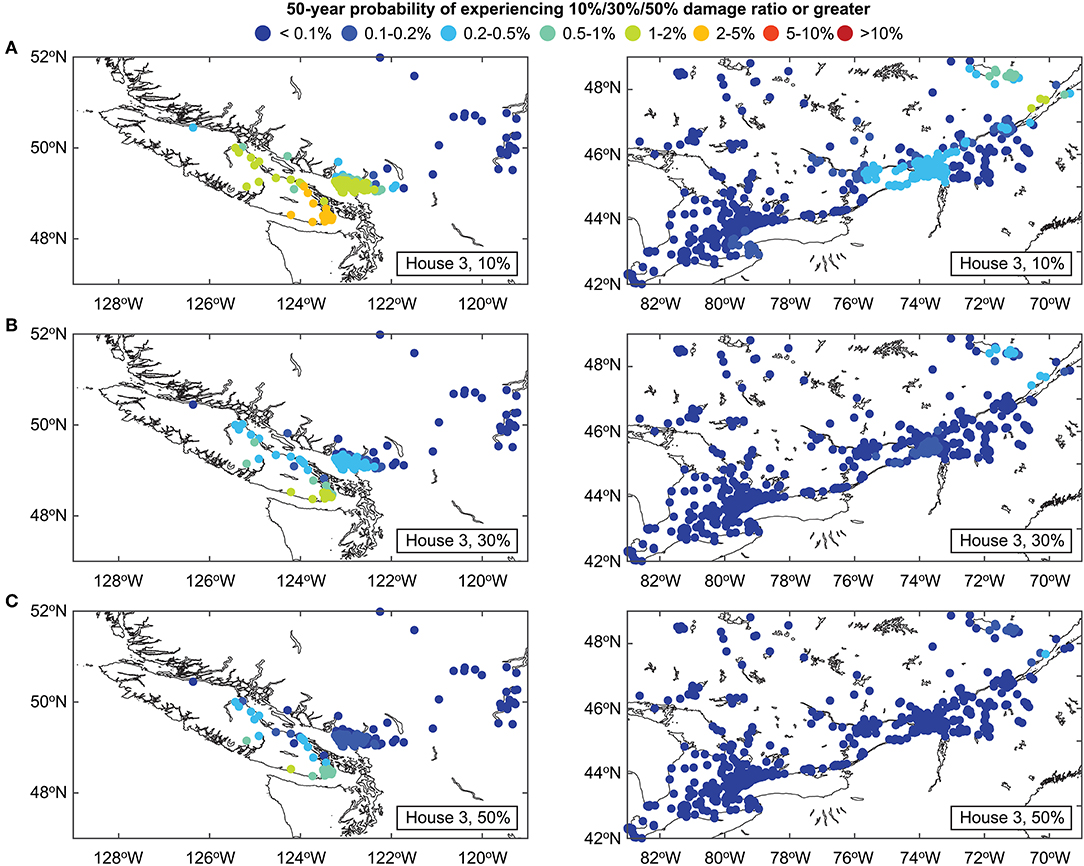
Figure 14. Seismic risk maps in terms of 50-year probability of experiencing certain damage thresholds for House 3 in western and eastern Canada: (A) 0.1 damage ratio or greater, (B) 0.3 damage ratio or greater, and (C) 0.5 damage ratio or greater.
Conclusions
This study developed a nationwide earthquake risk model for wood-frame houses in Canada by utilizing national seismic hazard information provided by the GSC and by developing seismic fragility functions that are applicable to a broad range of wooden houses having different seismic capacities and seismic environments, and applied it to generate exceedance probability curves of seismic damage ratio and seismic risk maps of key risk metrics. To enable such investigations, the in-house PSHA tool for Canada was developed and used to verify the accuracy of the upper-tail approximation of the annual maximum seismic intensity measure. In addition, the in-house PSHA tool served to generate detailed seismic disaggregation results, which facilitated the implementation of the multiple-event CMS-based record selection for developing seismic fragility functions via IDA. The significance of this study is that such a nationwide earthquake risk model for wood-frame houses in Canada has been created for the first time and it offers a transparent method for quantitative seismic risk assessments across Canada. To allow interested readers to reproduce the results presented in this study, model parameters for the tail-approximated seismic hazard model and assigned seismic fragility functions for the 1,620 FSA locations are provided in Supplementary Materials.
The seismic fragility analysis results for the four house models demonstrated that the structural responses, as represented by IDA curves, and the resulting seismic fragility functions are influenced by the seismic environments of the locations. Generally speaking, seismic fragility at sites where large magnitude events are dominant is severer than sites where small-to-moderate magnitude events are dominant. The non-linear behavior of the structural models is more affected by the rich spectral content in the long vibration period range, which is associated with larger magnitudes. Therefore, it is important to reflect key seismic characteristics of influential scenarios contributing to the overall seismic hazard in seismic vulnerability assessments.
The seismic risk analysis results for specific locations and for numerous locations across Canada showed that the nationwide earthquake risk model calculates the annual expected damage ratios (in the range of 10−6 to 10−3) that are generally compatible with the earthquake insurance rates in active seismic regions around the world. Importantly, inspecting the seismic risk maps that are generated systematically at the national scale is valuable in prioritizing disaster risk reduction actions and informing consistent risk-based management strategies across Canada.
As final remarks, it is important to mention the limitations of the developed earthquake risk model. Since the surrogate statistical model for the seismic hazard parameter is based on tail approximation, it may not be accurate for the very rare cases. In such cases, a full detailed PSHA result needs to be generated and used for seismic risk integration. The residential house models considered in this study do not capture all possible details of the existing wood-frame building stock in Canada. There are numerous variants in the house layout/geometry, material characteristics, and structural details, such as wall-to-frame connections and opening configurations, and ideally the structural parameters should be treated as random variables. Consequently, the results of this study with regard to possible variations of seismic resistance of Canadian houses should be interpreted as rough indications of such effects.
Data Availability Statement
All datasets generated for this study are included in the manuscript/Supplementary Files.
Author Contributions
The author confirms being the sole contributor of this work and has approved it for publication.
Funding
The work was supported by the Canada Research Chair program (950-232015) and the NSERC Discovery Grant (RGPIN-2019-05898).
Conflict of Interest
The author declares that the research was conducted in the absence of any commercial or financial relationships that could be construed as a potential conflict of interest.
Supplementary Material
The Supplementary Material for this article can be found online at: https://www.frontiersin.org/articles/10.3389/fbuil.2019.00128/full#supplementary-material
Table S1. The “PSHA-64sites” sheet contains results related to the 64 sites where detailed PSHA calculations are carried out. The table includes: (i) 2,475-year seismic hazard values (10 seismic hazard parameters) calculated using the in-house tool (columns F to O) and obtained from the GSC (columns P to Y), and (ii) seismic fragility function parameters for the four damage states (DS1 to DS4) for House 1 (columns Z to AG), House 2 (columns AH to AO), House 3 (columns AP to AW), and House 4 (columns AX to BE). For the lognormal fragility equation [see Equation (9) in the main text]. The “FSA-1620sites” sheet contains results related to the 1,620 FSA sites where quantitative seismic risk assessments are conducted. The table includes: (i) information of the FSA (province name, first three postal code, geographical coordinates, population, area, etc.), (ii) 2,475-year seismic hazard values (10 seismic hazard parameters) obtained from the GSC (columns K to T), (iii) the PSHA location index assigned to the FSA location (out of 64) (column U), (iv) tail approximation results of the GSC's seismic hazard value for SA at 0.3 s (columns V to Y), (v) USGS's Vs30 estimate (column Z), and (vi) seismic risk metrics (annual expected damage ratio and annul probabilities of experiencing 0.1, 0.3, and 0.5 damage ratios or greater) for House 1 (columns AA to AD), House 2 (columns AE to AH), House 3 (columns AI to AL), and House 4 (columns AM to AP). For the tail approximation equation, c1 and c2 in Equations (5)–(8) can be obtained by solving: p1 = –c1/c2 and p2 = 1/c2 for the lognormal distribution, p1 = –c1/c2 and p2 = c2 for the Gumbel distribution, and p1 = exp(–c1/c2) and p2 = c2 for the Frechet and Weibull distributions.
References
Atkinson, G. M., and Adams, J. (2013). Ground motion prediction equations for application to the 2015 Canadian national seismic hazard maps. Can. J. Civil Eng. 40, 988–998. doi: 10.1139/cjce-2012-0544
Atkinson, G. M., and Goda, K. (2013). “Probabilistic seismic hazard analysis of civil infrastructure,” in Handbook of Seismic Risk Analysis and Management of Civil Infrastructure Systems, eds S. Tesfamariam, K. Goda (Cambridge: Woodhead Publishing Ltd.), 3–28. doi: 10.1533/9780857098986.1.3
Baker, J. W. (2011). Conditional mean spectrum: tool for ground-motion selection. J. Struct. Eng. 137, 322–331. doi: 10.1061/(ASCE)ST.1943-541X.0000215
Baker, J. W. (2015). Efficient analytical fragility function fitting using dynamic structural analysis. Earthquake Spectra 31, 579–599. doi: 10.1193/021113EQS025M
Baker, J. W., and Cornell, C. A. (2006). Spectral shape, epsilon and record selection. Earthquake Eng. Struct. Dynam. 35, 1077–1095. doi: 10.1002/eqe.571
Cassidy, J. F., Rogers, G. C., Lamontagne, M., Halchuk, S., and Adams, J. (2010). Canada's earthquakes: the good, the bad, and the ugly. Geosci. Can. 37, 1–16. Available online at: https://journals.lib.unb.ca/index.php/GC/article/view/15300
Christovasilis, I. P., Filiatrault, A., Constantinou, M. C., and Wanitkorkul, A. (2009). Incremental dynamic analysis of woodframe buildings. Earthquake Eng. Struct. Dynam. 38, 477–496. doi: 10.1002/eqe.864
Folz, B., and Filiatrault, A. (2001). Cyclic analysis of wood shear walls. J. Struct. Eng. 127, 433–441. doi: 10.1061/(ASCE)0733-9445(2001)127:4(433)
Folz, B., and Filiatrault, A. (2004). Seismic analysis of woodframe structures. I: model formulation. J. Struct. Eng. 130, 1353–1360. doi: 10.1061/(ASCE)0733-9445(2004)130:9(1353)
Goda, K., and Atkinson, G. M. (2011). Seismic performance of wood-frame houses in southwestern British Columbia. Earthquake Eng. Struct. Dynam. 40, 903–924. doi: 10.1002/eqe.1068
Goda, K., Campbell, G., Hulme, L., Ismael, B., Ke, L., Marsh, R., et al. (2016). The 2016 Kumamoto earthquakes: cascading geological hazards and compounding risks. Front. Built Environ. 2:19. doi: 10.3389/fbuil.2016.00019
Goda, K., and Taylor, C. A. (2012). Effects of aftershocks on peak ductility demand due to strong ground motion records from shallow crustal earthquakes. Earthquake Eng. Struct. Dynam. 41, 2311–2330. doi: 10.1002/eqe.2188
Goda, K., Wenzel, F., and De Risi, R. (2015). Empirical assessment of non-linear seismic demand of mainshock-aftershock ground-motion sequences for Japanese earthquakes. Front. Built Environ. 1:6. doi: 10.3389/fbuil.2015.00006
Goulet, C. A., Haselton, C. B., Mitrani-Reiser, J., Beck, J. L., Deierlein, G. G., Porter, K. A., et al. (2007). Evaluation of the seismic performance of a code-conforming reinforced concrete frame building—from seismic hazard to collapse safety and economic losses. Earthquake Eng. Struct. Dynam. 36, 1973–1997. doi: 10.1002/eqe.694
Halchuk, S., Allen, T. I., Adams, J., and Rogers, G. C. (2014). Fifth Generation Seismic Hazard Model Input Files as Proposed to Produce Values for the 2015 National Building Code of Canada. Geological Survey of Canada, Open File 7576. doi: 10.4095/293907
Halchuk, S. C., Adams, J. E., and Allen, T. I. (2015). Fifth Generation Seismic Hazard Model for Canada: Grid Values of Mean Hazard to be Used with the 2015 National Building Code of Canada. Geological Survey of Canada, Open File 7893. doi: 10.4095/297378
Hong, H. P., and Goda, K. (2006). A comparison of seismic-hazard and risk deaggregation. Bull. Seismol. Soc. Am. 96, 2021–2039. doi: 10.1785/0120050238
Humar, J. (2015). Background to some of the seismic design provisions of the 2015 National Building Code of Canada. Can. J. Civil Eng. 42, 940–952. doi: 10.1139/cjce-2014-0385
Hyndman, R. D., and Rogers, G. C. (2010). Great earthquakes on Canada's west coast: a review. Can. J. Earth Sci. 47, 801–820. doi: 10.1139/E10-011
Koduru, S. D., and Haukaas, T. (2010). Probabilistic seismic loss assessment of a Vancouver high-rise building. J. Struct. Eng. 136, 235–245. doi: 10.1061/(ASCE)ST.1943-541X.0000099
Mitchell, D., Paultre, P., Tinawi, R., Saatciouglu, M., Tremlay, R., Elwood, K., et al. (2010). Evolution of seismic design provisions in the National building code of Canada. Can. J. Civil Eng. 37, 1157–1170. doi: 10.1139/L10-054
Mitchell, D., Tinawi, R., and Law, T. (1990). Damage caused by the November 25, 1988, Saguenay earthquake. Can. J. Civil Eng. 17, 338–365. doi: 10.1139/l90-041
Mitchell-Wallace, K., Jones, M., Hillier, J., and Foote, M. (2017). Natural Catastrophe Risk Management and Modelling: A Practitioner's Guide. Oxford: Wiley-Blackwell.
NLIRO (2008). Earthquake Insurance in Japan. Tokyo: Non-Life Insurance Rating Organization of Japan. Available online at: http://www.giroj.or.jp/english/index.html
OECD (2008). Financial Management of Large Scale Catastrophes. Policy Issues in Insurance (No. 12). Paris: Organization for Economic Co-operation and Development Publishing. doi: 10.1787/9789264041516-en
Onur, T., Ventura, C. E., and Finn, W. D. L. (2006). A comparison of two regional seismic damage estimation methodologies. Can. J. Civil Eng. 33, 1401–1409. doi: 10.1139/l06-084
Pan, Y., Ventura, C. E., and Finn, W. D. L. (2018). Effects of ground motion duration on the seismic performance and collapse rate of light-frame wood houses. J. Struct. Eng. 144, 4018112. doi: 10.1061/(ASCE)ST.1943-541X.0002104
Tesfamariam, S., and Goda, K. (2015). Loss estimation for non-ductile reinforced concrete building in Victoria, British Columbia, Canada: effects of mega-thrust Mw9-class subduction earthquakes and aftershocks. Earthquake Eng. Struct. Dynam. 44, 2303–2320. doi: 10.1002/eqe.2585
Vamvatsikos, D., and Cornell, C. A. (2002). Incremental dynamic analysis. Earthquake Eng. Struct. Dynam. 31, 491–514. doi: 10.1002/eqe.141
Ventura, C. E., Finn, W. D. L., Onur, T., Blanquera, A., and Rezai, M. (2005). Regional seismic risk in British Columbia: classification of buildings and development of damage probability functions. Can. J. Civil Eng. 32, 372–387. doi: 10.1139/l04-099
Wald, D. J., and Allen, T. I. (2007). Topographic slope as a proxy for seismic site conditions and amplification. Bull. Seismol. Soc. Am. 97, 1379–1395. doi: 10.1785/0120060267
White, T. W., and Ventura, C. E. (2006). Seismic Performance of Wood-frame Residential Construction in British Columbia-Technical Report. Earthquake Eng. Research Facility Report No. 06-03. Vancouver, BC: University of British Columbia.
Keywords: seismic risk analysis, probabilistic seismic hazard analysis (PSHA), seismic fragility analysis, ground motion record selection, wood structure building
Citation: Goda K (2019) Nationwide Earthquake Risk Model for Wood-Frame Houses in Canada. Front. Built Environ. 5:128. doi: 10.3389/fbuil.2019.00128
Received: 23 August 2019; Accepted: 10 October 2019;
Published: 30 October 2019.
Edited by:
Vagelis Plevris, OsloMet – Oslo Metropolitan University, NorwayReviewed by:
Hoang Nam Phan, Roma Tre University, ItalyEhsan Noroozinejad Farsangi, Graduate University of Advanced Technology, Iran
Copyright © 2019 Goda. This is an open-access article distributed under the terms of the Creative Commons Attribution License (CC BY). The use, distribution or reproduction in other forums is permitted, provided the original author(s) and the copyright owner(s) are credited and that the original publication in this journal is cited, in accordance with accepted academic practice. No use, distribution or reproduction is permitted which does not comply with these terms.
*Correspondence: Katsuichiro Goda, a2dvZGEyQHV3by5jYQ==
 Katsuichiro Goda