
94% of researchers rate our articles as excellent or good
Learn more about the work of our research integrity team to safeguard the quality of each article we publish.
Find out more
ORIGINAL RESEARCH article
Front. Built Environ. , 18 October 2019
Sec. Earthquake Engineering
Volume 5 - 2019 | https://doi.org/10.3389/fbuil.2019.00123
This article is part of the Research Topic Seismic Analysis and Retrofitting of Historical Buildings View all 14 articles
Recent seismic events produced considerable socio-economic losses. An important step for the reduction and mitigation of seismic risk in urban areas with a high population density is the assessment of global vulnerability of clustered buildings. The proposed work aims at appraising the seismic vulnerability of building aggregates within the historical center of Arsita, damaged by the L'Aquila earthquake (2009 April 6th), through a multi-level approach deriving from the application of different estimation procedures. In particular, the seismic vulnerability quantification has been done by comparing three distinct methods, namely the macroseismic approach according to the EMS-98 scale, the Vulnus methodology, developed by the University of Padua, and the mechanical approach derived from using the 3Muri software. The expected damage has been estimated in terms of fragility curves, respectively, for the entire buildings compound and the individual structural units located in the corner and intermediate positions, in order to evaluate the beneficial or detrimental aggregate effect on the seismic behavior of individual constructions examined.
The evaluation of the seismic safety of existing masonry buildings is one of the most important aspects to be contextualized in the last decades, where the occurrence frequency of seismic events is very high. The characterization of historical buildings is a very demanding task, because many factors influence their global seismic response. In particular, an important cause of disasters is the poor seismic performance of such constructions. In fact, several masonry buildings were built without taking any consideration about seismic actions. This inadequacy generates a drastic increase of the global vulnerability and, therefore, of the seismic risk of entire urbanized sectors, such as historical centers (Pujades et al., 2012). The seismic vulnerability, for definition, is assumed as the propensity of buildings to suffer a certain damage under a given seismic event. The vulnerability assessment methods suggested by current codes are often based on a series of prerequisites, such as strong connections among structural components, presence of rigid floors, etc., which are difficult to be detected in old urban centers (Valluzzi et al., 2004).
The existing masonry buildings in the historic centers are often grouped in aggregates, so that they, in general, can mutually interact under seismic actions.
This type of buildings are often erected according to a traditional code of practice with typologies (multi-materials masonry, multi-leaf walls) and construction details (poor connections among intersecting walls, among walls and floors, and even between layers in the thickness), which in many cases show behavioral deficiencies in terms of stability and safety against seismic actions (Borzi et al., 2008; Formisano, 2017a). Nevertheless, several factors exist conditioning their performance, mainly depending on the interactions among the single structural units (SUs). Generally, the presence of effective connections among SUs prevents the occurrence of local collapse mechanisms in several cases. However, the presence of construction irregularities (e.g., walls not well-connected to each other) and/or geometric ones (e.g., buildings with different heights) are the main causes of the activation of out-of-plane collapse mechanisms (Barbieri et al., 2013).
The interactions between adjacent buildings must be properly considered when studying the vulnerability of the whole aggregate, since the dynamic response of a building is often strongly influenced by the presence of adjacent structural units. Generally, the capacity of the single SUs can differ significantly from the capacity of the whole aggregate, especially in case of flexible floors. In fact, this type of construction can show complex non-linear responses, which vary greatly from the degree of connection between adjacent buildings.
There are many vulnerability factors that must be taken into consideration to study the seismic capacity of buildings in aggregate configuration. These vulnerabilities significantly affect the dynamic response of the structure. In particular, it is worth highlighting the in-plan-distribution of the resistant elements (walls), the presence of staggered floors and the structural heterogeneity between adjacent buildings. Mechanical models were developed in different works (Formisano et al., 2011, AGGIUNGERE ALTRI LAVORI DI ALTRI AUTORI), where the uncertainties related to the vulnerability factors were taken into account in order to quantify the seismic response of the entire aggregate. From a computational point of view, the structural model must be akin to what is found in reality. In this case, the influence of adjacent structural units is an intrinsic condition of the mechanical model itself.
Due to the structural continuity, the seismic behavior of single buildings is strongly affected by the interactions between their structural parts, connected to each other. In most cases, it is quite difficult to uniquely identify a structural unit (SU).
Anyway, the investigation of the seismic global behavior of the single building as part of the aggregate is desirable in order to obtain a better evaluation of its seismic performance, which is a fundamental phase to set up efficient retrofitting techniques (Formisano et al., 2011).
However, Formisano and Massimilla (2018) proposed simplified theoretical and refined non-linear analyses of the seismic response of structural units in aggregate condition. In particular, the authors proposed a procedure calibrated on the results of a numerical model, used to investigate a basic building compound representative of the constructive techniques developed in the Southern Italy. To this purpose, two basic models were considered for mechanical analysis. The first one was related to the whole aggregate, while the second one was the structural model of the single structural unit modeled as an isolated structure. Thus, the isolated structure was equipped with proper boundary elements under form of elasto-plastic links, whose non-linear behavior was calibrated on the results of the structural analysis performed on the model of the whole aggregate, in order to represent the real seismic behavior of the structural unit placed either in the intermediate position or in the head one. Basically, the reconstruction of the pushover curves of the single SU when the whole aggregate is modeled allows for estimating the influence of other SUs on the seismic behavior of the SU under study in aggregate configuration. In fact, once the capacity curve of the whole aggregate is known, for each step of the non-linear analysis, it is possible to evaluate shear forces and nodal displacements of the different SUs. Therefore, in each analysis direction, the total base shear of the aggregate SU is given by the contribution of both its walls and those of adjacent SUs, whereas, the top-displacements are estimated as those of the building centroid at the last level, whose entity results to be increased or reduced with respect to that of the isolated SU centroid, depending on the position, the latter occupies in the building compound. In particular, the top floor centroid displacements are amplified for the heading building, where the in-plane torsion effects of the aggregate are significantly large, while they are reduced for the intermediate SU, where the two structures next to those considered reduce its deformability (Formisano et al., 2016).
As an example, the 2009 L'Aquila Earthquake showed the high vulnerability of old city centers, whose ancient masonry buildings were seriously damaged by disastrous effects resulting from the combination of horizontal and vertical accelerations (D'Ayala and Paganoni, 2011; Lagomarsino, 2012).
Therefore, the seismic vulnerability evaluation of historical buildings, with particular attention to the clustered ones, represents a key issue in the field of Seismic Engineering. It can be performed by means of two main approaches of hybrid (Kappos et al., 2006) and mechanical (Lourenço and Roque, 2006; Penna et al., 2014; Formisano, 2017b) type.
The first approach allows for the estimation of the global vulnerability through quick analyses principally based on vulnerability forms widely used all over Europe (Ferreira et al., 2013; Brando et al., 2017; Formisano et al., 2017; Tiberti and Milani, 2017; Chieffo et al., 2018). This methodology allows to univocally correlate the building seismic vulnerability index, Iv, deriving from filling specific survey forms, with the possible expected damage (Lagomarsino and Giovinazzi, 2006), which is expressed through the mean damage grade, μD, following the European Macroseismic Scale, EMS-98 (Grünthal, 1998). The peculiarity of this procedure, therefore, is to have a direct correlation between the cause (expected damage) and the effect (seismic event). Another congenial methodology, developed by the University of Padua, is the Vulnus method, which allows to estimate the seismic vulnerability of building aggregates by means of statistical-parametric analysis based on their probable collapse mechanisms (Munari et al., 2010).
On the other hand, the mechanical approach, which is based on refined non-linear FEM analyses, is not very adaptable to the seismic vulnerability study of urban centers constructions, due to it being highly time consuming to obtain information on all the clustered buildings interacting under earthquakes. Nevertheless, some simplified assumptions were developed to study only single SUs, neglecting the modeling of adjacent constructions, by taking into account, at the same time, their inclusion in the building compound (Formisano and Massimilla, 2018). Normally, in the framework of this approach, the knowledge of the building typology, as well as its mechanical characteristics, are the essential starting points for the calibration of the structural model (Calvi et al., 2006).
Therefore, an accurate investigation plan and an adequate analysis methodology (non-linear static or dynamic) allows for calibration of the structural model based on fundamental issues, such as preliminary historical researches, interpretation of the constructive development during the time and evaluation of general structural characteristics of the construction. In addition, it is advisable, as proposed by Ramos and Lourenço (2004), to make a complete diagnosis of the building by means of in-situ investigations or non-destructive tests on materials, in order to set up a reliable numerical model for performing careful seismic assessments and for implementing appropriate retrofitting interventions aimed at satisfying security and reversibility requirements. Therefore, based on these considerations, this paper proposes the seismic vulnerability evaluation of a building aggregate located in Arsita (district of Teramo, Italy) affected by the 2009 L'Aquila seismic sequence. The study performed focuses attention on the vulnerability analysis of the case study by means of three distinct procedures, in order to compare the expected seismic behavior in terms of fragility curves for the whole aggregate and for individual structural units placed in the corner and intermediate positions.
Arsita is an Italian town with 889 inhabitants in the province of Teramo in Abruzzo. Located below the Camicia Mountain group (eastern side of the Gran Sasso of Italy massif), it is placed in the upper valley of the Fino river and is part of the mountain community of Vomano, Fino, and Piomba (Figure 1).
Localized about 30 km south of Teramo, its origins date back to the pre-Roman period, as evidenced by some archaeological findings, such as tombs, grave goods and various jewels, discovered in 1985. In addition, cinerary urns, tear vessels, oil lamps, floors, Roman coins of the city of Cerbolongo, mentioned by Tito Livio and destroyed in the lower empire, were found (Morisi, 1998). Its current urban configuration can be traced back to the late Middle Ages, at the beginning of the Renaissance period. In the 18th century, Arsita was transformed into a noble residence, keeping the aspect that still retains today, where some parts are in a serious state of abandonment.
The Aterno valley is an area affected by devastating earthquakes in the last few centuries. The seismic history of this region recalls, of course, that of the city of L'Aquila. In fact, since its foundation in the late 13th century, this city underwent six destructive earthquakes, with maximum intensity in the Mercalli-Cancani-Sieberg scale, IMCS,equal to IX recorded on 1349 September 9th, 1461 November 27th, and 1703 February 2nd. The 1349 earthquake had several epicenter areas, with the most important occurring in Venafro (Boncio et al., 2012).
However, the most severe seismic event affecting the Umbria-Abruzzo Apennines was that which occurred in 1,703 with magnitude moment Mw = 6.7. It hit several places (e.g., Poggio Picenze, San Gregorio, Sant'Eusanio Forconese, Paganica, Bazzano, Onna, Santa Rufina, and Tempera), including Castelnuovo, which reached an intensity equal to X (Figure 2A).
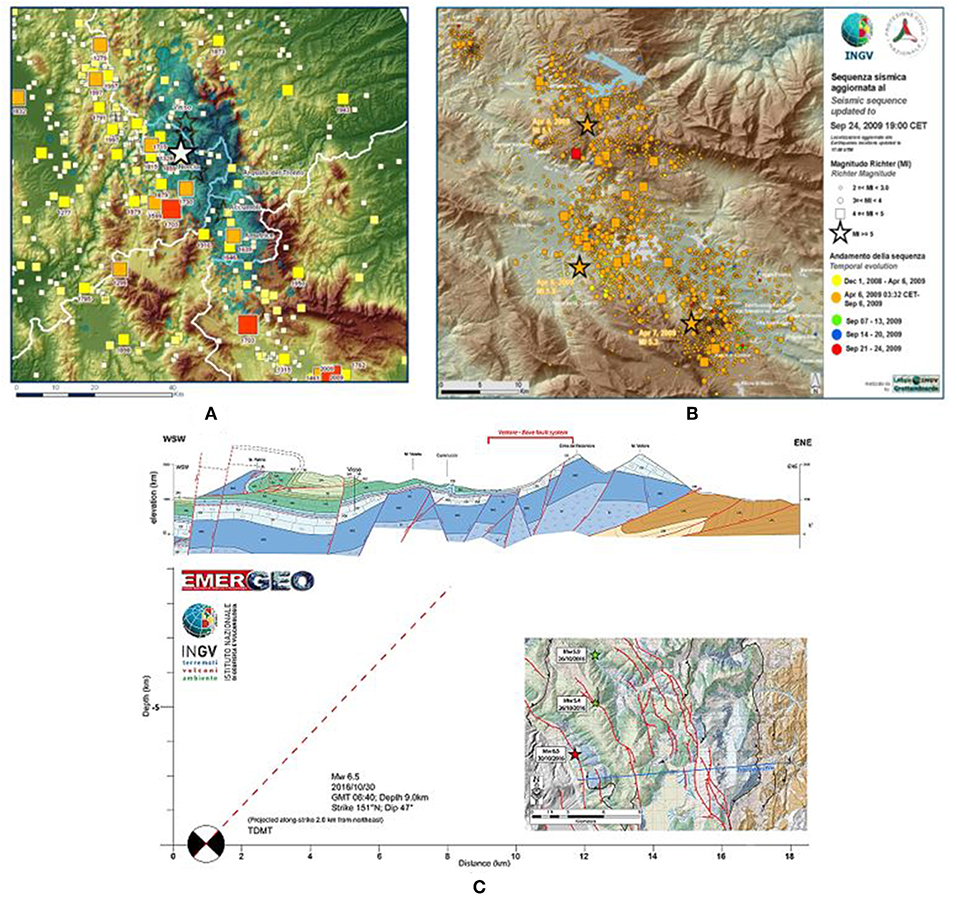
Figure 2. (A) Historical seismic events, (B) distribution of epicenters recorded during the Central Italy earthquake, and (C) distribution of seismogenic source (National Institute of Geophysics Vulcanology, 2009).
On April 6th 2009 at 3:33 a.m., the area of L'Aquila was hit by a strong earthquake, whose main shock had a Richter magnitude (Ml) of 5.8 and moment magnitude Mw of 6.3 (Ameri et al., 2009).
After the main shock, a seismic sequence started with many replicas involving the epicenter area and the surrounding municipalities, as reported in Figure 2B (National Institute of Geophysics Vulcanology, 2009).
The distribution of replicas highlighted the area affected by the seismic sequence very well, which extends for over 30 km in the direction North-West—South-East, parallel to the axis of the Apennine chain. The strongest replica, recorded at 7:47 p.m. on April 7th, affected the southernmost sector of the area, near the centers of San Martino d'Ocre, Fossa, and San Felice d'Ocre, where small shocks were also detected in the same day. The event of April 9th having Ml = 5.1 is instead north located, along a structure of more limited extension, always parallel to the Apennine chain.
The extensional processes characterizing the deformation of the Apennine crust dominate the seismo-tectonic context of the L'Aquila area and, in particular, related to the North-East—South-West extension of this mountain chain.
This extension, estimated by GPS measurements as about 3 mm per year (D'Agostino et al., 2011), is accommodated by normal faults in the North-West—South-East direction, which all the major seismicity of the central Apennines should be ascribed to. The distribution of the effects induced by the 2009 April event was characterized by both the geometry and orientation of the activated fault and the rupture propagation depicted in Figure 2C (Galli and Naso, 2009). The latter figure shows a geological section (shown in the map with a blue line) between Norcia and Monte Vettore, with a 9 km depth hypocentre causing an earthquake of magnitude 6.5. The extension of the surface fault plane, according to the inclination (dip ≈ 47°) of the focal mechanism, is reasonably indicated as the system responsible for this last seismic sequence. The damage in the epicenter area is determined not only by the earthquake magnitude, but also by the propagation direction and by the land geology. In particular, the greatest damage is observed in the direction where faulting spreads (directivity effect of the source) are amplified due to the presence of “soft” sediments, such as alluvial deposits and land to be returned, etc. In the case of the L'Aquila earthquake, the soil rupture spreads from the bottom upwards (then toward the city of L'Aquila) and from the North-West to the South-East, toward the Valle dell'Aterno.
Considering the reconstruction plan of the Municipality of Arsita setup by the collaboration among National Agency for New Technologies, Energy and Sustainable Economic Development (ENEA—Bologna), University of Naples “Federico II,” University of Chieti “Gabriele D'Annunzio” and University of Ferrara, 20 aggregates (AGs) consisting of 91 structural units (SUs), most of which are inside the perimeter area (RP perimeter), have been identified, as reported in Figure 3 (Indirli et al., 2014).
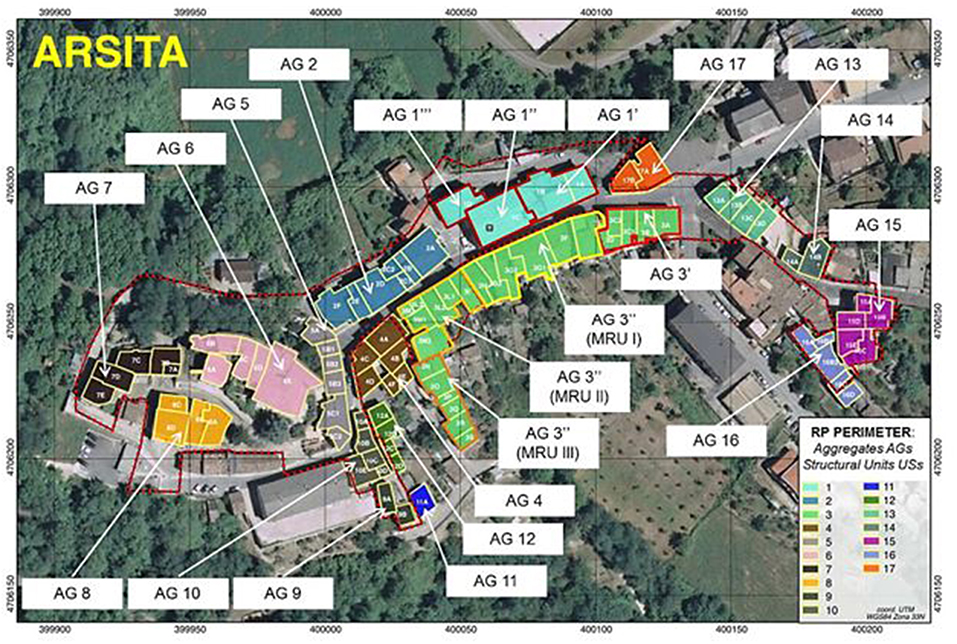
Figure 3. Structural identification of masonry AGs and SUs (Indirli et al., 2014).
In the study area, there are very different types of buildings. Together with historical buildings, usually made of not-squared stones (often alluvial pebbles) sustaining timber floors, there are groups of constructions completely abandoned and partially ruined, and have been so for several decades (Indirli et al., 2012). The spatial distribution of these typologies of buildings came from the simple centrifugal expansion of the old town. The identification of the mechanical characteristics of the masonry types have been done according to the National Code (M.D. 2 February 2009, 2009) through on-site data acquisitions (Figure 4A). In general, masonry walls have a thickness of about 0.65 m. Buildings develop in elevation from 2 to 3 stories.
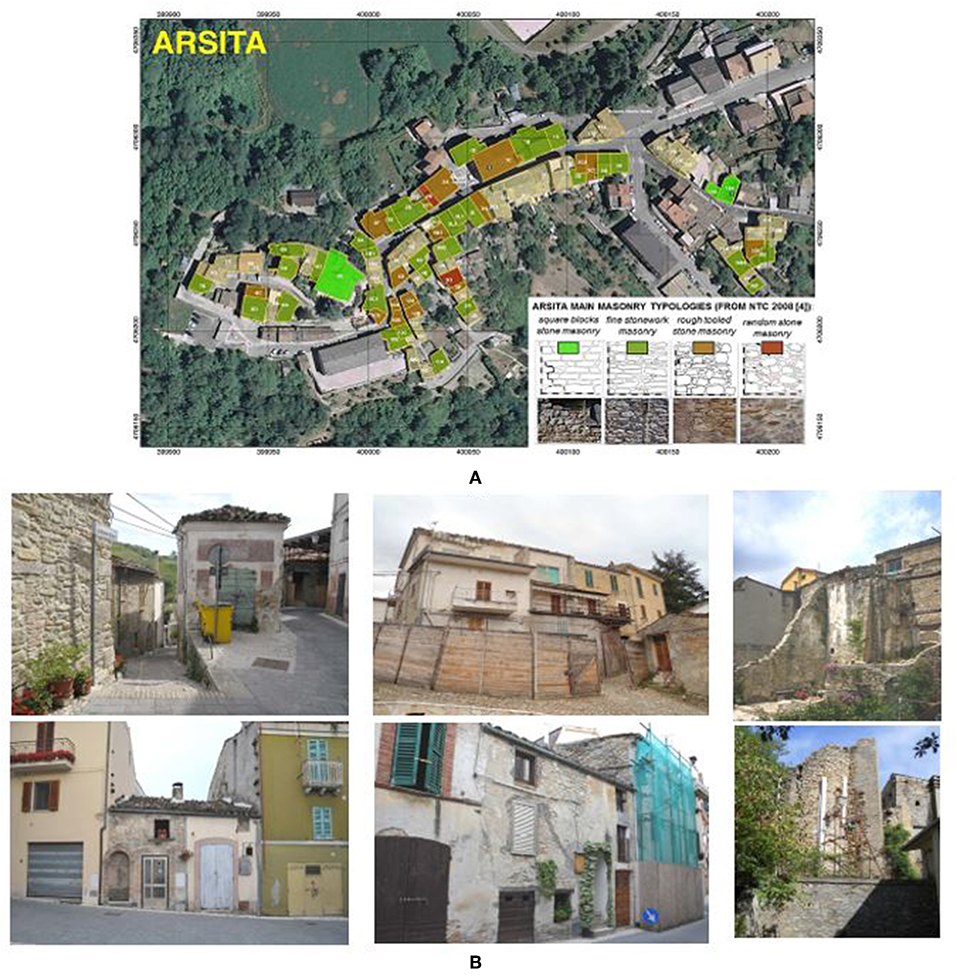
Figure 4. Main masonry typology (A,B) street view of SUs within the historical center (Indirli et al., 2014).
The inter-story height is about 3.00 to 4.00 m for the first level and 3.00 to 3.50 m for the upper floors. Horizontal structures are generally made of timber elements, as reported in Figure 4B. The foundations consist of a shallow wall footing, which, in practice, is realized by arranging the masonry walls directly on the ground at a depth of about 1.50 m.
As a consequence of the seismic event that occurred, most of serious damages were found in stone structures, especially in the higher parts of the buildings (roofs, cornices, corners, etc.). Also, the lack of connections among perimeter walls orthogonal to each other (corners), which did not guarantee a structure global behavior, was the cause of numerous partial collapses.
The case study herein examined is a masonry aggregate identified with the number 8 (AG.8), consisting of 4 structural units (SUs), denominated 8A, 8B, 8C, 8D, having different seismic behavior deriving from diverse in-plane positions they have (Figure 5).
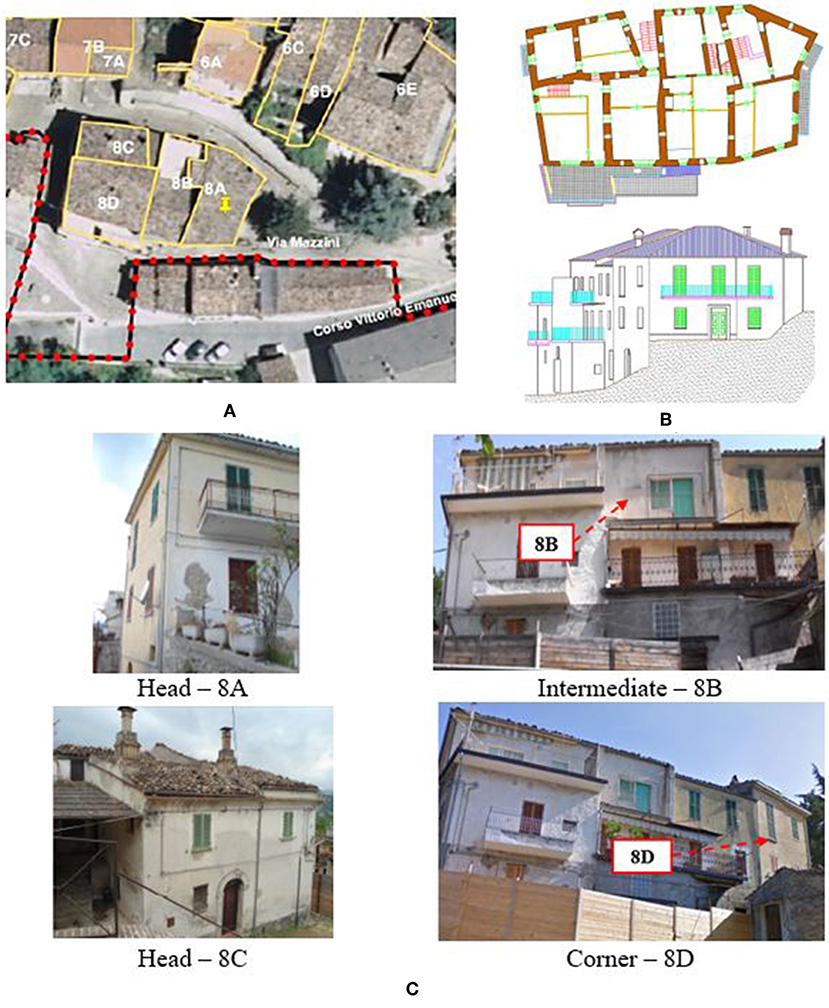
Figure 5. Structural configuration of the case study masonry buildings aggregate: (A) plan layout of the intermediate floor, (B) South-West view, and (C) positions of SUs in the compound of buildings.
The case study aggregate, erected earlier than 1919, has both residential and productive destinations of use. The constitutive materials are masonry stones typical of the Abruzzo region. Horizontal structures are made of steel beams and hollow tiles. Timber beams, which sustain overlying timber plank and tiles, are the load-bearing members of roofing.
Regarding the morphology, the aggregate is rather regular in plan, while the major discontinuities are detected in elevation, with the presence of staggered floors and floors at different heights due to the soil slope.
In the present study, the seismic vulnerability of inspected clustered buildings has been appraised by means of three different methods (macroseismic, Vulnus, and mechanical), in order to have both a general overview of the seismic health state of the building compound and a careful comparison among examined analysis approaches.
The macroseismic approach is a reliable method for large-scale seismic assessment of historical centers buildings, which is widely adopted at international level (Ferreira et al., 2012; Azizi-Bondarabadi et al., 2016; Cavaleri et al., 2017; Azap et al., 2018; Formisano and Chieffo, 2018a). It allows to determine the expected damage of constructions, defined according to the EMS-98 scale (Grünthal, 1998), starting from their vulnerability index.
A quick seismic evaluation procedure for masonry aggregates based on a dedicate survey form has herein been used for determination of the vulnerability index (Formisano et al., 2011, 2015; Chieffo and Formisano, 2019; Chieffo et al., 2019).
This new form is based on the Benedetti and Petrini's vulnerability index method (Benedetti and Petrini, 1984), widely used in the past as a rapid technique for a detailed screening of the main features of individual buildings to investigate their seismic vulnerability. This method is based on a vulnerability form, consisting of 10 parameters that take into account the constructive and structural characteristics of isolated buildings. Such a form was subsequently modified with minor adjustments by the Italian Defense National Group against Earthquakes (GNDT) for seismic vulnerability assessment of masonry and RC buildings located in historical centers.
The new form for masonry building aggregates is obtained by adding five supplementary parameters to the 10 basic parameters of the original form. The introduction of these new parameters takes into account the structural or typological heterogeneity, the interaction effects and the different opening areas among adjacent SUs when they are subjected to seismic actions. Methodologically, this kind of approach is based on the calculation, for each SU, of a vulnerability index, Iv, as the weighted sum of 15 parameters. These parameters are distributed into 4 classes (A, B, C, and D) with scores, Si, of growing intensity. Each parameter is characterized by a weight Wi, representing the more or less importance for vulnerability estimation, that can range from a minimum value of 0.25 to a maximum one of 1.50. The vulnerability index, Iv, can be calculated as the sum of the class score individuated for each parameter multiplied by the respective weight, as shown in the following equation:
Subsequently, Iv is normalized in the range [0 ÷ 1], adopting the notation VI, by means of the following relationship:
The application of this procedure to the selected clustered buildings has allowed to obtain the seismic vulnerability index of the four SUs (Figure 6).
In the previous figure, it is seen that the intermediate SU (8B) has the less vulnerability index, while the highest index has been achieved by the corner SU (8C). In particular, the unit 8B shows a vulnerability decrease of about 30% with respect to unit 8C. However, in order to take into account, the vulnerability of the whole aggregate, a global average vulnerability, VIM, intended as the average of the vulnerability indexes of individual SUs, has been estimated as equal to 0.53 with a standard deviation (σi) of 0.085.
Subsequently, vulnerability curves have been derived to estimate the propensity at damage of the analyzed SUs for different seismic intensities (Lagomarsino and Giovinazzi, 2006). More in detail, these curves can be properly defined as the probability P[SL|I] that a building class reaches a certain damage threshold “DS” at a given macroseismic intensity “IM,” defined according to the European Macroseismic Scale (EMS-98) (Grünthal, 1998).
In particular, as mathematically expressed by Equation (3), vulnerability curves depend on three variables: the vulnerability index (VI), the hazard, expressed in terms of macroseismic intensity (I), and a ductility factor Q, ranging from 1 to 4, which describes the ductility of typological classes of buildings and has been assumed as equal to 2.3 (Lagomarsino, 2006).
Finally, it is also been possible to derive vulnerability curves for the single SUs and for the whole aggregate, the latter using the mean value of the vulnerability index, VI,mean, and the upper and lower bound ranges of the vulnerability index distribution for different scenarios (VI,mean – σ; VI,mean + σ; VI,mean – 2σ; VI,mean + 2σ). The obtained results have been plotted in Figure 7.
Moreover, in order to have an estimation of the expected damage in terms of PGA, it has been possible to derive the fragility curves (Figure 8) by a direct correlation between macroseismic intensity, IEMS−98, and ground motion amax according to the law proposed by Guagenti and Petrini (1989):
where the correlation coefficients C1 and C2 are 0.602 and 7.073, respectively.
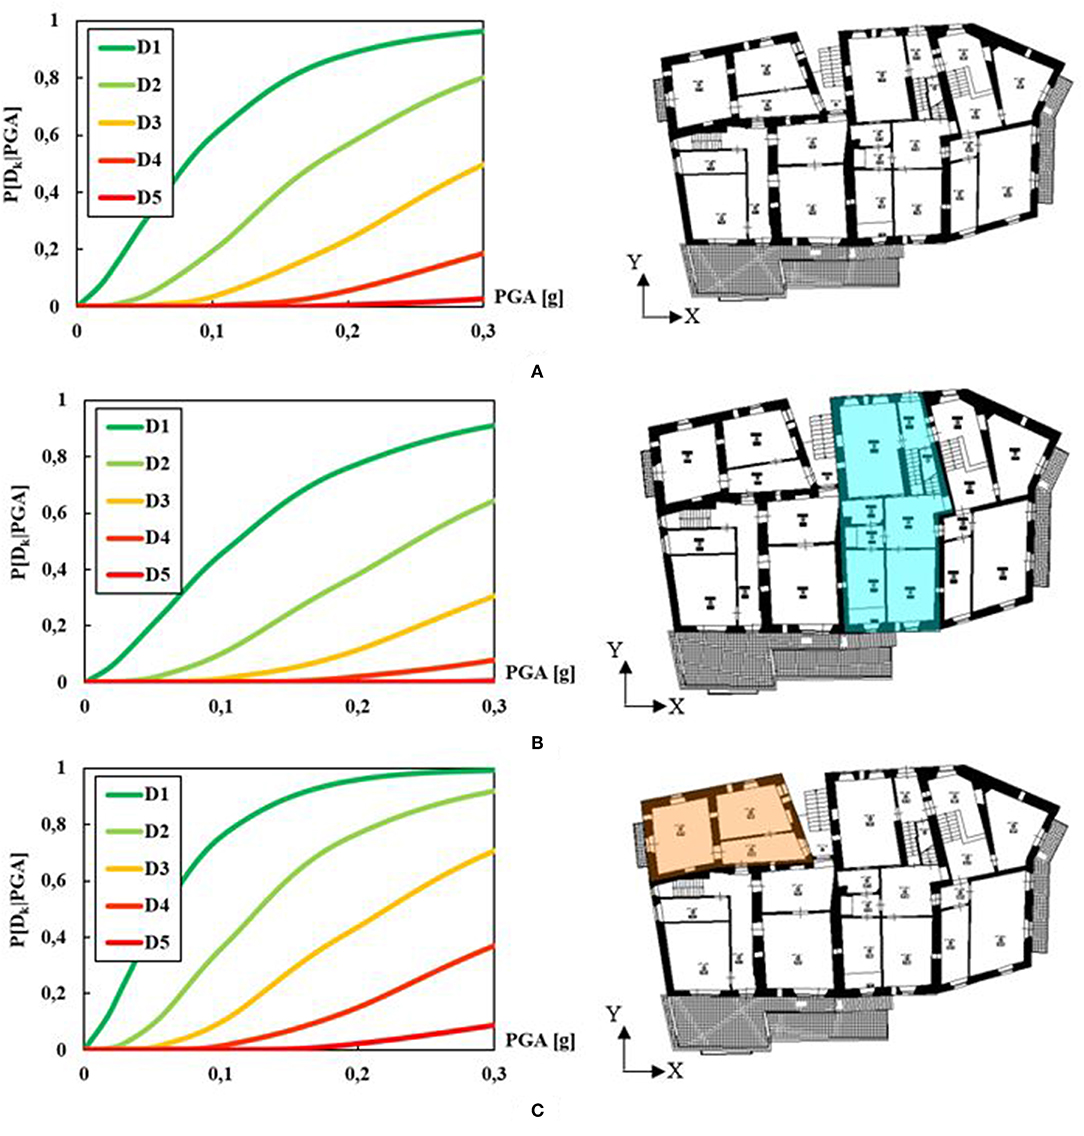
Figure 8. Fragility curves for (A) whole building aggregate, (B) SU 8B, and (C) SU 8C according to the macroseismic approach.
According to the national seismic classification (OPCM, 2003), the Municipality of Arsita belongs to the Zone 2, that is affected by strong earthquakes with an expected maximum PGA of 0.25 g, which has a 10% probability of being exceeded in 50 years. The result obtained shows that the aggregate position strongly affects the global vulnerability and, therefore, the expected damage. In particular, it is possible to see how the expected damage for SU 8C is more marked than those which should be attained in the other examined cases.
The Vulnus Method (Da Porto et al., 2013), developed by the University of Padua, is a seismic vulnerability assessment approach mainly based on statistical analysis of possible collapse mechanisms that could be activated into masonry buildings. It is a procedure to identify the collapse multiplier, αi, calculated by means of kinematic analysis, to ascertain whether a mechanism occurs or not and, in positive case, to establish what is the corresponding probable damage.
This methodology, mainly used for unreinforced masonry (URM) buildings, is based on the fuzzy set theory for estimation of collapse multipliers (Bernardini et al., 1990) and definition of fragility curves (Fava et al., 2016). Operatively, the vulnerability is studied by means of three indexes: I1 and I2, which take into account the probable in-plane and out-of-plane mechanisms, respectively, and I3, which considers the vulnerability parameters of the GNDT method and is assigned depending on the relative importance of the factors affecting the building vulnerability.
More in detail, for in-plane behavior, I1 is defined as the ratio between the in-plane shear strength of walls in the weakest building direction and the total building weight (W), whereas for the out-of-plane behavior, I2 is the ratio between the average acceleration related to out-of-plane mechanisms of perimeter walls and the gravity acceleration.
Finally, the method allows to estimate the probability of reaching a specific damage threshold due to the occurrence of collapse mechanisms, according to the indexes previously described (Da Porto et al., 2018).
Referring to the examined building, the geometric characteristics of the entire building aggregate have been appropriately defined using the form provided by the Vulnus method. In accordance with the prescriptions of NTC18 (M.D. 17 January 2018, 2018), the masonry material has been classified as stone masonry. Therefore, adopting a knowledge level LC1 with a confidence factor (FC) equal to 1.35, the mean values of the resistances and the average of the elastic modules have been adopted. In particular, it has been assumed that the compressive strength, fm, is equal to 1.0 MPa, the characteristic tensile strength, ft, is equal to 0.1 MPa and the shear strength, τ0, is equal to 0.018 MPa. In addition, the elastic modules, E and G, are equal to 870 MPa and 290 MPa, respectively.
Subsequently, the I1, I2, and I3factors have been calculated for estimating the collapse indexes, Ci, the collapse multipliers, αi, and the vulnerability indexes of different SUs (Figure 9).
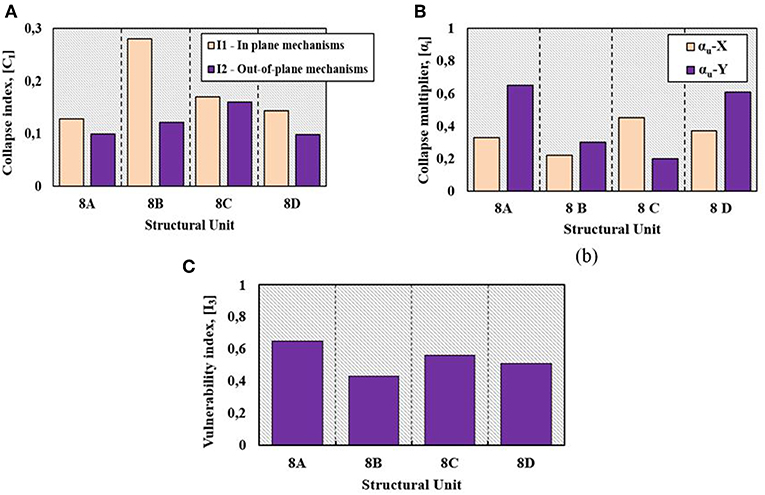
Figure 9. Analysis of collapse mechanisms and collapse indexes derived from I1 and I2 factors (A,B) and ranking of the vulnerability indexes of examined SUs (C).
As it is seen in Figure 9A, the greatest propensity at in-plane damages is for SU 8B, while the SU that should suffer the highest out-of-plane damage is the 8C one. This circumstance denotes how the intermediate structural units are more influenced by in-plane mechanisms than out-of-plane ones.
On the contrary, SUs in head position are more susceptible to undergo out-of-plane collapse mechanisms, as they do not take profit of the confinement action induced by adjacent buildings. These results are confirmed by the ranking of collapse multipliers achieved in Figure 9B. In fact, it is worth noting that the minimum collapse multiplier of the SU 8B corresponds to the X direction (αu – X = 0.22), while for the SU 8C, this multiplier is equal to 0.2 in the Y direction. Moreover, referring to the index I3 (Figure 9C), the vulnerability indexes, calculated according to the GNDT method, are comparable with those deduced through the macroseismic method.
Finally, fragility curves (Figure 10) have been defined as cumulative probability distributions of the damage. They have been represented by the upper (Upp [Vg]) and lower (Low [Vg]) bounds of the fragility domain and by a mean distribution curve (White [Vg]), which represents the most probable expected damage values for different seismic accelerations.
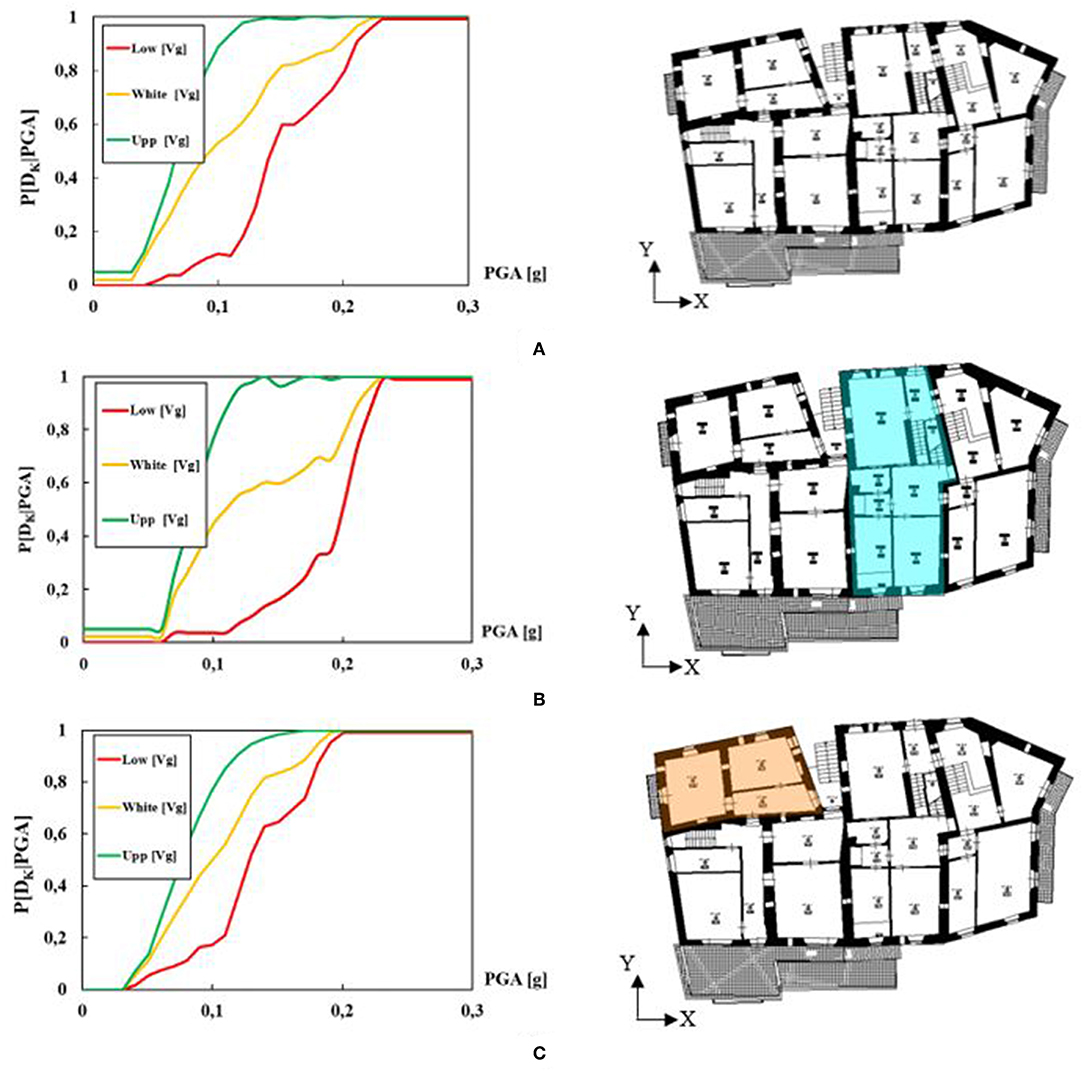
Figure 10. Fragility curves for (A) whole building aggregate, (B) SU 8B, and (C) SU 8C according to the Vulnus method.
As it is noticed in Figure 10, the expected damage frequency for SU, 8C is greater than that detected for both the SU 8B and the whole building compound.
The mechanical method has been applied by means of non-linear analysis performed using the 3Muri software (S.T.A.data srl, 2017). This software is based on the equivalent frame model, assuming that the response of masonry walls with openings can be considered to be equivalent to that of a set of single-dimensional macro-elements (columns, beams, and nodes). The damage is concentrated into deformable columns and beams, while rigid nodes consist of undamaged masonry parts confined between the two previously mentioned elements. The strength criteria of deformable elements have been given on the basis of EN 1998-3 (Eurocode 8, 2005) provisions, which are established as allowable maximum drifts for shear and flexural collapse mechanisms the values of 0.4% and 0.8% of the ultimate displacement (du). The analyses have been performed according to the two main directions, X and Y. For each direction, the accidental eccentricity (positive and negative) has been considered. The aforementioned analyses have been interrupted at 20% decay of the maximum shear resistance, as suggested in Formisano et al. (2013) and Formisano and Chieffo (2018b). The mechanical characteristics of used materials have been taken as indicated in Section Vulnus Method. The 3D macroelement model of the case study building aggregate and failure mechanisms in the X direction are presented in Figures 11A,B, respectively. Furthermore, in order to consider the effect of the mutual interaction among single SUs in the aggregate, the pushover curves of intermediate and head buildings in the two main directions, X and Y, have been derived through an appropriate procedure (Formisano et al., 2016) (Figures 11C,D).
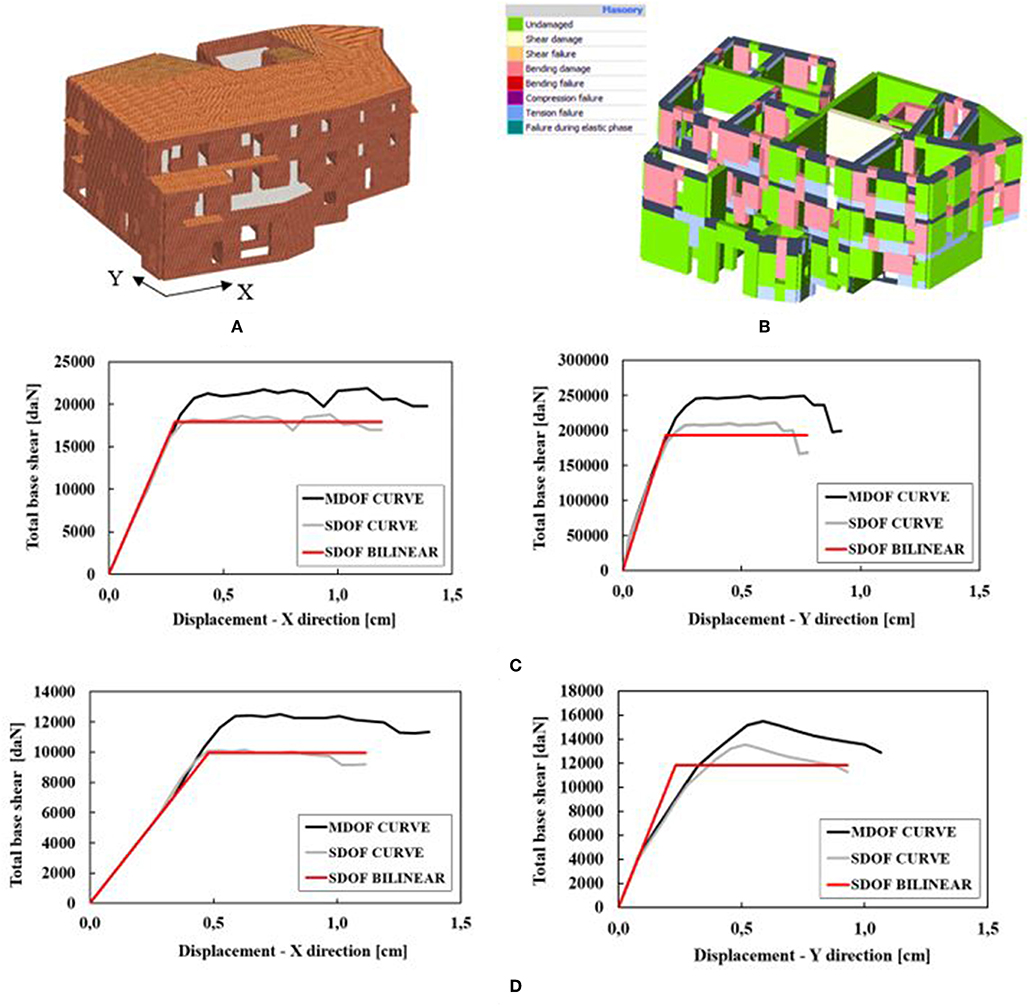
Figure 11. Numerical analysis on the building aggregate under study: (A) 3D macroelement model, (B) failure mechanisms in direction X, and (C,D) pushover curves of SUs 8B and 8C.
This procedure allows extraction of the seismic response of single SUs from that of the whole building compound.
Later on, discretised mechanical fragility curves have been defined on the basis of both damage thresholds (DK, with K = 1, 2, 3, and 4) recalled in Table 1 (Lagomarsino and Cattari, 2014) and different punctual seismic acceleration intensities.
In the mechanical approach, the damage threshold, is estimated as the ratio between the seismic demand displacement (D) and the seismic capacity one (C).
Thus, referring to the SDoF system, the fragility curves of the whole aggregate, as well as of SUs 8B and 8C, in X and Y directions have been derived (Figure 12).
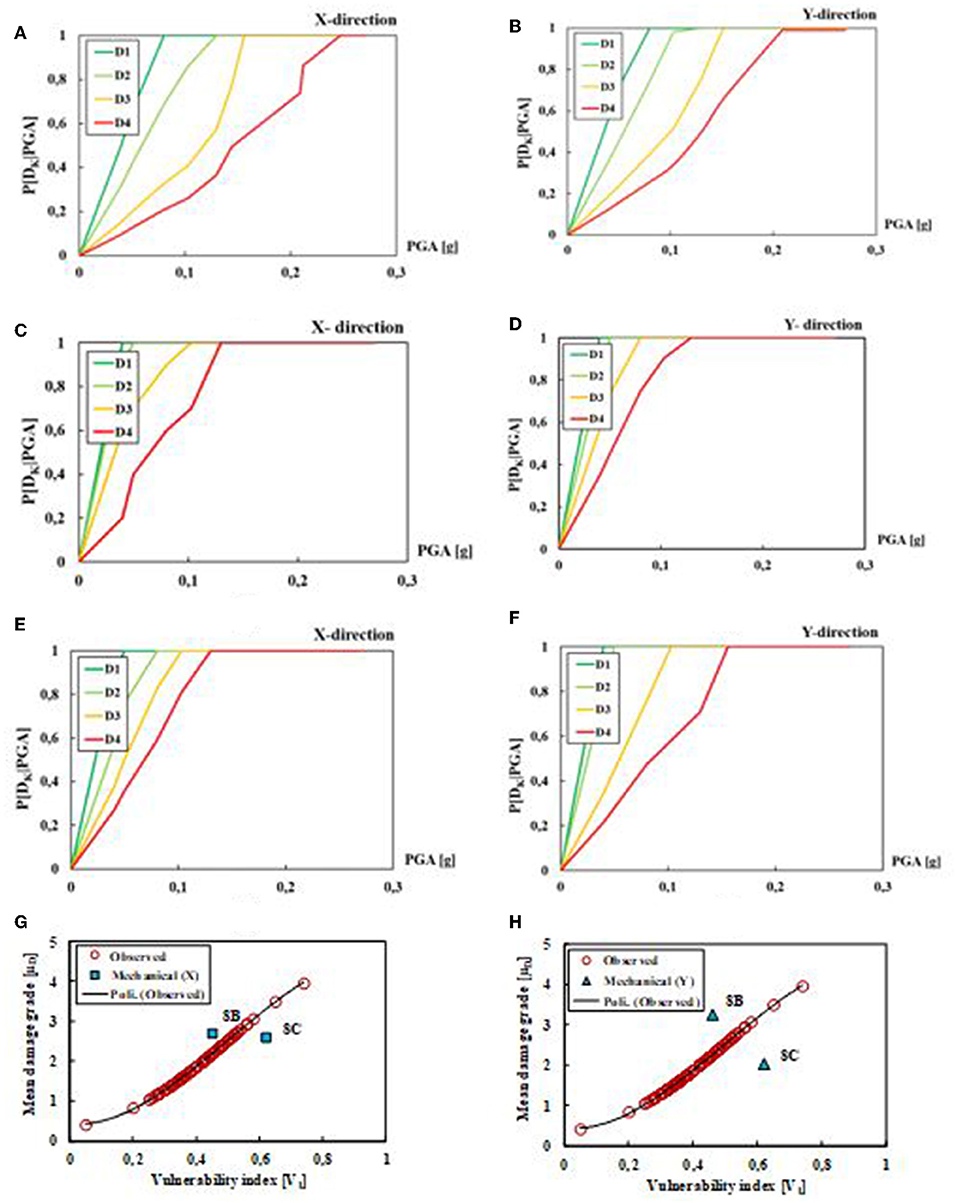
Figure 12. Discretised mechanical fragility curves in the main analysis directions for (A,B) building aggregate, (C,D) SU 8B, (E,F) SU 8C and correlation among numerical results and observed damages for SUs 8B and 8C in directions X (G), and Y (H).
From the obtained fragility curves, it is apparent that, for the whole building aggregate, the occurrence probability of predetermined damage states are lesser than ones underwent by single SUs. As an example, for the expected PGA of 0.25 g and for the D4 limit state (collapse), the damage probabilities are equal to 60% (X direction) and 80% (Y direction) for the whole building aggregate.
On the other hand, under the same conditions of PGA and limit state, the considered SUs exhibit an occurrence probability of 100% in both analysis directions.
Finally, in Figures 12G,H, the comparison among numerical analysis results achieved on the aggregated SUs and observed damages occurred in the study area has been presented. Comparing the 3Muri results in both analysis directions with damages detected in the historical center of Arsita under the occurred seismic intensity, IEMS−98 = VI (Indirli et al., 2012), it has been observed that the formers are close to the observational damage curve in direction X only. Moreover, if compared to the real damages detected from the in-situ survey, the numerical damages achieved from 3Muri analysis are on the safe side for SU 8B only. Therefore, the 3Muri program is able to foresee the seismic damages expected by intermediate SUs in compound in satisfactory way.
In the current section, the comparison of results obtained through the applied analysis methodologies for the whole building aggregate and single SUs has been performed. About the clustered buildings, the results in terms of vulnerability index have been compared to each other, in order to have a direct assessment of the use effectiveness of simplest methodologies.
Therefore, the vulnerability indexes deriving from the macroseismic (EMS-98) analysis and the Vulnus method have been considered as the average values deriving from the indexes of single SUs in order to be compared appropriately to the results obtained from the mechanical (3Muri) methodology (Figure 13).
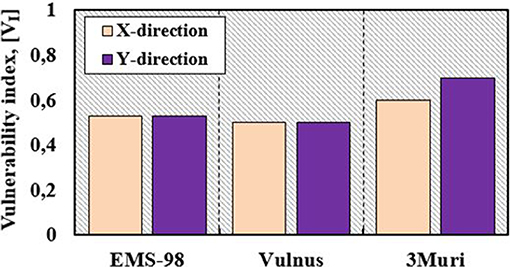
Figure 13. Vulnerability comparison of the building compound according to the different approaches examined.
The obtained comparison provides similar results between the macroseismic method and the Vulnus one. This means that the two methods have the same reliability level in predicting the building compound seismic vulnerability. However, the results obtained with these methods are not on the safe side if compared to those deriving from the 3Muri method. In fact, the mechanical analysis provides vulnerability indexes higher than the average values of the two methodologies of 16 and 36% in X and Y directions, respectively.
Subsequently, the comparison has been also carried out in terms of expected damage through the fragility curves reported in Figure 14.
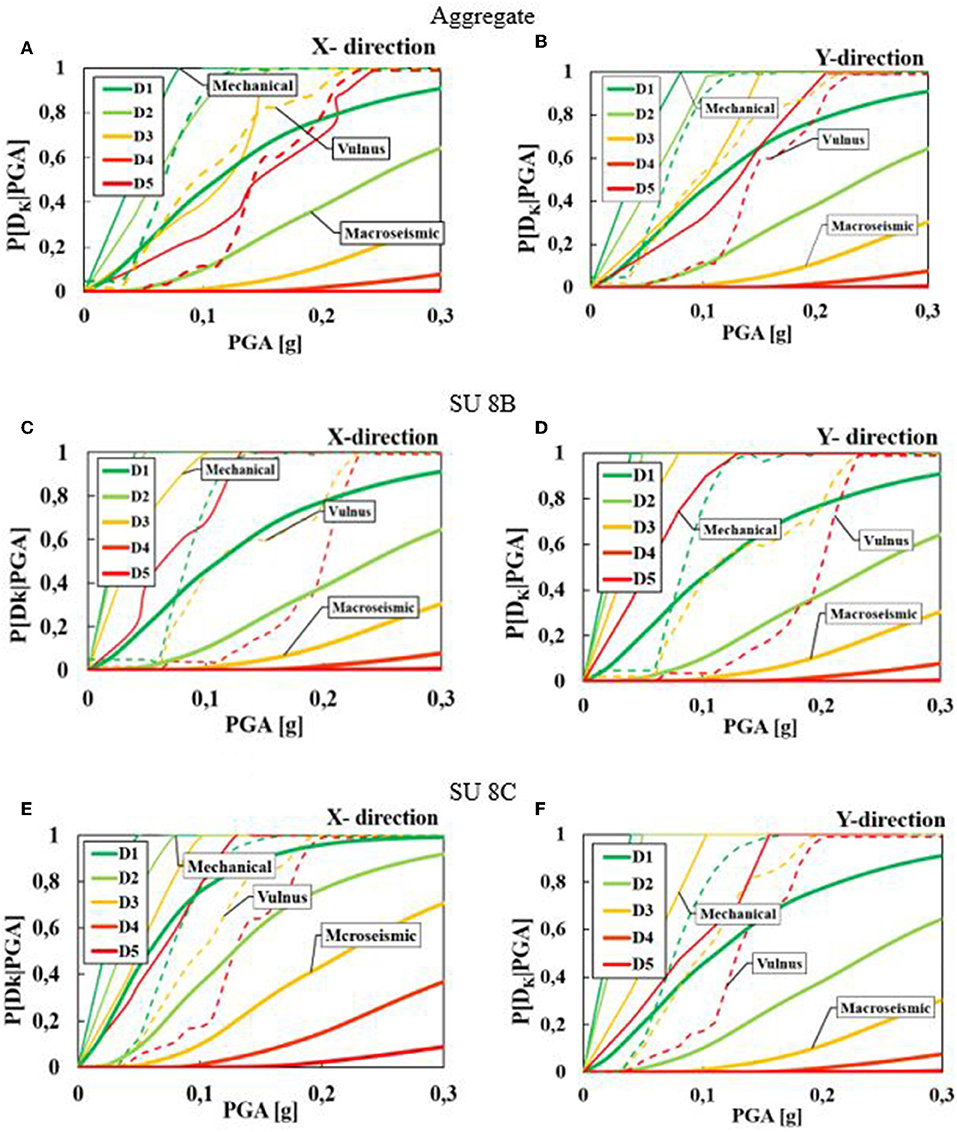
Figure 14. Comparison among examined vulnerability analysis methods in terms of fragility curves for Aggregate (A,B), SU 8B (C,D), SU 8C (E–F).
From comparison results, it is noticed that, in the case of aggregate condition, the mechanical procedure and the Vulnus method provide very similar results, while the macroseismic method underestimates the expected damage. In fact, for the sake of example, in X direction (Figure 14A) and similarly in Y one (Figure 14B), for an expected PGA of 0.25 g, referring to the damage threshold D4–D5 (collapse), the mechanical procedure and Vulnus give rise to a probability of occurrence equal to 60 and 65%, respectively, whereas the macroseismic method provides an almost zero probability.
On the contrary, for single SUs, a clear distinction among the curves of analyzed methodologies is noticed.
In fact, the most conservative approach is the mechanical one, which provides in X and Y directions much more restrictive values of the occurrence probability than those related to the other two methodologies. Particular attention must be paid to the SU 8C, since the occurrence probability values related to low damages derived from the Vulnus and the macroseismic procedures are very similar in the two directions (Figures 14E,F). On the contrary, for medium-high damage levels, the Vulnus procedure is on the safe side in predicting the occurrence probability values. Moreover, it is possible to note how the SU 8C is the most vulnerable at damage, since the initial slopes of the fragility functions are higher than the ones characterizing the curves obtained from the other methods.
Finally, the Vulnus fragility curves are placed in a middle range between the upper limit curves (mechanical method) and the lower limit ones (macroseismic approach) of the fragility domain.
The present study has allowed to compare the seismic vulnerability of a building aggregate located in the municipality of Arsita, hit by the 2009 L'Aquila earthquake, through three distinct procedures, namely the macroseismic approach, the Vulnus method and the mechanical non-linear macroelement analysis with the 3Muri software.
The first comparison has been made in terms of vulnerability index of the whole building compound achieved by the three proposed procedures. The vulnerability indexes of both the macroseismic analysis and the Vulnus method have been considered as the average values deriving from the single SUs indexes, in order to be compared with the results obtained from the mechanical methodology. The obtained comparison has provided similar results between the macroseismic method and the Vulnus one, but both of them have not been on the safe side if compared to those deriving from the 3Muri method. In fact, these latter values have been 16% and 36% higher than the average values of the two methodologies in X and Y directions, respectively.
Subsequently, the analysis of results has been also made in terms of fragility curves. In particular, fragility curves of the whole aggregate derived from analysis with 3Muri have been compared to those of single structural units. From achieved results, it is apparent that, for the whole building aggregate, the occurrence probability of predetermined damage states has been lesser than that of single SUs. Also, it has been noticed that the intermediate SU (8B) behaves better that the corner one (8C).
On the other hand, with reference to the comparison among the inspected methodologies in terms of expected damage, it has been obtained that, in case of aggregate condition, the mechanical procedure and the Vulnus method provide very similar results, while the macroseismic method underestimates the seismic damage. On the contrary, for single SUs, a clear distinction among the curves of analyzed methodologies is noticed. In fact, the most conservative approach is the mechanical one, which provides in X and Y directions much more restrictive values of the occurrence probability than those related to the other two methodologies. With reference to the SU 8C, it has been noticed that the damage occurrence probability related to the serviceability limit state derived from the Vulnus and the macroseismic procedures are very similar in the two analysis directions. On the contrary, for life safety and collapse limit states, the Vulnus procedure is on the safe side in predicting the occurrence probability values.
Moreover, the SU 8C has resulted to be the construction most vulnerable at damage, since the initial slopes of the fragility functions have been higher than those characterizing the curves obtained from the other methods. Finally, the 3Muri numerical results have been compared with the empirical fragility curve deriving from observed damages in the study area. From the comparison, it has been noticed that the 3Muri software is able to predict quite well the occurred damages in the longitudinal (X) direction only. Moreover, the numerical damages predicted for SU 8B are on the safe side if compared to those detected under observational way. Therefore, the achieved results have shown the difficulties in predicting safely from numerical point of view the seismic vulnerability of corner buildings.
In conclusion, from the results obtained using the proposed methods, it is clear that the mechanical approach gives more refined results in terms of expected damage than the other methods examined (empirical nature), of both clustered buildings and single SUs. On the other hand, the macroseismic method is a useful tool for large-scale vulnerability analysis of SUs of masonry aggregates, while it is not able to predict the damages suffered by historical center constructions under seismic actions. Intermediate results between those achieved with the aforementioned analysis approaches are obtained with the Vulnus method, which provides, if compared to the mechanical method fragility curves, an estimation of the expected damage for clustered buildings better than that achievable for single SUs.
The raw data supporting the conclusions of this manuscript will be made available by the authors, without undue reservation, to any qualified researcher.
AF: methodology and writing—review & editing. NC: investigation and writing—original draft preparation. NC and AF: data Curation.
The authors declare that the research was conducted in the absence of any commercial or financial relationships that could be construed as a potential conflict of interest.
The authors would like to acknowledge Dr. Marco Munari from the University of Padua, who allowed the use of the Vulnus program, providing very useful information for its application.
Ameri, G., Massa, M., Bindi, D., D'Alema, E., Gorini, A., Luzi, L., et al. (2009). The 6 April 2009 Mw 6.3 L'Aquila (Central Italy) earthquake: strong-motion observations. Seismol. Res. Lett. 80, 951–966. doi: 10.1785/gssrl.80.6.951
Azap, B., Apostol, I., Mosoarca, M., Chieffo, N., and Formisano, A. (2018). “Seismic vulnerability scenarios for historical areas of Timisoara,” in Proceedings of the 8th International Conference on Engineering Failure Analysis (Budapest: Elsevier), 4–9.
Azizi-Bondarabadi, H., Mendes, N., Lourenço, P. B., and Sadeghi, N. H. (2016). Empirical seismic vulnerability analysis for masonry buildings based on school buildings survey in Iran. Bull. Earthq. Eng. 14, 3195–3229. doi: 10.1007/s10518-016-9944-1
Barbieri, G., Biolzi, L., Bocciarelli, M., Fregonese, L., and Frigeri, A. (2013). Assessing the seismic vulnerability of a historical building. Eng. Struct. 57, 523–535. doi: 10.1016/j.engstruct.2013.09.045
Benedetti, D., and Petrini, V. (1984). Sulla vulnerabilità si sismica di edifici in muratura: un metodo di valutazione. L'Industria delle Costr.149, 66–74.
Bernardini, A., Gori, R., and Modena, C. (1990). “Application of coupled analytical models and experiential knowledge to seismic vulnerability analyses of masonry buildings,” in Earthquake Damage Evaluation and Vulnerability Analysis of Buildings Structures, ed A. Koridze (Oxon: INEEC, Omega Scientific, 161–180.
Boncio, P., Galli, P., Naso, G., and Pizzi, A. (2012). Zoning surface rupture hazard along normal faults: Insight from the 2009 Mw 6.3 L'Aquila, central Italy, earthquake and other global earthquakes. Bull. Seismol. Soc. Am. 102, 918–935. doi: 10.1785/0120100301
Borzi, B., Crowley, H., and Pinho, R. (2008). Simplified pushover-based earthquake loss assessment (SP-BELA) method for masonry buildings. Int. J. Archit. Herit. 2, 353–376. doi: 10.1080/15583050701828178
Brando, G., De Matteis, G., and Spacone, E. (2017). Predictive model for the seismic vulnerability assessment of small historic centres: application to the inner Abruzzi Region in Italy. Eng. Struct. 153, 81–96. doi: 10.1016/j.engstruct.2017.10.013
Calvi, G. M., Pinho, R., Magenes, G., Bommer, J. J., and Crowley, H. (2006). Development of seismic vulnerability assessment methodologies over the past 30 years. J. of Earthquake Tecn. 43, 75–104.
Cavaleri, L., Di Trapani, F., and Ferrotto, M. F. (2017). A new ibrid procedure for the definition of seismic vulnerability in Mediterranean cross-border urban areas. Nat. Hazards 86, 517–541. doi: 10.1007/s11069-016-2646-9
Chieffo, N., and Formisano, A. (2019). The influence of geo-hazard effects on the physical vulnerability assessment of built heritage: an application in a district of Naples. Buildings 9, 1–21. doi: 10.3390/buildings9010026
Chieffo, N., Formisano, A., and Ferreira, T. M. (2019). Damage scenario-based approach and retrofitting strategies for seismic risk mitigation: an application to the historical Centre of Sant'Antimo (Italy). Euro. J. Environ. Civil Eng. doi: 10.1080/19648189.2019.1596164
Chieffo, N., Mosoarca, M., Formisano, A., and Apostol, I. (2018). “Seismic vulnerability assessment and loss estimation of an urban district of Timisoara,” in Proceeding of 3rd World Multidisciplinary Civil Engineering, Architecture, Urban Planning Symposium (Prague: WMCAUS), 1–10.
Da Porto, F., Munari, M., Prota, A., and Modena, C. (2013). Analysis and repair of clustered buildings: case study of a block in the historic city centre of L'Aquila (Central Italy). Constr. Build. Mater. 38, 1221–1237. doi: 10.1016/j.conbuildmat.2012.09.108
Da Porto, F., Valluzzi, M. R., Munari, M., Modena, C., Arede, A., and Costa, A. A. (2018). “Strengthening of brick and stone masonry buildings,” in Strengthening and Retrofitting of Existing Structures, Vol. 9, eds A. Costa, A. Arede, and H. Varum (Singapore: Springer Nature), 59–84.
D'Agostino, N., Mantenuto, S., D'Anastasio, E., Giuliani, R., Mattone, M., Calcaterra, S., et al. (2011). Evidence for localized active extension in the central Apennines (Italy) from global positioning system observations. Geology 39, 291–294. doi: 10.1130/G31796.1
D'Ayala, D. F., and Paganoni, S. (2011). Assessment and analysis of damage in L'Aquila historic city centre after 6th April 2009. Bull. Earthq. Eng. 9, 81–104. doi: 10.1007/s10518-010-9224-4
Eurocode 8 (2005). European Standard EN 1998-3:2005: Design of structures for earthquake resistance - Part 3: Assessment and retrofitting of buildings. Brussels: Com. Eur. Norm.
Fava, M., Munari, M., Da Porto, F., and Modena, C. (2016). “Seismic vulnerability assessment of existing masonry buildings by nonlinear static analyses and fragility curves,” in Brick and Block Masonry: Trends, Innovations and Challenges: Proceedings of the 16th International Brick and Block Masonry Conference (Padua: IBMAC), 2409–2416. doi: 10.1201/b21889-315
Ferreira, T. M., Vicente, R., Mendes da Silva, J. A. R., Varum, H., and Costa, A. (2013). Seismic vulnerability assessment of historical urban centres: case study of the old city centre in Seixal, Portugal. Bull. Earthq. Eng. 11, 1735–1773. doi: 10.1007/s10518-013-9447-2
Ferreira, T. M., Vicente, R., and Varum, H. (2012). “Vulnerability assessment of building aggregates: a macroseimic approach,” in Proceedings of the 15th World Conference on Earthquake Engineering (Lisbon: WCEE), 2–9.
Formisano, A. (2017a). Local- and global-scale seismic analyses of historical masonry compounds in San Pio delle Camere (L'Aquila, Italy). Nat. Hazards 86, 465–487. doi: 10.1007/s11069-016-2694-1
Formisano, A. (2017b). Theoretical and numerical seismic analysis of masonry building aggregates: case studies in San Pio Delle Camere (L'Aquila, Italy). J. Earthq. Eng. 21, 227–245. doi: 10.1080/13632469.2016.1172376
Formisano, A., Castaldo, C., and Mazzolani, F. M. (2013). “Non-linear analysis of masonry building compounds: a comparison of numerical and theoretical results,” Civil-Comp Proceedings (Stirlingshire). doi: 10.4203/ccp.102.66
Formisano, A., and Chieffo, N. (2018a). Expected seismic risk in a district of the Sant'Antimo's historical centre. Trends Civ. Eng. its Archit. 2, 1–15. doi: 10.32474/TCEIA.2018.02.000130
Formisano, A., and Chieffo, N. (2018b). Non-linear static analyses on an Italian masonry housing building through different calculation software packages. Int. J. Energy Environ. 12, 30–40.
Formisano, A., Chieffo, N., Monaco, D., and Fabbrocino, F. (2016). On the influence of the aggregate condition on the vibration period of masonry buildings: a case study in the district of Naples. AIP Conf. Proc. 1790:130005. doi: 10.1063/1.4968723
Formisano, A., Chieffo, N., and Mosoarca, M. (2017). Seismic vulnerability and damage speedy estimation of an urban sector within the mucipality of San Potito Sannitico (Caserta, Italy). Open Civ. Eng. J. 11, 1106–1121. doi: 10.2174/1874149501711011106
Formisano, A., Florio, G., Landolfo, R., and Mazzolani, F. M. (2011). “Numerical calibration of a simplified procedure for the seismic behaviour assessment of masonry building aggregates,” Proceedings of 13th International Conference on Civil, Structure and Environmental Engineering Computating (Stirlingshire).
Formisano, A., Florio, G., Landolfo, R., and Mazzolani, F. M. (2015). Numerical calibration of an easy method for seismic behaviour assessment on large scale of masonry building aggregates. Adv. Eng. Softw. 80, 116–138. doi: 10.1016/j.advengsoft.2014.09.013
Formisano, A., and Massimilla, A. (2018). A novel procedure for simplified nonlinear numerical modeling of structural units in masonry aggregates. Int. J. Archit. Herit. 12, 1162–1170. doi: 10.1080/15583058.2018.1503365
Galli, P. A. C., and Naso, J. A. (2009). Unmasking the 1349 earthquake source (southern Italy): paleoseismological and archaeoseismological indications from the Aquae Iuliae fault. J. Struct. Geol. 31, 128–149. doi: 10.1016/j.jsg.2008.09.007
Grünthal, G (Ed.). (1998). Chaiers du Centre Européen de Géodynamique et de Séismologie, Vol. 15. Luxembourg: European Center for Geodynamics and Seismology.
Guagenti, E., and Petrini, V. (1989). “The case of old buildings: towards a new law - intensity damage,” in Proceedings of the 12th Italian conference on earthquake engineering—ANIDIS (Pisa: Italian National Association of Earthquake Engineering).
Indirli, M., Bruni, S., Candigliota, E., Geremei, F., Immordino, F., and Moretti, L. (2012). “Assessment of historic centres through a multidisciplinary approach based on the simultaneous application of Remote Sensing, GIS and quick procedures for survey and vulnerability evaluation : the Arsita case,” in Proceeding of the Conference EACH 2011, 5th International Congress on “Science Technology for the Safeguard of Culture Heritage in the Mediterranean Basin” (Istanbul), 1–13.
Indirli, M., Bruni, S., Geremei, F., Marghella, G., Marzo, A., Moretti, L., et al. (2014). “The reconstruction plan of the town of Arsita after the 2009 Abruzzo (Italy) seismic event,” in Proceedings of the 9th International Conference on Structural Analysis of Historical Constructions - SAHC2014 (Mexico City).
Kappos, A. J., Panagopoulos, G., Panagiotopoulos, C., and Penelis, G. (2006). A hybrid method for the vulnerability assessment of R/C and URM buildings. Bull. Earthq. Eng. 4, 391–413. doi: 10.1007/s10518-006-9023-0
Lagomarsino, S. (2006). On the vulnerability assessment of monumental buildings. Bull. Earthq. Eng. 4, 445–463. doi: 10.1007/s10518-006-9025-y
Lagomarsino, S. (2012). Damage assessment of churches after L'Aquila earthquake (2009). Bull. Earthq. Eng. 10, 73–92. doi: 10.1007/s10518-011-9307-x
Lagomarsino, S., and Cattari, S. (2014). Fragility Functions of Masonry Buildings. Geotech. Geol. Earthq. Eng. 27, 111–156. doi: 10.1007/978-94-007-7872-6_5
Lagomarsino, S., and Giovinazzi, S. (2006). Macroseismic and mechanical models for the vulnerability and damage assessment of current buildings. Bull. Earthq. Eng. 4, 415–443. doi: 10.1007/s10518-006-9024-z
Lourenço, P. B., and Roque, J. A. (2006). Simplified indexes for the seismic vulnerability of ancient masonry buildings. Constr. Build. Mater. 4, 200–208. doi: 10.1016/j.conbuildmat.2005.08.027
M.D. 17 January 2018 (2018). Updating of Technical Codes for Constructions, Official Gazette n. 42 of 20/02/18, Ordinary Supplement n. 8.
M.D. 2 February 2009 (2009). Instructions for the application of the ≪New technical standards for buildings≫ referred to in the Ministerial Decree of 14 January 2008, Official Gazette n.47 of 26/02/2009, Ordinary Supplement n. 27.
Munari, M., Valluzzi, M. R., Cardani, G., Anzani, A., Binda, L., and Modena, C. (2010). “Seismic vulnerability analyses of masonry aggregate buildings in the historical centre of Sulmona (Italy),” in Proceeding 13th International Conference on Structural Faults and Repair (Edinburgh), 1–10.
National Institute of Geophysics Vulcanology (2009). La Sequenza Sismica de L'Aquilano - Aprile 2009. Available online at: http://terremoti.ingv.it/en/component/content/article/13-eventi/approfondimenti/710-la-sequenza-sismica-de-laquilano-aprile-2009.html
OPCM, 3274/2003. (2003). Primi Elementi in Materia di Criteri Generali per la Classificazione Sismica del Territorio Nazionale e di Normative Tecniche per le Costruzioni in Zona Sismica. Rome.
Penna, A., Morandi, P., Rota, M., Manzini, C. F., da Porto, F., and Magenes, G. (2014). Performance of masonry buildings during the Emilia 2012 earthquake. Bull. Earthq. Eng. 12, 2255–2273. doi: 10.1007/s10518-013-9496-6
Pujades, L. G., Barbat, A. H., González-Drigo, R., Avila, J., and Lagomarsino, S. (2012). Seismic performance of a block of buildings representative of the typical construction in the Eixample district in Barcelona (Spain). Bull. Earthq. Eng. 10, 331–349. doi: 10.1007/s10518-010-9207-5
Ramos, L. F., and Lourenço, P. B. (2004). Modeling and vulnerability of historical city centers in seismic areas: A case study in Lisbon. Eng. Struct. 26, 1295–1310. doi: 10.1016/j.engstruct.2004.04.008
Tiberti, S., and Milani, G. (2017). Historic city centers after destructive seismic events, the case of finale Emilia during the 2012 Emilia-Romagna earthquake: Advanced numerical modelling on four case studies. Open Civ. Eng. J. 11, 1059–1078. doi: 10.2174/1874149501711011059
Valluzzi, M. R., Cardani, G., Binda, L., and Modena, C. (2004). “Seismic vulnerability methods for masonry buildings in historical centres: validation and application for prediction analyses and intervention proposals,” in Proceeding of 13th World Conference on Earthquake Engineering (Vancouver, BC: WCEE), 2–12.
Keywords: masonry aggregates, vulnerability assessment, macroseismic method, Vulnus method, mechanical method, non-linear analysis, fragility curves
Citation: Chieffo N and Formisano A (2019) Comparative Seismic Assessment Methods for Masonry Building Aggregates: A Case Study. Front. Built Environ. 5:123. doi: 10.3389/fbuil.2019.00123
Received: 15 February 2019; Accepted: 03 October 2019;
Published: 18 October 2019.
Edited by:
Massimiliano Pittore, Helmholtz Centre Potsdam, GermanyReviewed by:
Fabio Di Trapani, Politecnico di Torino, ItalyCopyright © 2019 Chieffo and Formisano. This is an open-access article distributed under the terms of the Creative Commons Attribution License (CC BY). The use, distribution or reproduction in other forums is permitted, provided the original author(s) and the copyright owner(s) are credited and that the original publication in this journal is cited, in accordance with accepted academic practice. No use, distribution or reproduction is permitted which does not comply with these terms.
*Correspondence: Nicola Chieffo, bmljb2xhLmNoaWVmZm9Ac3R1ZGVudC51cHQucm8=
Disclaimer: All claims expressed in this article are solely those of the authors and do not necessarily represent those of their affiliated organizations, or those of the publisher, the editors and the reviewers. Any product that may be evaluated in this article or claim that may be made by its manufacturer is not guaranteed or endorsed by the publisher.
Research integrity at Frontiers

Learn more about the work of our research integrity team to safeguard the quality of each article we publish.