 Marc Wenner1
 Gregor Schacht
94% of researchers rate our articles as excellent or good
Learn more about the work of our research integrity team to safeguard the quality of each article we publish.
Find out more
ORIGINAL RESEARCH article
Front. Built Environ. , 10 April 2019
Sec. Bridge Engineering
Volume 5 - 2019 | https://doi.org/10.3389/fbuil.2019.00045
This article is part of the Research Topic Diagnostic and Proof Load Tests on Bridges View all 16 articles
Track–bridge interaction plays a decisive role in the design of long railway bridges due to the high braking and acceleration forces that occur and the fact that the continuous rail is attached to the superstructure. A fundamental parameter for the calculation of the effects of track–bridge interaction is the equivalent longitudinal stiffness of piers and abutments with fixed bearings. The equivalent horizontal stiffness is commonly calculated using a pile group model. The static and “dynamic” stiffnesses of the Itz valley railway viaduct were determined experimentally by using a static diagnostic load test and a braking test, which allowed for the verification of the additional rail stresses and the bearing forces with realistic input parameters. Furthermore, numerical 3D FE analyses of the deep foundation system were carried out to provide class-A predictions of the experimental results. In this article, the experimental setup and the execution and evaluation of the two tests are presented. A comparison of the experimental results and the numerical predictions is also carried out.
In the design of railway bridges, the higher traffic loads, greater braking, and acceleration forces than those in road bridges, and the small allowable deflections play a decisive role. The bridge dynamics and track–structure interaction represent governing criteria in the design process of railway bridges (Marx and Geißler, 2010; Marx and Seidl, 2011; Marx and Schneider, 2014; Wenner et al., 2018, 2019). The ballasted or non-ballasted track provides the connection between the track and the structure. When thermal deformations occur in the bridge or longitudinal displacements take place in the superstructure due to vehicles braking or accelerating, the track and structure interact and jointly contribute to transferring the longitudinal loads (Wenner et al., 2016a,b). This leads to additional rail stresses and bearing forces, as well as deformations, which have to be determined analytically and compared with the limit values stipulated in the relevant standard.
To ensure compatibility between the rails and the bridge structure and to limit the magnitude of the rail stresses, several parameters can be varied during the design. The design of the track superstructure (type of track superstructure, properties of the components, presence of rail expansion joints), the superstructure length, and the equivalent horizontal spring stiffness in the longitudinal direction of the substructures (which consist of piers and pile caps, bored piles, and the surrounding soil) are the biggest influencing factors. This equivalent horizontal spring stiffness will henceforth be referred to as “substructure stiffness.”
Stiff substructures generally reduce the stress experienced by the track superstructure and are therefore desirable. Even though the rail stresses caused by the thermal deformations of the bridge can increase due to stiff substructures, such substructures attract the braking and acceleration forces, thereby reducing rail stresses and allowing for low-deformation longitudinal load transfer. However, the effective substructure stiffness is often underestimated in structural analysis. In order to develop a more economic design or assess the state of an existing structure, it may be necessary to carry out a more detailed investigation of the substructure stiffness and a more precise calculation of the stresses in the rails and structure.
During the detailed design of the non-ballasted track of the Itz valley railway viaduct (Figure 1) it was discovered that the rail stresses exceed the allowable stresses by a large margin. As the values of the analytically determined rail stresses react very sensitively to the assumed longitudinal substructure stiffness and a greater stiffness would reduce the magnitude of the rail stresses, it was decided to determine the actual longitudinal stiffness of the substructures experimentally. It is known that the soil reacts a great deal more stiffly under short-term than quasi-static loading [see also Ril 804.3401, section 6(2)]. For this reason, both static tests (see section Static Diagnostic Load Test) and braking tests (see section Braking Test) were carried out and accompanied by detailed numerical analyses.
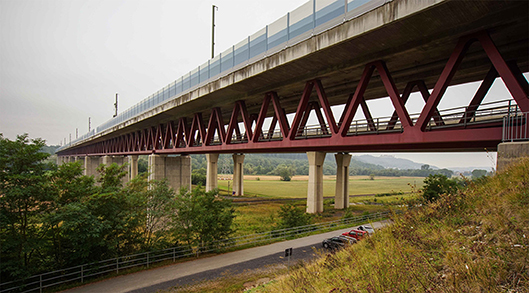
Figure 1. Itz valley railway viaduct. The motorway viaduct of the A 73 runs parallel to the railway viaduct (in the background). Reproduced from Wenner et al. (2019) with permission from [Ludolf Krontal].
The Itz valley railway viaduct is part of the new high-speed rail line between Ebensfeld (Bavaria) and Erfurt (Thuringia); see Figure 1. The 868-m structure spans across the Itz valley, the Coburg–Sonneberg rail line, and several roads near Rödental (Bavaria) at a height of ~25 m.
The structure has 15 spans, each 57 m long, and consists of six 2-span and one 3-span superstructure segments; see Figure 2. The railway bridge, which was erected in 2005, is a steel–concrete composite structure, in which two steel trusses at a mutual distance of 6.20 m support the reinforced concrete deck. The track superstructure was executed as non-ballasted track. The structure was intended to have continuous tracks along its entire length, without any expansion joints.
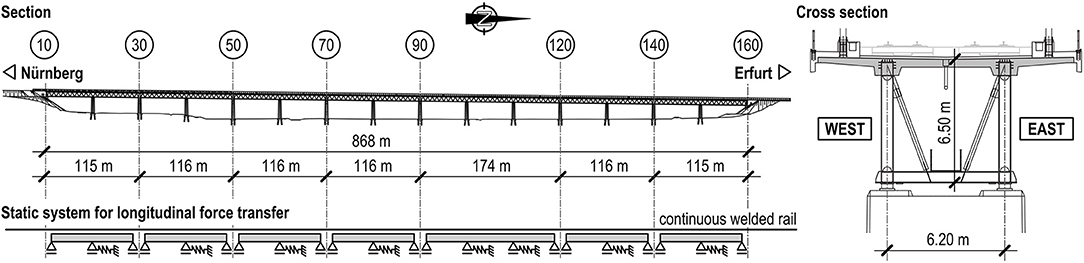
Figure 2. Longitudinal section, cross section, and static system of the Itz valley railway viaduct.
The piers in the middle of the two-span superstructure segments serve as longitudinally fixed points for these segments. The three-span superstructure segment has two longitudinally fixed points (at axes 100 and 110) and is therefore statically indeterminate. The reinforced concrete piers have a box cross section. They are founded on inclined large bored piles with pile caps; see Figure 3.
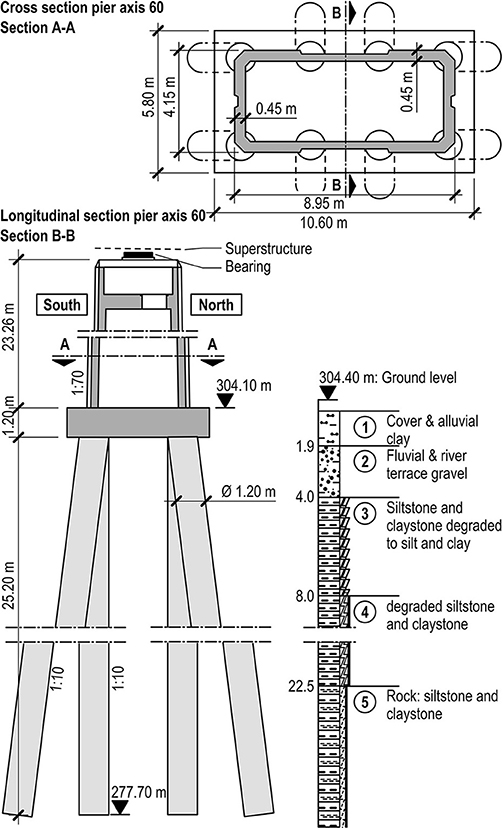
Figure 3. Geometry and dimensions of the pier and foundation and characteristics of the soil at axis 60 (Wenner et al., 2019).
The bridge site is located in the main block of southern Germany (Süddeutsche Großscholle), which consists of Mesozoic rock. The deeper region of the subsoil consists of various types of the slightly weathered clay- and siltstone of the Lehrbergschichten, and is covered by cover and riverine loam, as well as by river and bench gravel. The piles of the deep foundation extend into load-bearing material, either rock or slightly weathered clay- and siltstone, which, depending on the axis, is found at depths from 14 to 29 m. The subsoil layers at axis 60 are shown in Figure 3 as an example.
The goal of the test was to determine the stiffness of the substructure (piles and foundation) in the longitudinal direction of the bridge for all fixed points in order to obtain the most realistic parameters possible for verifying that the rail stresses do not exceed the allowable values. The measurement concept was designed to generate horizontal forces in the piles and measure the resulting pile deformations, so that the load–deformation behavior could be used to calculate the equivalent global spring stiffnesses of the deep foundation systems and piles (referred to as “substructure stiffness” in this paper).
The longitudinal forces in the bridge superstructure were generated by two hydraulic presses positioned in the gaps between the bottom flanges of two neighboring superstructure segments. The applied forces were recorded with load cells; see Figure 4B. The presses were used to introduce forces of equal magnitude in the two superstructures. The forces were transferred through the superstructure segments and generated stresses in the adjacent, longitudinally fixed piers.
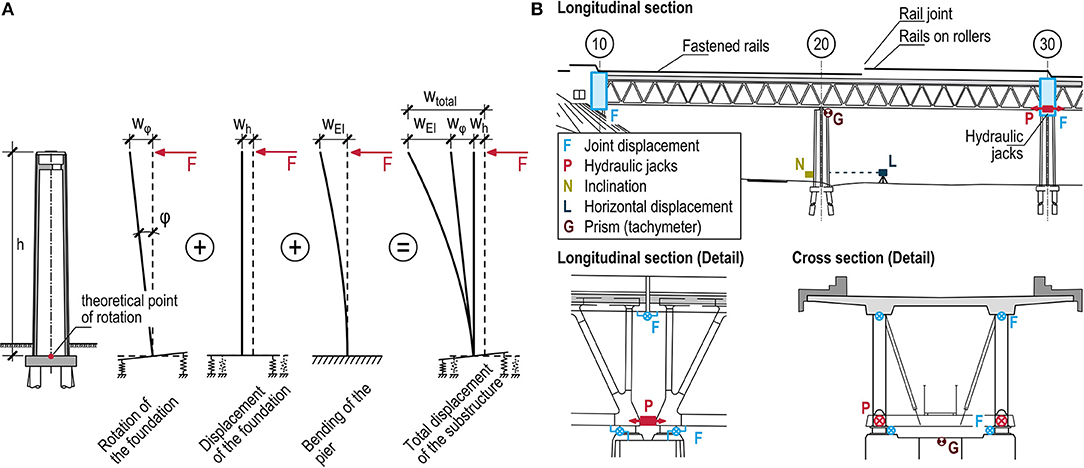
Figure 4. (A) Components of the pier head deformation. (B) Schematic of the test setup at axis 30.
The pier head displacement required to determine the substructure stiffness is comprised of several components (see also Figure 4A)
- Tilt of the foundation wϕ.
- Displacement of the foundation wh.
- Bending of the pier wEI.
To evaluate the results and compare the analytical and measurement results, the displacement of the pier head needs to be recorded and a separation of the displacement components must be carried out. To measure the deformations and displacements, the following measures were taken (Figure 4B):
- Measurement of the relative longitudinal displacements and rotations of the structure, using six displacement sensors in each of the eight joints of the superstructure.
- Determination of the absolute pier head displacement through geodetic measurements, using a tachymeter and prisms.
- Measurement of the bearing play of the fixed bearings at the fixed points.
- Measurement of the tilt of the pier at its bottom, using an inclination sensor just above ground level.
- Measurement of the displacement of the pier at its bottom by using a laser distance sensor positioned at a distance of about 10 m from the pier and outside the zone affected by subsoil movements.
To avoid overloading the structure during the test, the longitudinal force to be introduced was limited to 80% of the characteristic bearing loads assumed in the design of the structure (2 · 1.25 MN).
In preparation for the monitoring of the tests, FE analyses of the various subtests were carried out and expected values for loads and deformations were extracted. The exceeding of the expected values, disproportionate changes in forces or displacements during load application, and a larger-than-expected difference in the forces of the two hydraulic presses were defined as abort criteria.
This kind of real-scale test is very rarely executed. A similar test, carried out on the Sinntalbrücke Schaippach bridge on the Hanover–Würzburg rail line (Kempfert and Schwarz, 1984), has been reported in the literature. These tests were executed during the construction stage—the superstructure had not yet been built and the piers were thus not loaded.
A special load application construction was used to uniformly introduce the longitudinal forces, which reached magnitudes up to 1.25 MN, into the protruding web plates of the box-section bottom chords; see Figure 5A.
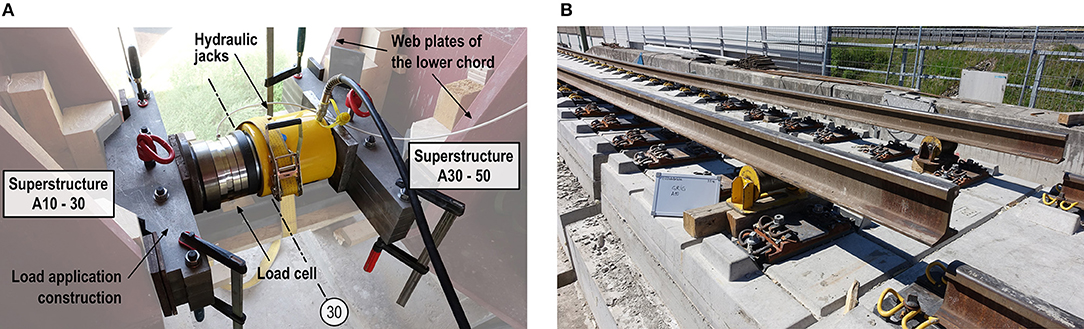
Figure 5. (A) Hydraulic press, load cell, and load application construction. Source: Marc Wenner. (B) Rails close to the bridge joint were released to decouple the neighboring superstructure segments. Reproduced from Wenner et al. (2019) with permission from [Marc Wenner].
Six subtests were carried out to investigate the forces on the longitudinally fixed piers. To do this, load was applied to the longitudinally fixed pier closest to the press, so that the substructure stiffness for this pier could be determined. After each subtest the presses were removed, transported along the maintenance gantry to their next location between superstructure segments and installed.
The superstructure segments are linked longitudinally by the rails. To avoid the rails transferring an unknown part of the forces introduced into the superstructure, the rail joints above the location of the press and at the joints of the neighboring superstructure segments were opened during the tests. This ensured that the longitudinal force was transferred exclusively by the structure (see also Figure 5A). As the track superstructure was still under construction at the time of testing and not all rail segments had yet been welded together, the rail fasteners of the four rails in between the three relevant axes and up to the closest rail gap/fishplates were released in each subtest, and the rails were placed on rollers (Figure 5B).
Each subtest consisted of various load cycles (LZ), as shown in Figure 6A. During the first load cycle, the target load was carefully approached in several steps. At each step, the plausibility of the measurements was checked and the behavior was compared with the expected values. In load cycles two and three the same target load was applied, however using fewer load steps in order to generate a statistically sound basis. In the fourth, and last, load cycle, the load application rate was increased significantly. The force was applied with the full power of the hydraulic press, and for unloading the hydraulic pipes were opened rapidly. The unloading process lasted ~5 s and was intended to represent the quasi-dynamic load case. The measurement data was acquired with a sample rate of 1 Hz. The geodetic measurements were carried out during each load break, as shown in Figure 6A.
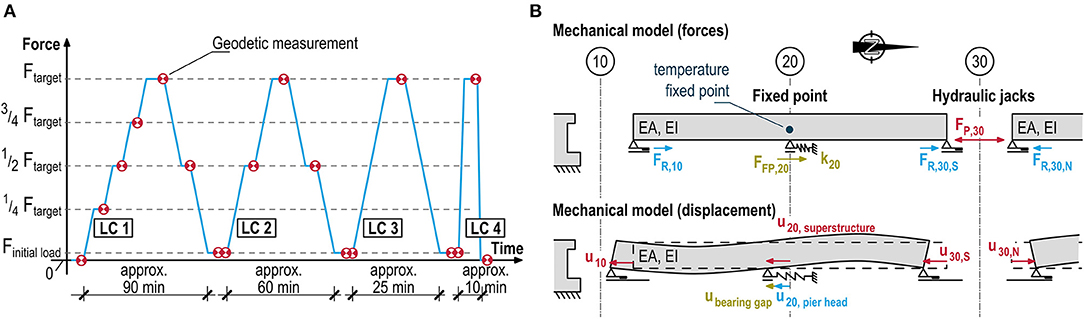
Figure 6. (A) Schematic diagram of the load cycles (LZ). (B) Mechanical model for analyzing the resulting forces and displacements.
To monitor and control the test, the governing control parameters (press force, expansion joint, and pier deformations) were visualized on two screens in real time. It was thus possible to compare the measurement results with the independent geodetic measurements and the expected values while the test was being executed, so that the test could be aborted if unusual behavior was observed or one of the abort criteria defined in section Modeling of the Foundation to Predict the Substructure Stiffness was fulfilled.
The stiffness with respect to the bottom edge of the superstructure is an important parameter for the calculation of the track–structure interaction. This stiffness differs from the stiffness with respect to the pier head by the active bearing displacement (bearing play and elastic deformation), which was also measured.
It was not possible to directly measure the fixed point displacements and forces which were required for the calculation of the substructure stiffnesses. Therefore, these parameters were determined using a mechanical model as shown in Figure 6B, using the executed measurements and reasonable assumptions for the superstructure deformations.
Using the subtest with the presses located at axis 30 as an example, the model and approach are presented. The following forces act at axis 30: the press forces (FP, 0), which push apart the bottom chords of the two neighboring superstructure segments, and the friction forces (FR,30), which are activated due to the displacement of the superstructure on the sliding bearings and act in the opposite direction of the press force. Identical friction forces occur in the sliding bearings at axis 10 (FR,10) and axis 50 (FR,50). These were determined from the hysteresis loop in the load–deformation diagram shown in Figure 7A. The fixed point forces in axes 20 and 40 (FFP,20 and FFP,40) can be obtained from the appropriate force equilibria of the respective partial systems.
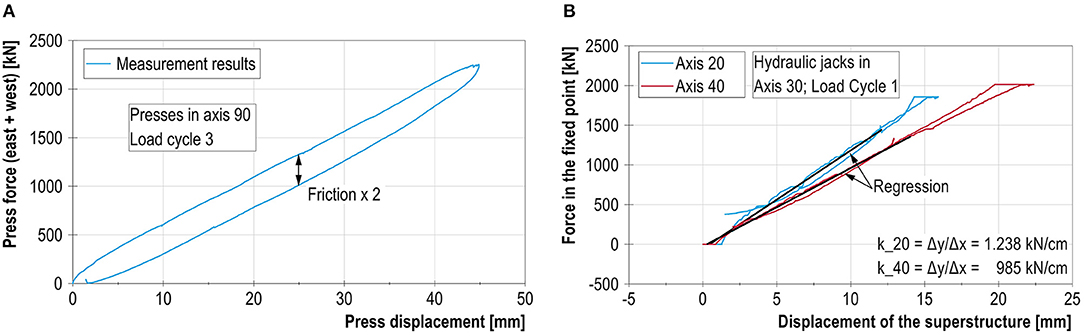
Figure 7. (A) Determination of the friction in the sliding bearings. (B) Determination of the stiffnesses of the piers at axes 20 and 40 during load cycle 1.
The fixed point displacements at the level of the bottom chord are calculated from the displacements of the superstructure joints (measured inside the joints). The measurements contain other displacement and deformation components which must be taken into account. Due to the flexural and tensile stiffness of the bridge girders and the localized and eccentric load introduction into the bottom chords of the superstructure segments, a shortening of the superstructure and twisting of the cross sections occur, as shown schematically in Figure 6B. To determine these components, a numerical analysis simulating the press force load case is carried out, which allows a combined evaluation of the measurement and calculation data. Thermal deformations, occurring because of the long duration of the tests and the temperature load on the steel bottom chords due to solar radiation, must also be taken into account. The results of the geodetic measurements were used for plausibilization purposes. The calculated and measured displacement agree very well with each other (see, for example, Figure 8), thereby confirming the suitability of the applied methodology.
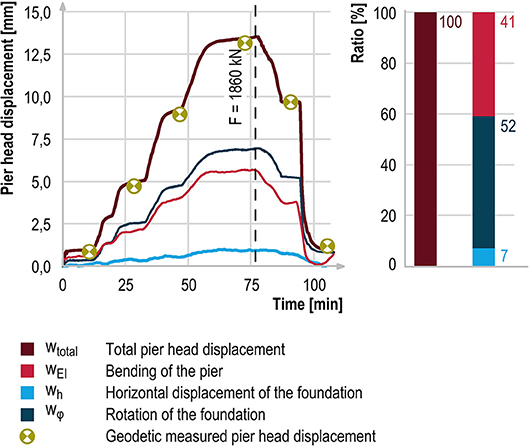
Figure 8. Components of the pier head deformation at axis 20 (hydraulic presses located at axis 30).
Using the measured force acting at the fixed point and the corresponding deformation of the superstructure at the same location (above the fixed point), the substructure stiffnesses for each individual fixed pier can be determined (shown in Figure 7B for axes 20 and 40). The curve is nearly linear, and the stiffness is higher for small displacements (up to 2 mm). A higher stiffness was also observed at the beginning of the unloading process in load cycle 4, in which the force decreased very rapidly.
The results are presented in section Comparison of the Experimental and Analytical Results and compared with the results of the three-dimensional finite element analyses.
A further goal of the test was the separation of the deformation components of the pier head displacements (see also Figure 4A) in order to assess the causes of possible differences with respect to the 3D FE model.
During the tests, the tilt and displacement of each foundation was measured directly with an inclination sensor or a laser distance sensor. It should be noted that due to the presence of backfill both the laser distance sensor and the inclination sensor were located above the top edge of the foundation and the analytical pivot point; see Figure 4A. The measurement results had to be adjusted to exclude the components due to bending and twisting and converted to refer to the top edge of the foundation. The component due to bending of the pier wEI was determined from the remaining amount (wtotal-wϕ-wh). The plausibility and quality of the evaluation process are confirmed by the good agreement between wEI and the analytical deformation of the cantilever beam. As an example, the separated components for pier axis 20 (which was used to illustrate the approach for determining the stiffnesses) are shown in Figure 8. The pier head displacement is 13.5 mm; the corresponding fixed point force is 1,860 kN. The smallest contribution (7%) is made by the direct horizontal displacement of the pier. The bending of the pier accounts for 41% of the total deformation, and the tilting of the foundation has the largest influence on the deformation (52%).
In geotechnical practice, two different approaches are generally used to analytically determine the equivalent spring stiffnesses of pile foundation systems (Figure 9).
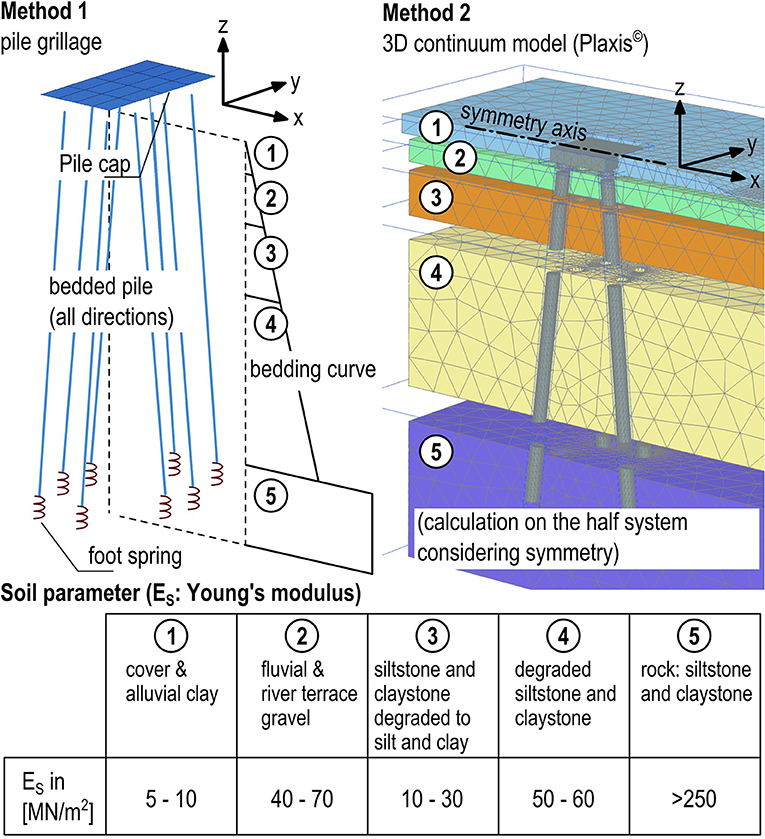
Figure 9. Comparison of the two methods for the calculation of the deep foundation stiffness.
One approach uses FE programs to analyse pile groups modeled as frameworks, in which the subsoil in the vicinity of the piles and underneath the pile group cap (if applicable) is taken into account by using elastic foundation approaches based on empirical values (method 1). The elastic foundation approaches for piles generally assume that the foundation stiffness varies with the depth, while a constant foundation stiffness is assumed underneath the foundation. It is well known that the subsoil reaction depends on the occurring displacement if the subsoil is subjected to loads generated by piles or pile caps. This can be accounted for by iteratively adjusting the foundation approaches. Information on this topic can be found in the publication EA Pfähle (Deutsche Gesellschaft für Geotechnik [Hrsg.], 2012), for example.
Alternatively, when using the finite element method (FEM) or the finite difference method (FDM) in the area of foundation engineering, the subsoil is modeled with continuum elements. Combined with a suitable material model and contact formulations for the interfaces between the subsoil and reinforced concrete structural elements, their interaction under load can be modeled realistically (method 2). To achieve this, the material model should reflect at least the fundamental soil-physical properties of stress dependence, history dependence, and deformation dependence (“small strain stiffness”) of the Young's and shear moduli.
The calculation results obtained with this method also include the load- and displacement-dependent elastic foundation stiffnesses of the piles and pile group cap. If, for example, the deep foundation of bridge piles in uneven/inclined terrain is to be investigated, a realistic consideration of this influence is only possible with method 2.
In this investigation, both approaches were used to provide class-A predictions, i.e., the analytical load–deformation predictions were determined prior to the execution of the diagnostic load tests. For method 1, a pile group program was used to carry out the static analysis of the existing structure. The calculations according to method 2 were executed with the software Plaxis® 3D.
The analytical results for the tilting and displacement and the results of the diagnostic load test are illustrated in Figure 10 for pier axis 40. Furthermore, a comparison of the resulting global stiffnesses at the level of the bottom edge of the substructure is shown in Table 1.
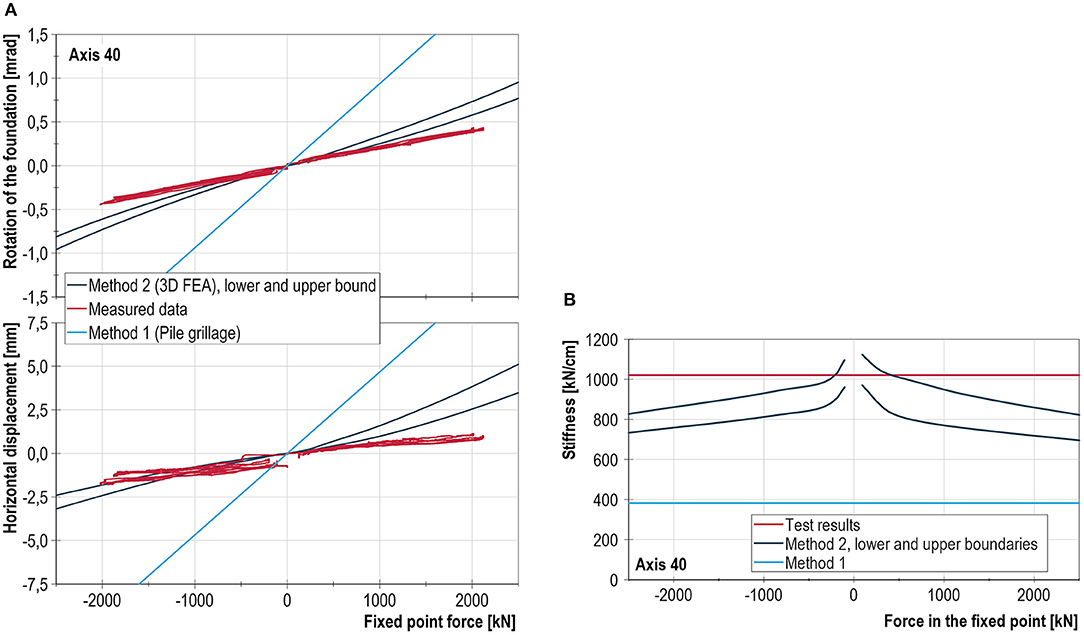
Figure 10. (A) Comparison between measured and calculated displacements and rotation of the foundation at axis 40. (B). Comparison between the measured and calculated stiffness of the substructure at axis 40.
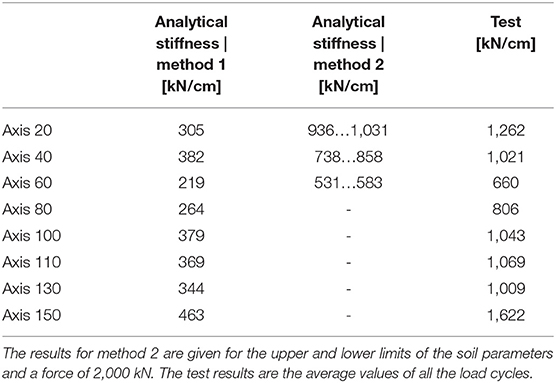
Table 1. Comparison of the stiffnesses.
The conclusions drawn from the comparison of the analytical and experimental results are as follows:
- The pile group method (method 1) with piles on a horizontal elastic foundation yields significantly lower stiffnesses than the in-situ tests and the FE analyses of method 2. The experimentally determined stiffnesses of the shorter piles in axes 20 and 150 are 250 and 310% higher, respectively, than the stiffnesses obtained with method 1. The stiffnesses of the longer piles are underestimated by about 170 to 200%. Whether these results can be considered to be conservative depends on the type of verification to be carried out. A lower stiffness leads to an overestimation of the rail stresses due to braking and an underestimation of the bearing forces.
- The calculations according to method 2 yield a load- (and hence deformation-) dependent, nonlinear, and slightly direction-dependent behavior of the resulting equivalent horizontal spring stiffnesses. As expected, the stiffnesses for smaller displacements are larger than those for larger displacements. The direction-dependency (see Figure 11) is due to the topology of the terrain. In the test, however, this strong nonlinearity was not observed (see Figure 10).
- The results of the 3D FE analysis according to method 2, in which characteristic values based on the information from the geotechnical report (upper limit) were used, agree with the evaluation results of the static diagnostic load tests of the three analytically investigated pier axes (20, 40, and 60). In the tests, the foundation reacted more stiffly to higher fixed point forces than predicted with method 2.
- The good agreement between the numerical results of method 2 and the evaluation results of the static in-situ diagnostic load tests can be considered as a validation of this approach for the analytical determination of equivalent spring stiffnesses. Even so, the quality of the results still depends on the quality of the geotechnical survey and its interpretation for deriving the soil-mechanical parameters.
- When the maximum press force was kept constant during 30 min of the static in-situ diagnostic load tests, additional displacements of up to ~1 mm were measured. Due to the project-specific boundary conditions and time constraints it was not possible to maintain the load at this level until the displacements became negligibly small.
- Deep foundations located in saturated fine-grained soil, such as those of the presented bridge, and subjected to long-term unidirectional load, can experience additional horizontal fixed point displacements due to the consolidation and creep of the subsoil. This results in a decrease in bearing stiffness over time, which has not been considered in the experimental and analytical investigations carried out to date. With method 2 it is possible, in principle, to consider deformations due to consolidation and creep effects in the analysis. To take into account creep effects, however, more detailed material models and appropriate expertise for determining the model parameters are required.
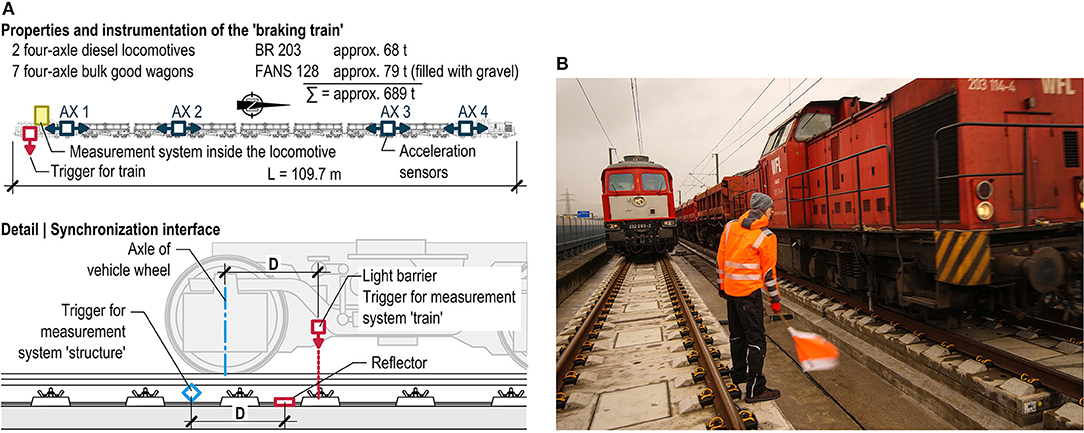
Figure 11. (A) Arrangement of the measurement devices on the train and synchronization of the measurement systems on the train and the bridge. (B) Braking train on the first track, stationary train on the other track located in the area of the bridge joint. Reproduced from Wenner et al. (2019) with permission from [Marc Wenner].
The primary goal of the braking tests executed on the Itz valley railway viaduct was the determination of the actual rail stresses due to braking events and their comparison with analytically determined expected values. Similar tests have been documented in the literature (Bernhard, 1936; Office de recherche et d'essais (ORE), 1967; Geißler et al., 2002; Stein and Quoos, 2005; Seidl, 2013; Marx et al., 2018; Schacht et al., 2018). A further, less important goal of the test was the estimation of the “dynamic stiffness” activated during the braking process.
To achieve these goals, the structural reactions of the bridge and rails (resistance) and the applied braking force (action) was measured. The resistance was measured as follows (only the decisive measures are shown):
- Measurement of the relative longitudinal displacements of the structure at each of the eight bridge joints (see Figure 4A).
- Measurement of the longitudinal strains of the rails at the level of the neutral axis of the rails at each of the eight bridge joints. This measurement was executed with strain gauges located on one rail per track.
To determine the braking force, the horizontal accelerations of the vehicle were measured at four locations along the train length (Figure 11A). Using the mass of the railway wagons, which were weighed prior to the test, the braking force was determined.
The measurements were carried out by two separate and independent measurement systems attached to the train and the structure. The evaluation of the measurement results, however, requires the chronologically synchronous acquisition of the signals by both measurement systems. If a synchronized trigger in both systems is released when the vehicle passes over a specific location on the rail (see Figure 11A), a precise synchronization of the signals during data evaluation can be achieved.
Two trains were used to carry out the braking test. The instrumented “braking train” was used to generate the braking force, while the second train served solely as superimposed vertical load destined to induce a local increase of the resistance to longitudinal displacements on the neighboring track during selected braking processes (Figure 11B). Some reference trips were carried out at the beginning of the test series so as to determine the influence of the vertical load of each train individually (in the form of influence lines). Subsequently, the actual braking tests were carried out. The braking was executed as emergency braking in brake position P. This combination ensures the rapid and complete venting of the main brake pipe of the train, and thus the full braking effect is achieved in the shortest time possible. The selected configuration of the train is chosen to ensure that the entire train is located on the substructure when the brake is activated.
The sequence of the test was designed to ensure that the “braking train” comes to a halt on each superstructure segment, in each direction once. For the statistical validation of the results, three successful braking events should be achieved in each target stopping position—a brake event was considered to be successful if the vehicle stopped within 2 m of the target stopping position, which was located at a distance of 5 m from the bridge joint. The brake events occurred with an initial speed of 20 km/h (shunt track) and were initiated with a flag signal (Figure 11B), given at a distance of the braking length from the target stopping position. The braking distance was ~20 m in dry weather and was reliably reproducible (scatter ~±1.5 m), so that generally no more than three tests had to be carried out. On the second day of testing it rained and therefore only service braking was executed, which negatively affected both the magnitude of the braking force and the precision of the stopping position of the vehicle (scatter of ~±10 m).
The braking acceleration measurements on the train showed that the wagons experience a significantly greater acceleration during the braking jerk than the locomotives (Figure 12). Also, the front wagons of the train come to a halt later than the back wagons (by ~0.02 s), which can be attributed to the collision of the back wagons with the front wagons; refer also to Bundesbahn-Zentralamt München (1979). On the first day of testing, a braking acceleration of up to a = 2.2 m/s2 (during the braking jerk) was achieved by carrying out emergency braking under dry track conditions. This corresponds to a coefficient of friction of μ = a/g = 0.22 and a braking force of up to 1,470 kN for a train with a weight of 689 t. On the second day of testing, only 50% of this force could be reached, because only service braking could be executed on the wet tracks.
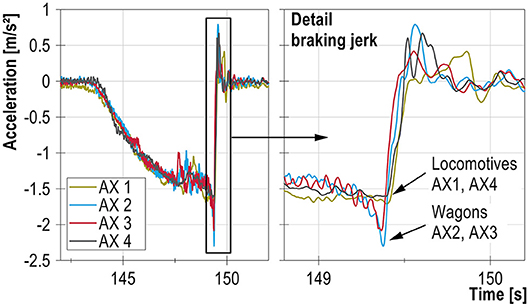
Figure 12. Braking acceleration measured by the four sensors installed along the train.
To analyse the behavior of the system, the force sustained by the bearings and the corresponding longitudinal displacement had to be determined. To do this, geometric and static assumptions were made (Figure 13), and a static equilibrium was assumed. As the superstructure experiences vibration during and after braking (Figure 14), the developed equations are only valid under certain conditions. Up to the braking jerk, the acceleration of the superstructure is small, and thus the equations can be used to yield approximate results for this time span. As soon as the superstructure starts to vibrate, however, inertia forces are activated which are not taken into account in the developed equations.
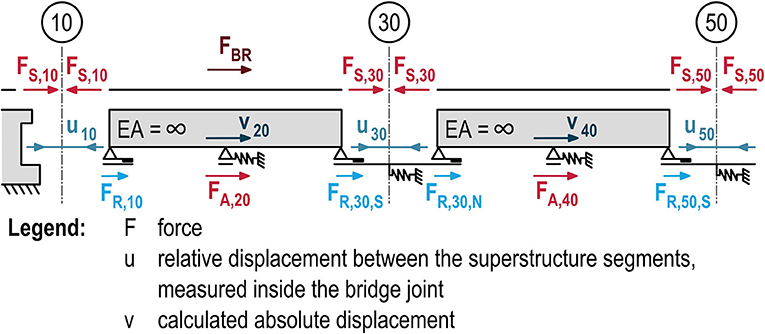
Figure 13. Detail of the equivalent static and geometric system for a braking event on superstructure segment A10–30.
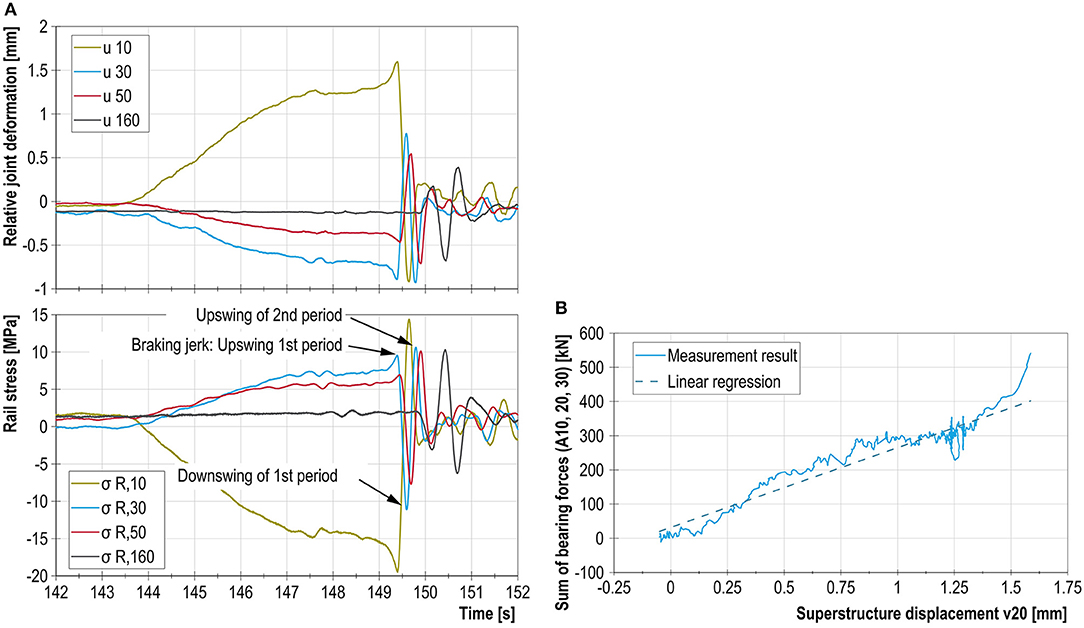
Figure 14. (A) Development of the longitudinal deformation of the bridge and the rail stresses at the joints over time. (B) Sum of the horizontal forces in the substructure of superstructure segment A10–30 vs. horizontal deformation of the substructure.
In a second step, the behavior of the structure and track superstructure was analyzed. A typical structural reaction is shown in Figure 14, using the example of the braking process executed on superstructure segment A10–A30 in the direction of axis 10. The joint at axis 10 closes, while all other joints open. An elongation occurs in the structure between axes 30 and 160. Owing to the inertia of the superstructure segments, the reactions of the individual segments occur with time delays—~0.5 s between axes 10 and 160. The amplitudes of the deformations are 1.6 mm at the most and increase with increasing distance to the target stopping position (Figure 14). As expected, the development of the rail stresses over time corresponds with that of the deformations of the bridge structure. The maximum tensile and compressive stresses during the braking jerk are ~+10 N/mm2 (axis 30) and − 20 N/mm2 (axis 10). Depending on the superstructure segment, ~35–45% of the braking force is transferred to the substructure of this segment; the remaining force is transferred to neighboring superstructure segments by the rails.
After the deformation due to the braking jerk, the bridge structure, which has a significant mass, undergoes deformation recovery at great speed, followed by the attenuation of the vibration over several periods. This leads to displacements and stresses with opposite signs to those recorded during the braking jerk. During the first downswing and the upswing of the second period, the stresses at nearly all the axes are higher than those recorded during the actual braking jerk, with the exception of the directly affected bridge joints (see also Stein and Quoos, 2005). The dynamic response of the multi-mass oscillator that is the bridge structure strongly influences the behavior of the system and the magnitude of the rail stresses during braking. Due to the phase-delayed vibration of the individual superstructure segments following the braking jerk, the static model used for calculating the response of the bridge and track superstructure cannot model the occurring effects. It was observed, however, that by modeling multiple load cases and vehicle configurations on the structure and using more conservative model assumptions (such as a higher resistance to longitudinal displacement) the occurring maximum rail stresses during braking are estimated by the model with sufficient accuracy.
Finally, the force transfer to the substructure was analyzed. To do this, the sum of the longitudinal force transferred to the substructure (determined according to Figure 13) as a function of the calculated superstructure displacement was drawn for each braking event. As explained above, this could only be done for the time period leading up to the braking jerk (the time period between 143.5 and 149.5 s for braking event 2.1.3, for example). As an example, the result for axis 20 for a “braking drive” on superstructure segments A10–A30 is shown in Figure 14B.
A definite distribution of the forces between the various pier axes (FR,10, FA,20, and FR,30,S in the example shown) and subsequent determination of the “dynamic stiffness” of the longitudinally fixed axis is not possible due to the following reasons:
- The forces acting at the level of the pier heads were not measured directly. It was not possible to quantify exactly the magnitude of the friction forces and the influence of the bearing play and the inertia forces; only the sum of the superstructure forces can be determined.
- The deformations of the pile heads were not measured directly, but rather calculated from the measured relative displacements and assumed deformations of the bridge structure. As the displacements are relatively small, the results exhibit some uncertainty due to the utilized methodology.
The friction forces were determined during the static diagnostic load test (section Static Diagnostic Load Test). These range from 30 to 70 kN, depending on the bearing, which corresponds to a friction force of up to 280 kN for an individual superstructure segment. Higher friction forces can be expected to occur due to dynamic actions under vertical train loads. The results obtained under corresponding assumptions show that the substructure stiffness of the longitudinally fixed piers during braking tends to be approximately twice as high as that determined in the static test (section Braking Test). This stiffening effect was taken into account in subsequent calculations. For comparison's sake, this “stiffness factor” was calculated for tests published in Kempfert and Schwarz (1984) taking into account the reported boundary conditions: it ranged between 2.1 and 4.5. It must be noted, however, that these tests were executed on a free-standing, unloaded pier by abruptly releasing a tensioned cable.
Because of the dynamic nature of the braking and the additional weight of the train, an activation of the resistance of the piers at the joints of the superstructure segments occurs due to the friction in the sliding bearings. This has a positive impact on the rail stresses and the longitudinally fixed bearings. The tendency of the substructure to react more stiffly during braking than under static loads can be explained by both the stiffening of the pier itself (dynamic Young's modulus) and the stiffening of the soil when subjected to small and rapid movements.
From a soil mechanics point of view, a stiffening of the soil during braking can be attributed to various effects. Besides depending on the type of the reinforced concrete elements (piles, pile group cap), the horizontal equivalent spring stiffnesses of deep foundations also depend strongly on the shear stiffness of the subsoil. The shear stiffness of soil materials is a function of the stress state, density, recent deformation history (see Meier, 2009, for example), magnitude of the occurring shear strains, and, in the case of fine-grained soils, also of the load rate [viscous effects (Niemunis, 2003)] as well as, to a lesser extent, the number of alternating load cycles (Studer and Koller, 1997).
The dependence of the shear stiffness on the magnitude of the shear stress is indirectly shown in Figure 15. At very low shear stresses (≈10−6), this stiffness is referred to as the “dynamic stiffness,” and at significantly higher shear stresses (≈10−3) it is called the “static stiffness.” Their ratio as a function of the “static stiffness” has been investigated and described by Alpan (1970), among others.
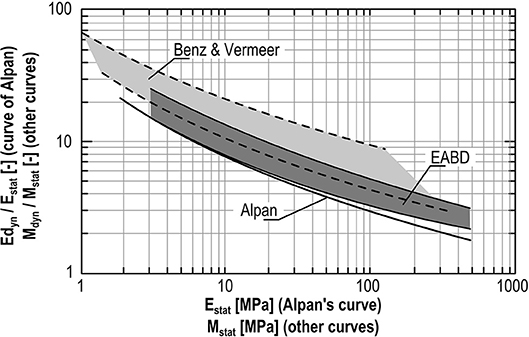
Figure 15. Ratio of “dynamic” to static stiffness (copied from Wichtmann and Triantafyllidis, 2009).
The experimentally determined difference in stiffness can be explained fundamentally and qualitatively using the aforementioned properties of soils and concrete and is therefore deemed to be plausible.
To allow for analyses of the additional rail stresses occurring on and near the Itz valley railway bridge to be carried out using realistic substructure stiffnesses, both static and dynamic test were carried out to determine these parameters.
During the static test, loads of up to 2.5 MN were introduced into the piers in order to characterize the deformation behavior of the substructure in the longitudinal direction of the bridge. The utilized measurement concept allowed for the determination of not only the global equivalent spring stiffness but also the various deformation components (due to the tilting and displacement of the foundation and the deflection of the pier). By executing numerical analyses of the subsoil it was shown that the traditional pile group method significantly underestimates the measured stiffnesses (by a factor between 3 and 5). In contrast, very good agreement with the experimental results was achieved by using 3D FE models to take into account the interaction between the subsoil and the structural elements. Based on the insights gained from the test, it is therefore recommended that for larger railway bridges, in which the static verifications of the rail stresses and bearings react sensitively to the substructure stiffness, this stiffness be determined with more precise models of the foundation system (method 2). These models can be refined further by incorporating the results of diagnostic load tests of piles.
The “dynamic stiffness” was determined with braking tests. However, it is much more difficult to derive accurate and reliable stiffness values from these tests than from the static tests for the following reasons: (1) the forces introduced into the substructure and the occurring deformations are smaller than those observed in the static tests and were not measured directly, (2) friction forces in the sliding bearings are activated, but they cannot be separated from the measured longitudinal force occurring in the substructure, and (3) inertia forces that are difficult to quantify are activated due to the dynamic excitation of the bridge structure. The results show that, compared to the static substructure stiffness, for dynamic processes the stiffness tends to be higher by a factor of two. It is therefore recommended to include in the analysis an investigation of the effects of a higher dynamic stiffness (in particular on the bearing forces). Furthermore, the analysis of the measurement results of the braking test shows that the activation of the friction forces mobilizes significant structural reserves in the system and leads to lower stresses in both the rails and the longitudinally fixed bearings. It is difficult, however, to determine these reserves by way of calculations.
All authors listed have made a substantial, direct and intellectual contribution to the work, and approved it for publication.
The authors declare that the research was conducted in the absence of any commercial or financial relationships that could be construed as a potential conflict of interest.
Alpan, I. (1970). The geotechnical properties of soils. Earth Sci. Rev. 6, 5–49. doi: 10.1016/0012-8252(70)90001-2
Bernhard, R. (1936). Über die Verteilung der Bremskräfte auf stählernen Eisenbahnbrücken. Der Stahlbau 9, 36–39, 53–56.
Bundesbahn-Zentralamt München (1979). Bericht zu den Bremsveruschen mit einer etwa 690 m langen Güterzug. Report Number 14.1412 Ibvm 682
Deutsche Gesellschaft für Geotechnik [Hrsg.] (2012). EA-Pfähle, Empfehlungen des Arbeitskreises “Pfähle”, 2nd edn-January 2012. Berlin: Ernst & Sohn.
Geißler, K., Graße, W., Schmachtenberg, R., and Stein, R. (2002). Zur messwertgestützten Ermittlung der Verteilung der Brems- und Anfahrkräfte an der Eisenbahnhochbrücke Rendsburg. Stahlbau 71, 735–747. doi: 10.1002/stab.200202480
Kempfert, H.-H., and Schwarz, P. (1984). In situ-Versuche zur Ermittlung der Unterbausteifigkeit an zwei Pfeilern der Sinntalbrücke Schaippach. issue 3, Schriftenreihe des Lehrstuhls und Prüfamt für Grundbau, Bodenmechanik und Felsmechanik der Technischen Universität München.
Marx, S., and Geißler, K. (2010). Erfahrungen zur Modellierung und Bewertung von Eisenbahnbrücken mit Resonanzrisiko. Stahlbau 79, 188–198. doi: 10.1002/stab.201001295
Marx, S., and Schneider, S. (2014). Entwerfen von Eisenbahnbrücken für dynamische Einwirkungen aus dem Hochgeschwindigkeitsverkehr. Bautechnik 91, 75–90. doi: 10.1002/bate.201300097
Marx, S., and Seidl, G. (2011). Integral Railway Bridges in Germany. Struct. Eng. Int. 21, 332–340. doi: 10.2749/101686611X12994961034534
Marx, S., Wenner, M., Käding, M., and Wedel, F. (2018). “Vom Rechnen und Wissen – Monitoring an den Talbrücken der Neubaustrecke Erfurt-Leipzig/Halle,” in (Hrsg.): Tagungsband des 28. Dresdner Brückenbausymposiums, Vol. 13. ed M. Curbach, Technische Universität Dresden, Dresden, 41–56.
Meier, T. (2009). Application of Hypoplastic and Viscohypoplastic Constitutive Models for Geotechnical Problems. dissertation, Veröffentlichung des Instituts für Bodenmechanik und Felsmechanik/Universität Karlsruhe.
Niemunis, A. (2003). Extended Hypoplastic Models for Soils, Vol. 34. Monografia Nr. Politechnika Gdanska.
Office de recherche et d'essais (ORE) (1967). Frage D101: Brems- und Anfahrkräfte auf Brücken und Wechselwirkung zwischen Gleisen und Brücken (Report 1 to 28).
Schacht, G., Wedel, F., and Marx, S. (2018). Bridge load testing in Germany. ACI Special Publication 323 (accepted to be published).
Seidl, G. (2013). Bericht ÖBB Strecke Linz – Selzthal km 88,488 Trattenbachbrücke Auswertung Monitoring (unpublished).
Stein, R., and Quoos, V. (2005). “Bremsversuch auf der Eisenbahnhochbrücke Hochdonn,” in (Hrsg.): Tagungsband des 3. Symposiums Experimentelle Untersuchungen von Baukonstruktionen, Vol. 9. ed M. Curbach. Technische Universität Dresden, Dresden, 1–20.
Studer, J. A., and Koller, M. G. (1997). Bodendynamik, 2nd Auflage. Berlin/Heidelberg: Springer-Verlag. doi: 10.1007/978-3-662-06123-7
Wenner, M., Lippert, P., Plica, S., and Marx, S. (2016a). Längskraftabtragung auf Eisenbahnbrücken, Teil 1: Geschichtliche Entwicklung und ModellFigureung. Bautechnik 93, 59–67. doi: 10.1002/bate.201500107
Wenner, M., Lippert, P., Plica, S., and Marx, S. (2016b). Längskraftabtragung auf Eisenbahnbrücken, Teil 2: Hintergründe des Nachweises. Bautechnik 93, 470–481. doi: 10.1002/bate.201600034
Wenner, M., Meier, T., Wedel, F., and Marx, S. (2019). Versuchsgestützte Ermittlung der Unterbausteifigkeit einer großen Eisenbahnbrücke. Bautechnik 96, 99–111. doi: 10.1002/bate.201800019
Wenner, M., Wedel, F., Meier, T., and Marx, S. (2018). “Load testing on a high railway bridge to determine the longitudinal stiffness of the substructure,” in IALCCE 2018, The Sixth International Symposium on Life-Cycle Civil Engineering. eds R. Caspeele, L. Taerwe, and D. Frangopol. (Ghent). (Accessed October 28–31, 2018).
Keywords: experiment, diagnostic load test, braking test, railway viaduct, pier stiffness, track–bridge interaction
Citation: Wenner M, Meier T, Wedel F, Schacht G and Marx S (2019) Experimental Determination of the Longitudinal Pier Stiffness of a Long Railway Viaduct. Front. Built Environ. 5:45. doi: 10.3389/fbuil.2019.00045
Received: 08 November 2018; Accepted: 15 March 2019;
Published: 10 April 2019.
Edited by:
Joan Ramon Casas, Universitat Politecnica de Catalunya, SpainReviewed by:
Pavel Ryjáček, Czech Technical University, CzechiaCopyright © 2019 Wenner, Meier, Wedel, Schacht and Marx. This is an open-access article distributed under the terms of the Creative Commons Attribution License (CC BY). The use, distribution or reproduction in other forums is permitted, provided the original author(s) and the copyright owner(s) are credited and that the original publication in this journal is cited, in accordance with accepted academic practice. No use, distribution or reproduction is permitted which does not comply with these terms.
*Correspondence: Gregor Schacht, Z3JlZ29yLnNjaGFjaHRAbWFyeGtyb250YWwuY29t
Disclaimer: All claims expressed in this article are solely those of the authors and do not necessarily represent those of their affiliated organizations, or those of the publisher, the editors and the reviewers. Any product that may be evaluated in this article or claim that may be made by its manufacturer is not guaranteed or endorsed by the publisher.
Research integrity at Frontiers
Learn more about the work of our research integrity team to safeguard the quality of each article we publish.