 Aaron L. Jaffe
 Guillermo A. Riveros
 Gregory A. Kopp
94% of researchers rate our articles as excellent or good
Learn more about the work of our research integrity team to safeguard the quality of each article we publish.
Find out more
ORIGINAL RESEARCH article
Front. Built Environ. , 19 February 2019
Sec. Wind Engineering and Science
Volume 5 - 2019 | https://doi.org/10.3389/fbuil.2019.00014
This article is part of the Research Topic Tornado Interactions with the Built Environment View all 5 articles
Severe wind events, such as tornadoes, pose a significant threat to lives and infrastructure in many locations around the world. Residential buildings are the structures most affected by these events, since they are widespread and often not designed to withstand severe loading. For the wood-frame, low-rise houses typical of North America, once the envelope of the building has been breached, such as through the failure of a garage door, the loss of the entire roof structure becomes much more likely. One of the issues with garage doors is their flexibility; as they begin to deflect under wind load, relatively large openings allow air flow into the internal volume. As a result of these positive pressures on the garage door, positive pressures are transferred into the internal volume, subsequently reducing the net wind load on the door. The objectives of this study are to determine failure net pressures of garage doors through experimental testing, and to combine those results with internal pressure models including the effects of garage door flexibility in order to estimate the failure wind speeds of garage doors. Six garage doors of various types are tested, and the failure wind speeds acquired through the internal pressure model are compared to the Enhanced Fujita Scale. Experimental testing found the failure net pressures of the garage doors to be between 0.42 and 1.75 kPa. With the internal pressure model showing that the net load on the garage doors is typically reduced to 34–46% of the external pressure, the resulting range of expected failure wind speeds obtained was 130–265 km/h. This range is found to encompass and exceed the expected failure wind speeds in the EF-Scale of 130–185 km/h, which would only be applicable for the weaker range of garage doors.
Severe windstorms such as downbursts and tornadoes consistently damage single/double family homes in Canada and the United States. In North America, the Enhanced Fujita (EF) Scale, which was developed by Texas Tech University (McDonald and Mehta, 2006), modifying the original Fujita Scale (Fujita, 1971), is routinely used to estimate the speed of tornado winds based on observed damage. The damage to typically-constructed one-and-two family residences (labeled as FR12) is used as one of the 28 damage indicators (DI) in the scale. For each DI, different degrees of damage (DOD) are provided where each DOD is numbered in ascending order from the lightest damage to the most severe. Table 1 provides one example. According to the DODs for FR12, uplift of roof deck and loss of significant roof covering material (>20%) are grouped together with the inward collapse of single/double garage doors at DOD4, occurring at estimated wind speeds ranging from 130 to 185 km/h. Complete failure of the roof structure is, hence, usually preceded by garage door failures due to increasing the internal pressures.
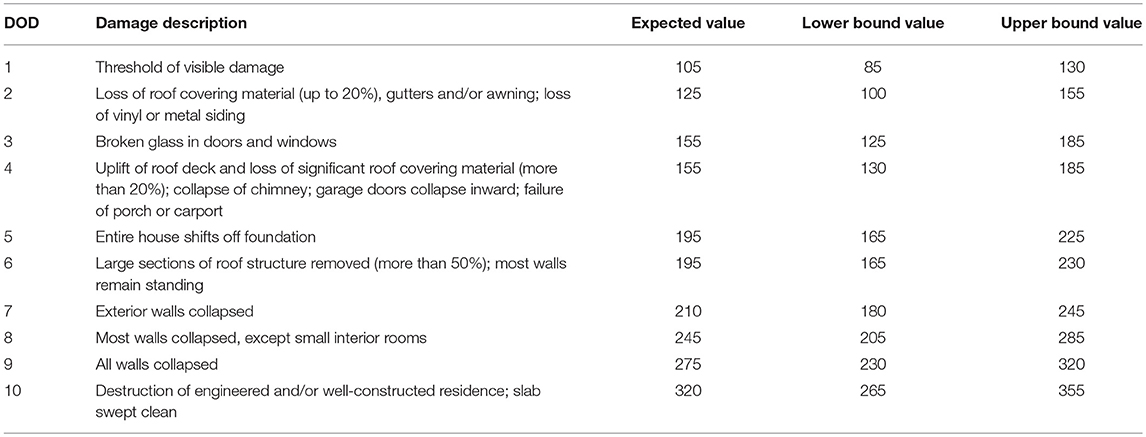
Table 1. EF-Scale DOD Descriptions and Wind Speeds in km/h for FR12 (Environment Canada, 2014).
Significant work has been done examining the interaction between internal pressures and low-rise structures. This kind of research dates back at least to Irminger and Nokkentved (1930), who measured internal pressures on small building models in Denmark. Later, Liu (1975) introduced flow rate equations to compare measured and predicted internal pressures, which led to the Helmholtz resonator model, developed by Holmes (1980). This model has been used in numerous studies since, including Liu and Rhee (1986), Pearce and Sykes (1999), and Sharma and Richards (2003).
Large openings in the building envelope of wood-frame residential structures, like those caused by broken garage doors, can lead to an increase in the net wind loads on roofs caused by high internal pressurization of the structure. The typical sequence of failure begins with aerodynamic pressures being applied to the exterior surfaces: positive pressures on the windward walls, uplift pressures on the roof, and negative pressures on the leeward walls. If the building envelope is breached on its windward side due to a broken garage door, internal pressures add to the aerodynamic uplift pressures, increasing the net wind loads on the roof (Kopp et al., 2008). Therefore, garage doors may generate large internal pressures when they fail and increase a structure's potential for further damage because of their large size relative to the internal volumes they typically enclose. As a result, roofs of residential structures have a high probability of failure in storms that are strong enough to cause external-pressure failure of garage doors. When assessing tornado damage of residential construction in Vaughan, ON, in 2009, Morrison et al. (2014) noted that roof failures are highly correlated to failures of cladding elements on the walls, such as windows and garage doors.
The difficulty in testing and modeling garage door failures is that air leakage around the relatively flexible garage doors generates internal pressure changes during strong winds even when the doors have not failed. Consequently, net loading on doors not only depends on the external pressure applied by the damaging winds but includes the complexity of changes to the internal pressures. As a result of this, as well as the fact that not all garage door types may perform the same way or resist similar wind pressures, there may be significant variability in the performance and impacts of garage door failures.
There have been limited numbers of published studies on different garage door failure mechanisms and capacities. Pressure testing of garage doors for wind-resistance rating is typically conducted using standardized procedures such as ASTM E1233 (ASTM E1233-06, 2006) and ASTM E330/E330M (ASTM E330/E330M-14, 2014) in order to evaluate their structural performance in the form of applied load-deflection (or pressure-deflection) curves. Following a similar approach, Shen et al. (2017) developed a full-scale simulator employing a diesel-powered fan capable of generating a maximum pressure of 22 kPa. A set of large sectional doors were tested in that study by applying a recreated pressure time history based on boundary layer wind tunnel measurements and calculated using the wind pressure coefficient (Cp) data from a model archived in the National Institute of Standards and Technology (NIST) Aerodynamics Database (Ho et al., 2005). Shen et al. (2017) provide detailed descriptions of the observed failure mechanisms for these industrial doors and their midspan deflections due to the applied negative (outward-acting) pressures (as opposed to positive pressures). However, the primary focus of the study lies in the fidelity of the simulator to apply and follow a pressure time history converted from a predetermined wind velocity time history and adopting the maximum Cpe recorded from the aforementioned wind tunnel model. Therefore, as with all other experimental evaluations of the structural performance of garage doors, details of their behavior are presented in terms of load-displacement curves, and the effects of the induced internal pressurization on Cp caused by the inflow of air around the deflected areas was not examined.
Garage door testing, such as that done in Shen et al. (2017) and the current study, is useful in understanding how these structural elements interact with wind, but the experiments are not without their limitations. The net pressure being applied to the door with pressure loading actuators (PLAs) and the fluctuating open area can be numerically tracked, but the internal pressure is unknown. This is crucial because the external pressure acting on the door is needed to make an estimation for the failure wind speed, and this cannot be obtained without knowledge of the internal pressure. In an ideal case with the garage door being rigid and sealed, the net pressure would be virtually the same as the external pressure and internal pressure modeling would not be necessary. However, the difficulty lies in the fact that garage doors are flexible, which creates internal pressures pushing back against the door when the door begins to bend inwards under a positive wind load. To further complicate the analysis, the opening size of the door—frame interface is constantly changing. As the load increases, the opening increases as well. The larger opening then allows for higher internal pressures to develop, which subsequently helps to close the opening, creating a complex pattern of loading.
Because the specific failure mechanisms and related maximum wind pressures are not well defined due to the vast variety of garage door types available in the market (e.g., wood, 1 to 3-layer steel, fiberglass, etc.), their wind-resistance and behavior may vary widely from one type to another. This will have an impact on the resulting range of wind speeds and, therefore, the EF-Scale. The objectives of this study are to determine the wind speeds required to generate garage door failures due to the applied pressures (neglecting the effects of debris impact) and to compare the results to DOD4 of FR12 in the EF-Scale. To achieve these goals, the capacities and failure mechanisms of six garage doors of various types are obtained by means of full-scale PLA system tests and analysis of the corresponding displacements and modes of detachment or rupture. The maximum wind speeds sustained by each door are then evaluated using net pressure coefficients estimated from the opening areas generated by the deflection of the loaded doors, in order to account for the effects of varying internal pressurization.
The pressure test set-up developed to determine the capacity and deflections of the multiple garage doors tested is an extension of the method developed by Kopp and Gavanski (2012) and Miller et al. (2017). To determine the maximum positive pressure that each of the garage doors can sustain and obtain displacement and pressure measurements, the experimental set-up (shown in Figure 1) included the following three main components:
• A pressurization system consisting of six PLAs, as developed by Kopp et al. (2010) and Miller et al. (2017);
• An “air-box” or pressure chamber;
• A control/data acquisition system (DAQ) with linear variable differential transformers (LVDTs) and pressure transducers (PTs).
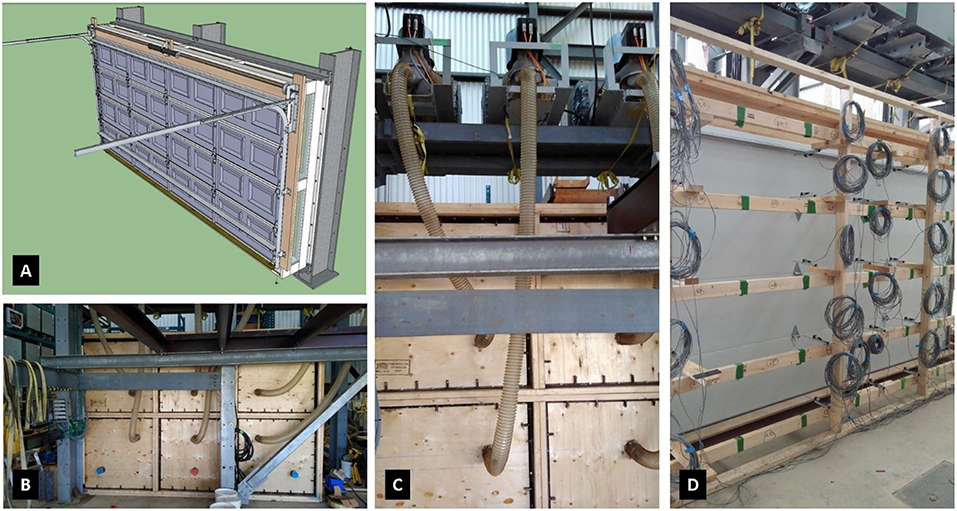
Figure 1. (A) A conceptual image of the pressure chamber setup, and photographs of (B) its backside with (C) detailed connections to pressure load actuators (PLAs) and (D) the displacement transducer (LVDT) support frame.
As described and shown by Kopp et al. (2010), a PLA is a controlled blower system designed to replicate the surface pressures on building components generated by the wind. A blower generates the required air pressure changes that are subsequently transferred to the specimen via a hose and a pressure chamber (air-box). Inside the valve assembly, a rotating disk controlled by a servomotor, which updates its position ~100 times per second, regulates the generated applied pressure (Miller et al., 2017). This allows the PLA to simulate realistic wind pressure records by closely following a predetermined pressure time history up to a maximum limiting frequency of ~10 Hz, as the frequency response is also dependent on the fan curve and leakage rates (Kopp et al., 2010).
A system consisting of six PLAs was used to provide ramping positive pressures on each garage door by means of hoses connected to a large steel-framed wooden air-box (3.8 m W × 2.6 m H × 0.76 m D) upon which each of the garage doors was installed. In order to apply the required pressures to each of the doors and reduce the amount of leakage caused by their deflections, a 0.006 in. thick, low-density polyethylene airbag was attached to the air-box's opening before the garage door was installed. By placing the airbag between the installed door and the air-box opening, the airbag was allowed to extend as the door deflected, while simultaneously covering gaps around the door (leakage areas) and maintaining the required pressures on the door.
To regulate and monitor the uniform ramping positive pressures inside the air-box, each PLA had a pressure transducer connected to the air-box and was controlled over an Ethernet (CAT-5) network using a computer-based program (Kopp et al., 2010). Additionally, 25 LVDTs making contact with the specimen's exposed surface and one pressure transducer coupled to the air-box were connected to a National Instruments® data acquisition system (DAQ) that recorded the displacements and applied air pressures.
In order to evaluate the behavior of different garage door types in response to applied external pressures, a total of six garage doors were tested using four different products. All the doors were for residential use, 7 ft by 12 ft in size, with the common short raised-panel architectural design and tongue-and-groove connections between panels, and included standard mounting hardware, including 14-gauge steel hinges, 2′′ tracks made of 17-gauge galvanized steel, 13-gauge galvanized steel jamb brackets, and heavy-duty rollers. The details of the four different products are as follows:
• Product 1 consists of 1-layer type construction, with a heavy-duty 24-gauge steel exterior shell secured to a 2 in. thick, non-insulated frame. No reinforcing beam (U-bar strut) is provided by the manufacturer, so the primary out-of-plane load resistance is provided by the door's structural frame. One door of this type was tested.
• Product 2 also has 1-layer type construction, consisting of a heavy-duty 24-gauge galvanized steel exterior shell secured to a 2 in. thick, non-insulated frame. A 2 in., 22-gauge galvanized steel brace (U-bar strut) is provided and installed at its uppermost panel to increase reinforcement against out-of-plane loading. Three doors of this type were tested.
• Product 3 has a 3-layer (sandwich) type construction. This door model has a high-density polyurethane core (insulation) inside a 2 in. steel frame that secures a fiberglass external shell with a 25-gauge interior skin. As with the previous model, a galvanized steel U-bar strut is provided and installed at its uppermost panel to increase reinforcement against out-of-plane loading. One door of this type was tested.
• Product 4 also consists of 3-layer (sandwich) type construction with a high-density polyurethane core (insulation) inside a 2 in. steel frame that secures a 26-gauge galvanized steel external shell with a 27-gauge steel internal skin. As with the two previous models, a galvanized steel U-bar strut is provided and installed at its uppermost panel to increase reinforcement against out-of-plane loading. One door of this type was tested.
To prepare each specimen for testing, each door was assembled and installed following the manufacturers' guidelines and mounted in the air-box opening with its internal surface facing away from the air-box, as shown in Figure 1A. A single air-box is used in this study, such that the pressure is uniform over the surface of the door. Figure 2 highlights the components in the load-transfer path from the pressure to the door to the mounting components. As previously mentioned, the instrumentation for each test consisted of six PLA-controlling pressure transducers (PT), a PT connected to the DAQ, and 25 LVDTs mounted on an attachable wooden-frame to hold them in place and maintain contact with the door at the locations of interest (see Figure 1D).
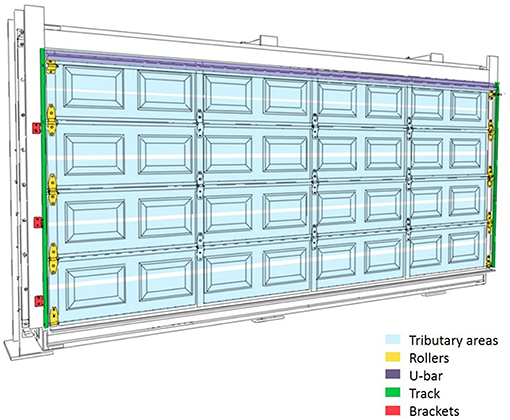
Figure 2. Diagram of mounted garage door, highlighting tributary areas, and load transfer components.
A programmed static ramping load sequence with a maximum attainable positive pressure of 2 kPa was applied to the external surface of each door by the PLA system until failure occurred. The maximum pressure programmed (i.e., 2 kPa) was selected only to ensure the applied load was high enough to cause failure, but not excessively high to cause safety concerns. Similarly, the rate of loading chosen (0.4 kPa/min) ensured a steady transfer of the generated pressure to the door within the capabilities of the PLA system, while simultaneously ensuring close fidelity between the programmed ramping and the recorded pressures, following an initial stabilization of the control system, as shown in Figure 3. Failure of any given specimen was defined as the partial or complete detachment of door panels, as well as any visible plastic deformations that would prevent the door's normal operation.
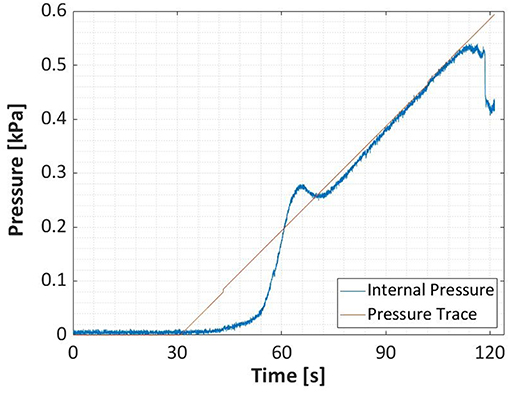
Figure 3. Comparison of programmed ramping load trace (red) at 0.4 kPa/min with the chamber's internal pressure measurements (blue).
Each test was controlled and monitored on a computer, with the pressure and displacement data being simultaneously recorded by the DAQ. The tests were manually terminated soon after failures were observed. Detailed visual inspections of failure mechanisms of each specimen were subsequently recorded.
Using the test data discussed in the previous section, the following failure modes and maximum air pressures were observed for each of the garage doors tested:
• Product 1: This door model failed with plastic deformation at the midspan of its uppermost panel with a gradual reduction in the magnitude of the deformation reaching the bottom panel, as shown in Figure 4. There was no disengagement of the door panels from the tracks or track pull-out failures since it was the door itself that failed first. A maximum pressure of 0.42 kPa was reached before failure.
• Product 2: This door model failed because of plastic deformation at midspan of its lowermost panel, with large displacements up to the middle segment of the door, as shown in Figure 5. No disengagement of the door panels from the tracks or track pull-out failures were observed in any of the three doors tested, although some permanent deformation of the rollers was recorded. An average maximum pressure of 0.56 kPa was reached before a sudden pressure drop due to the door's failure.
• Product 3: This stiffer and more resilient model exhibited smaller permanent deformations around the midspan region of its lowermost panel, reaching the middle section of the door, as shown in Figure 6. However, failure also occurred due to track pull-out on both sides of the uppermost panels with permanent bending of the rollers and the brackets. A maximum pressure of 1.75 kPa was reached before the sudden pressure drop in the test due to the failure.
• Product 4: This stiffer model failed with deformations around the midspan region of its lowermost panel, reaching up to the middle section of the door, as well as track pull-out on both sides of the uppermost panels, as shown in Figure 7. However, deflection data was not recorded. A maximum pressure of 0.90 kPa was reached before the pull-out failure.
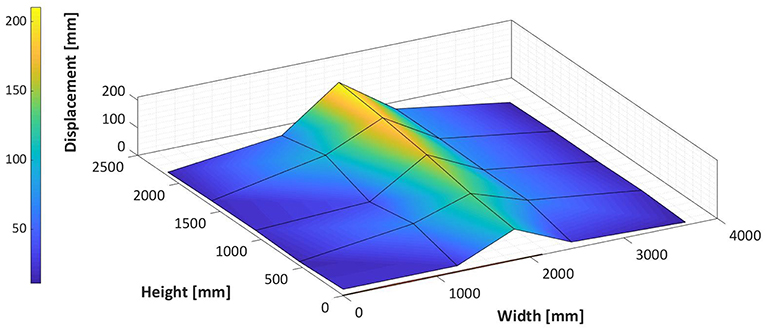
Figure 4. Measured displacements of Product 1 (single layer, 25-gauge steel door) just prior to failure.
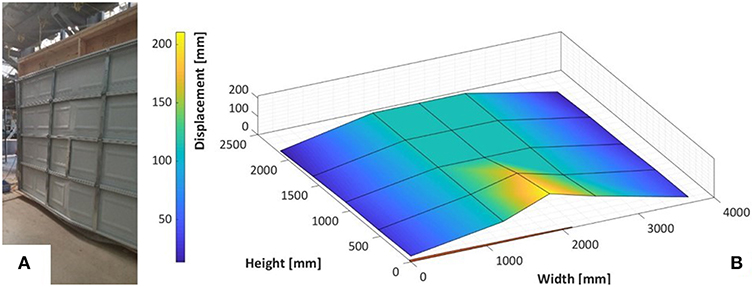
Figure 5. A (A) photograph and the (B) measured displacements of Product 2 (single layer, 25-gauge steel door with U-bar reinforcement) just prior to failure.
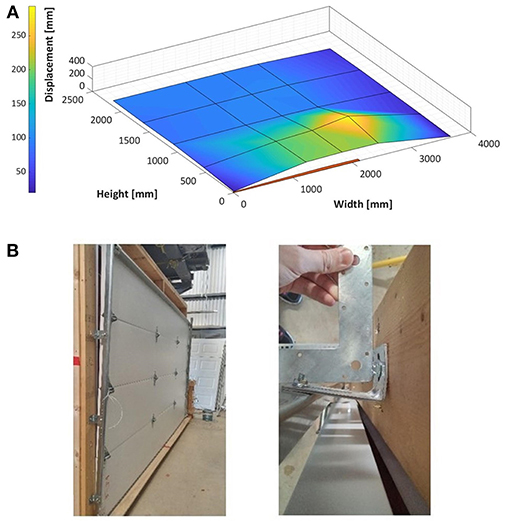
Figure 6. The (A) measured displacements of Product 3 (triple layer, fiberglass, and 25-gauge steel door with U-bar reinforcement) just prior to failure, and (B) photographs of mounting hardware pull-out and bending.
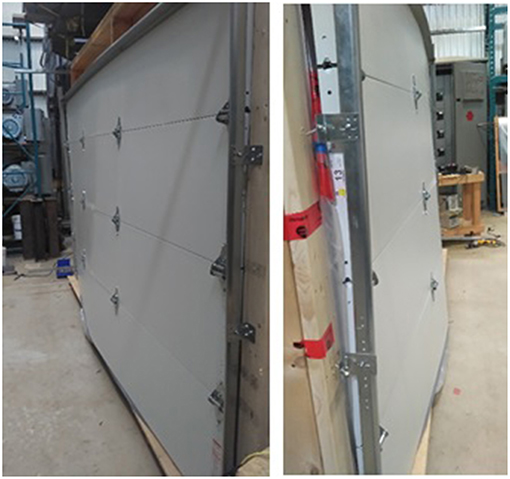
Figure 7. Photographs of hardware pull-out for Product 4 (triple layer, 26- and 25-gauge steel door with U-bar reinforcement) just prior to failure.
Based on the observations listed above and outlined in Table 2, there is an evident difference in the structural behavior and failure mechanisms for the single-layer and triple-layer products. Products 1 and 2 exhibited significant bending and plastic deformation that affected the doors' normal operation. In contrast, the respective fiberglass and steel shells of Products 3 and 4 seemed to provide increased resistance to permanent bending. However, the increased capacities increased the loading applied to the rollers, tracks, brackets, and fasteners. This generated pull-out failures and/or permanent deformation of such hardware. Consequently, single-layer garage doors seem to be more prone to local failures (i.e., permanent panel bending) than the stiffer three-layer products, which produced pullout failures and roller disengagement due to their higher stiffness. Comparable modes of failure are reported by Shen et al. (2017) for the stiffer and stronger commercial sectional doors, for which local buckling of the U-bars and disengagement of door panels from tracks were the primary failures observed. As previously mentioned, there are limited numbers of published studies on residential garage door failure mechanisms and capacities, so validation of the results obtained is limited as well.
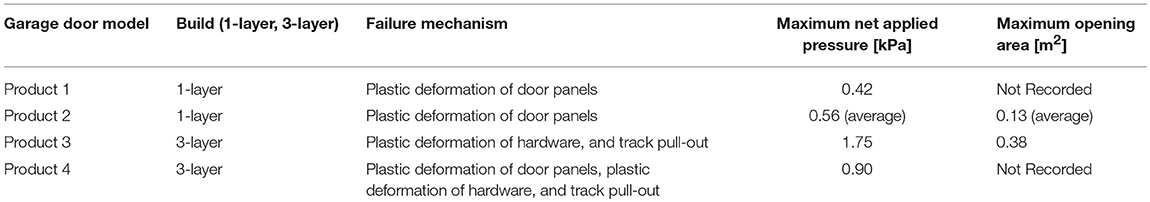
Table 2. Comparison of test results for garage doors.
A similar distinction in performance can be made with regards to the (positive pressure) capacity for each door type. The maximum applied net pressure recorded for single-layer models, which averaged ~0.50 kPa, is evidently lower than those for the stiffer three-layer doors, which reached values roughly two or three times higher. The observed low strength of the single-layer type models was due to their weak structure, which caused them to exhibit plastic deformation before any overload of the tracks or fasteners. The sturdier design of the triple-layer models, on the other hand, prevented any premature bending of the panels, thus allowing higher pressures to build up until the tracks and fasteners were overloaded to failure. In general, however, the maximum pressure values obtained compare well with the range of wind pressures on components and cladding for walls (roughly 0.5–3.3 kPa) provided by the International Residential Code (IRC) [Table R301.2(2) of the IRC] (International Code Council, 2015), which are based on basic wind speeds of 85–170 mph (137–274 km/h) for a roof height of 33 ft in exposure B conditions (which depend on the geographic zone and effective wind area).
Using the applied pressure and induced deflection data obtained for both garage door types, open area curves were developed (see Figure 8) by numerically integrating the deflection curves recorded at the side and top edges of each door. Figure 9 presents a conceptual description of a door's deflection curve at its top edge, depicting the opening area as the integration of the curve. Note that the openings at the bottom surface were neglected because these were covered by the floor making contact with the weather-stripping seal. Despite the different type and stiffness of the two door models, the relationship between open area and applied net pressure follows a similar trend (Figure 8C). Thus, a larger maximum open area (0.38 m2) was obtained for the stiffer models, which also exhibited the highest pressure capacity. Conversely, the weaker models resulted in smaller open areas and failure because of the low pressure capacity. The similarity of the curves occurs despite the significant plastic deformation of the bottom panels, which did not contribute to the opening area because of the weather stripping as described above.
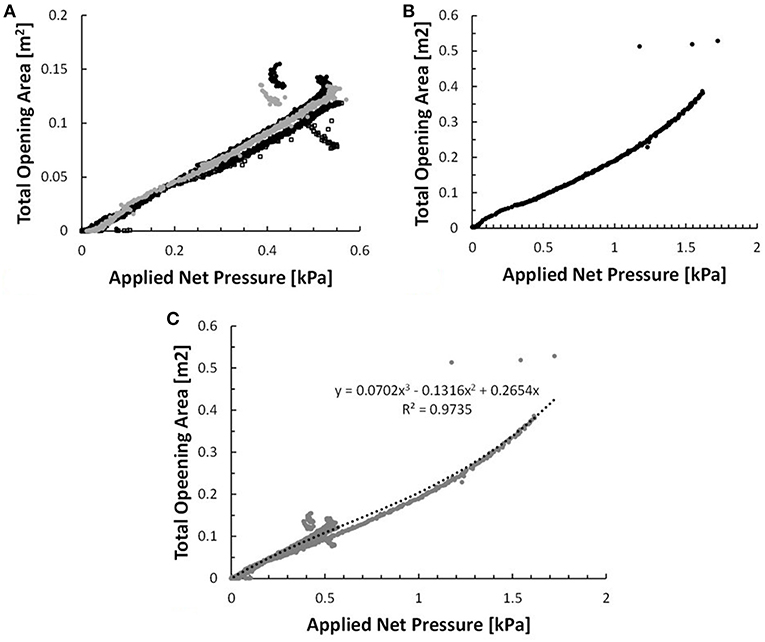
Figure 8. Total open area as a function of applied net pressure for (A) all three Product 2 doors tested, (B) Product 3, and (C) all models for which displacement data were obtained.
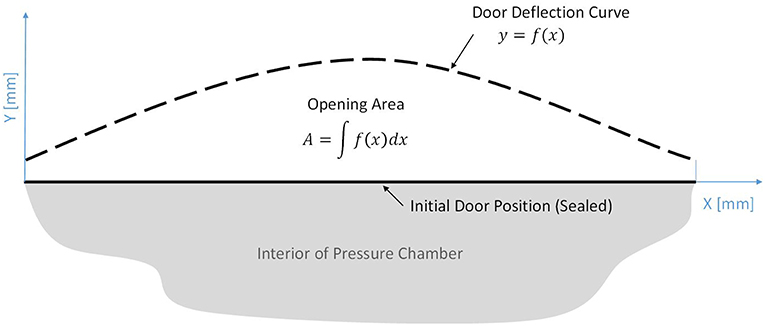
Figure 9. Conceptual image of a garage door deflection curve at its top edge. The opening area is equivalent to area under the curve.
As previously mentioned, pressure testing alone is not enough to accurately estimate the failure wind speeds of garage doors. Due to the flexibility of the garage door, it is the net pressure that is obtained at failure, not the external pressure. However, it is the external pressure that is more directly correlated with the wind speed. Thus, the internal pressure for a given external pressure (and building geometry) is needed. Of course, the passage of a tornado is unsteady, and the flow is turbulent, so both the external and internal pressures are fluctuating. The approach here is to examine the ratios of net pressure to external pressure during the moments of peak loading (i.e., peak gusts), incorporating the effects of garage door flexibility, and then using these ratios as part of the estimation of the failure wind speeds, which are examined in section Failure Wind Speeds.
Internal pressure modeling allows the internal pressures to be calculated using the external pressures at the opening and the relevant geometry. Here, the analytical models used by Oh et al. (2007) are applied. It should be noted that this method was developed for straight-line winds as opposed to tornadic winds. However, under the assumption that the tornado is large relative to the garage, this method should be sufficiently accurate within the other variabilities and uncertainties of the problem, particularly since the only purpose is to relate the wall pressure to the wind speed.
The governing equations for this model are the single discharge equation (SDE) and the multiple discharge equations (MDE), both of which are based on the unsteady Bernoulli equation together with loss coefficients to account for friction and other losses. For the SDE, after performing numerical differentiation, rearranging the equation, and substituting in the known parameters, the unknown variables become the internal pressure, pi, and, for the case of flexible garage doors, the open area, A. The resulting equation is:
where is the jth step of the internal pressure, is the external pressure, is the time derivative of the internal pressure, is the second time derivative of the internal pressure, A is the instantaneous open area, and le is the effective length of the “air slug” related to the opening area size by le = l0 + 0.89√(A). The other parameters in the equation are constants, with values that can be found in Table 3.
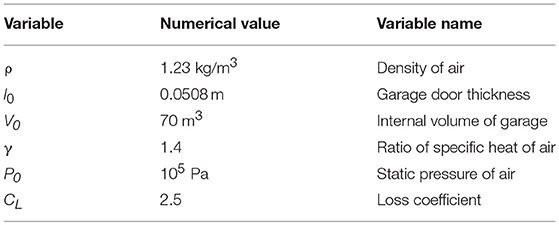
Table 3. Values of constant variables related to SDE and MDE equations.
When dealing with multiple openings, the MDE method is used. In this case, there are a series of equations:
where m is the number of openings, is the jth step of the time derivative of the position of the air slug at opening m, and is the second time derivative of the position of the air slug at opening m. After substituting the derivatives in for x, this system becomes m equations with m+1 unknowns (x1, x2… xm, and pi). To eliminate the internal pressure as an unknown, the continuity equation is incorporated:
where is the jth step of the position of the air slug (Holmes, 1980) and Ak is the area of opening m. P0 and V0 are constant parameters, found in Table 3.
Here, we use the SDE method to determine the effects of the variable open area on internal pressures. Then, we apply those results with the MDE method for realistic scenarios but with an effective open area for the garage door that captures the proper internal pressure effects during peaks gusts. This simplifies the solution of these non-linear differential equations significantly, while yielding an answer of acceptable accuracy.
The solution of the SDE and MDE require iterative processes. For the MDE, the method of Oh et al. (2007) is used. For the SDE with the variable open area of the garage door, the Oh et al. (2007) method must be modified. Following each iteration, where the internal pressure is solved using the external pressure and previous internal pressure values, the net pressure is calculated and used to determine an updated open area using a fit to the net pressure—open area curve shown in Figure 8C. The updated open area is then used in the calculation to determine the next value of the internal pressure. It should be noted that the open area for the garage door when it is closed under a no-load condition is not zero because of leakage between the door and the frame. A leakage value of 0.1% of the garage door area is used (ASHRAE, 2005).
Finally, realistic external pressure time series for the location of the door are required as input for the SDE and MDE methods. Data from the NIST aerodynamic database of Ho et al. (2005) is used for this purpose. This database was gathered from straight-line wind tunnel tests on low-rise building models with various dimensions and sizes of openings. In particular, pressure taps were examined from the middle of a windward wall on a building with full-scale dimensions of 38.1 × 24.4 m with a roof slope of 1:12 and an eaves height of 12.2 m. While this is somewhat larger than the dimensions of a typical house, windward wall pressures near the center of the wall (i.e., near the stagnation point) are not likely to be too sensitive to the precise wall dimensions, keeping in mind that the objective is to obtain the ratio of the peak net pressure to peak external pressure for typical residential garage door sizes and volumes. The numerical model was validated by replicating the Oh et al. (2007) study for fixed opening sizes.
In order to better understand the effects of garage door flexibility and variable open areas, two cases of fixed openings are examined initially with the MDE. The first case has a small fixed garage door opening of 0.1% of the front wall area (0.0104 m2), representing a leakage case with the garage door closed, and the second case has an open area of 1.0% (0.104 m2), which represents the relatively large opening caused by door bending just prior to failure. This range of cases will give a baseline of how the pressures depend on open area. In both cases, there is a leakage area of 0.1% on each of three non-windward walls, with static external pressure time histories at these points. Many assumptions could be made here as garage structures vary significantly in terms of the amount of leakage they allow based on how they are integrated into a house, and based on the overall house and garage shape. The assumption here is fairly simple, but represents a common case where each wall allows leakage through other doors or windows.
Figure 10A depicts the external, internal, and net pressures, as a function of (full-scale) time, which is shown in seconds, for a segment of the time series for the nominal leakage case. These segments of the time history allow for an examination of the effects of leakage on the pressures, especially near the peak values. The external pressure (green) time history was taken from the NIST database, as explained above, while the internal pressure (blue) was calculated using the MDE, and the net pressure (red) was calculated via the difference between the external and internal pressure. The data in the figure are presented in full-scale dimensions because the open area in later calculations depends on the dimensional full-scale load. The conversion to full-scale depends on the mean roof height wind speed, which is taken as 36 m/s, similar to the value used by Oh et al. (2007). Of particular importance in the external pressure time history are the peak pressures, with intermittent, large values. The largest peaks typically last for durations of less than a second, such as the one centered at about 560 s.
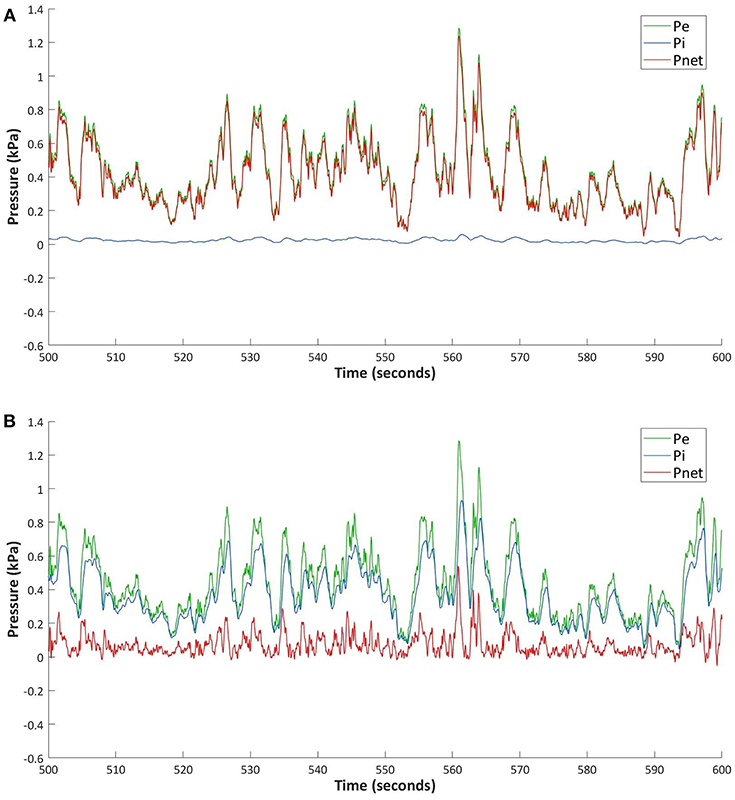
Figure 10. Time-history of external, predicted internal, and net pressure over a small section of the time series of a garage door model with a fixed opening area of (A) 0.1% and (B) 1.0%.
The small leakage opening coupled with the allowance for leakage on all walls results in a mean internal pressure just above zero with minimal variation. The relatively steady internal pressure variation, with close to zero mean pressures, is well-known for leakage cases (e.g., Oh et al., 2007). There is a slight increase in internal pressure when there is a relatively high external pressure and a slight decrease for the lower external pressures. Overall, this results in the net pressure tracking the external pressure closely, with small differences seen mostly when the external pressure reaches peaks. However, the peak net pressures have little reduction with respect to the external pressures. For example, the peak at 560 s, with an external pressure of 1.29 kPa, yields a net pressure of 1.24 kPa, such that the ratio of peak net pressure to peak external pressure is 0.96. In fact, because the internal pressure is almost constant in time, the net pressure at the moment of the peak is approximately equal to the peak external less the mean internal pressure.
Figure 10B shows the same segment of time history as Figure 10A, but for the relatively large (1%) opening case. Once again, the full-scale external, internal and net pressures are plotted as a function of time and, because the same external pressure time series is used, the effects of the open area become visible. As expected, the relatively large open area results in nearly instantaneous changes to the internal pressure when the external pressure changes. The internal pressure closely follows the values and changes in the external pressure, with slightly smaller fluctuations and peaks for this case. However, there is a small delay, on the order of 250 ms (full-scale). This delay is also present in the measurements shown in Oh et al. (2007) and is caused by the relatively slow (compared to the speed of sound) physical movement of fluid into or out of the internal volume that causes the changes to the internal pressure. In this case, the mean net pressure is just above zero because of the small differences between the external and internal pressures. However, when there are rapid changes of the external peak pressures, which result in large peaks, the lag in the internal pressure for this open area size do not allow the internal pressure to attain values as large as the external before the external pressure drops back down. This can be shown quantitatively, for example, for the external and net pressure peaks at 560 s, where the net pressure is 0.54 kPa, resulting in a ratio of net to external peak pressures of 0.42. The important consequence of this is that there is much smaller applied load on the garage door compared to the case with only leakage openings. In fact, if garage door was more flexible, but strong enough to allow even larger open areas, the net load on the door would be even smaller.
Using the quasi-steady response assumption, the process of determining the failure wind speed could be as simple as using a fixed opening case with an opening size around the failure opening size. However, it is not clear that this should be the case because of the time lags between the external and internal pressures, which may be enhanced by the variable nature of the open area as the garage door bends in response to the net load. Hence, the accuracy of this assumption is scrutinized by running a flexible garage door opening case. To simplify the calculations, the fluctuating opening case is used with the SDE to examine these effects.
Figure 11 introduces the flexible garage door model, which leads to a fluctuating open area. This creates a more dynamic relationship between the pressure and the area. Once again, the same segment of time series is shown, and, since the changes in the opening size are now important, they are plotted in Figure 11B along the same x-axis. The relationship between the open area size and the net pressure is governed by Figure 8C. All garage door models that had open area vs. net pressure tracked, had similar curves, and therefore, one curve was used to represent this relationship for all experimentally tested flexible garage door models. As mentioned, the SDE was used to produce the results for Figure 11; however, the net pressure from the MDE large opening case from Figure 10B is included as well, for comparison.
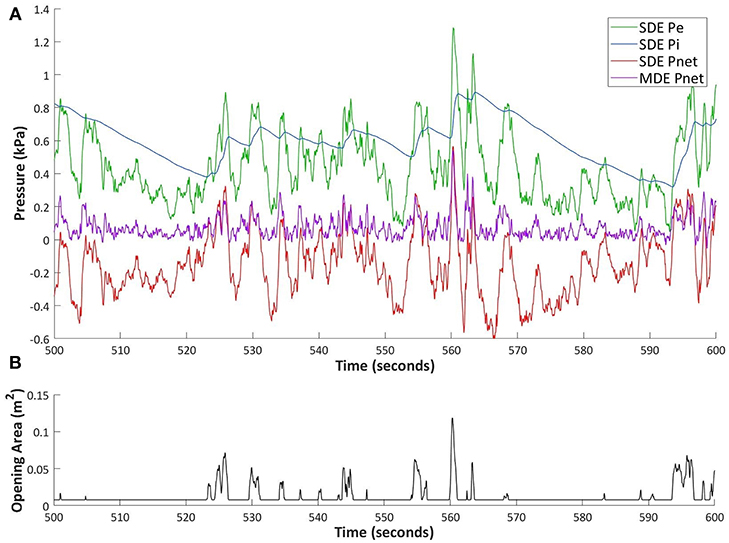
Figure 11. Time-histories of (A) external, predicted internal, and net pressure for the SDE using a flexible garage door, and the net pressure for the MDE for a fixed garage door opening of 1% of door area, and (B) the open area as a function of time for the flexible garage door.
At first glance, the internal pressure time history in Figure 11 appears different from both the leakage and large opening cases. The internal pressure is clearly affected by the external, with much larger fluctuations than seen in the leakage case; however, it does not completely follow the external pressure as seen in the large opening case. This is, of course, due to the fact that the open area, shown in Figure 11B, is alternating between being closed (i.e., the leakage case) and pushed open by large external pressure peaks (i.e., the large opening case).
Somewhat surprisingly, the mean internal pressure is noticeably higher than the mean external pressure. For example, the internal pressure is continuously higher than the external pressure from 505 to 523 s in the time history, and then again from 569 to 583 s. This is due to the rate of increase in the internal pressure during external pressure spikes being higher than its rate of decrease during external pressure lows. Whenever a large spike in the external pressure occurs, it results in the door opening (e.g., 525 second mark). This causes a rush of air to quickly increase the internal pressure. Then, as the external peak reduces, the net pressure also reduces and closes the openings around the garage door. In contrast, when the external pressure drops with a closed door, the internal pressure decreases, but is forced to do so at a slower rate due to only allowing leakage outwards in the SDE setup. This is different than the fixed opening cases where the internal pressure can escape more easily through the leakage in the other walls.
The most important takeaway from Figure 11, is related to the net pressures. When comparing the red SDE and purple MDE net pressures, it is clear that the mean net pressure for the SDE flexible opening case is significantly lower than in the large fixed opening MDE case. However, during the moments of the largest wind gusts, such as the external pressure peak at 560 s, the net pressures are similar. This location, for example, yields a net pressure of 0.57 kPa and a ratio of peak net to external pressure of 0.44 for the SDE flexible case, which is close to the MDE fixed opening net pressure and ratio of 0.54 and 0.42 kPa, respectively. This shows that the MDE large opening case can yield a good estimation of the flexible opening case for the failure wind gusts, and that the SDE flexible opening case works adequately without the additional leakage openings.
Table 4 summarizes the most important statistical parameters of the three opening cases discussed so far, as well as two additional flexible opening cases, which will be discussed in the following section. The open area in the table provides the size of the opening as a percentage of the garage door area for the fixed opening cases. For the flexible opening cases, the maximum and mean opening sizes are provided. One can see that, although the mean opening size for the flexible opening case is close to the leakage opening size, the maximum opening size shows that the peak values in the opening size exceed even the large opening case at times. The maximum external, internal, and net pressure coefficients were found through a Lieblein (1974) BLUE analysis using the largest values from dividing the data into 10 segments. The peaks in Table 4 are median values from the fit. The ratio of peak net to peak external pressure is a key parameter to later determine the failure wind speeds of the garage doors, as explained earlier.
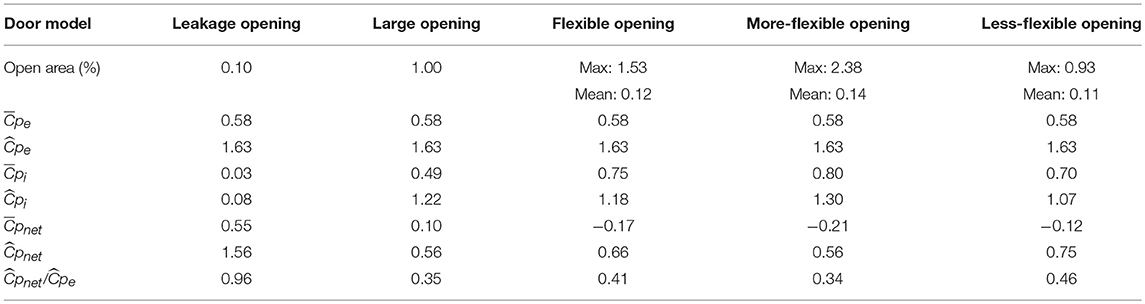
Table 4. Open area and pressure means and maxima of fixed and flexible open area cases.
As would be expected, the peak internal pressure is higher for the large and flexible opening cases, and close to zero for the leakage opening case. This is directly correlated to how quickly the internal pressure can match the peaks of the external pressure, which is related to the size of the opening during the external pressure peaks. Therefore, for the large and flexible opening cases, the peak internal pressures are closest to the peak external pressure. Once again, due to the identical external pressure between the cases, the trends from the maximum net pressures directly correlate with the internal pressures. This causes the leakage case to have the highest maximum net pressure due to its lower peak internal pressure and the large opening case to have a lower maximum net pressure due to its higher peak internal pressure. The maximum net pressure for the flexible opening case is similar to that of the large opening case.
As mentioned, the ratio of maximum net pressure to maximum external pressure is an important parameter. From Table 4, the leakage case has the highest ratio of 0.96, the large opening (1% of door area) case has a lower ratio of 0.35, the flexible opening case has a ratio of 0.41, similar to the large opening case. This shows that a larger opening size leads to a greater reduction in the peak net pressures.
To check the sensitivity of the results, two additional flexible opening models were created with the SDE method. The first model has twice the flexibility while the second model has half the flexibility. These models were created by simply doubling and halving the slope of the open area—net pressure curve used for the flexible opening case, as shown in Figure 12. The flexible opening area vs. net pressure curve was taken as a linear fit to the combined garage door data from experimental testing in Figure 8C. The zero offset in all three models represents the leakage opening of 0.1% of the garage door area, as mentioned earlier.
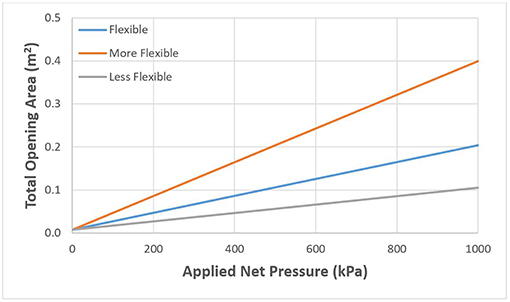
Figure 12. Simplified version of total opening area as a function of applied net pressure for the three flexible opening models.
The statistical results of the additional flexible opening cases can be found in Table 4. In the more-flexible-opening case, since the open area is now twice as sensitive to the net pressure, the fluctuations in the internal pressure are increased. In other words, the external pressure peaks result in larger openings of the garage door, leading to larger peaks in the internal pressure. This leads to both a higher peak and mean internal pressures compared to the flexible opening case.
Interestingly, because the mean internal pressure is higher in the more-flexible-opening case, the net pressure is positive less of the time. Therefore, although the garage door opens wider during large external peaks, the door is actually closed for a larger portion of the time series compared to a less flexible opening case. As always, the trends in the internal pressure create the opposite trends in the net pressure. For the more-flexible-opening case, this means that the larger mean and peak internal pressure lead to smaller mean and peak net pressures. These smaller peak net pressures then directly result in a lower peak net to peak external pressure ratio, taking some of the load off of the door.
For the less-flexible-opening case, as would be expected, the opposite trends to the more-flexible-opening case are observed, relative to the original opening case. Since the open area is now half as sensitive to the net pressure, the fluctuations in the internal pressure are less than the other flexible opening cases, resulting in a lower peak and mean internal pressure. This is due to the more rigid garage door not opening as wide and hindering the increase of the internal pressure during external pressure spikes. The less-flexible-opening case also results in larger (more positive) mean and peak net pressures. This leads to higher peak net to peak external pressure ratios, meaning more of the applied external pressure is being felt by the door as net pressure.
Overall, the most important takeaway from the additional flexible opening cases is that the increased flexibility leads to higher internal pressures, which, in turn, leads to lower peak net to peak external pressure ratios. In other words, for a fixed garage door capacity or strength, a more flexible door would be more resilient. Of course, these higher internal pressures will, at some point, begin to have negative effects on other components of the structure, such as the roof.
Because tornadoes can have significant swings in wind direction during their passage past any building, wind directions other than normal to the opening were also studied, with a focus on the range where the net loads would be inwards. In this analysis, the wind direction normal to the wall is defined as 270°, while the wind direction parallel to the wall is defined as 360°. Figures 13A,B plot the mean and maximum internal pressure coefficients, respectively, as a function of wind angle from 270 to 360° in 15 degree increments for each of the six opening types studied in the internal pressure model. The external pressure is also plotted, which is identical for all opening types.
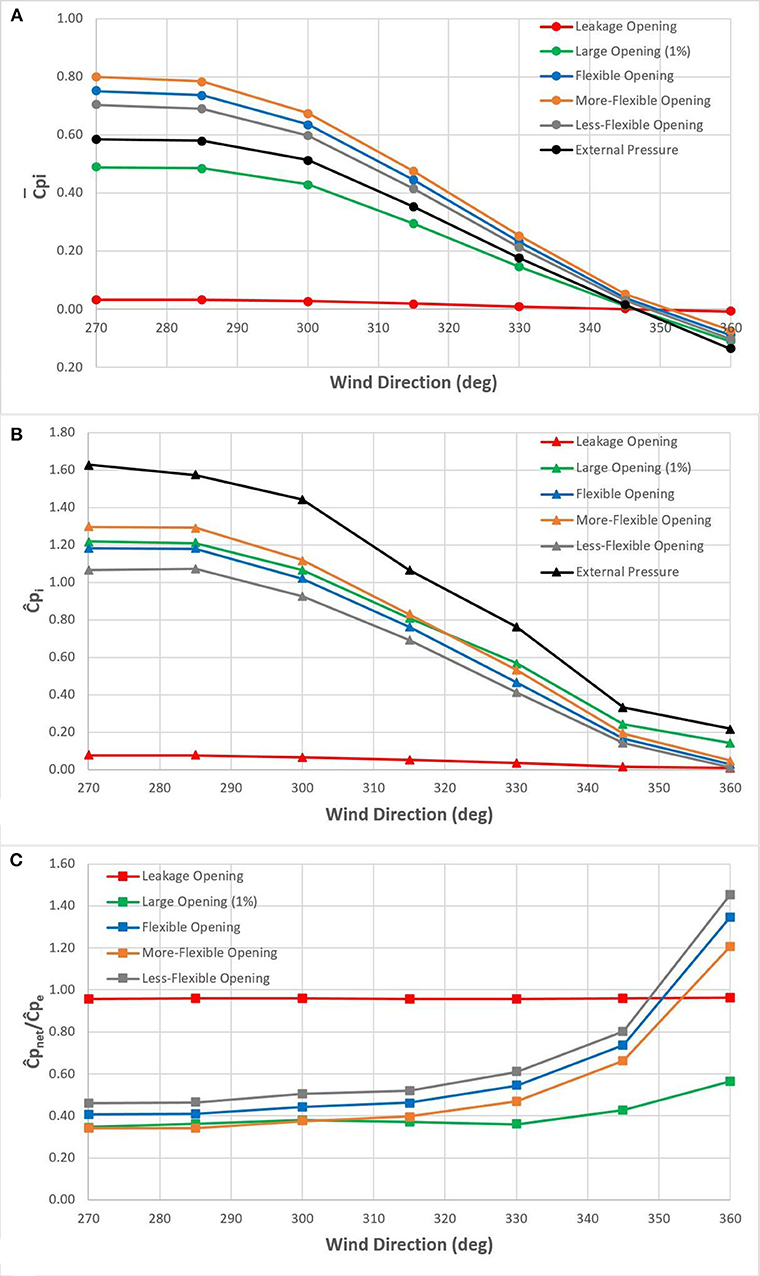
Figure 13. (A) Mean external and internal pressure coefficients, (B) maximum external and internal pressure coefficients, and (C) ratio of maximum net pressure coefficient to maximum external pressure coefficient as a function of wind direction.
In Figures 13A,B, it appears that the relationship with wind direction is similar for all mean and maximum internal pressures across the five openings conditions with the exception of the leakage opening case, which has internal pressures consistently close to zero. For the other four opening cases, the pressures are about the same from 270 to 285°, but then decrease monotonically to 360°. For most of this range, between 300 and 345°, this decrease is well approximated as linear. It is well-known through the literature that external positive pressures in the center of a windward face of a wall are highest when the winds are perpendicular; therefore, it is not surprising that the more oblique and parallel winds lead to lower internal pressures due to the lower external pressures.
Due to the similarity of the trends with wind direction, many of the observations made from the normal wind direction statistics in Table 4 apply to the other wind directions. For the majority of wind angles in Figure 13A, mean internal pressure increases with increased opening size and flexibility in rigid and flexible opening cases, respectively. For these same wind angles, flexible openings produce larger mean internal pressure than rigid openings, with the mean external pressures falling between the rigid and flexible internal pressures. It should be noted, however, that the different models (MDE and SDE) used in the rigid and flexible openings may have played a role in these latter trends.
For the maximum internal pressures in Figure 13B, both the flexibility of the door and size of the opening play a role, once again. The size of the opening seems to be slightly more important in the range of opening size and flexibility studied, as the large opening case has maximum pressures similar to the flexible case, while the leakage case has much lower pressures than all the flexible cases. There also exists a relationship between flexibility of the door and maximum internal pressures, with the increased flexibility resulting in higher pressures when comparing the three flexible opening cases across all wind directions. Unsurprisingly, the maximum external pressures are consistently larger than all internal pressures.
Figure 13C shows the ratio of maximum net to maximum external pressure for the same range of wind directions. Once again, the trends of ratio with wind direction are similar across all the opening cases. The leakage opening ratio remains just below 1.00. For the flexible opening cases, the ratios are mostly constant between 270 and 315°, with rapid increases in the ratio as the wind becomes parallel to the garage door. Although there are high ratios for wind directions parallel to the door, the loads are small for these wind directions.
This third main section of this paper involves combining the results from the experimental testing and the internal pressure modeling to estimate the failure wind speeds of the garage doors. Specifically, the net pressures at failure are needed from the capacity tests, along with the ratio of maximum net to maximum external pressure from the internal pressure modeling. The failure wind speed is calculated using:
where V3S,fail is the failure wind speed of the garage door, pnet,fail is the net failure pressure, GCPe is the peak external pressure coefficient, F is the ratio of the maximum net pressure to the maximum external pressure from the internal pressure modeling, and ρ is the density of air taken as 1.23 kg/m3. The range of peak external pressure coefficients is 1.1 to 1.6 for wind directions of 270–315°, since failure is less likely for other wind directions.
Although six garage doors were tested, only four of them had their net pressure vs. opening area data tracked: the three Product 2 models, and the single Product 3 model. Although only these two different models could be analyzed with internal pressure modeling, they were rather different from each other in strength. From experimental testing, Product 2 had a failure pressure of 0.56 kPa whereas the, stronger, Product 3 had a failure pressure of 1.75 kPa. This disparity in strength ensured that a full range of wind resistance capabilities was being analyzed. Since Product 2 and Product 3 models exhibited similar opening area vs. net pressure relationships, and therefore, similar factors of maximum net pressure to maximum external pressure despite their large difference in strength, it could reasonably be assumed that other garage door models have a similar factor. Therefore, by applying the same method, an estimation can be made for the failure wind speed of the other two models involved in the experimental testing discussed earlier as well: Product 1 and Product 4, despite not having opening area vs. net pressure data for these tests.
To calculate the expected failure wind speeds of the four tested garage doors, values needed to be selected for the net failure pressure, the ratio of peak net to peak external pressure, and the peak external pressure coefficient. The net failure pressures are taken from Table 2, the F value is taken as 0.4 from the large and flexible opening cases (rounded to one significant figure), as these are the opening cases most similar to typical garage doors at failure, and the GCPe is taken as 1.3 from Gavanski and Uematsu (2014). The resulting expected failure wind speeds are rounded to the nearest 5 km/h. The expected wind speeds range from 130 to 265 km/h, and can be found along with the parameters in Table 5.
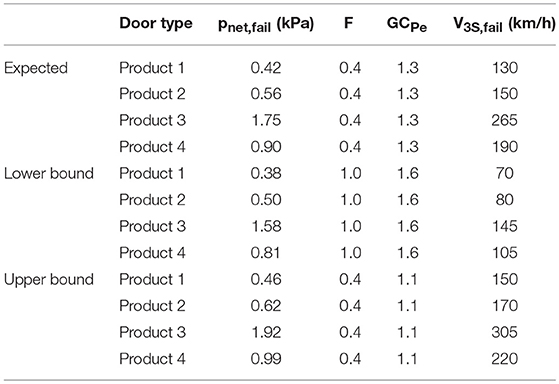
Table 5. Expected, lower-bound, and upper-bound failure wind speeds of garage doors.
As mentioned in the introduction, a garage door failure on a standard wood-frame house falls under the DI, FR12 (one- or two-story family residences) and DOD4 (inward collapse of garage door). FR12-DOD4 has a lower bound wind speed of 130 km/h an upper bound of 185 km/h, and an expected wind speed of 155 km/h. The Product 2 model has an expected failure wind speed similar to the expected wind speed of DOD4. This is likely a more common garage door, seeing as it is not as strong as and less expensive than the Product 3 model. This is likely the type of garage door that the wind speed range for FR12-DOD4 was based upon. The Product 3 model failed at a wind speed much above the upper bound DOD4 of 185 km/h, with an estimated speed of 265 km/h. This highlights the immense variation in strength of various garage door types. An EF-1 tornado commonly produces high enough wind speeds to cause failure in the Product 2 model, but the results suggest it would take at least a weak EF-3 tornado to cause failure in the Product 3 model. Other components would likely fail at these wind speeds for FR12.
The Product 1 and Product 4 models have estimated failure wind speeds around the lower bound of 130 km/h and upper bound of 185 km/h, respectively, of FR12-DOD4. If it can be assumed that these added models have the same F-value as the previous two models, then these results seem to suggest the validity of these EF-Scale wind speeds. Three of the four models fall reasonably within the range of FR12-DOD4, and the strongest among them was much stronger, which was already hypothesized by its high net failure pressure.
In reality, there is not one wind speed that defines the failure of each garage door model. Rather, it is a wide range of wind speeds, as failures will have variation in door strength, door flexibility, wind direction, etc. To account for this range of values, lower bound and upper bound failure wind speeds were added to Table 5, similar to the way bounds are included in the DODs of the EF-Scale. The lower bound wind speed is based on a door with a 10% reduction in strength (failure net pressure) and a higher GCPe value of 1.6. The upper bound wind speed is based on a door with a 10% increase in strength and a lower GCPe value of 1.1. This range of GCPe values represent the maximum and minimum values over the wind direction range of 270–315° from Figure 13B. The lower bound also uses a ratio of peak net to peak external pressure of 1.0, to represent a very leaky, isolated garage where the internal pressure never builds up inside, like in the leakage opening case.
Across all door models and strength/flexibility bounds, the failure wind speeds for the garage doors have a wide range from 70 to 305 km/h, showing the significant difference that adjusting the parameters makes. Product 1, Product 2, and Product 4 models now have lower bound failure wind speeds that dip below the lower bound of FR12-DOD 4, and Product 3 and Product 4 models have upper bounds exceeding the upper bound of FR12-DOD4.
An important conclusion to make from these results is how they should be integrated into the EF-Scale. Some of the calculated extreme lower and upper bound wind speeds are not applicable to the EF-Scale. For example, the lower bound failure wind speeds for Product 1 and Product 2 are below the 85 km/h lower bound for threshold of visible damage (DOD1) for FR12, making them unrealistic. A failure at this low a wind speed would have a very low probability of occurrence. Similarly, the expected and upper bound wind speed for Product 3 is above the 245 km/h upper bound for exterior walls collapsing (DOD7) for FR12, meaning, at this point, the garage door would have failed as a result of the rest of the structure collapsing, especially due to the increased internal pressures from a more flexible opening, mentioned earlier. Based on the failure wind speed results, along with these points, the EF-Scale wind speeds for weaker, 1-layer constructed garage doors, such as Product 1 and Product 2, should be 85–170 km/h, while the wind speeds for stronger, 3-layer constructed garage doors, such as Product 3 and Product 4, should be 105–245 km/h.
In summary, six garage doors of four different models were tested using a PLA system. Door models Product 2 and Product 3 had their total open area recorded as a function of net pressure during testing, which was later used as input into an internal pressure model to determine how much of the external pressure applied by the PLAs was resulting in net pressure on the doors. Combining the experimental and internal pressure results, 3-s failure wind speeds were obtained for each of the garage door models tested, which were then compared to the EF-Scale. The conclusions are as follows:
• From experimental testing, the doors exhibited a range of net pressure capacities and different failure mechanisms. The two weaker models showed failure pressures of 0.42 and 0.56 kPa, respectively, and experienced significant plastic deformation during failure. The two stronger models, however, had failure pressures of 1.75 and 0.90 kPa, respectively, and experienced pull-out failures and/or permanent deformations of the rollers, tracks, brackets, and fasteners.
• The internal pressure modeling computationally examined a series of rigid and flexible garage door models that had a range of peak net to peak external pressure values of 0.35–0.96. The most important values were from the large and flexible opening cases, representing door models Product 2 and Product 3, which had ratios of 0.36 and 0.41, respectively.
• From the above results, expected failure wind speeds of 130, 150, 265, and 190 km/h were found for Products 1–4, respectively. Given the varying nature of each door type with respect to strength and flexibility, upper and lower bounds were found for each model by varying a few key parameters of the failure wind speed equation. This resulted in a larger overall range of failure wind speeds of 70–305 km/h. Clearly, other failures would happen first for the higher end of this wind speed range.
• When comparing these failure wind speeds with FR12-DOD4 in the EF-Scale, reasonably similar winds are found for the three lower capacity products. Stronger doors likely would not be the first significant failure in the sequence.
There are a few items that could be addressed as future work for this research:
• There exist many types of garage doors with various strength and flexibility properties. Testing of more garage door types would be valuable, as well as examining the possible effects of spatial pressure gradients on the garage door response and capacity.
• As mentioned previously, the internal pressure model used in this study is similar to the model used by Oh et al. (2007). The potential issue with this approach, is that Oh's model and the database deal with straight-line winds, whereas this research is applying the results for tornadic winds. Using straight-line winds to model tornadic winds is a method that has been used in past studies, but more work needs to be done to determine how internal pressures behave during tornadoes.
GR was responsible for the failure testing of garage doors along with sections Experimental Setup and Garage Door Test Results of this paper. AJ was responsible for the computational analysis along with sections Internal Pressure Modeling and Failure Wind Speeds of this paper. GK guided and oversaw the entire work.
This research was funded by the Institute for Catastrophic Loss Reduction (ICLR) and the Natural Science and Engineering Research Council (NSERC) of Canada through the Collaborative Research and Development (CRD) program.
The authors declare that the research was conducted in the absence of any commercial or financial relationships that could be construed as a potential conflict of interest.
GR expresses appreciation for the advice and valuable help provided by Mr. Andrew Klazinga, Technician at IRLBH, and Mr. Connell Miller, Ph.D. candidate at UWO, throughout the experimental part of this study.
ASHRAE (2005). “Chapter 27: Ventilation and infiltration,” in: ASHRAE Handbook: Fundamentals (Atlanta, GA: American Society of Heating, Refrigerating and Air-Conditioning Engineers) 27.1–27.31.
ASTM E1233-06 (2006). Standard Test Method for Structural Performance of Exterior Windows, Doors, Skylights, and Curtain Walls by Cyclic Air Pressure Differential. West Conshohocken, PA: ASTM International. Available online at: www.astm.org
ASTM E330/E330M-14 (2014). Standard Test Method for Structural Performance of Exterior Windows, Doors, Skylights and Curtain Walls by Uniform Static Air Pressure Difference. West Conshohocken, PA: ASTM International. Available online at: www.astm.org
Environment Canada (2014). Enhanced Fujity Scale Damage Indicators and Degrees of Damage. Available online at: https://www.canada.ca/en/environment-climate-change/services/seasonal-weather-hazards/enhanced-fujita-scale-wind-damage.html (Accessed April 10, 2018).
Fujita, T. T. (1971). Proposed Characterization of Tornadoes and Hurricanes by Area and Intensity. Satellite and Mesometeorology Research Project; Department of the Geophysical Sciences; The University of Chicago.
Gavanski, E., and Uematsu, Y. (2014). Local wind pressures acting on walls of low-rise buildings and comparisons to the Japanese and US wind loading provisions. J. Wind Eng. Ind. Aerodyn. 132, 77–91. doi: 10.1016/j.jweia.2014.06.020
Ho, T. C. E., Surry, D., Morrish, D., and Kopp, G. A. (2005). The UWO contribution to the NIST aerodynamic database for wind loads on low buildings: Part 1. Archiving format and basic aerodynamic data. J. Wind Eng. Ind. Aerodyn. 93, 1–30. doi: 10.1016/j.jweia.2004.07.006
Holmes, J. D. (1980). “Mean and fluctuating internal pressures induced by wind,” in Wind Engineering (Fort+Collins, CO), 435–450.
Irminger, J. O. V., and Nokkentved, C. (1930). Wind Pressure on Buildings, First Series. Copenhagen: Danmarks Naturvidenskabelige Samfund.
Kopp, G. A., and Gavanski, E. (2012). Effects of pressure equalization on the performance of residential wall systems under extreme wind loads. ASCE J. Struct. Eng. 138, 526–538. doi: 10.1061/(ASCE)ST.1943-541X.0000476
Kopp, G. A., Morrison, M. J., Gavanski, E., Henderson, D., and Hong, H. P. (2010). The “Three Little Pigs” Project: hurricane risk mitigation by integrated wind tunnel and full-scale laboratory tests. ASCE Nat. Hazards Rev. 11, 151–161. doi: 10.1061/(ASCE)NH.1527-6996.0000019
Kopp, G. A., Oh, J. H., and Inculet, D. R. (2008). Wind-induced internal pressures in houses. J. Struct. Eng. 134, 1129–1138. doi: 10.1061/(ASCE)0733-9445(2008)134:7(1129)
Lieblein, J. (1974). Efficient Methods of Extreme-Value Methodology. No. NBSIR 74-602, Washington, DC: National Bureau of Standards.
Liu, H. (1975). “Wind pressure inside buildings,” in Proceedings of the 2nd US National Conference on Wind Engineering Research (Fort Collins, CO: Colorado State University), 22–25.
Liu, H., and Rhee, K. H. (1986). Helmholtz oscillation in building models. J. Wind Eng. Ind. Aerodyn. 24, 95–115.
McDonald, J. R., and Mehta, K. C. (2006). A Recommendation for an Enhanced Fujita Scale (EF-Scale). Wind Science and Engineering Center, Texas Tech University.
Miller, C., Kopp, G. A., Morrison, M. J., Kemp, G., and Drought, N. (2017). A multi-chamber, pressure-based test method to determine wind loads on air-permeable, multi-layer cladding systems. Front. Built Environ. 3:7. doi: 10.3389/fbuil.2017.00007
Morrison, M. J., Kopp, G. A., Gavanski, E., Miller, C., and Ashton, A. (2014). Assessment of damage to residential construction from the tornadoes in Vaughan, Ontario, on 20 August 2009. Can. J. Civil Eng. 41, 550–558. doi: 10.1139/cjce-2013-0570
Oh, J. H., Kopp, G. A., and Inculet, D. R. (2007). The UWO contribution to the NIST aerodynamic database for wind loads on low buildings: Part 3. Internal pressures. J. Wind Eng. Ind. Aerodyn. 95, 755–779. doi: 10.1016/j.jweia.2007.01.007
Pearce, W., and Sykes, D. M. (1999). Wind tunnel measurements of cavity pressure dynamics in a low-rise flexible roofed building. J. Wind Eng. Ind. Aerodyn. 82, 27–48.
Sharma, R. N., and Richards, P. J. (2003). The influence of Helmholtz resonance on internal pressures in a low-rise building. J. Wind Eng. Ind. Aerodyn. 91, 807–828. doi: 10.1016/S0167-6105(03)00005-9
Keywords: garage doors, internal pressures, wind-induced failures, low-rise buildings, tornadoes
Citation: Jaffe AL, Riveros GA and Kopp GA (2019) Wind Speed Estimates for Garage Door Failures in Tornadoes. Front. Built Environ. 5:14. doi: 10.3389/fbuil.2019.00014
Received: 30 September 2018; Accepted: 30 January 2019;
Published: 19 February 2019.
Edited by:
Weichiang Pang, Clemson University, United StatesReviewed by:
Bejoy Alduse, Clemson University, United StatesCopyright © 2019 Jaffe, Riveros and Kopp. This is an open-access article distributed under the terms of the Creative Commons Attribution License (CC BY). The use, distribution or reproduction in other forums is permitted, provided the original author(s) and the copyright owner(s) are credited and that the original publication in this journal is cited, in accordance with accepted academic practice. No use, distribution or reproduction is permitted which does not comply with these terms.
*Correspondence: Gregory A. Kopp, Z2Frb3BwQHV3by5jYQ==
Disclaimer: All claims expressed in this article are solely those of the authors and do not necessarily represent those of their affiliated organizations, or those of the publisher, the editors and the reviewers. Any product that may be evaluated in this article or claim that may be made by its manufacturer is not guaranteed or endorsed by the publisher.
Research integrity at Frontiers
Learn more about the work of our research integrity team to safeguard the quality of each article we publish.