
95% of researchers rate our articles as excellent or good
Learn more about the work of our research integrity team to safeguard the quality of each article we publish.
Find out more
ORIGINAL RESEARCH article
Front. Bioeng. Biotechnol. , 28 September 2020
Sec. Nanobiotechnology
Volume 8 - 2020 | https://doi.org/10.3389/fbioe.2020.569967
This article is part of the Research Topic Biointerfacing 2D Nanomaterials and Engineered Heterostructures View all 7 articles
 Manjot Singh1†
 Carla Zannella2†Veronica Folliero2
 Rocco Di Girolamo3Francesco Bajardi1,4Annalisa Chianese2
 Lucia Altucci5
 Achille Damasco1Maria Rosaria Del Sorbo6Concetta Imperatore7Manuela Rossi8
 Mohammadhassan Valadan1Michela Varra7
 Alessandro Vergara3
 Guanluigi Franci9
 Massimiliano Galdiero2*
 Carlo Altucci1,4*
Interactions of novel bi-dimensional nanomaterials and live matter such as bacteria and viruses represent an extremely hot topic due to the unique properties of the innovative nanomaterials, capable in some cases to exhibit bactericide and antiviral actions. The interactions between bacteria and viruses and two dimensional nanosheets are here investigated. We extensively studied the interaction between a gram-negative bacterium, Escherichia coli, and a gram-positive bacterium, Staphylococcus aureus, with two different types of 2D nanoflakes such as MoS2, belonging to the Transition Metal Dichalcogenides family, and Graphene Oxide. The same two types of nanomaterials were employed to study their antiviral action toward the Herpes simplex virus type-1, (HSV-1). The experimental results showed different bactericide impacts as well as different antiviral power between the two nanomaterials. The experimental findings were interpreted in bacteria on the base of the Derjaguin–Landau–Verwey–Overbeek theory. A simple kinetic model of bacterial growth in the presence of the interacting nanosheets is also elaborated, to explain the observed results. The experimental results in viruses are really novel and somewhat surprising, evidencing a stronger antiviral action of Graphene Oxide as compared to MoS2. Results in viruses are complicated to quantitatively interpret due to the complexity of the system under study, constituted by virus/host cell and nanoflake, and due to the lack of a well assessed theoretical context to refer to. Thus, these results are interpreted in terms of qualitative arguments based on the chemical properties of the interactors in the given solvent medium.
Two dimensional materials (2DMs) have become one of the most explored areas of material science over the past decade because of their outstanding properties which have opened a way for an unparalleled scientific and technological number of applications. 2DMs are the ultrathin nanomaterials with high degree of anisotropy and chemical functionality (Chimene et al., 2015). The era of graphene (Gr) discovery, into single and few layer nanosheets (NSs) has sparked an intense research activity in almost all application areas covering optoelectronics (Ramanathan et al., 2008), catalysis (Guo et al., 2018), energy storage (Patchkovskii et al., 2005; Schedin et al., 2007; Dua et al., 2010), nano-biosensors (Kang et al., 2010; Gravagnuolo et al., 2015; Morales-Narváez et al., 2015, 2017; Cheeveewattanagul et al., 2017), polymer composites (Eda and Chhowalla, 2009), vast areas of biomedical studies (Ghosal and Sarkar, 2018) and many more. To unveil the potential of other 2DMs and to supplement the gapless feature of Gr, semiconducting 2D transition metal dichalcogenides (TMDs) such as MoS2/WS2 have been studied nicely because of their tunable band gap and crystal structure engineering. 2D TMDs held a great promise in electronics and optoelectronics because of their captivating properties. Besides this 2D TMDs have also been used in combination with Gr in applications such as field effect transistors (Late et al., 2012), energy storage (Yun et al., 2018), nano-biosensors (Yu et al., 2017), photo catalysis (Quinn et al., 2013; Hai et al., 2016) and biomedical sciences (Kaur et al., 2018), to name only a few (Wang et al., 2015; Sun and Wu, 2018) (Huang et al., 2013; Kong et al., 2013).
To utilize the 2D TMDs in biomedical applications, green and scalable production routes are critically required to understand their fate when in combination with living matter. Additionally, control over their production route will endow them with significant biocompatibility and tunable surface chemistry. Various fabrication techniques such as mechanical exfoliation (Ottaviano et al., 2017), epitaxial growth (Liu K. K. et al., 2012), hydrothermal and solvothermal production, ion intercalation (Zeng et al., 2011; Anto Jeffery et al., 2014; Zheng et al., 2014; Fan et al., 2015) and ultra-sonication have been employed to synthesize a broad family of 2DMs. Among the above cited fabrication methods, ultra sonication serves as an effective exfoliation strategy to obtain clean and defect free NSs where other methods failed due to low yield, expensive and complex equipment and intense use of harsh chemicals. Over the past years, substantial and remarkable efforts have been made toward the green production of TMD NSs (Nicolosi et al., 2013; Pan et al., 2016; Kaur et al., 2017b; Kaushik et al., 2018). Coleman and colleagues first utilized the liquid phase exfoliation (LPE), to be the most promising route to obtain clean and large scale production of monolayer and few-layer MoS2/WS2 NSs in numerous solvents by exploiting the concept of surface tension (Cunningham et al., 2012; Nicolosi et al., 2013; Backes et al., 2016b).
Kaur et al. (2017a) fabricated MoS2/WS2 NSs and MoS2-Gr hetero-structures by LPE in water-ethanol mixture. But the use of high boiling point and toxic solvents came up with a major difficulty in utilizing these solvents especially for biomedical applications. For instance, the presence of residual toxic solvent in the final samples, even in very low concentration, can impose adverse health impacts. According to the Hansen’s theory of solubility (Hansen, 2007), water is considered as a poor solvent and shows meager dispersibility of 2D TMDs. To overcome this trouble either with surfactant, polymer, enzyme or inorganic salt can be added to the solvent in sample fabrication to enhance the stability of 2D TMDs in water (Yao et al., 2013; Backes et al., 2014; Qi et al., 2015).
Interestingly, nano-objects of various types have demonstrated actions and impacts on live matter, there including both in vitro and in vivo cases. Apart from the extensive use of metal nanoparticles in antimicrobial studies, Gr and 2D TMDs have been widely studied so far to develop new technologies and novel antibacterial and antiviral nanocomposites to deal with the serious issues related to bacterial and viral infections. The considerable potential of MoS2 NSs in various biomedical applications also grasps its key role in synergistic antibacterial and antiviral action on various pathogens (Wu et al., 2016; Qu et al., 2017; Zhang et al., 2017, 2018, 2019; Kaur et al., 2018; Yuwen et al., 2018; Cao et al., 2019; Roy et al., 2019; Tang et al., 2020). The mechanism explained in the reported literature reveals a significant induction of physical damage and oxidative stress to the bacterial membrane which results in continuous disruption of bacterial cells and finally in cell death. As a result of these studies, MoS2 NSs turn out to be a better potential candidate than its derivatives in some cases, for the sake of bactericide and antiviral action.
The interactions of 2DMs with viruses has been less investigated, so far, as compared to that with bacteria. These studies mostly focused to date on Gr and graphene oxide (GO) samples tested on viruses. For example, recently nanoGr derivatives with polyglycerol sulfate and long alkyl chains have been tested in their interactions with HSV-1, with a highly time consuming fabrication protocol and multiple functionalization strategies (Rathinam et al., 2014; Deokar et al., 2017; Gholami et al., 2017; Donskyi et al., 2019). GO which is one of the most important graphene derivatives and a significant 2DM for various biomedical applications has been studied extensively for its novel antiviral action. Different multiple fabrication and functionalization routes have been adopted to exfoliate GO to enhance its antiviral action on different kind of enveloped and non-enveloped viruses (Sametband et al., 2014; Song et al., 2015; Ye et al., 2015; Chen et al., 2016; Cheng et al., 2017; Yang et al., 2017; Chekin et al., 2018; Du et al., 2018). In all of these cited research articles, modified Hummer’s method with complex functionalization and time consuming water based dispersion of GO nanosheets (GO NSs) have been employed.
To this aim, we have pushed our scientific efforts to knock at the door of 2DMs family to study the synergistic antibacterial and antiviral action of MoS2 to be compared with that of GO NSs, chosen as a reference material due to its documented bactericide and antiviral action (Sametband et al., 2014; Song et al., 2015; Ye et al., 2015; Chen et al., 2016; Cheng et al., 2017; Yang et al., 2017; Chekin et al., 2018; Du et al., 2018). Thus, here we tested the interactions of MoS2 and GO NSs with a gram-negative bacterium such as Escherichia. coli (E. coli) and with a gram-positive bacterium such as Staphylococcus. aureus (S. aureus), in addition with the interactions with an interesting enveloped virus such as Herpes simplex virus type 1 HSV-1, responsible for widely spread infections to the face area (mouth and eyes), to the throat and sometimes to the central nervous system.
Thus, here we first fabricated GO and MoS2 NSs enhancing the stability of the nanoflakes using LPE in pure water with a careful optimization of the initial sonication parameters, such as initial concentration (Ci), sonication time (ts), amplitude of the sonicator device (As) and sonication vial. These parameters play a key role in defining the quality of exfoliation in various organic solvents, aqueous surfactant solutions and in pure water as well. We progressed in this way in the issue concerning the poor stability in water dispersed 2D NSs.
Produced dispersions were characterized by means of UV-Visible and Raman spectroscopy, zeta potential (ζ-potential) for surface charge analysis, scanning and transmission electron microscopies (SEM and TEM, respectively). For the morphological characterization of antibacterial and antiviral action of MoS2 and GO NSs on the given pathogens.
Very interestingly, we found a very different impact of both materials, MoS2 and GO, on bacteria and HSV-1.
As for bacteria, MoS2 showed a considerable bactericide effect in a short incubation time, 3–6 h, with both S. aureus and E. coli, whereas for GO the antibacterial action was lower and only began after 20 h incubation. Results in bacteria samples were interpreted in terms of the Derjaguin–Landau–Verwey–Overbeek (DLVO) theory (Thwala et al., 2013) that essentially accounts for the Liftshitz-van der Waals (LW) and the electrostatic interactions (EL), the latter due to the surface charge of bacteria on the one hand and of NSs on the other. By relying on a simple statistical approach, we could also estimate the probability per unit time for a bacterium, S. aureus or E. coli, to be killed by the damaging action of MoS2 NSs in our experimental conditions.
In order to evaluate the effect of MoS2 nanoflakes dispersed in water on HSV-1 we measured the infectivity inhibition possibly due to their interactions with viruses for four different experimental schemes: virus pre-, co-treatment with cells and viruses and cell pre- and post-treatment. To the best of our knowledge, the antiviral action of water-based dispersion of MoS2 NSs, i.e., fully biocompatible samples of this nanomaterial, on HSV-1 has not been reported so far in the literature. Moreover, thanks to our optimized fabrication technique, we could reach high concentration of NSs in our samples. GO NSs actual concentration in pure water was as high as 600 (GO-1) and 1400 (GO-2) μg/mL, which is consistently higher than that used be (Sametband et al., 2014) in similar experiments. As a result a strong antiviral effect in virus pre and co-treatment experiments with HSV-1 is found. MoS2 NSs concentration was in the range of 100–200 μg/mL, a concentration that turned out to be essential to observe antiviral effects in some of the co-treatment and virus pre-treatment experiments. Interestingly, the comparative impact of MoS2 and GO on HSV-1 was reversed with respect to what found in bacteria: while GO had a pretty strong antiviral effect in the virus pre-treatment and co-treatment experiments, MoS2 only induced some antiviral action in the virus pre-treatment case, while no antiviral effect was noted in either cell pre-treatment and post-treatment cases. The results found in viruses were interpreted in a more qualitative manner, since experiments with viruses are more complicated than with bacteria, due to the presence in the interaction of a third actor: the model Vero cell.
To summarize in a quick pictorial way our main experimental findings we report hereafter a table (Tables 1A,B, for bacteria and viruses, respectively) with a different color associated to each different interaction case going from hot red, for the strongest interaction, to lighter and lighter until white for the weakest looking like no interaction at all.
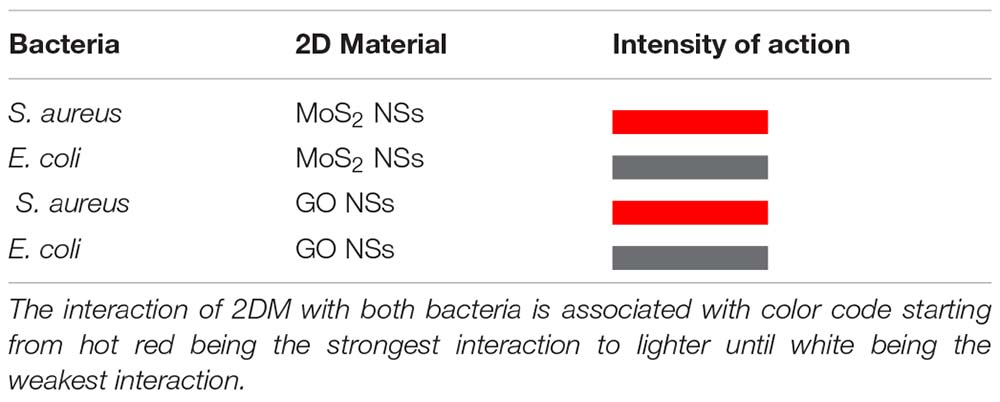
Table 1A. Summary of anti-bacterial actions of MoS2 and GO NSs on the tested pathogens, S. aureus and E. coli bacteria.
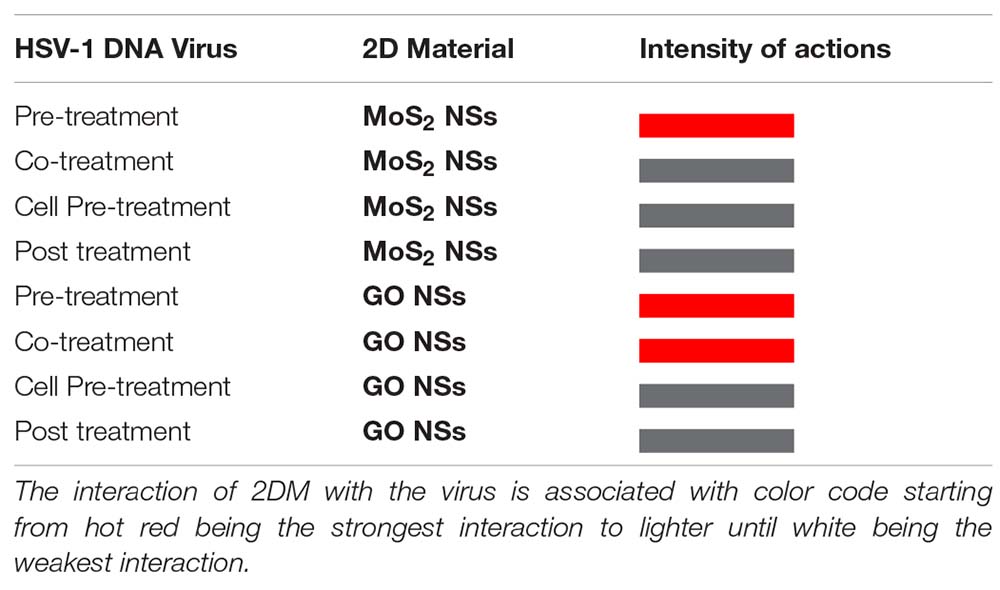
Table 1B. Summary of anti-bacterial actions of MoS2 and GO NSs on the tested pathogens, S. aureus and E. coli bacteria.
To obtain a stable dispersion, our main focus was to carefully optimize the pre-sonication and post sonication parameters. In our previous article (Kaur et al., 2018), we were able to exfoliate MoS2 NSs in pure water with a good amount of stability to make the dispersions ready for various biomedical tests with live-matter. Then, inspired by Varrla et al. (2015) and Backes et al. (2016a, 2017), we adopted two-step exfoliation route with a motive to obtain good quality of 2D nanoflakes (particularly to avoid impurities), to enhance the final concentration and stability of the dispersion. It is worth to mention that apart from the sonication parameters, shape of the glass tube and of the probe, and minimum distance between probe and bottom of the tube used for exfoliation are of utmost importance to achieve highly stable dispersions. The latter case has been nicely explained by Santos et al. (2009) using the concept of dead zones for an efficient exfoliation. Immediately after the exfoliation the obtained dispersion was centrifuged at 2500 g (using Eppendorf Centrifuge 5810 R, Rotor F-34-6-38) for 90 min followed by the re-dispersion of the sediment into the fresh elix water of the same volume. Subsequently, a second step of exfoliation was carried out for longer duration (4 h) and at 55% amplitude. During exfoliation, the pulse mode was selected for 10 s on and 10 s off along with proper ice bath system to avoid the degradation of the exfoliated nanoflakes due to overheating. A careful check on the consistency of output power calculated from the energy obtained after every 40 min was maintained so to have an idea of the efficiency of exfoliation using the given parameters for longer duration. Furthermore, the fabrication and centrifugation parameters adopted for the exfoliation of GO NSs was different from that of MoS2. The corresponding details are reported in section “Materials and Methods.” Experimental details are reported in the Supplementary Material (SM).
The extinction spectra in the UV-visible region of MoS2 samples contain the contribution from both absorbance and scattering components. Both of these components are size dependent. In our centrifugation protocol at 40 and 160 g, the scattering component was dominant with high extinction peaks at 750–800 nm. At higher centrifugal forces, 1000, 2000, and 3000 g, the characteristic excitonic transitions are observed and the scattering background is reduced. In addition, the A-exciton peak shifted toward the lower wavelength region which is related to decreasing layer number. With the increase in centrifugal force, number of layers per flake decreases which results in few layered enriched dispersions. The corresponding UV-Vis spectra is shown in Supplementary Figures S1A–C together with the estimation of average number of layers, <N>, and lateral size, <L>, done through equations 1 and 2 in Supplementary Material (Backes et al., 2014), We notice that for GO the wavelength is read at 230 rather than 345 nm (Lai et al., 2012) as shown in Supplementary Figure S3.
Raman spectroscopy is a widely employed tool to estimate the thickness of TMD nanoflakes. Sample spatial homogeneity was tested via Raman micro-spectroscopy, by at least triplicating the Raman spectra of both MoS2 and GO (data not shown) in different sample spots. As for MoS2, the Raman spectrum shows two characteristic bands at, which corresponds to the in-plane and out-of-plane vibrational modes, that for bulk fall at about 380 cm–1 and 403 cm–1, respectively. MoS2 nano-structuring modifies the Raman features of the bulk with an increase for the frequency and a corresponding decrease of the A1g.
The frequency shift allows for an identification of the number of layers in the nanoflakes. the Raman spectra of MoS2 nanoflakes centrifuged at 2000 and 3000 g are shown, with laser excitation at 514.5 nm in Supplementary Figure S4. We observed similar modification in the Raman spectrum compared to bulk for both centrifugal protocols, with a common range of frequency shift ΔνMoS2 of peaks ranging in the 23–24.6 cm–1 window. The ΔνMoS2 range observed via Raman micro-spectroscopy corresponds to a nano-structuring spanning from 2 to 4 layers. These micro-Raman spectroscopy results look consistent with the range of nano-structuring indicated by UV-Vis extinction spectroscopy.
Generation of surface charges over the surface of 2D NSs plays a crucial role to understand the stability of LPE dispersions. To identify these surface charges, electrophoretic mobility measurements (μ) are performed. μ is proportional to the electric double potential around the charged nanoflake in the given solvent, the so-called ζ-potential (Gupta et al., 2015). In case of 2DMs, dynamic interactions among the NSs and their electrostatic stabilization play a fundamental role to anticipate the stability of liquid dispersions. It was observed that after the exfoliation, the MoS2 flakes exhibit high surface charge density depending upon the different centrifugal forces applied as seen from the Table 2. Generally, defect free MoS2 NSs are neutral and nanomaterial with no surface charge will precipitate in the end. Exfoliation of MoS2 NSs in water might have generated charged edges which were responsible for the stabilization of dispersed nanoflakes in pure water.

Table 2. ζ-Potential values of MoS2 NSs dispersion at different centrifugal forces.
Raman spectra for GO NSs is reported in Supplementary Figure S5.
Exfoliation of 2D MoS2 NSs in water gave intriguing results in terms of its stability and morphology. Because of the poor solubility of MoS2 NSs in water it is very challenging to obtain a stable dispersion, resulting in a deposition of the dispersed 2D NSs onto substrates. Figures 1A–D represents the SEM analysis of water exfoliated MoS2 NSs centrifuged at 2000 g (Figures 1A,B) and 3000 g (Figures 1C,D). As it is clear in Figures 1A,B elongated clusters of 2D NSs are deposited. Sharp edged morphology with maximum density per unit surface was observed in the center of the given substrate used for deposition. In Figure 1C, randomly oriented nanoflakes having sharp-edges have been observed. In Figure 1D random deposition of small 2D NSs along with a very big sharp-edged nano-knife in the center are visible. Sharp-edges of 2D nanoflakes once in touch with biological membranes result in severe damage, either giving a puncture effect or a cut into the membrane.
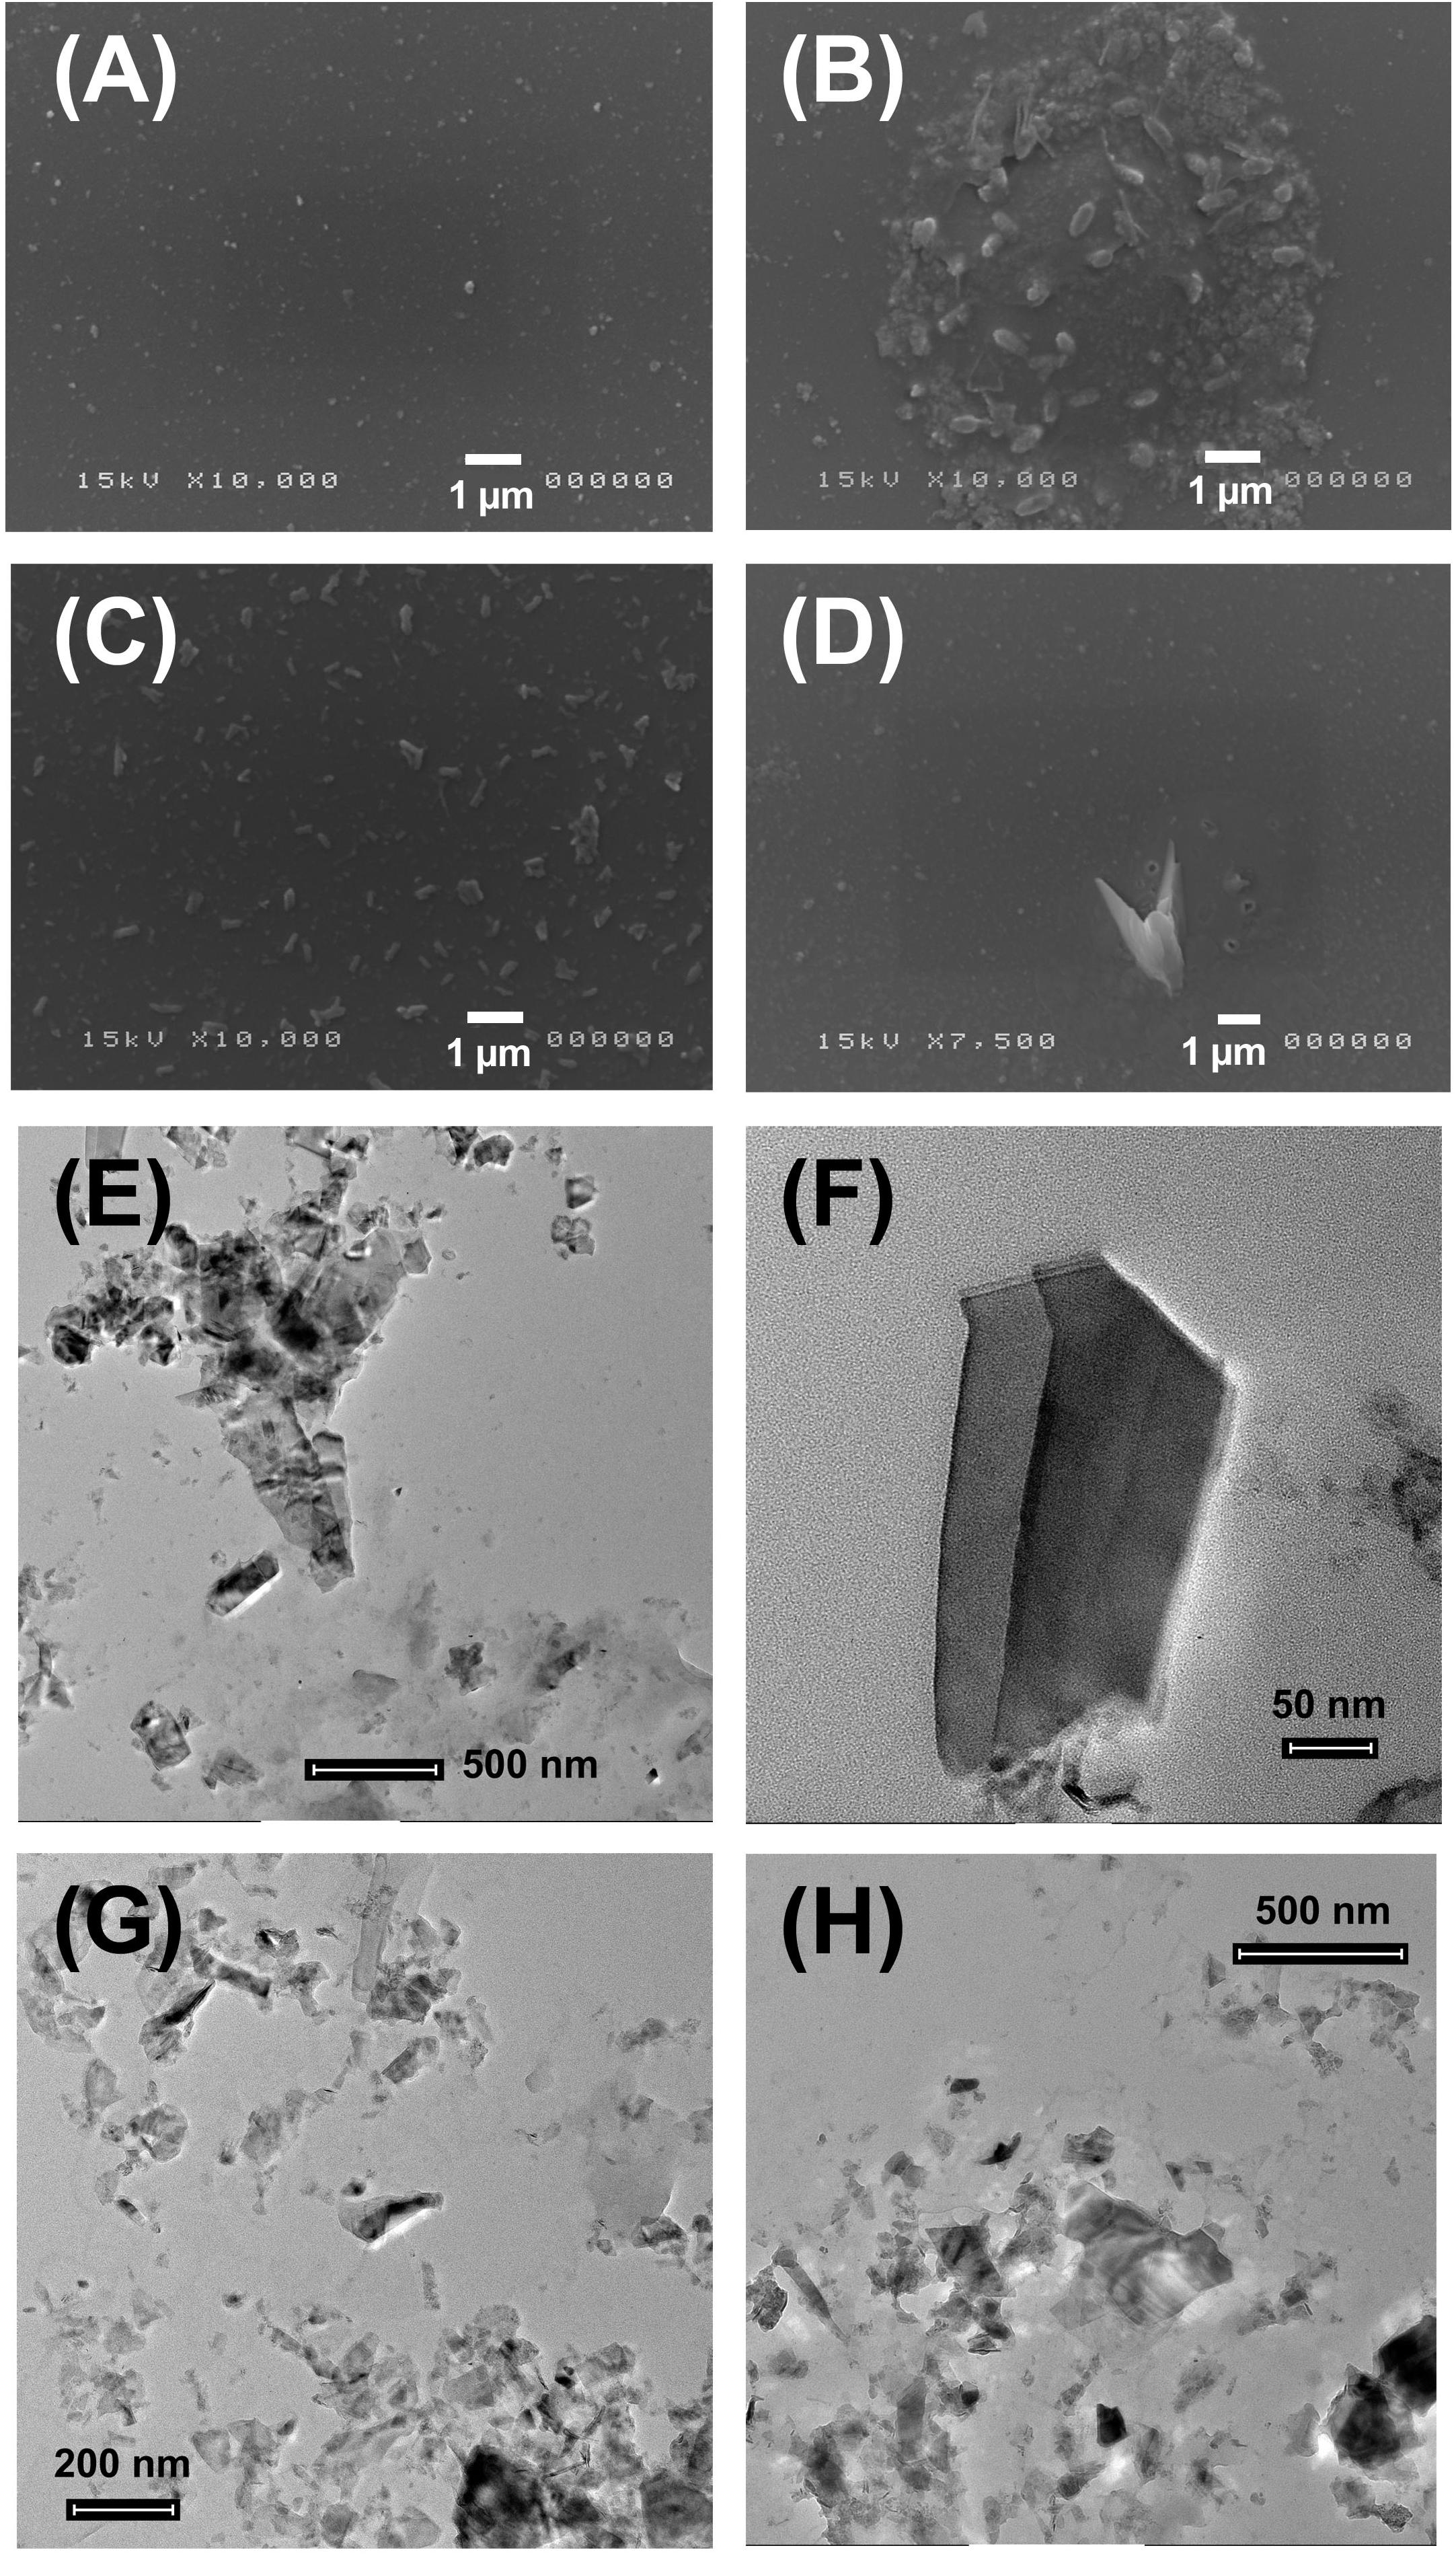
Figure 1. SEM and TEM representation of water dispersed MoS2 NSs at different resolutions (50 nm – 1 μm). (A–D) SEM analysis of MoS2-H2O dispersed NSs centrifuged at 2000 and 3000 g deposited on the gold sputtered silicon substrate. (E–H) TEM analysis of MoS2-H2O dispersed NSs centrifuged at 2000 and 3000 g deposited on the carbon grid. Scale bar for TEM is in the range of 50 nm – 500 nm and for SEM is 1 μm.
We collected in Figures 1E–H TEM images of water exfoliated 2D NSs centrifuged at 2000 g (Figures 1E,F) and 3000 g (Figures 1G,H). Figure 1E shows few layer large ultrathin NSs with a wrinkled surface. A number of small NSs are placed onto the large chunk of NSs. In Figure 1F a very large and sharp-edged nanoflake is displayed. In Figures 1G,H a large number of NSs is visible, some of them being single layer. A chunk of multilayer NSs, aggregated in some portions of the deposited substrate, is due to evaporation with consequent aggregation.
Escherichia coli and Staphylococcus aureus were chosen as two microbial strains to investigate the antibacterial efficacy of directly water-exfoliated 2D MoS2 NSs at a range of concentrations. MoS2 NSs in general have been fabricated with an improved version of LPE, based on a two-step exfoliation route which enhances the overall stability and concentration of the final dispersion to render it suitable for various biomedical tests.
Both strains were used to evaluate the antibacterial capability of the nanostructure by broth micro-dilution method. The interaction of MoS2 NSs with the bacteria after culturing for 3 h, was observed by using SEM.
From the histograms shown in Figures 2A,B, where the bacterial growth inhibition (see section “Materials and Methods” for its calculation) is reported at various NSs concentrations and for 3, 6, and 20 h treatment duration, a significant antibacterial effect is observed at the concentration of 25 μg/mL. The antibacterial action of MoS2 NSs is due to mechanical lesions of the membranes of both bacteria (E. coli and S. aureus), as illustrated by the SEM images. In (A), the antibacterial effect decreases as the incubation time increases: at 12.5 μg/mL, the inhibition reaches 25%, remaining below 20% at higher concentration. At 20 h incubation, the antibacterial effect saturates and the inhibition growth reduces to 10%, with a substantial drop of the bactericide action. In (B), the antibacterial effect of 2D MoS2 NSs was a bit higher than for S. aureus in (A). At 25 μg/mL, a significant growth of the inhibition is visible which follows a decreasing trend with decreasing concentration when incubated for 3 h. At 6 h the antibacterial effect was in the 20-30% range, decreasing at low concentrations. At 20 h incubation, NSs are no more active.
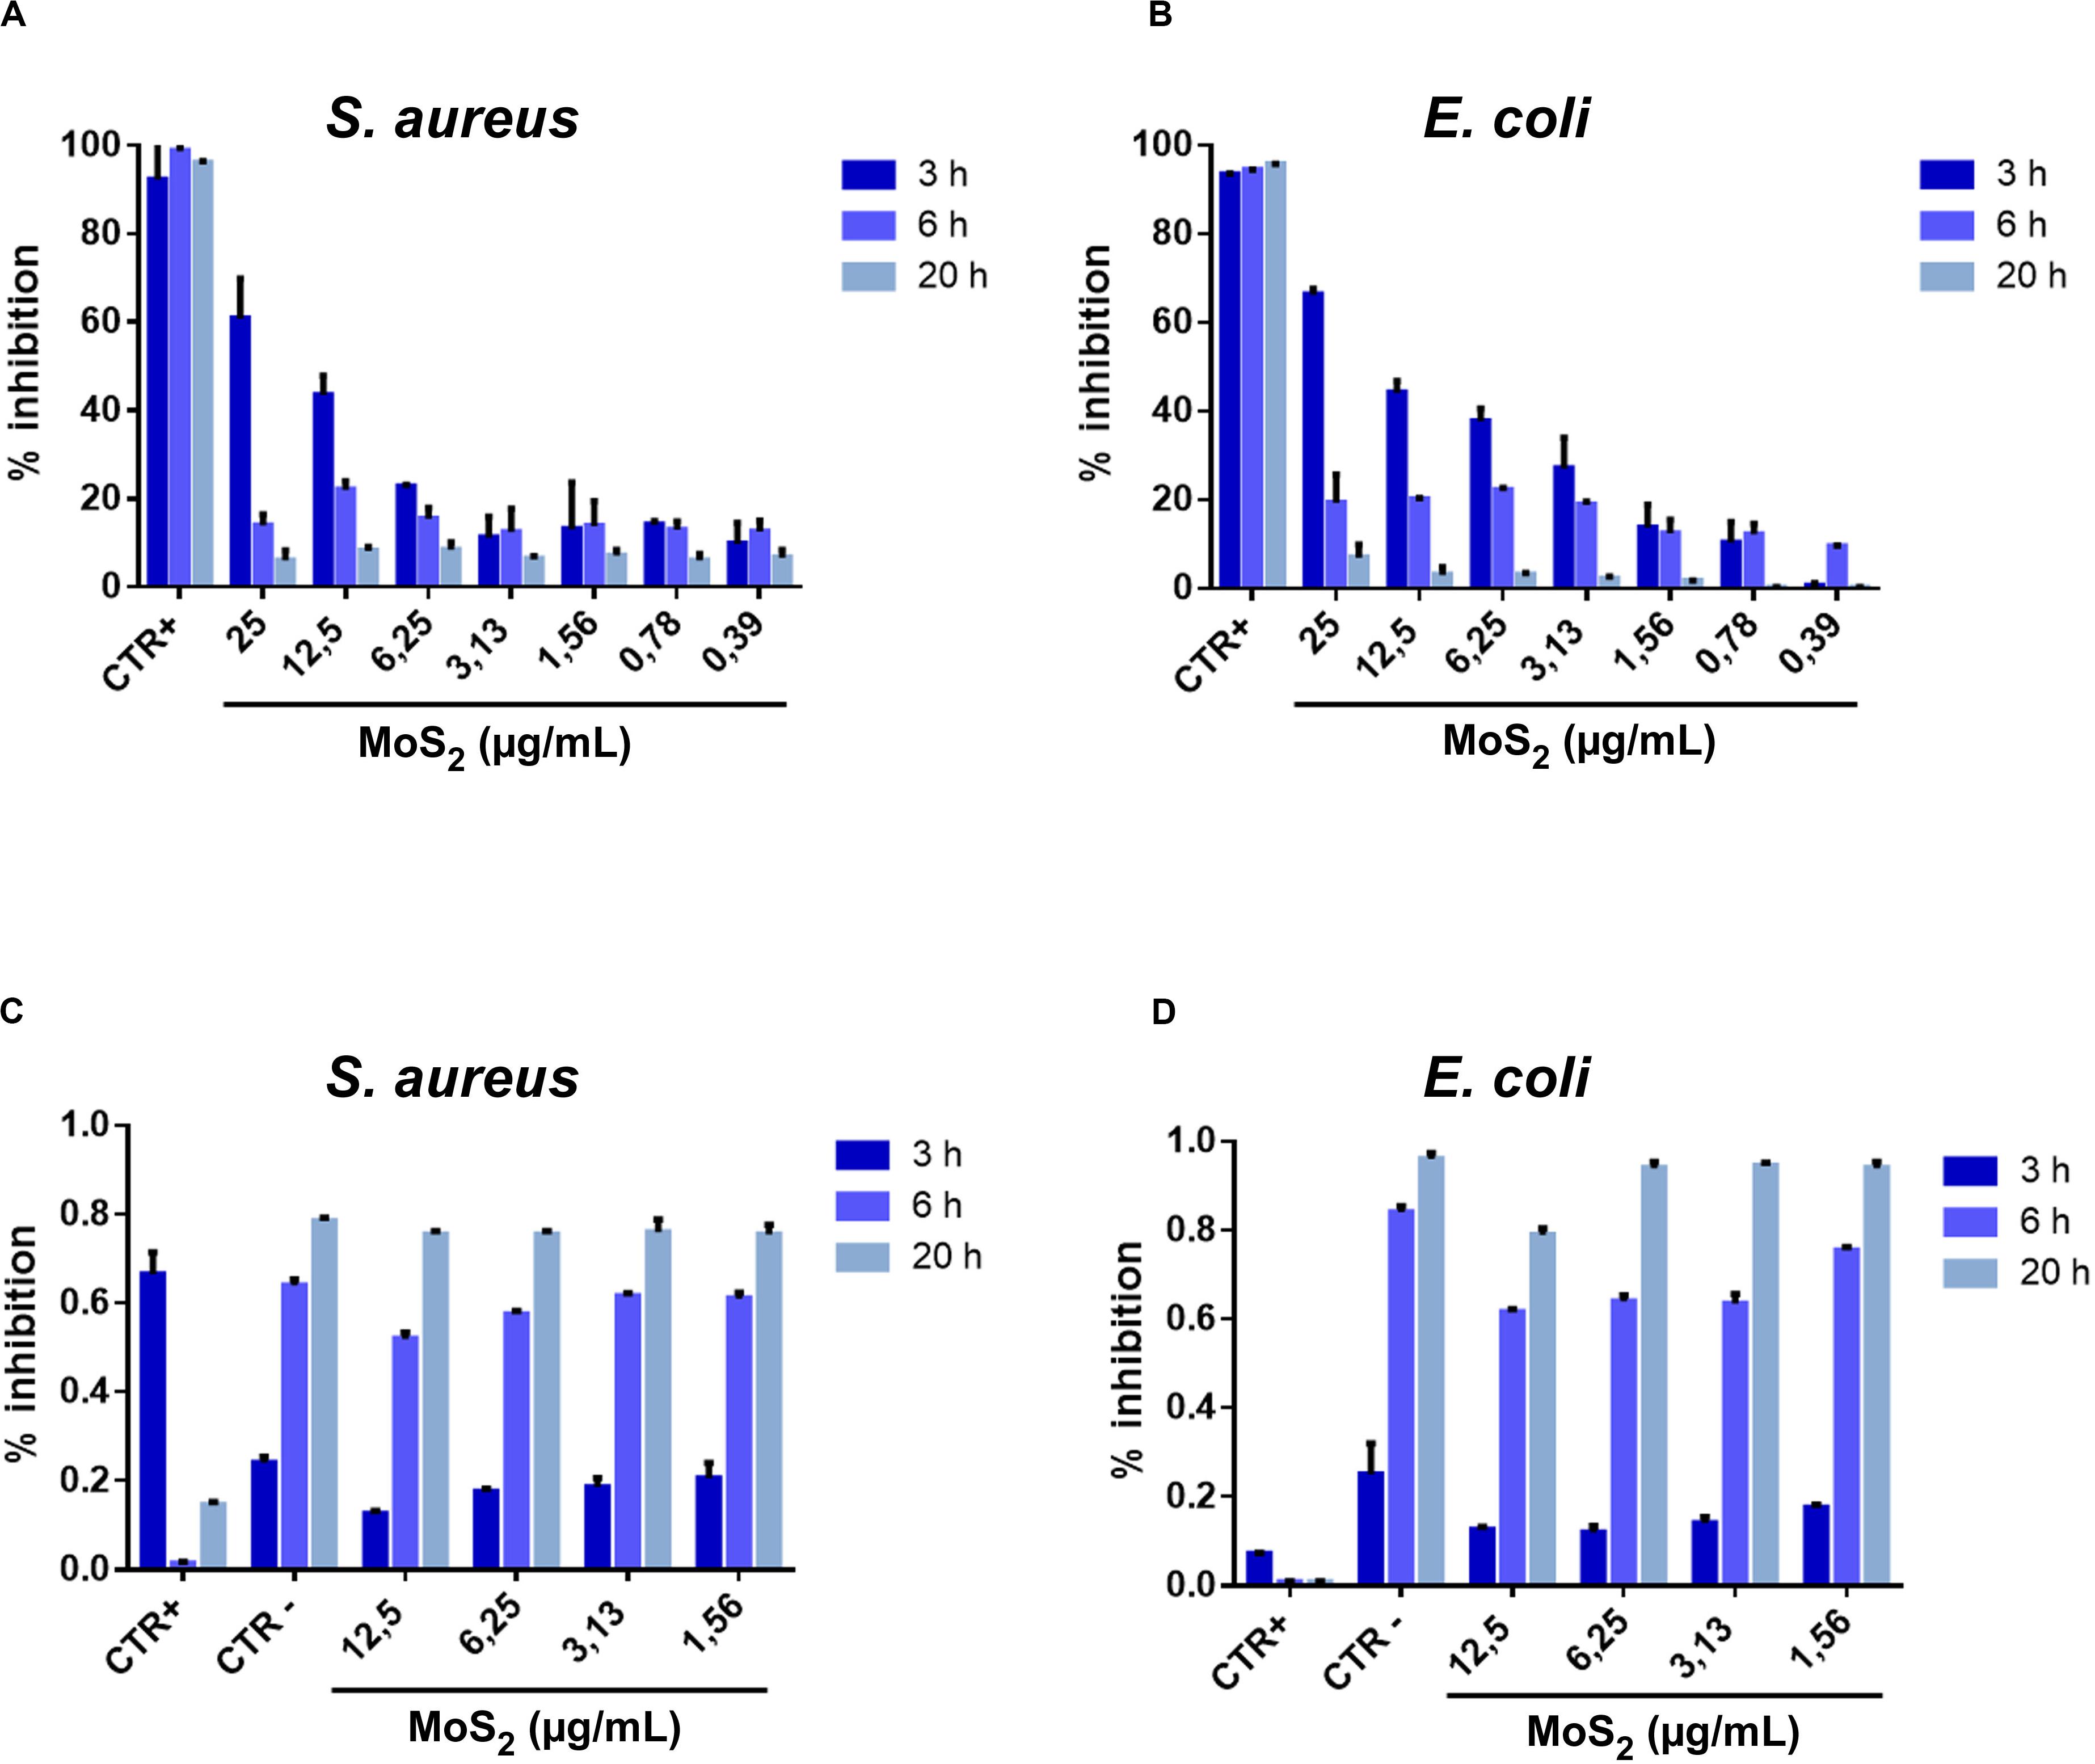
Figure 2. Percentage of bacterial growth inhibition after treatment with MoS2 NSs. (A,B) Histograms related to S. aureus (A) and E. coli (B) illustrate the antibacterial property of MoS2 NSs after interaction for 3, 6, and 20 h at various incubated concentrations. (C,D) Bacteria viability as measured by the optical density of the target at 600 nm (OD600) for different MoS2 NSs concentrations after interaction for 3, 6, and 20 h. (C) For S. aureus and (D) for E. coli. Ampicillin and vancomycin represented the positive controls for E. coli and S. aureus, respectively. The negative controls were consisted of deionized water. The data statistical error is standard deviation of three independent experiments. P-value is less than 0.05.
Figures 2C,D represent the dynamic conditions used for the bacterial growth in presence NSs. Bacteria treated with NSs in Brain Heart Infusion liquid broth grow significantly, thanks to the appropriate nutrients.
We notice that, coherently with the measured inhibition reported in (Figures 2A,B), while we see an effect after 3 h incubation, this effect is nearly absent after 6 h and disappears completely after 20 h. This effect is modest because of the investigated low concentration range of MoS2 NSs in the dispersion and linearly scales with increasing the NSs concentration. For 3 h incubation the action is somewhat stronger for E. coli than for S. aureus, as shown in panels (Figures 2C,D).
The exposed sulfur layers of TMDs act as soft Lewis base which have strong affinity for metal ions. Exfoliated 2D TMD NSs undergo oxidative dissolution in a given aqueous media (Rodriguez et al., 2020). Membrane stress in atomically thin 2D NSs and high surface area to volume ratio have been accounted for the exposable cytotoxicity of 2D TMDs. Another reason for this toxicity is their aggregation which depends on features such as, thickness, surface area, and exposed edges (Mohona et al., 2019).
The DLVO theory analyzes the behavior of particles between forces, the principal ones being the van der Waals (vdW) force, typically attractive, and electrostatic repulsion (ER).
The net effect of two DLVO forces decides whether a 2D NM colloidal suspension will remain stable or not. The vdW force depends on the intrinsic properties of the material and the intermediate medium. The electrostatic force depends on acquired material properties, such as surface charge and radius, and other environmental parameters like electrolyte types, composition, and concentrations in the aqueous medium which can be twisted to tune colloidal interactions. The surface charge and distribution of associated counter-ions are sensitive to the nature and concentration of salts in the aqueous media. For a colloidal dispersion to be stable, the ER forces must be in large excess of the vdW.
Interestingly, by measuring the bacterial inhibition it is possible to estimate the killing rate for a NSs of MoS2 to kill by damaging action a bacterium in the unit time, either for E. coli and S. Aureus, in our conditions of nanosheet and bacteria concentration and in our solvent medium (de-ionized water). By knowing this rat, kkill, one can also estimate the bacterium half-life, t1/2kill, to half the bacterial population because of the NSs damaging effect, in case bacteria would not reproduce. In fact, by assuming no saturation effect for the bacterial growth and for NSs antimicrobial action, the growth rate of the bacterial population, N(t), can be written as:
where k is the overall rate of growth of bacteria and is given by:
k0 and kkill being the population growth rate in absence of the NSs and the killing rate for a NS to kill a bacterium in the dispersion, respectively.
The inhibition, IN(t), as a function of the incubation time, t, can be written as:
where N0 is the initial bacterial population. Then, from equations (2–4), integrating equation (2) with the initial condition N(t = 0) = N0, we can easily obtain for pkill:
where we assumed the initial incubation time to be zero. Therefore, by measuring the inhibition versus the incubation time, IN(t), we can estimate kkill(t) in the conditions of concentration of our experiments.
Thus, for instance, for t = 3 h and the highest concentration of MoS2 nanoflakes of 25 μg/mL, we obtain from Figure 2A:
where we have set IN(3h) ≈ 0.6/0.9 ≈ 0.67 at 25 μg/mL, since we have subtracted a background noise of about 10% from the positive control line as reported in Figure 2A. From equation (6) we can estimate the bacterium half-life, t1/2kill, namely the time it takes for the bacterial population to be halved because of NSs damaging, in case bacteria would not reproduce. We obtain, then:
meaning that in approximately a couple of hours incubation time the S. aureus population would be halved due to the antimicrobial effect of MoS2 NSs, in our experimental conditions. This time should be compared with the bacterial doubling time that characterizes their growth, which is much shorter both for S. aureus, approximately 24 min (Domingue, 1996) in the typical laboratory conditions such as in our experiments, and E. coli, in which case it is reported to be 20 min (Gibson et al., 2018). For a NSs concentration of 25 μg/mL the average number of MoS2 NSs per mL is approximately 2.2 × 10¹¹, whereas the initial number/mL of bacteria in our culture is N0 = 5 × 10⁵. Then, given the above bacteria doubling time, it is straightforward finding that in natural growth conditions, with no nanoflakes, the bacteria population per mL would reach 2.2 × 10¹¹ in about 454 and 381 min for S. aureus and E. coli, respectively. We stress here that our model is just a first approximation of the real kinetic of bacteria culture growth in the presence of the MoS2 NSs that damage bacteria, since in our simplified model we decouple the bacteria population number from the number of available nanoflakes. This latter number is not constant, but rather decreases with time, since nanoflakes that interact with bacteria and damage them most likely will then stick on the damaged bacterium outer membrane, due to the attractive forces that led to that interaction. Thus, the nanoflakes that interacted with a bacterium basically do not have to be considered available anymore for further interactions and, because of that, the actual number of nanoflakes per unit volume diminishes with time. However, this decrease is much slower that the bacteria growth rate. In our simplified vision we do not take this interplay into account, but we can anyway provide a first interpretation of the observed kinetic effect in the MoS2 nanoflake antimicrobial action. Then, based on the above considerations, the interpretation of Figure 2 is clear: the maximum antimicrobial action is observed after 3 h of incubation for both S. aureus and E. coli, whereas just a little effect is seen after 6 h of incubation and nearly no inhibition is measured after 20 h. In fact, while after 3 h the number of NSs per unit volume is still pretty higher than the number of bacteria and this leads to a tangible bactericide action, around 6 h of incubation the number of bacteria per unit volume passed the value of 2.2 × 10¹¹, corresponding to the initial number of MoS2 nanoflakes, due to the faster bacterial growth in comparison with the decrease of the available MoS2 nanoflake population. Thus, bacteria are growing more and more with the increase of the incubation time, whereas available nanoflakes are only decreasing, leading to the observation at 20 h where no appreciable antimicrobial effect is detected.
In our case, surface interactions of ultrasonically exfoliated MoS2 NSs with both gram negative and Gram positive bacteria shows interesting results. The active sites of 2D MoS2 nanoflakes form a bridge between the surface S atoms and surface compounds on bacterial cell membrane. The presence of different functional groups on E. coli and S. aureus provides a strong interaction with the surface atoms for the first 3–4 h which resulted in bacterial cell death and disruption of its cell membrane (Zhang et al., 2016). Based on the DLVO theory (Thwala et al., 2013), we can estimate the interaction energy between bacteria and MoS2 nanoflakes, similarly to what recently done to describe the interaction between bacteria strains and gold nanoparticle (Pajerski et al., 2019). Thus, we here generalize the DLVO theory to 2D nano-objects, such as nanoflakes. Within the DLVO theory applied to interacting bacteria and nanoflakes, being suspended in aqueous solution, the total interaction energy, Vtot, can be written as (Israelachvili, 2011; Hwang et al., 2012; Ohshima, 2014; Pajerski et al., 2019):
being:
the electrostatic interaction energy of a bacterium having an effective radius a1 and ζ-potential ζ1 positioned at a distance d, into a solution having permittivity ε, from a nanoflake having an effective radius a2 and z-potential ζ1, and
the LW interaction energy between the two nano-objects. Please, notice that d refers to the separation distance between a bacterium and a nanoflake, namely it stands for the bacterium membrane-nanoflake distance, where the bacterium is an extended object having an average size itself, often of the order of magnitude of d. The k constant in equation (9) is the inverse Debye-Hückel length, λD, namely the average radius of the sphere in the solvent medium around a charged object beyond which there is no electrostatic interaction anymore because of the shielding effect of the surface charge by the ions present in the solution. It essentially depends on the solution pH, but also on the solvent medium permittivity and temperature as:
where z is the charge of the ion e = 1.6 × 10⁻¹⁹ C the elemental charge, n the ion density, εr the solvent medium relative permittivity (80 in our case for a water-based solution), ε0 = 8.854 × 10⁻¹² C2/J.m the vacuum permittivity, kB the Boltzmann constant and T di absolute temperature of the solution. In our case, for a slightly basic pH of 7.4, at 20°C we can estimate (Israelachvili, 2011) a Debye–Hückel length λD ≈ 2 μm.
The constant A in equation (10) is the so-called Hamaker constant, that takes into account the van der Waals body-body interaction coupling, and for two nanosized objects interacting into a dispersion can be defined as (Ohshima, 2014):
where A1, A2 refers to the only bacterium and the only MoS2 nanoflake, respectively, in a dry condition, i.e., when their bacterium-bacterium and nanoflake-nanoflake van der Waals interaction is not mediated by a solvent medium and Ad refers to the dispersion medium to account for its internal van der Waals interaction strength. Thus, in our case, for the interaction between bacteria and MoS2 nanoflake we can calculate A = 1.25 × 10⁻²⁰ J, where we used for A1 = 5.2 × 10⁻²⁰ J for both bacteria species (Farahat et al., 2009), A2 = 29.6 × 10⁻²⁰ J for MoS2 nanoflakes (Mohona et al., 2019) and Ad = 3.7 × 10⁻²⁰ J for water-based solvent (Israelachvili, 2011).
As for the geometrical parameters a1 and a2 we adapted the DLVO theory, ideally developed for spherical objects, to our nanosized interactors, bacteria and nanoflakes. The calculated effective radii, a1 and a2, were the radii of a sphere having the same volume of the real average volume of the considered partner. Hence, we obtain a1 = 360 nm and 630 nm, for S. aureus and E. coli, respectively, and a2 = 134 nm for MoS2 nanoflakes, where the S. aureus radius is directly obtained as the average size of the SEM bacterial images since this bacterium is spherical, but the effective radius of E. coli and MoS2 nanoflake are obtained as the radius of a sphere having the same volume of a cylinder with 2.1 μm height and 0.4 μm base radius, for E. coli and NSs having 100 nm average lateral size and 1 nm average thickness for MoS2 nanoflakes, as retrieved by our nanoflakes characterization reported in Figure 1, respectively.
Then, by using equation (10) and equation (12) for a separation distance of about d = 0.16 nm, which corresponds to the case when bacterium and nanoflake are in touch with a contact, short-range interaction, what is the case when damaging effect takes place (Bayoudh et al., 2009; Pajerski et al., 2019), we obtain for the Van der Waals term:
where the minus sign indicates that the interaction is attractive and the reference to the thermal energy is made for 20°C where kBT = 25meV.
As for the electrostatic interaction term in equation (9), given the short distance when nanoflake and bacterium are in touch, d = 0.1 nm, then kd ≈ 5 × 10⁻⁵ and we can safely assume exp(-kd) ≈ 1-kd and exp(-2kd) ≈ 1-2kd. We can assume from the literature ζ1 = −37.1 mV and −12.7 mV for S. aureus and E. coli, respectively (Oh et al., 2018). We do observe that, despite both negatively charged, the two bacteria species have pretty much different ζ- potentials, which lead to a different value and even sign of the electrostatic interaction when they are in touch with a nanoflake. This behavior can be ascribed to the different structure of the bacteria cell membrane, gram-positive for S. aureus and gram-negative for E. coli, resulting in a different nature and distribution of charged and polar groups on the bacterial membrane, The cell wall of S. aureus involves layers of peptidoglycans that are rich in teichoic acid groups (Lovering et al., 2012; Romaniuk and Cegelski, 2015; Oh et al., 2018). Then, the considerably high measured negative value of the ζ- potential for S. aureus is ascribed to the existence of anionic phosphate groups in the glycerol phosphate repeating units of teichoic acids (Brown et al., 2013). On the hand, the outer layer of E. coli contains mainly lipopolysaccharides (Maurer et al., 1999; Brown et al., 2015), which include phosphate groups in the inner core and polar hydroxyl groups in sugar repeating units of the O-antigen (Frirdich and Whitfield, 2005; Ho and Waldor, 2007). Phosphate and hydroxyl groups can account for negative ζ- potential of E. coli and also for its observed hydrophilicity. As a result, the electrostatic interaction of E. coli with negatively charged MoS2 nanoflakes, mediated by a slightly basic water-based environment can turn to attractive at short distances as d = 0.16 nm in our case. Therefore, based on the above considerations, by means of equation (6) we can calculate the electrostatic contribution to the interaction energy when nanoflakes and bacteria are in touch, namely the electrostatic contribution to the binding energy for a contact interaction to be:
We observe that the electrostatic contribution to the binding energy is smaller than the vdW, which is a surface energy term and, interestingly, it changes sign being positive for S. aureus and negative for E. coli. Finally, from equations (13) and (14) the overall interaction energy for a contact interaction between bacteria and MoS2 nanoflakes, namely an estimate for the binding energy, is found to be:
Thus, we estimate that in our conditions the binding energy between MoS2 nanoflakes and E. coli is about 40% larger than that for S. aureus, what might explain a somewhat higher inhibition effect for E. coli as compared to S. aureus. We also notice that for both bacteria strains negative values, i.e., energies due to an overall attractive net force of interaction, in the 50–70 kBT is in the same range as those found for the interactions of other bacteria strains, such as Bacillus subtilis and Staphylococcus carnosus, with gold nanoparticles, the adsorption of which requires between 120 and 170 kBT. Certainly, in our case it is important noting that we are neglecting any form factor for the interacting nano-objects and assuming they are spheres with an effective radius: while this assumption is surely verified for S. aureus, it is certainly not as valid for E. coli, which is shaped as a rod, and for MoS2 NSs, which are 2D NSs.
As for the behavior of the bacteria inhibition with the concentration of MoS2 NSs, it appears substantially linear, as seen in Figures 2A,B for both S. aureus and E. coli., especially after 3 h incubation, when the inhibition effect of the nanoflakes is evident. However, we notice that while for E. coli a consistent effect is present already for a concentration of 3.13 μg/mL, in the range of ≈ 30% inhibition, for this concentration in S. aureus the measured inhibition is only ≈ 10%, which is in practice in the background of the signal (see the positive control bar of the histogram in Figure 2A, refereed to 3 h incubation, that reaches ≈ 90% with an error bar of ≈ 10%). It seems that for S. aureus there is concentration threshold-like effect: below the 3.13 μg/mL we see nearly no inhibition. In E. coli, instead, such a threshold is absent, falling perhaps at concentration values lower than the minimum in our measurement, 0.39 μg/mL. This effect may be due to a different critical volume around the bacterial cell, where the attraction forces dominate. This critical volume, that can be different for S. aureus and E. coli, is defined by a critical radius, rcrit (Pajerski et al., 2019) and may results in the difference in the inhibition at the intermediate concentrations between the two bacterial strains, giving this threshold-like behavior for S. aureus. In fact, a too small critical volume around S. aureus might lead to no availability of nanoflakes in that volume with a consequent drop in the inhibition effect. This mechanism can, of course, only represent qualitative explanation of the threshold-like behavior for S. aureus, for two reasons: (i) the available number of NSs per critical volume is dynamical since bacteria population is growing while the number of available NSs is decreasing with time as they are kept by the interaction with some damaged bacterium and (ii) NSs and bacteria move with time in space with respect to each other while they are in suspension, under the effect of diffusion and the relative interaction forces. This latter effect determines the critical volume to move as well in time through the suspension. However, certainly a consistent difference in the critical volume, with a value much smaller for S. aureus than for E. coli, would be an argument in favor of the observed behavior.
Then, we remind that rcrit is defined as (Pajerski et al., 2019):
where dmax indicates the location of energy maxima in DLVO profile for each bacterial species of radius a1 (see Figure 3), i.e., the value of the separation, d, between bacteria surface and NSs for which the potential energy barrier is encountered. The value of dmax is easily found from equation (8) by imposing and solving for d the subsequent equation:
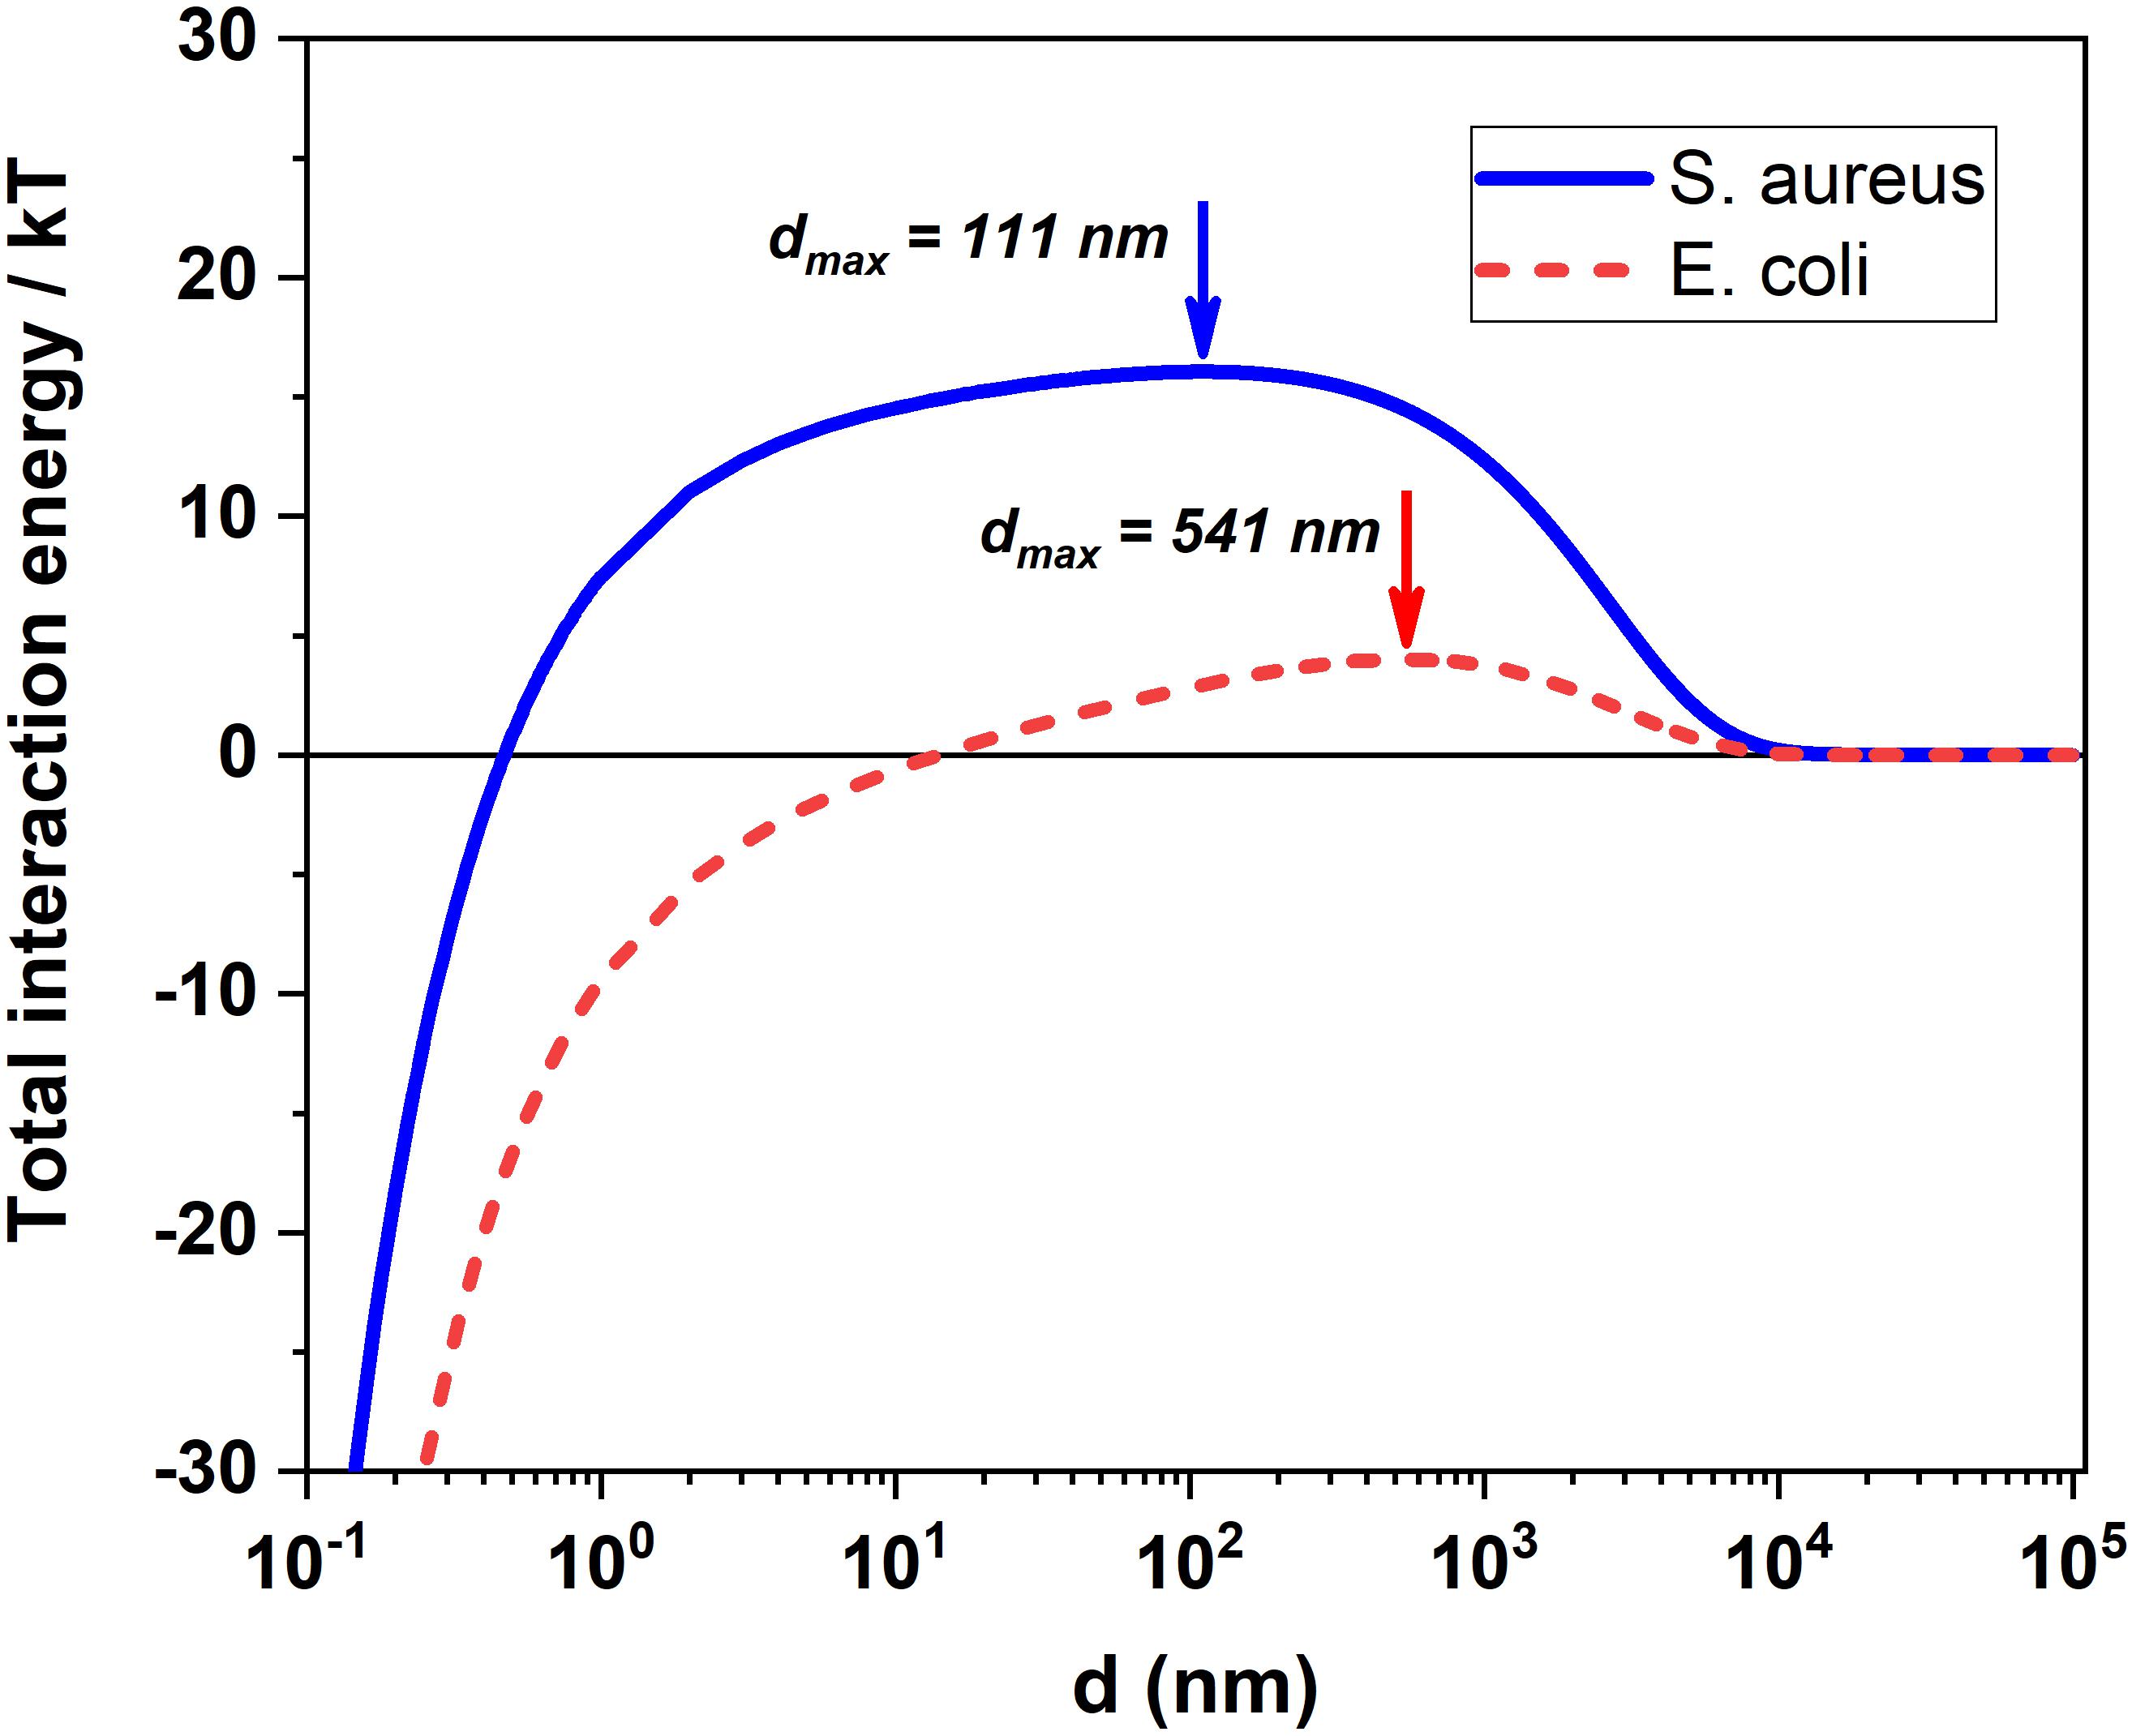
Figure 3. DLVO prediction for the total interaction energy between MoS2 NSs and S. aureus/E. coli in our experimental condition. Total interaction energy between the bacteria and MoS2 NSs and d (nm) indicates the location of energy maxima for both E. coli and S. aureus at 541 nm and 111 nm.
which is a transcendental equation. However, by neglecting in equation (17) the LW force term A/d2 which is very small in the d-range where the potential energy barrier falls (see Figure DLVO), we can work out a simple and nice analytical approximated formula for dmax:
The values of dmax numerically calculated by finding the precise position of the potential energy barrier (see Figure 3) are dmax = 111 nm and 541 nm for S. aureus and E. coli, respectively, in excellent agreement with those calculated by our analytical formula given in equation (18), that read 102 nm and 536 nm, respectively. This means that what may well explain the observed presence of a concentration threshold in S. aureus, threshold which is absent in E. coli.
A number of considerations still are interesting and useful for longer term bacteria-MoS2 nanoflakes interactions. The solubility of water exfoliated MoS2 NSs in pH = 7.4 also gives an additional stability to the dispersed 2D nanoflakes which enhances their interaction with the pathogen. Generally, the presence of salts in a given solvent reduces the stability of exfoliated 2D NSs because of the charge screening effect. This directly affects the electrophoretic mobility of the given ions in the medium. The absolute values of μ decrease more with the increase in divalent ion concentration than with increase in monovalent ion (i.e., Na+) concentration as the latter (i.e., Ca2+) screen the electric double layer and induce a smaller λD than the former. Also, specific adsorption of divalent cations along with the implication of short ranged attractive non-DLVO forces have also been considered as one of the reasons for the reduction of diffuse layer potential (Wu et al., 2018). At a specific critical concentration of given salts, avoids the nanoflakes to aggregate. Addition of salt with concentrations greater than the critical coagulation concentration leads to sharp increase in aggregation over time. With the increasing mono- and divalent (NaCl and CaCl2) salt concentrations, the surface charge on the 2DMs gets screened thereby accelerating aggregation. After 20 h of incubation, the excessive multiplication of bacteria over the time screens MoS2 nanoflakes and reduces its ability to affect its cell membrane. This in turn could be related to decreasing stability in the given culture medium, rich of nutrients and suitable for bacterial growth. With time, MoS2 NSs get stacked to each other forming a multi-layered structure which results in fewer active sites available for a strong interaction with bacterial membrane.
As for the interaction of GO NSs with the two bacterial strains, we should notice, first, that we could access in this case higher GO NSs concentrations than for MoS2, given the good hydrophilicity of 2D GO (Zeng et al., 2019).
As a general feature our results in this case show a much lower inhibition as compared to MoS2, even at the very high concentration of 100 μg/mL. This is true mostly for shorter incubation times, namely 3 and 6 h. Some more antimicrobial effect is present in E. coli at 20 h. Another general feature is the linear increase of the antimicrobial action with the GO NSs concentration. However, the inhibition never exceeds ≈ 20% in E. coli after 20 h incubation at 100 μg/mL GO NSs concentration for both the initial concentrations of the nanoflakes preparation of 1400 [GO(1)] and 600 μg/mL [GO(2)] and never exceeds ≈ 30% in S. aureus after 6 and 20 h incubation at 100 μg/mL GO NSs concentration for GO(2) as shown in Figures 4A–D. In this case, by exfoliating two initial preparations of NSs having different concentration, GO(1) and GO(2), we could study the interaction of bacteria with GO NSs having different average sizes. In fact, for GO(2) the average lateral size and thickness of the GO NSs are ≈ 400 nm and ≈ 1.5 nm, respectively, whereas for GO(1) average lateral size and thickness result ≈ 200 nm and ≈ 1 nm, respectively. Then the effective radius, a2, of the GO NSs results ≈ 21.1 nm and 38.6 nm for GO(1) and GO(2), respectively.
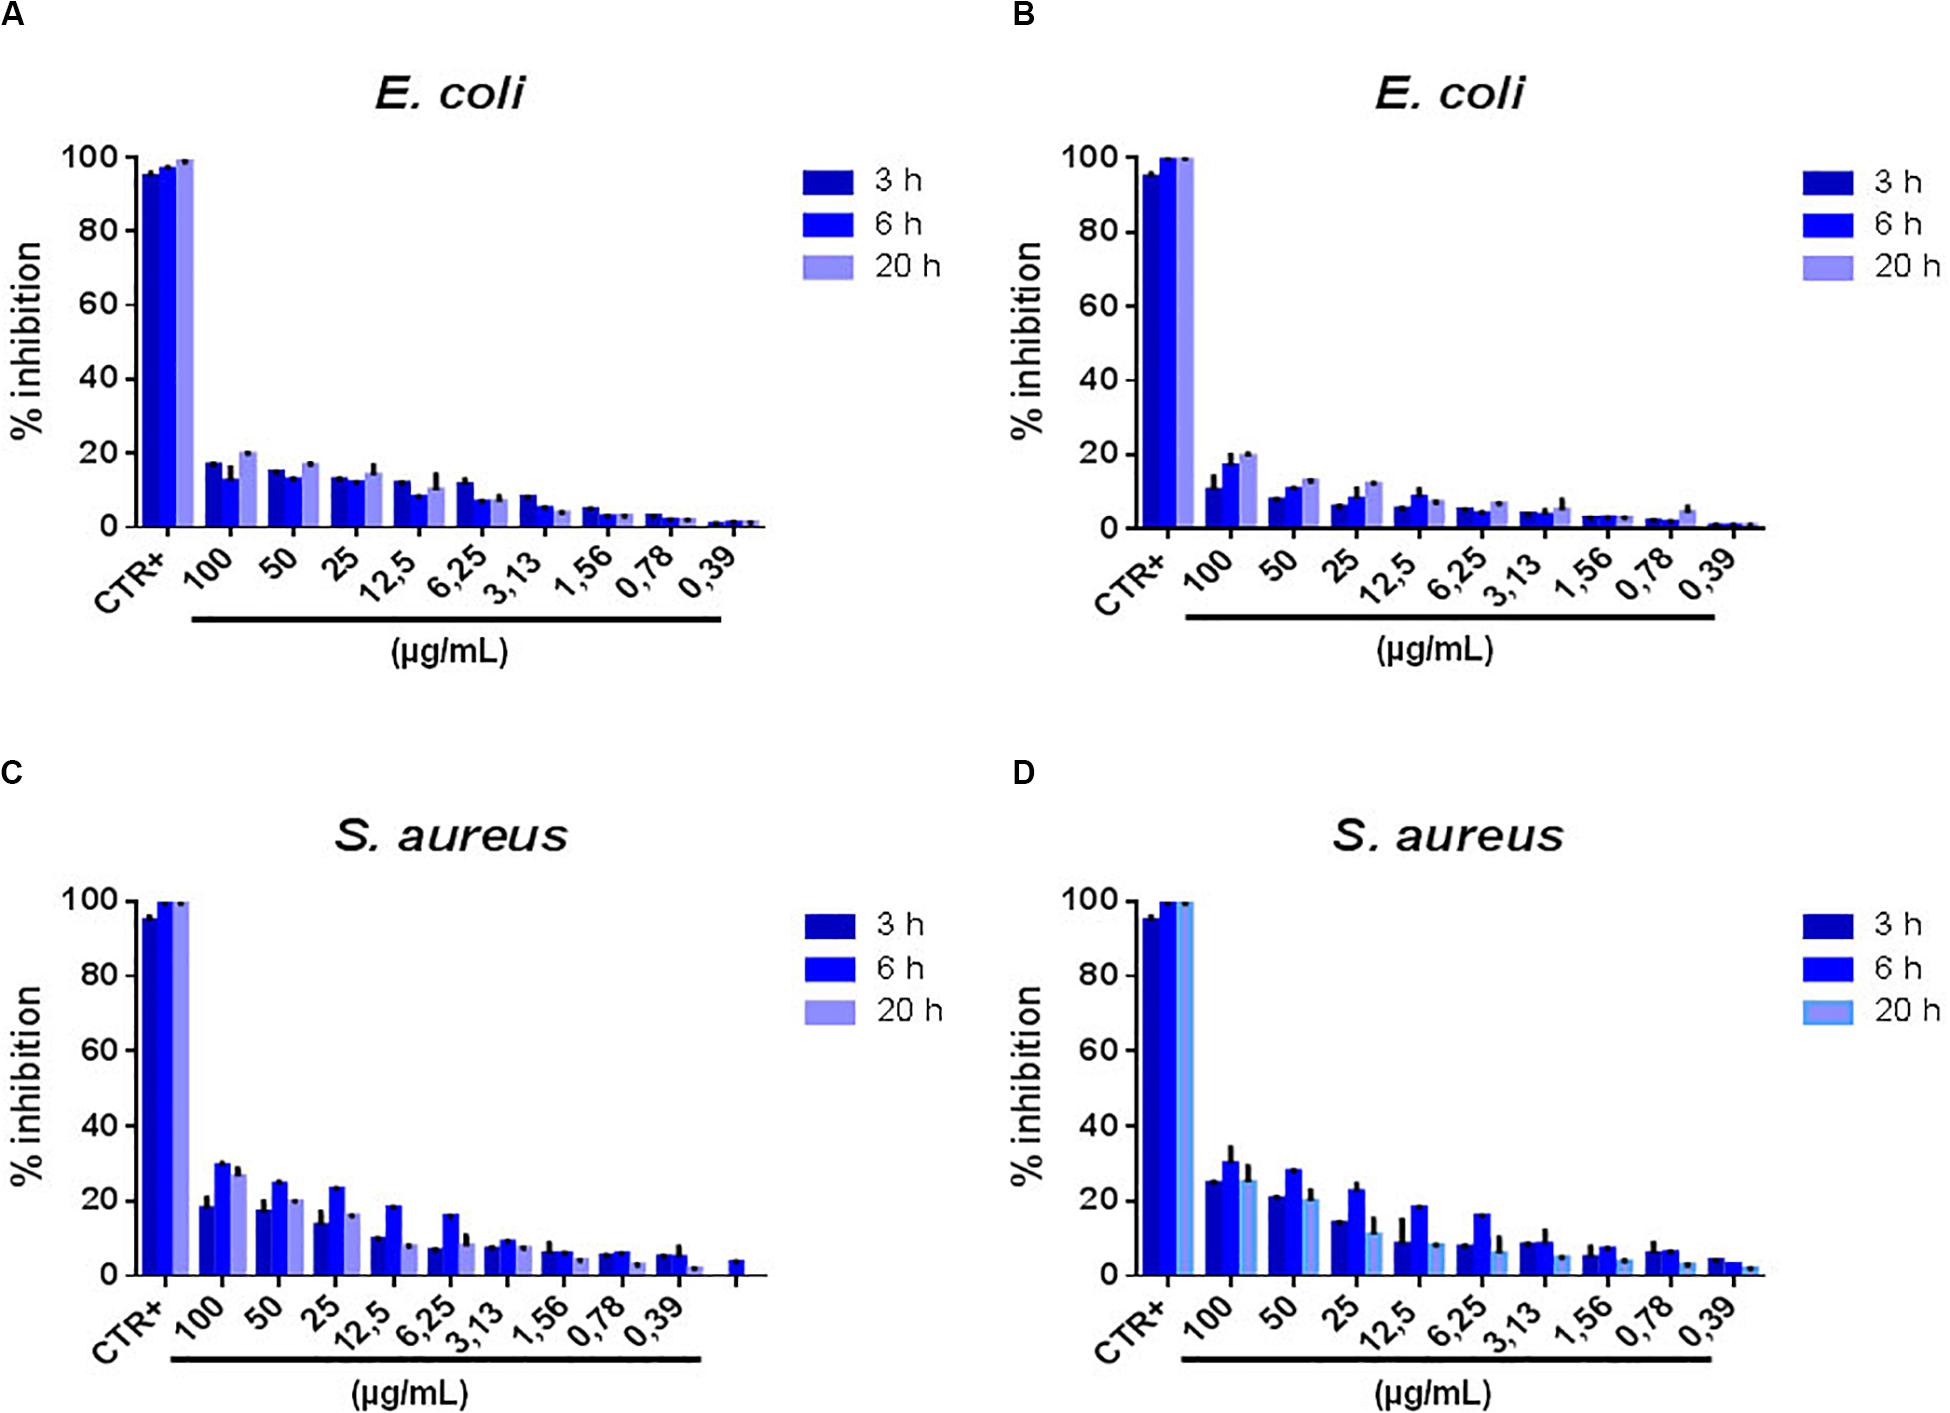
Figure 4. Percentage of bacterial growth inhibition after treatment with GO NSs. Panel (A,B) Percentage inhibition E. coli at 3-6-20 h of incubation with GO NSs (600 μg/mL & 1400 μg/mL). Panel (C,D) Percentage inhibition S. aureus at 3-6-20 h of incubation with GO NSs at same concentration. Ampicillin and vancomycin represented the positive controls for E. coli and S. aureus, respectively. The negative controls were consisted of deionized water. The data statistical error is standard deviation of three independent experiments. P-value is less than 0.05.
By following the approach developed in the previous section in equations (8)–(12), we calculated the interaction energy for bacteria-GO NSs when they are in touch, separated by a distance d = 0.1 nm. We can look at this energy as the interaction binding energy of a single GO nanoflake interacting with a bacterium. We find that these energies, calculated by the DLVO theory and reported in Table 3, are positive for S. aureus, indicating an overall repulsion at short distances with GO NSs, while they are negative for E. coli, indicating instead an attraction. We also find that these contact interaction energies, regardless the sign, are smaller for smaller nanoflakes, as it makes sense. Thus, the result for S. aureus indicates that other mechanisms of action are at fundament of the observed modest antimicrobial effect, differently from what observed for MoS2 NSs.
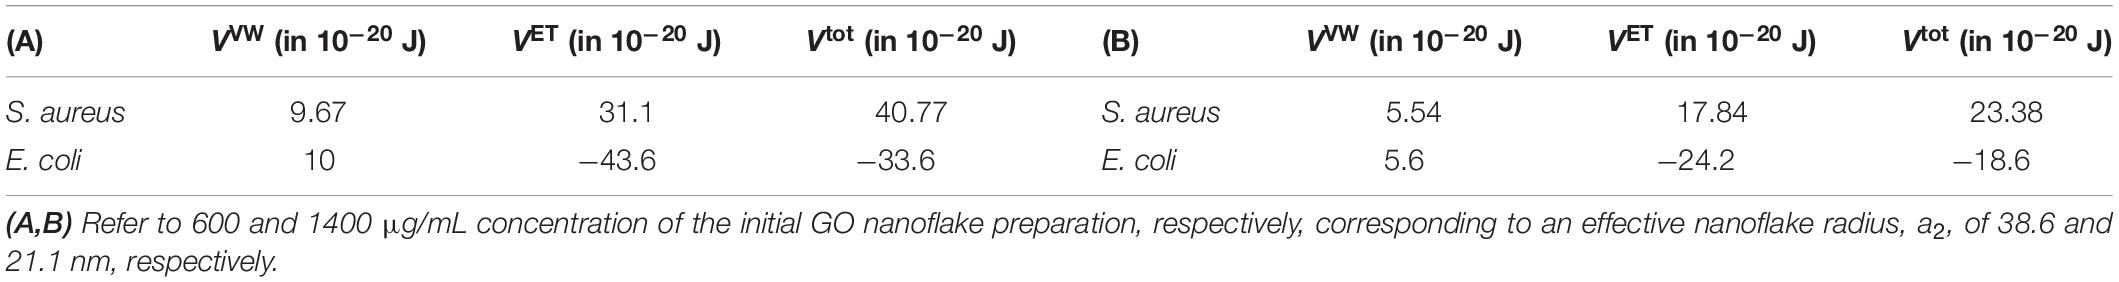
Table 3. Interaction energies for a separation distance d = 0.1 nm between GO 2D NSs and S. aureus and E. coli bacteria, calculated by the DLVO theory.
For E. coli we found negative contact energies that implies attractive forces, though it is reported that for the specific interaction of GO 2D nanoflakes with the E. coli membrane are predominantly repulsive and that this repulsion occurs between deprotonated carboxylic acid groups in GO and negative cell membrane of bacteria (Palmieri et al., 2017). However, an attraction between the two interactors is due to the presence of divalent cations in the medium and the functional groups on the surface of GO. This reduces the repulsion and favors collisions between GO NSs and bacteria (Palmieri et al., 2017). As a result, of these observations, we have to hypothesize that also for E. coli the mechanism of the modest measured antimicrobial effect of GO nanoflakes is to ascribe to actions other than damaging contact interaction between a single nanoflake and a bacterium.
Certainly, two important factors such as the nature of the bacteria strain, whether gram positive or gram negative, and the specific bacterial membrane can play a role in the observed antimicrobial action. Polymer peptidoglycan, a major component of the bacterial cell walls, in both gram positive and gram negative bacteria, has a different polymeric layer structure in either species. The large multilayer region of peptidoglycan with a wall teichoic acid (WTA) and lipoteichoic acid (LTA) in gram positive bacteria with thick cell walls are attached to the peptidoglycan layer and to the cell membrane, respectively. Whereas, the gram negative bacteria have a thin layer of the peptidoglycan, in the region called periplasmic space, situated between the cell and outer membranes. Instead of teichoic acids, the gram negative bacteria synthesize lipopolysaccharides (LPS), which form distinct areas within the outer phospholipids bilayer (Malanovic and Lohner, 2016; Pajerski et al., 2019).
Collisions between nanoflakes and bacteria, driven by attractive forces, are largely dependent on the stability of GO in broth. Generally, due to charge screening effect, a reduced antibacterial efficacy is observed, especially for the first 3–6 h incubation, before GO aggregates formation will take place (Romero-Vargas Castrillón et al., 2015). In fact, though GO is highly dispersible in pure water, the presence of different salts and nutrients as in broth reduces its stability and leads to fast aggregation of the exfoliated nano flakes (Akhavan et al., 2011), what occurs in 12–24 h incubation, by reaching aggregates having a typical linear size in the 1.5–3 μm (Palmieri et al., 2017). Once formed GO aggregates interact with both bacterial strains, with stronger affinity with gram positive than with gram negative bacteria, due to the presence of functional groups on the former type bridging with different functional groups on GO.
Moreover, over longer incubation time, with the formation of large GO aggregates a second mechanism of action of GO, the so-called wrapping (Liu S. et al., 2012), can bind bacteria and inhibit their growth. Particularly, in this wrapping effect, bacteria are insulated from the external environment with a reduction in movement and proliferation (Geesey et al., 2000). The wrapping is most efficient for Gram positive S. aureus may be due to specific cell wall architecture (Akhavan et al., 2011). In a given broth, divalent cations tend to wrap bacteria more than monovalent.
Due to the size and shape the wrapping mechanism by GO 2D nanoflakes aggregates of E. coli takes longer than for S. aureus and is less effective. In fact, the longer size of E. coli, namely the height of the rod, is ≈ 2–3 μm, whereas the S. aureus sphere radius is ≈ 0.4–0.5 μm. That means that the spatial hindrance of E. coli is much bigger than that of S. aureus, resulting also in a much larger surface: about 6.5 versus 1.5–1.6 μm2. As a result, we can expect the wrapping mechanism for inhibition to be a bit more effective in E. coli than in S. aureus. In fact, for instance, at a concentration of 100 μg/mL we see in Figures 4A–D after 20 h incubation an inhibition of ≈ 20% for E. coli against ≈ 30% for S. aureus.
In order to monitor the antimicrobial action, we characterized by SEM analysis the interaction of MoS2 nanoflakes with both S. aureus and E. coli bacteria as shown in Figures 5A–H. Images reported in Figures 5A–D shows 3 h incubation of MoS2 NSs with both bacteria. In the Figure 5A,B panels we show typical images of S. aureus that interacted with MoS2 NSs: in Figure 5A we see a single damaged S. aureus bacterium, whereas in Figure 5B, we show the damage caused to S. aureus with the leakage of its cellular components. The presence of some sharp-edged flakes nearby resulted in the fragmentation of the bacterium and the subsequent bacterial death.
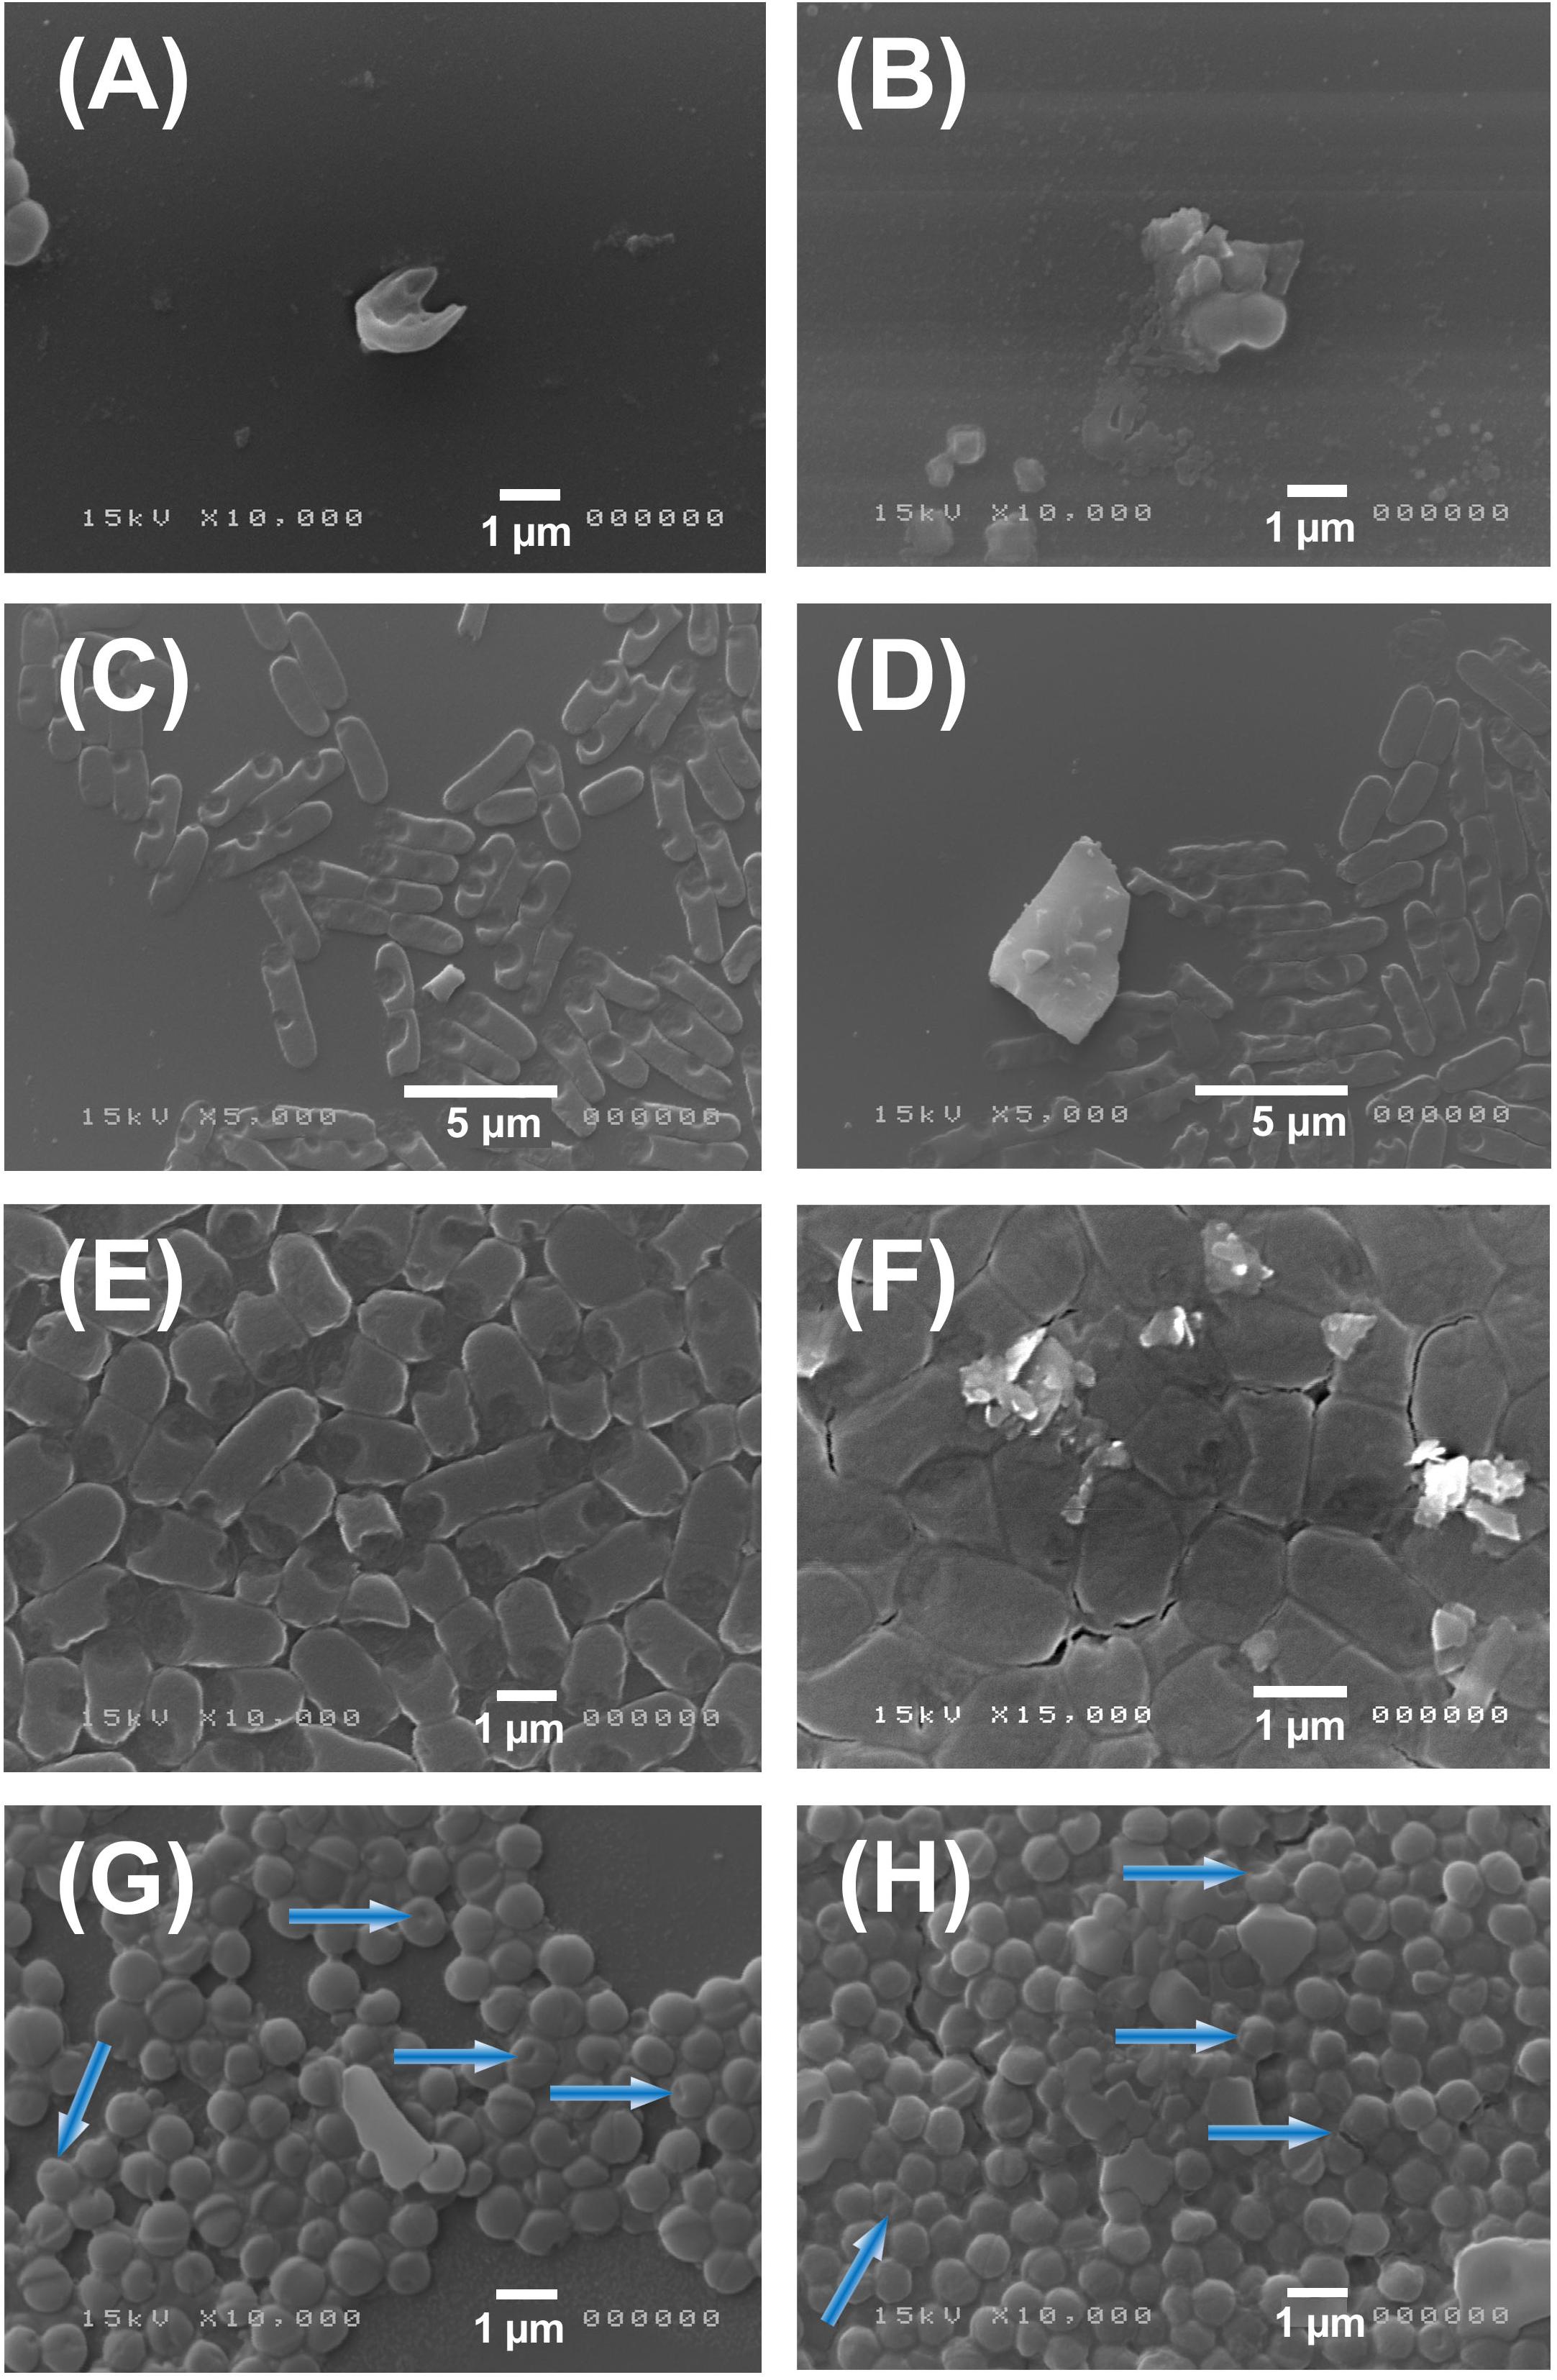
Figure 5. SEM images of S. aureus and E. coli after treatment with MoS2 NSs. Panel (A–D): SEM images of S. aureus (A,B) and E. coli (C,D) illustrate the antibacterial effect of MoS2NSs after interaction for 3 h. Panel (E–H): SEM images of E. coli (E,F) and S. aureus (G,H) illustrate the antibacterial effect of MoS2NSs after interaction for 6 h and the subsequent damage shown in blue arrows.
In the Figures 5C,D panels we show images of E. coli. We first notice the typical rod-like shape having a height of ≈ 2 μm and a base of ≈ 1 μm diameter along with the affected ones. E. coli rods are often damaged, as observed in the bacteria where a piece is missing in the rod, like a bite, or in some other cases they are more severely damaged being fragmented as shown in Figure 5C. Whereas, in Figure 5D a big flake is evident with many other smaller flakes on the top. We notice the typical lateral size of MoS2 NSs to be much smaller than ≈ 0.5 μm, as seen in Figure 5C, whereas in Figure 5D, we notice the damages induced by the big flake having a lateral sizes between 2 and ≈ 4–5 μm to be particularly strong, with bacterial fragments all around, likely due to the sharp-edges of this big flake.
The Figures 5E,F panels refer to E. coli, whereas Figures 5G,H report S. aureus images incubated for 6 h. Firstly, we can notice by eye the damage is less evident and less frequent, in agreement with the inhibition measurement shown in Figures 2A,B and the consequent analysis as shown in blue arrows. The bacterial density is also much increased as compared to the (A–D) panels, since bacteria had longer time to multiply. The presence of flakes and their aggregation degree is also reduced as compared to 3 h incubation time. We also notice that the amount of heavily damaged bacteria, nearly destroyed or fragmented as seen in (A–D), is less.
It is possible to quantify the interaction of nanomaterial with E. coli and S. aureus counting the bacteria damaged and not damaged (Table 4). Table 4 shows the number of bacteria damaged and not damaged presents in two or three images representative of samples and their respective percentage.
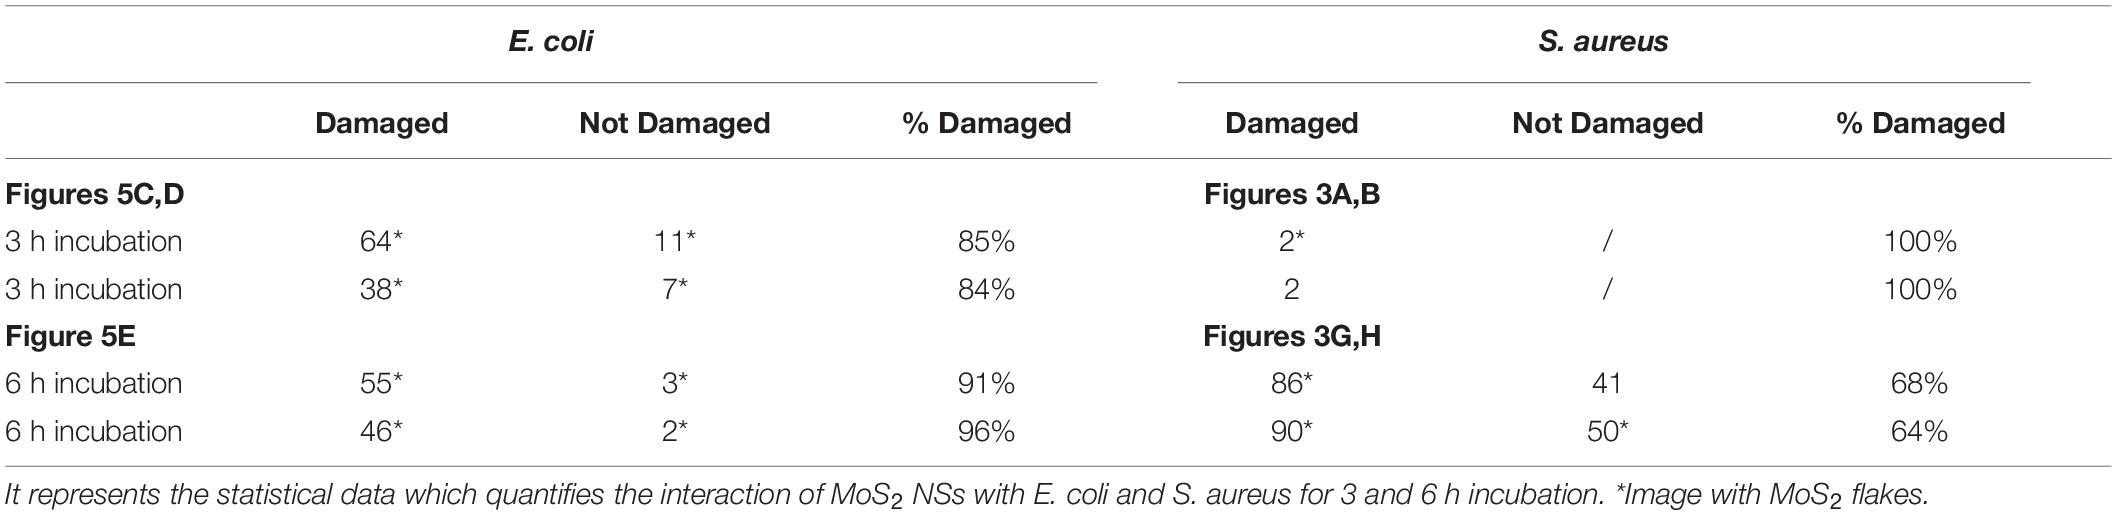
Table 4. Shows percentage of damaged and not damaged bacteria when incubated with MoS2 NSs.
It is evident that in E. coli sample the interaction with MoS2 is greater than in S. aureus, with a damage percentage value between 83 and 99%, while in S. aureus this value is between 57 and 79%. The difference in the damage percentage between NSs and E. coli and S. aureus is on the average 25%, what can be ascribed to a different morphology of these bacteria. The damaging action on the spherical morphology of S. aureus is more difficult than on the rod-like shape of E. coli. This is also enlightened in our model where we calculate a lower total interaction energy for S. aureus than for E. coli (see Equation 15) by about 28%, which is in very good agreement with the statistical observation based on SEM images. This is a consequence of the smaller effective radius of the former bacterium as compared the latter. Generally, in the images in which MoS2 flakes appear the percentage of damaged bacteria is higher.
To measure an antiviral effect by MoS2 and GO 2D NSs on HSV-1, we measured the infectivity inhibition induced in a Vero cells model by four different experimental schemes: virus pre-treatment, co-treatment, cell pre-treatment and post-treatment as shown in Figure 6. Pre-treatment assay was performed through two different approaches, that for readiness we call virus pre-treatment and cell pre-treatment in the manuscript. In the former, the virus was first incubated with nanoflakes by 1 h and then added to Vero cells, a renal epithelial cell line from Cercopithecus aethiops, for another 1 h incubation. In cell pre-treatment, cells were first treated with nanoflakes by 1 h and then infected with HSV-1. In the co-treatment, viruses and nanoflakes were delivered together to the cells and incubated for 1 h, whereas in the post-treatment Vero cells, incubated with HSV-1 for 1 h, were later added with nanoflakes for another 1 h incubation. After inactivation of non-penetrated viruses by citrate buffer (pH 3.0), cell monolayers were incubated at 37°C in Minimum Essential Medium (MEM) supplemented with 5% carboxymethylcellulose. After 2 days, the cells were fixed with 4% formaldehyde and stained with 0.5% crystal-violet, and the plaques were counted. The experiments were performed in triplicate and the percentage of viral inhibition was calculated compared to the untreated HSV-1 control (CTR-). In all the four schemes we tried different concentrations of the NSs, for GO material we tried also the effect of a different NSs lateral size coming from two initial different preparations.
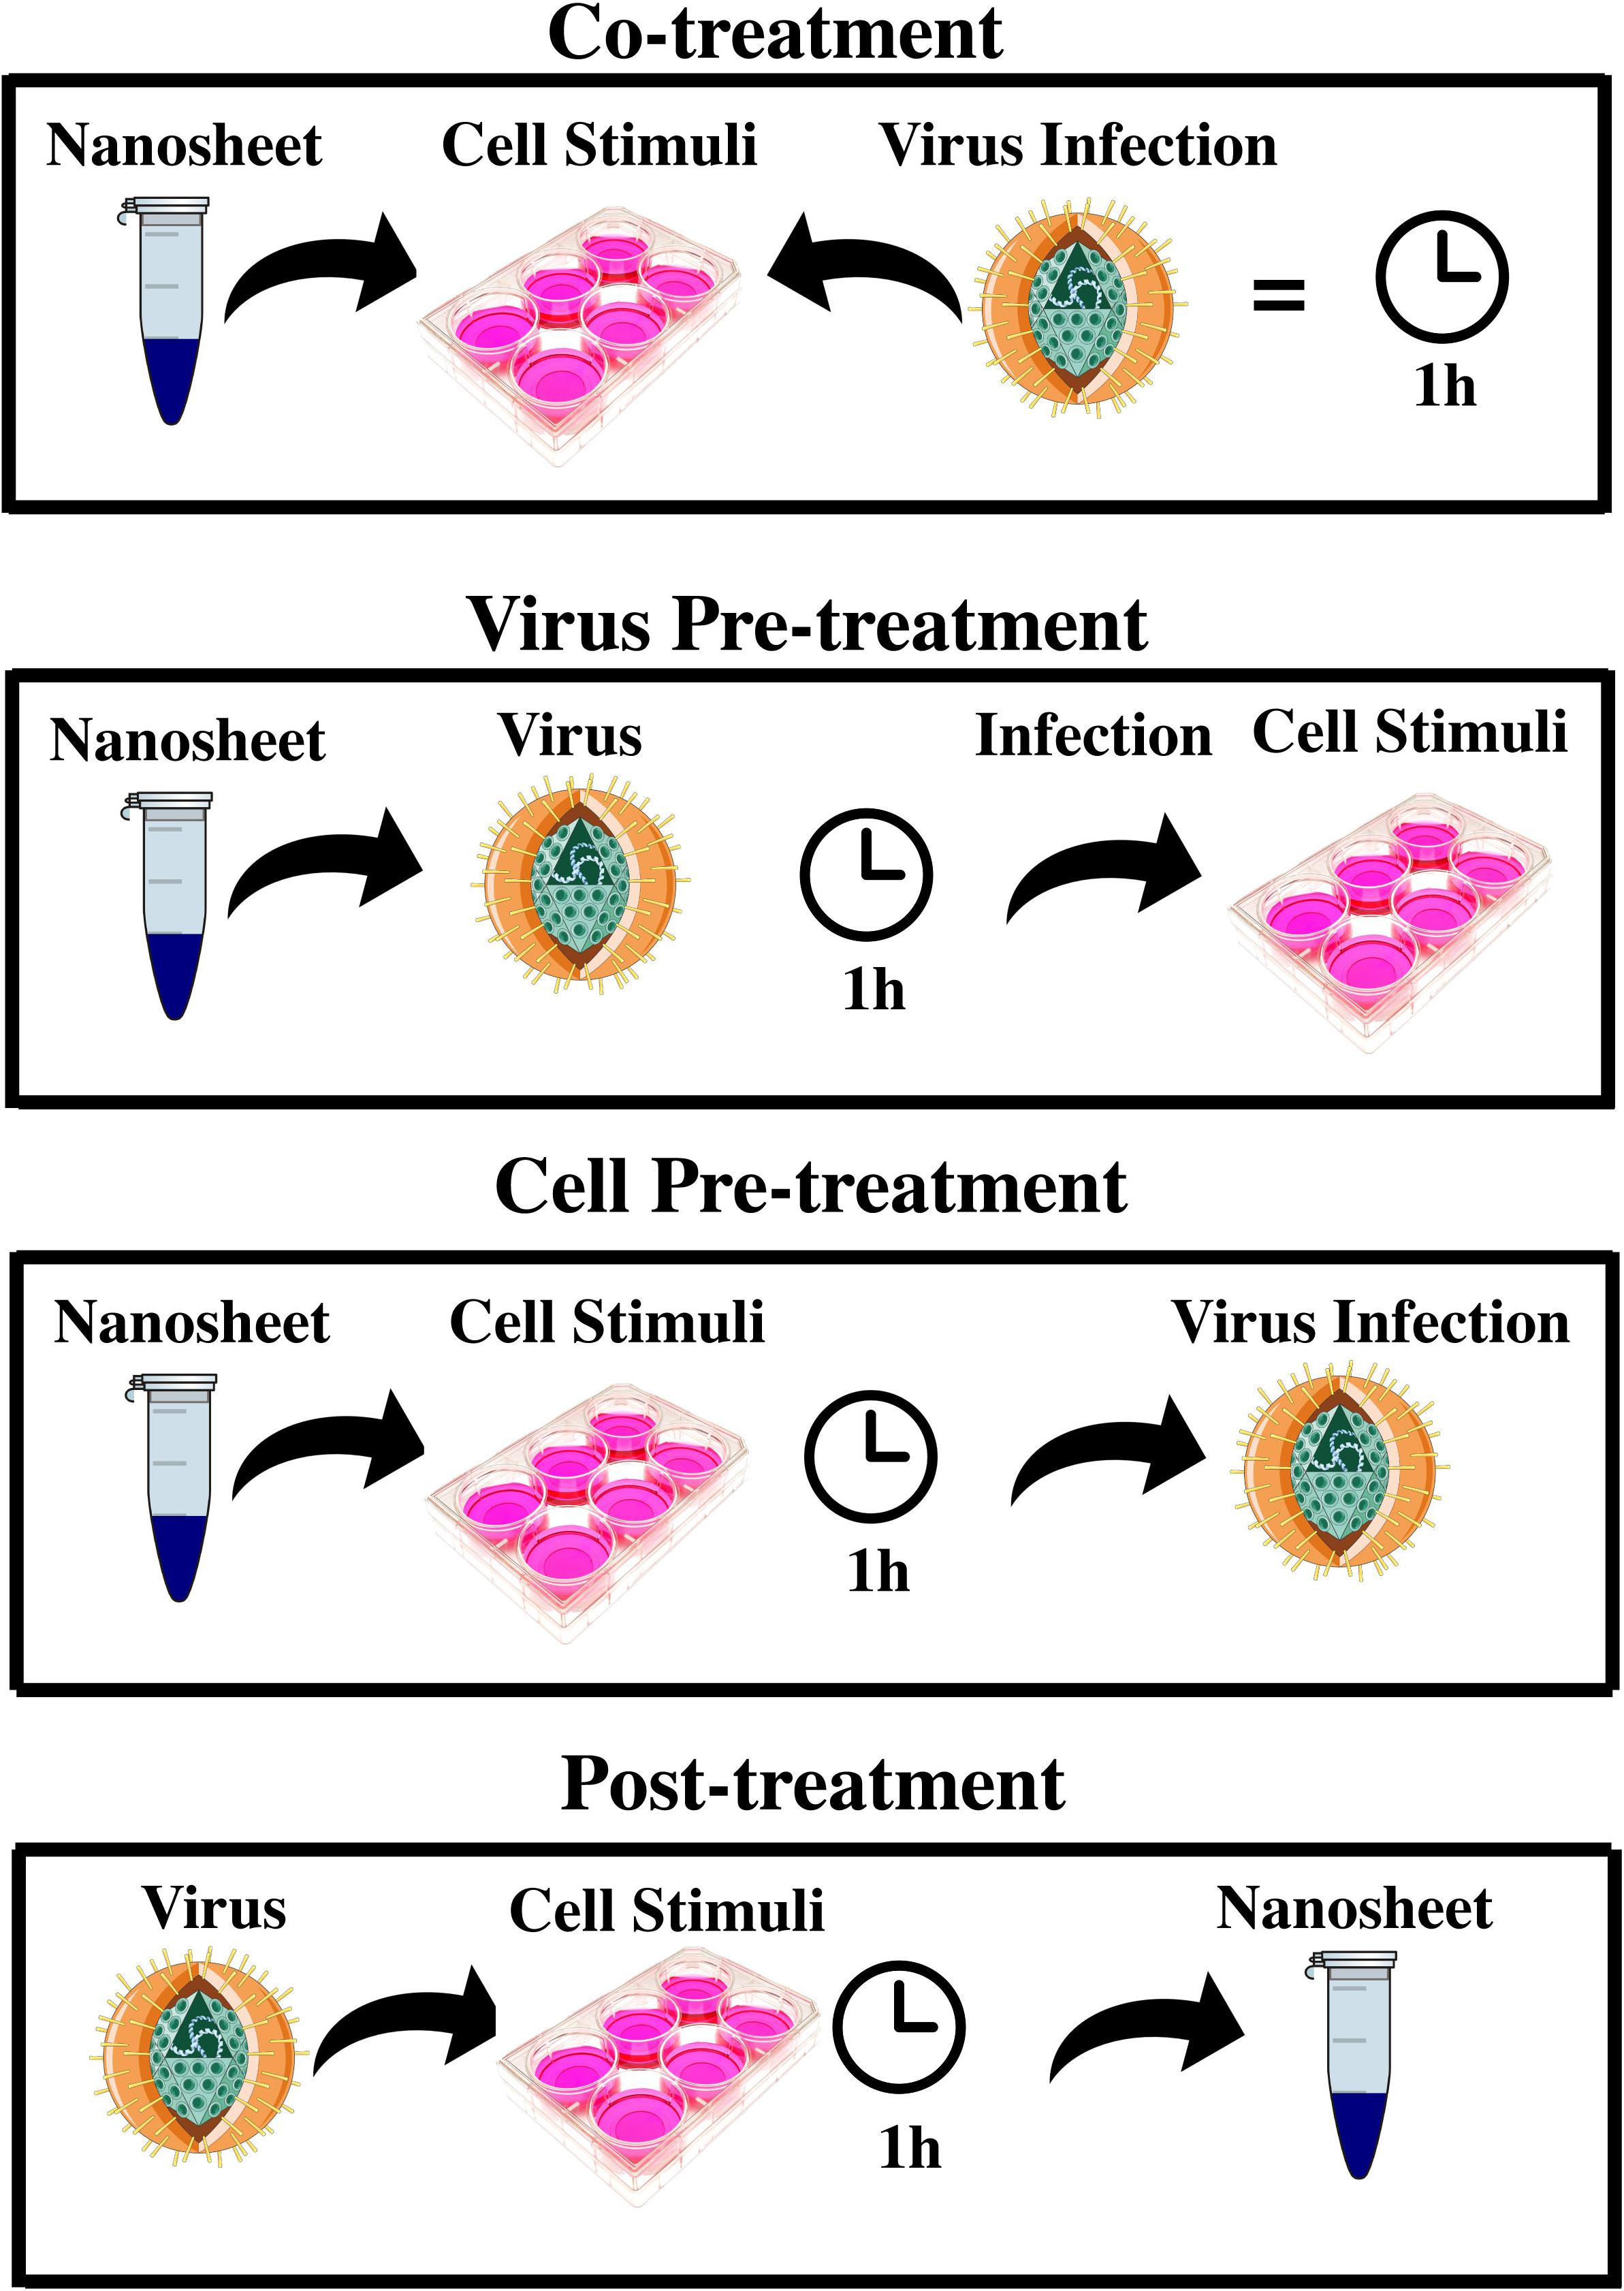
Figure 6. Different schemes of experimental antiviral assay. It shows the different interaction schemes of 2D MoS2 and GO with HSV-1 and Vero cells exhibiting very intriguing results in either cases (2D MoS2 and GO NSs).
The general scenario of the obtained results is very interesting and somewhat surprising. As a general feature we found that in our experiments GOs were more potent antiviral agents than MoS2 NSs contrary wise than for the bactericide action. Essentially, we summarize our results in this way: (i) in the virus pre-treatment case we observed a moderate antiviral action by MoS2 nanoflakes in comparison with a more robust effect by GO NSs; (ii) in the co-treatment case, the most surprising and intriguing finding in our investigation about antiviral actions, no effect was observed by MoS2 nanoflakes in comparison with a strikingly strong effect by GO NSs, an antiviral action even stronger than for the virus pre-treatment case; (iii) no antiviral action was observed at for both MoS2 and GO nanomaterials in the cell pre-treatment; and (iv) post-treatment cases.
We verified that none of the two nanomaterials has a cytotoxic action itself on the Vero cells, what is shown in Supplementary Figure S5. Their 50% cytotoxic concentration (CC50) is higher than 100 μM. Cytotoxicity was evaluated through MTT [3-(4,5-dimethylthiazol-2-yl)-2,5-diphenyltetrazolium bromide] assay performed on Vero cells that interacted with MoS2 (A) and GO (B) showing no change in the cell viability for all the tested concentrations.
We interpret our results in viruses on the base of qualitative arguments, differently from the case of bacteria, since experiments in viruses end up with a sample much more complicated to deal with, due to the interaction with a cell model to account for, together with the direct interaction between NSs and viruses. Thus, quantitative or semi quantitative models, finding a solid context within a well assessed physico-chemical theory such as DLVO as for bacteria-nanoflake interactions, do not exist to the best of our knowledge. In addition, the surface interaction of MoS2 NSs with viruses and the related cell model such as Vero cells has never been investigated so far to the best of our knowledge, as well as the antiviral activity of bare MoS2 NSs in water-based systems.
In the virus pre-treatment experiment we did observe an antiviral effect by both nanomaterial, though more evident for GO, as reported in Figure 7. For MoS2 NSs, that have an average later size of ≈ 150 nm with an average thickness of ≈ 1.2 nm, we reached a maximum inhibition of about 40% for the highest NSs concentration of 100 μg/mL, whereas the antiviral action reaches its maximum at about 75 and 65% inhibition for 100 μg/mL concentration for the two different types of GO NSs, GO(1) GO(2), respectively. The 50% effective concentration (EC50), that refers to the concentration at which there is 50% viral infection inhibition, was 40.57 μM for GO(1) and 68.32 μM for GO(2). We notice that the two different initial concentrations correspond to different average lateral size and thickness of the GO nanoflakes, being the average lateral size ≈ 175 nm and ≈ 500 nm, and the average thickness ≈ 1.2 nm, ≈ 2.5 nm, for GO(1) and GO(2), respectively.
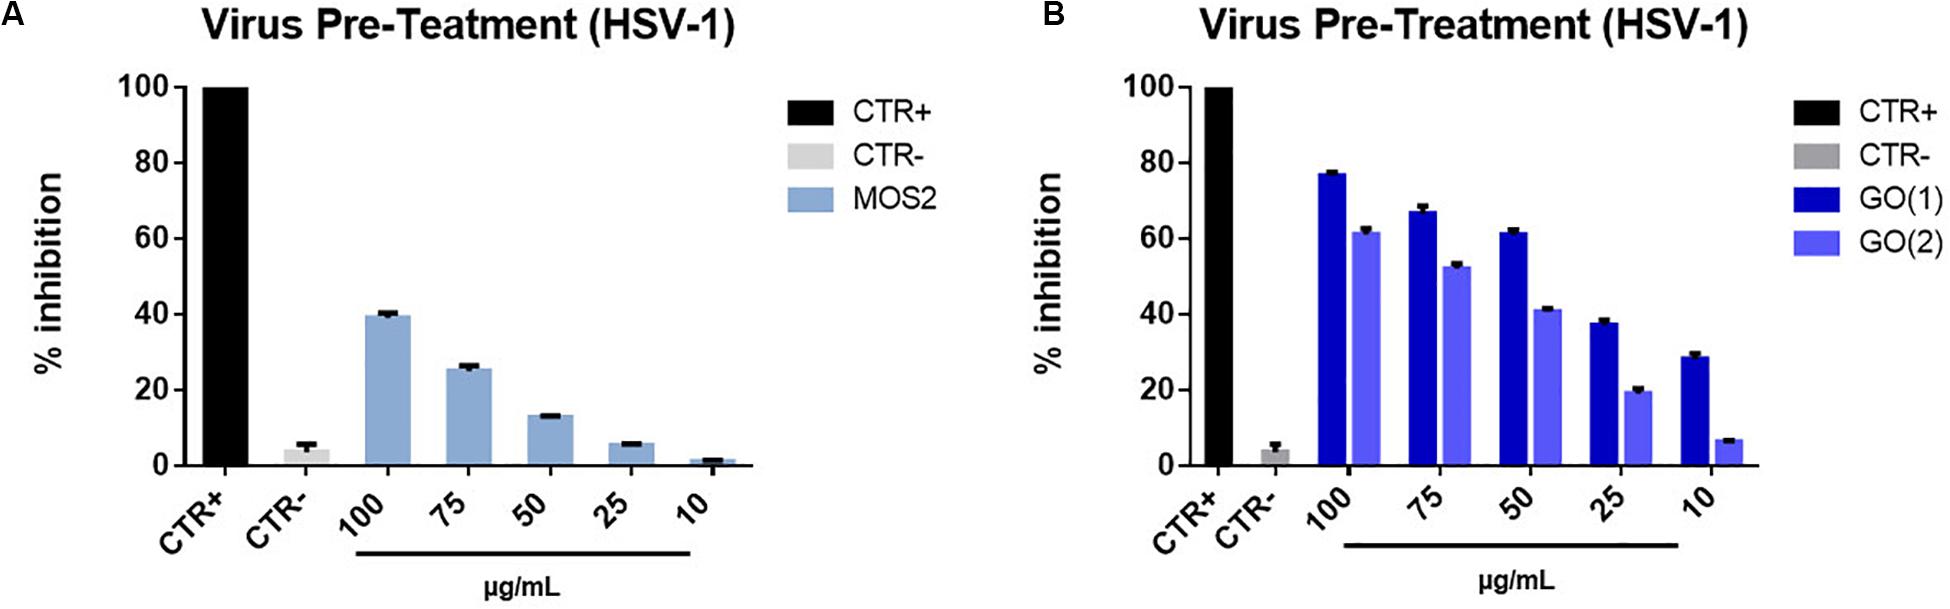
Figure 7. Virus pre- treatment with MoS2 and GO NSs. HSV-1 infectivity inhibition with MoS2 (A) and GO NSs (B), of two different types GO(1) and GO(2), having different lateral size and thickness. Not infected and not treated cells represented the positive control (CTR+), meanwhile infected cells were the negative control (CTR–). The data statistical error is the standard deviation of three independent experiments. P-value is less than 0.05.
We ascribe the less effective antiviral action of MoS2 as compared to that of GO to the formation of −SH groups on the MoS2 flake surface, mostly in correspondence of the edge of the flakes due to the exfoliation procedure for fabrication. It is known, in fact, that in LPE fabrication sulfur atoms concentrate mainly on the edge of the flake and they are subsequently functionalized during H2O cleavage process occurring in the fabrication method, with the consequent formation of −SH groups (Rodriguez et al., 2020). On the other hand, it is also well known that thiol groups are present in the cysteine amino acid, abundant in many spike glycoproteins of viruses. For example, in the case of HSV-1 the B Glycoprotein, essential for the attachment and fusion to the host cell (Cooper and Heldwein, 2015; Franci et al., 2017; Stelitano et al., 2019) has a cysteine residue (Laquerre et al., 1998) that can certainly repel with thiols, which can be formed on the MoS2 flake edge, where the abundant presence of sulfur atoms in solution can lead to the formation of −SH groups with the capture of an H+ ion.
Furthermore, we notice that (i) for both MoS2 and GO NSs the lower the concentration the higher the inhibition with a linear increase and (ii) that, in case of GO, the smaller nanoflake, GO(1), is more effective that the bigger flake, GO(2), likely due to the presence on its surface of sharper edges (Hu et al., 2013; Szabo et al., 2020).
Additionally, we notice that the stability of GO nanoflakes in water-based dispersion is higher than that of MoS2 NSs to corroborate a higher antiviral impact of the former compared to the latter.
In the co-treatment experiment we obtained pretty intriguing and somewhat unexpected results. In the case of MoS2 NSs we did not observe any antiviral effect. Then, to corroborate this negative result we carried on further tests. We extended the inhibition experiment to other two viruses, i.e., Herpes simples virus type-2 (HSV-2) (which is mostly associated to genital herpes, whereas HSV-1 has a prominent oral localization), and Measles virus. The results are reported in Figure 8 are however, negative: no antiviral action is observed.
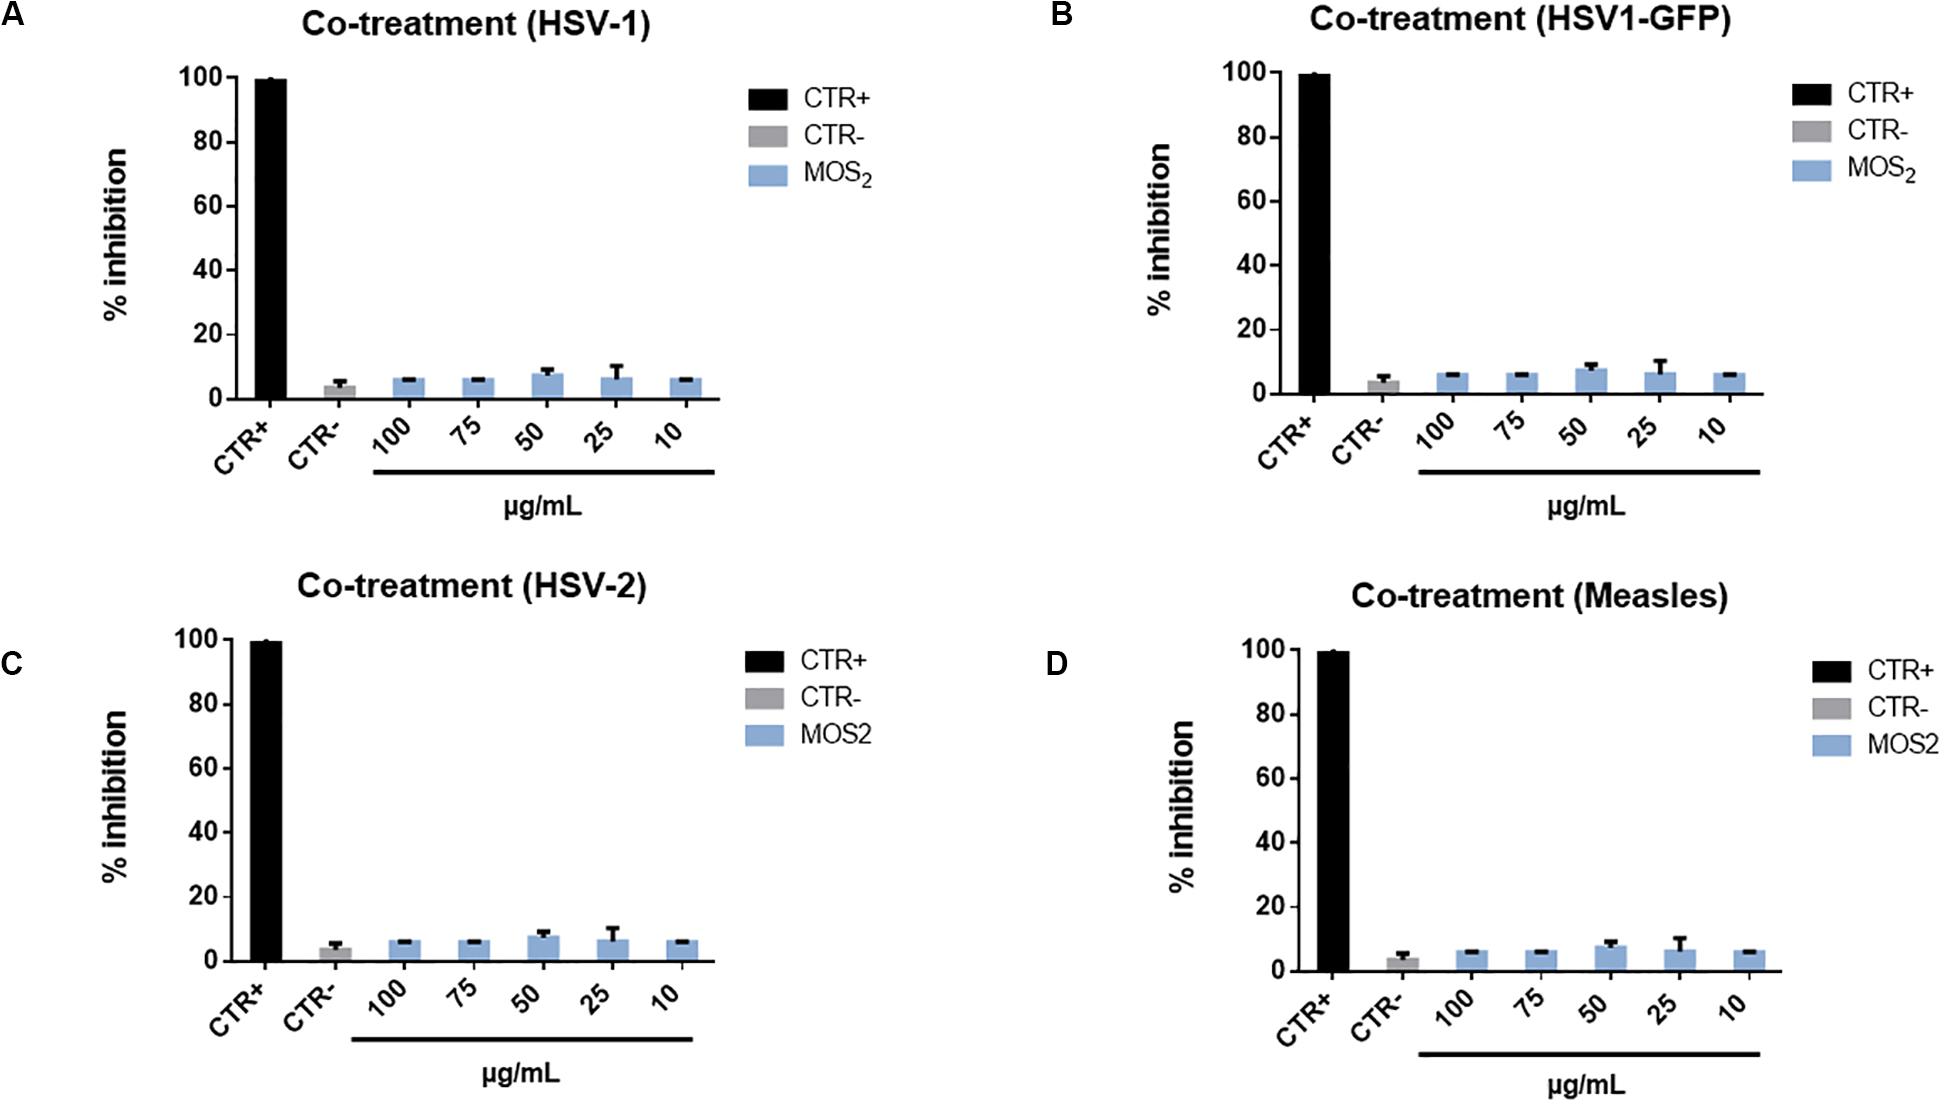
Figure 8. Co-treatment with MoS2 NSs and HSV-1-GFP, HSV-2 and Measles virus. Infectivity inhibition after treatment with MoS2 nanosheets and HSV-1 (A), HSV-1-GFP (B), HSV-2 (C), and measles virus (D). No antiviral action was detected for any of the tested nanosheet concentrations. Not infected and not treated cells represented the positive control (CTR+), meanwhile infected cells were the negative control (CTR–). The data statistical error is the standard deviation of three independent experiments. P-value is less than 0.05.
An additional test was performed through which we double checked this negative response by infecting Vero cells with another strain of HSV-1 virus, where the Green Fluorescent Proteins (GFP) has been inserted into the genome sequence into the gene encoding VP22 tegument protein, so to make this virus fluorescent in the green band. Then by measuring the amount of green fluorescence emitted by Vero cells, while growing infected with this virus, it is possible to monitor the eventual antiviral action or the inhibition. This is reported in Supplementary Figure S6 for various concentrations of the MoS2 NSs, where no antiviral action is present in none of the analyzed cases as a consistent green fluorescence confirms.
We explain this finding based on the same argument used in the previous subsection to motivate the minor efficacy of MoS2 NSs in the virus pre-treatment case as compared to GO NSs. But rather, in the co-treatment experiment the argument is much reinforced. In fact, the MoS2 NSs can likely be functionalized in the medium by acquiring protons, i.e., H+ ions, on their edges rich of sulfur atoms content, thus forming thiol groups. These groups then are highly repelled by the Vero cell membranes, which have −HS groups on their surface (Sametband et al., 2014). Essentially, the mechanism is similar to what described for the virus pre-treatment case, but much more efficient now, MoS2 nanoflakes are strongly repelled and going to the opposite direction. Eventually, no antiviral action is measured.
As for GO nanoflakes the co-treatment experiment leads to an impressive and somewhat unexpected very strong antiviral action, even stronger that for virus pre-treatment. Indeed, we measured inhibition of the order of 90–100% for concentrations in the 25–100 μg/mL of nanomaterial for GO(1) and a highest inhibition of ≈ 80% for GO(2), as reported in Figure 9. We ascribe this intense action to the presence of specific glycoproteins on the Vero cell membrane like Lectin, that have high affinity with negative groups present on the surface of GO NSs in solution, given the presence of electrolytes, such as carboxyl and epoxy (Klukova et al., 2016). This implies a high probability for both GO NSs and HSV-1 to meet and be in touch in correspondence of the Vero cell membrane, a kind of additional indirect interaction mediated by the presence of Vero cells. Then this mechanism adds to the direct interaction between nanoflakes and viruses, responsible for the antiviral action observed in the pre-treatment case, to reinforce the overall antiviral effect.
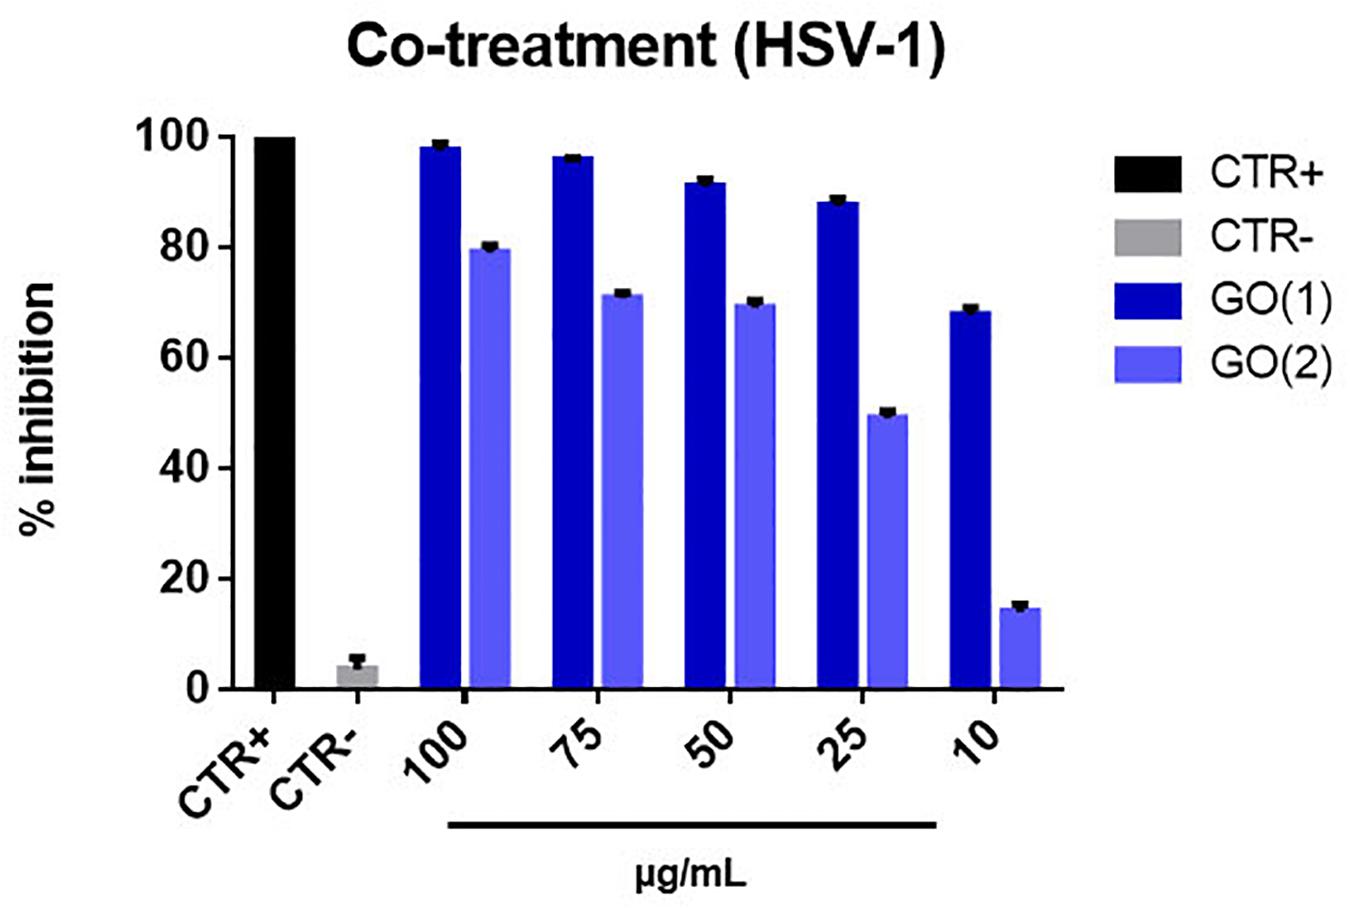
Figure 9. Co-treatment with GO NSs. The graph shows the percentage of inhibition of viral infection after treatment with GO [GO(1) and GO(2)]. We remind that for GO(1) the average lateral size of the nanoflake is ≈175 nm whereas for GO(2) is ≈500 nm, the average thickness being ≈1.2 nm and ≈ 2.5 nm, for GO(1) and GO(2), respectively. Cells and cells infected with virus represented the positive and negative controls, respectively. The data statistical error is the standard deviation of three independent experiments. P-value is less than 0.05.
Moreover, we notice that the antiviral impact decreases with decreasing GO concentration; in particular, this decrease is linear in case of GO(2), but for GO(1) we may assume that the decrease effect is just saturated at concentrations higher than 25 μg/mL, being the inhibition already as high as ≈90%. We also comment about the higher impact observed for smaller nanoflakes, GO(1), as compared to bigger nanoflakes, GO(2): in fact, smaller nanoflakes are characterized by sharper edges and a consequent stronger antiviral power than bigger NSs.
Figures 10A–D panel shows two different schemes of interaction: cell pre-treatment and post-treatment. In the former case, cells were incubated with 2D NSs for 1 h followed by the addition of the viruses for 1 h incubation. In the latter case, cells were firstly incubated with HSV-1 for 1 h; after this first step, 2D NSs were added contemporarily by virus removal from the given mixture for 1 h incubation. As we can see from the (A), the antiviral action is in this case low, just above the uncertainty in measuring zero action, represented by the negative control bar. In fact, the percentage of inhibition using 2D MoS2 NSs is less than 10% at each tested concentration. We can interpret this effect as due to the repulsion between MoS2 NSs and Vero cell membrane because both have negative surface charge. In (B), the result of the cell pre-treatment experiment is reported for GO. The antiviral effect is small also in this case for both GO(1) and GO(2) and concentration independent. This is likely due to the weak interaction of GO with the cell membrane together with the fast aggregation of GO in the broth medium in the presence of different ions and other nutrients, regardless the NSs size and thickness.

Figure 10. Cell pre-treatment and post-treatment assay after treatment with MoS2 and GO NSs. Vero cells were treated with MoS2 (A) and GO NSs (B), and then infected with HSV-1 in the cell pre-treatment assay. Infectivity inhibition experiment in the post-treatment scheme. (C) After addition of MoS2 NSs, (D) or treatment with GO NSs. No antiviral activity was reported for both NSs in the two antiviral experiments. Cells and cells infected with virus represented the positive (Acyclovir) and negative controls, respectively. The data statistical error is the standard deviation of three independent experiments. P-value is less than 0.05.
In the post-treatment experiment we did not see antiviral effect in any case, either with MoS2 and with GO NSs, as shown in (C,D). With MoS2 the effect was completely absent, whereas with GO it was nearly vanished, i.e., lower that ≈ 10% inhibition for both types of nanoflakes. We interpret this result as the affinity of viruses with Vero cells is so high that in the first 1 h incubation where the nanoflakes have not been added yet, nearly all the viruses present in the broth entered cells. Once the nanoflakes are added they cannot exert a direct damaging action onto the viruses as free viruses into the medium are not available anymore. On the other hand, nanoflakes are not capable to enter Vero cells as they are too big. Therefore, they can only approach the cell membrane, but as shown in Supplementary Figure S5 both nanomaterials have been proven not to be cytotoxic, thus their action on the cells is substantially negligible.
In order to visualize and better characterize the damaging action onto HSV-1 viruses by nanomaterials, both MoS2 and GO NSs, we carried out TEM analyses of samples prepared in the pre-treatment scheme as shown in Figures 11A–J. Here below we report a few examples of images of only viruses as viewed by TEM (Figures 11A–D), of viruses interacting with MoS2 (Figures 11E–H) and GO nanoflakes (Figures 11I,J) after the first hour of incubation before Vero cells are added.
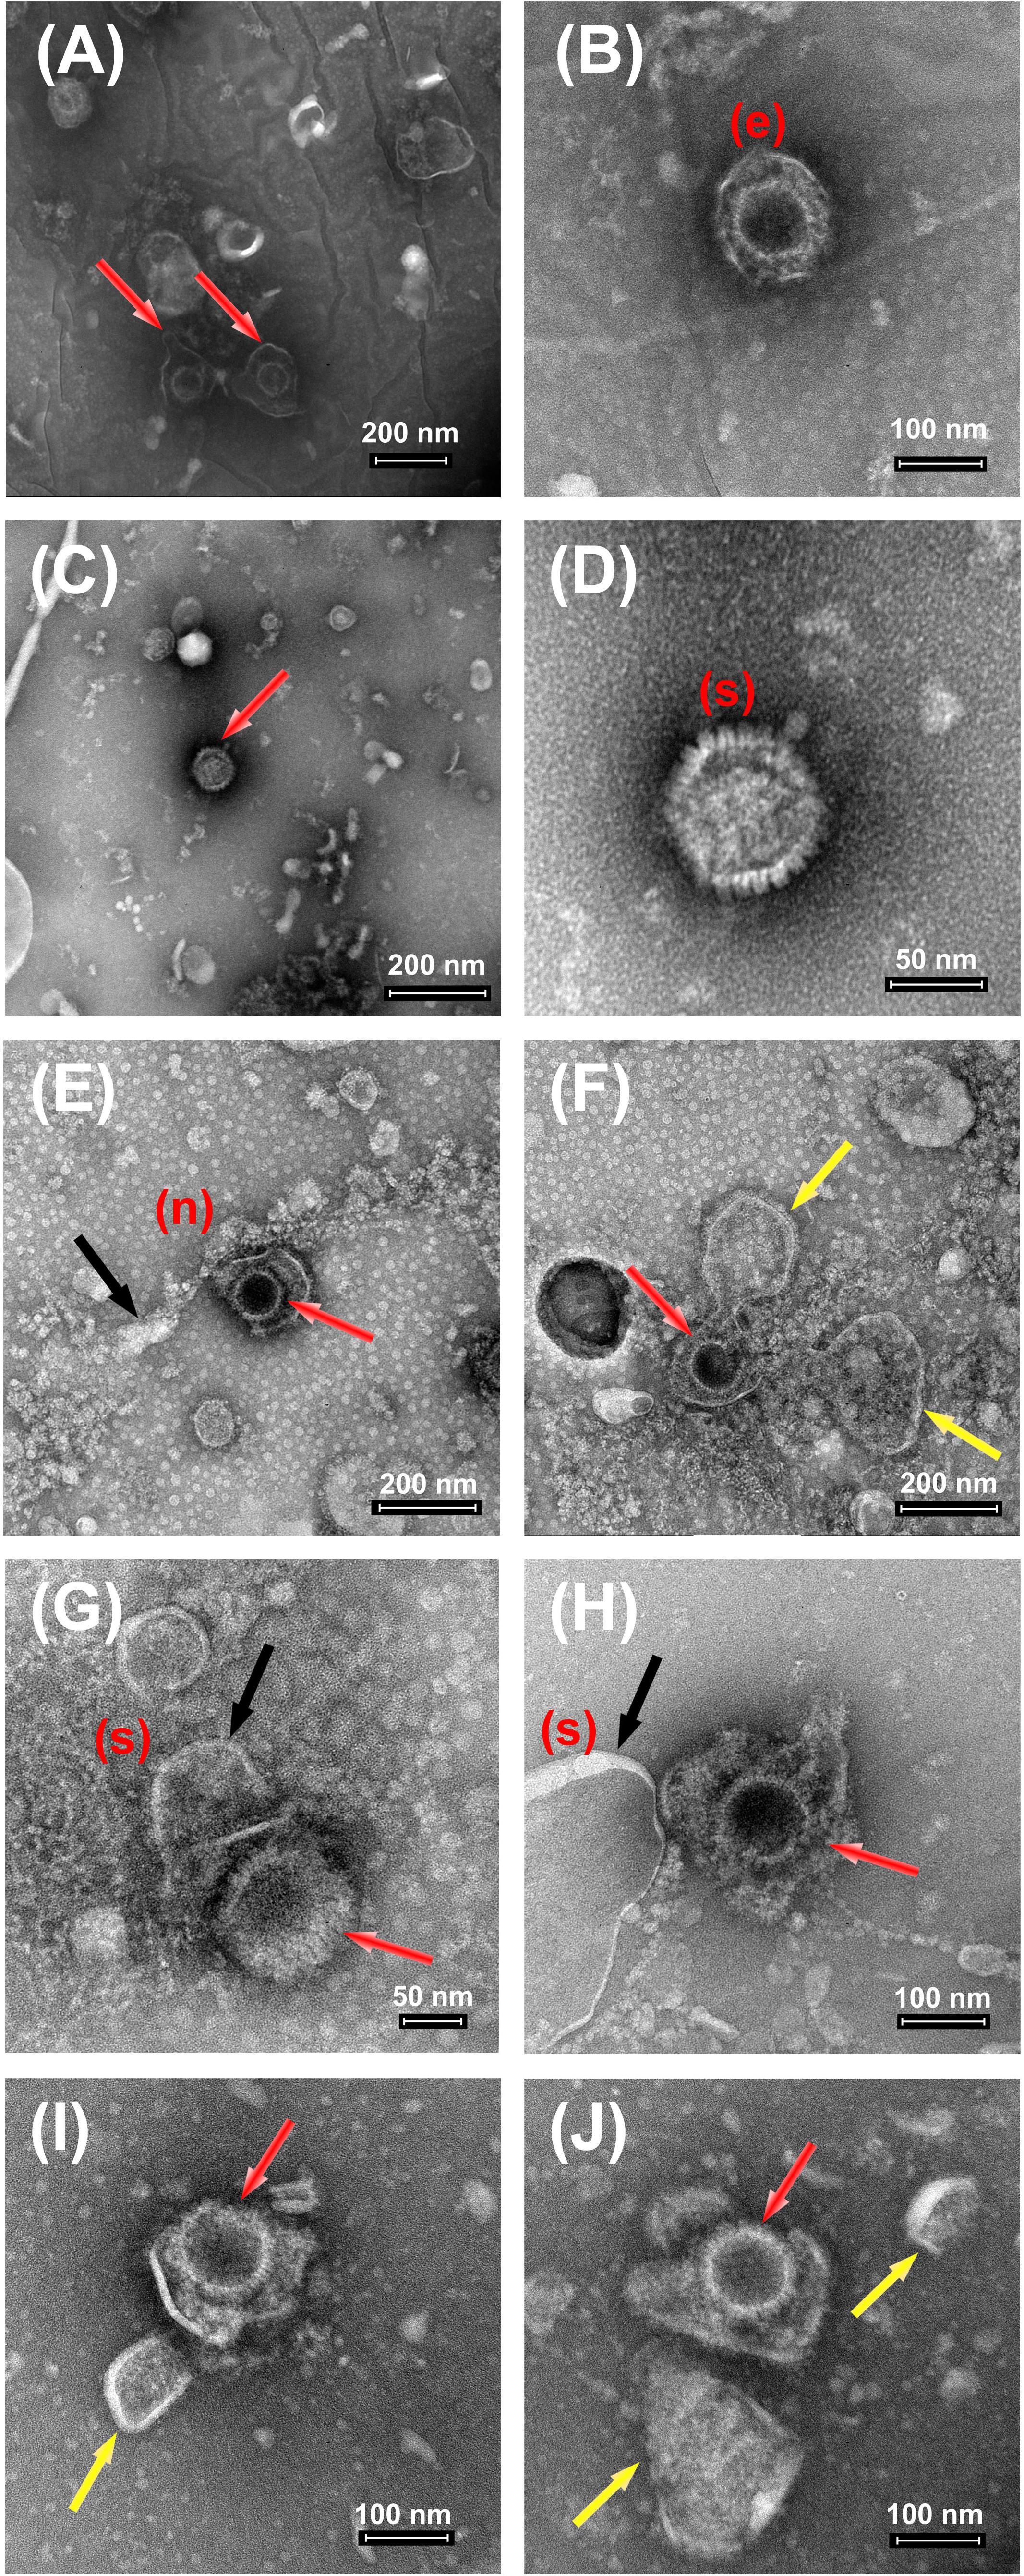
Figure 11. TEM images of HSV-1 after treatment with MoS2 and GO NSs. (A–D) Control HSV-1 at 109 PFU/mL. The above panel (A–D) shows the control images of HSV-1 with its intact spherical structure indicated with red arrows (in A,C). The unaffected virus structure has been nicely imaged showing the outer envelope (e) in (B) and spikes (s) in (D) over its surface. (E–H) The above panel (E–H) shows the control images of HSV-1 at 109 PFU/cell and MoS2 NSs at 100 μg/mL. HSV-1 is indicated with red arrows, meanwhile NSs with black ones. The yellow arrows indicate the opening and destruction of viral envelope MoS2-inducted. NSs are shown as a chain (n) or real sheets (s) around the virus surface affecting its membrane. (I,J) Control HSV-1 at 109 PFU/cell and GO NSs at 50 μg/mL (initial preparation concentration 1400 μg/mL). HSV-1 is indicated with red arrows, meanwhile GO NSs with yellow ones. All bright field TEM images have been acquired upon negative staining treatment with phosphotungstic acid solution (2%).
The panel (A–D) represents the morphological features of only HSV-1 after some purification steps and then deposited onto the given substrate. As we can see from (A), three main parts are visible: (a) the central position of the core; (b) a layer called capsid surrounding the core; and (c) an envelope surrounding the capsid as shown by red arrows. Usually, the capsid comes in different angular positions and it remains stable in the given medium. In (B), we can see an envelope, indicated by (e) in the panel, enclosing a capsid. The outer boundary of this layer appears to be denser than the remaining structure. Whereas, in (C-D), we can see spikes as covering the outer layer of the HSV-1, indicated by (s) in the (D) panel that is a magnification of (C). These spikes mark the presence of some glycoproteins present on the virus surface for the attachment to the Vero cell membrane.
The panel in (E-H) shows the presence of water dispersed 2D MoS2 NSs in black arrows, while red arrows indicate viruses. As it can be seen from (E), MoS2 nanoflakes are organized in a chain, indicated as (n), around the virus surface affecting its membrane. The edges of the flakes are in contact with the virus envelope which induced opening of the virus envelope and led to reduced vitality in the given medium. In (F) we did observe right the cut in the virus envelope by a nanoflake with the consequent leak of the internal material of the virus. In fact, we see that the viral envelope of the virus of is no more in its spherical shape: two rounded wide areas of leaked viral material are visible on both sides of the nanoflake chain, highlighted by yellow arrows, evidencing the virus disruption. Due to negative staining effect, that helps to enhance the virus contrast, a clear morphology of MoS2 NSs is not visible, as our focus was to look for damaged virus structure. However, concentration dependent antiviral action is observed: in the condition of the images, in fact, we measured a slight virus inhibition. Another contact interaction is imaged in (G) and (H). Here, we can clearly see the presence of MoS2 nanoflakes in black arrow (indicated as s in the (A-D) and the subsequent disruption of virus surface with no more outer envelope. In (H), a large size MoS2 nanoflake with a marked sharp edge oriented toward a virus is shown.
GO in our case has shown pretty much intriguing results depicting its strong and evident antiviral action. Here red arrow indicates viruses and yellow arrows GO flakes. The above images show the presence of wrinkled GO NSs present near the virus membrane. The sharp edges of small size nanoflakes in this case, GO(1), have affected the virus envelope of HSV-1 resulting in the disruption of proteins present on its surface, as seen for two virus-flake couples in (I-J). The presence of glycoproteins on HSV-1 carrying positive charge attracts the negative surface charge of graphene oxide and a specific orientation of GO NSs with its sharp edges disrupts its membrane leading to virus significant inhibition.
In summary, we have reported a significant improvement in the fabrication of MoS2 NSs by achieving a considerable amount of stability and concentration in pure water as a solvent. Thanks to the LPE technique which gives access to tune various exfoliation parameters such as Ci, ts, As and sonication vial. These parameters play a key role in defining the quality of exfoliation in various organic solvents, aqueous surfactant solutions and in pure water as well. Apart from MoS2, fabrication of GO in pure water with a very high initial concentration (600 and 1400 μg/mL) and thickness in the range of 1.2 nm −2.5 nm has been achieved. Very interestingly, we found intriguing antibacterial and antiviral action of both GO and MoS2 NSs on the tested E. coli (gram negative), S. aureus (gram positive) bacteria and HSV-1. In particular, MoS2 showed a considerable bactericide effect in a short incubation time, 3–6 h, with both S. aureus and E. coli, whereas for GO the antibacterial action was lower and only began after 20 h incubation. Particularly, to explain the obtained antibacterial results we developed a refinement of models based on the DLVO theory, considering the role of electrostatic and vdW interactions in the attachment efficacy of a given 2DMs with the bacteria under study. We have also estimated the probability per unit time for a bacterium (S. aureus or E. coli) to be killed by the inhibition action of MoS2 NSs. This antibacterial action reduces after 20 h of incubation due to the fast multiplication rate of the bacterium whereas MoS2 NSs are all taken by contact interactions with already damaged bacteria. On the other hand, GO showed completely different results exhibiting its antibacterial action after 20 h of incubation which we have ascribed to the so called ‘wrapping mechanism,’ due to large aggregates of GO NSs formed because of to the presence of different electrolytes in the given broth. The results found in viruses samples were, instead, interpreted in a more qualitative manner, since interactions with viruses are more complicated than with bacteria, due to the presence of a third interacting species: the Vero cells host model. We measured the infectivity inhibition induced in a Vero cells model by four different experimental schemes: virus pre-treatment, co-treatment, cell pre-treatment and cell post-treatment. Surprisingly, the impact of MoS2 and GO on HSV-1 virus was reversed as compared to the actions on bacteria: while GO had a pretty strong antiviral effect in the virus pre-treatment, that only detects the direct NSs -virus interaction, and co-treatment experiments, MoS2 only induced some antiviral action in virus the pre-treatment experiment. No antiviral effect was noted in either cell pre- and post-treatment case for both nanomaterials. The very interesting GO co-treatment case has puzzled the scenario because direct interaction of GO with virus is pretty strong: we interpret this as due to the presence of specific glycoproteins on the Vero cell membrane that have high affinity with the oxygen functionalized groups on the GO NSs surfaces, such as carboxyl and epoxy. This results into an increased affinity of GO NSs with the Vero cell membrane, where NSs and viruses certainly have the highest likelihood to meet and to be put in contact interaction. Our findings open very interesting prospects both (i) to understand the role of specific broth constituents and their chemical properties in view of GO and MoS2 NSs functionalization, when interacting with bacteria and viruses, and (ii) also exciting perspectives of applications given the specific antibacterial and antiviral observed actions. In forthcoming experiments, we aim at studying also how the interactions of 2D NSs impact on genetic sequences of interacting viruses, to possibly unveil some of the interaction pathways. For instance, it could be worth in the next studying gene regulation in macrophages in response to viral and bacterial infections. It is known, in this case, that TRIM29 regulates the activation of alveolar macrophages, inducing the expression of type I interferons and proinflammatory cytokines in alveolar macrophages (Xing et al., 2016) and DNA virus infection (Xing et al., 2017). It would be interesting to study the effect of 2D NSs on the expression of TRIM29 for the control of viral and bacterial lung infections.
As for the characterization of the fabricated MoS2 and GO NSs, results of spectroscopic and stabilization measurements as well as morphological analysis are always the average of 3–5 acquisitions for each single scan. In particular, UV-visible spectra for MoS2 and GO, as shown in Supplementary Figures S1–S3, have been recorded three times for each scan. For Raman spectra, each scan has been recorded five resulting in the average shown in Supplementary Figures S4, S5. As for the ζ-potential shown in Table 2, the standard deviation values are calculated over 5 scans per sample, giving the reported uncertainty on the best estimated value (average).
For SEM images statistical analysis, we have calculated the percentage of damaged and not damaged bacteria normalized to the total number of bacteria present in the images. Each reported percentage reported in Table 4 represents an average value referred to 4 different SEM scans to provide an estimate for the statistical relevance of the interaction effect of MoS2 NSs with bacteria.
Antibacterial, cytotoxicity and antiviral tests were analyzed using GraphPad Prism version 5 (GraphPad Software, Sand Diego, CA, United States). CC50 and EC50 were calculated from a sigmoidal dose-response curve. P-values of <0.05 were considered to be statistically significant.
The starting commercialized bulk MoS2 powder (Sigma Aldrich, 69860, particle size 6 μm, density 5.06 g mL-1 at 25°C), graphite powder (Aldrich, 332461, mesh number of grains +100, >75%, particle size ∼300 mm) was exfoliated in de-ionized/elix water and Cyrene respectively, as a pure solvent using a tip sonicator (Bandelin Ultrasound SONOPLUS HD3200, maximum power 200 W), working frequency 20 kHz using KE-76 (a tapered tip with 6mm diameter) and MS-72 (a micro tip with 2 mm diameter). Whereas, for GO starting precursor graphite oxide (XIAMEN TOB NEW ENERGY TECHNOLOGY Co., TOB-2430, particle size 5–50 μm, density 0.3–0.4 g mL–1 at 25°C) was exfoliated using the same sonicator device as above using KE-76 micro tip at running amplitude of 70%.
Exfoliation of graphene oxide was carried out using 1600 mg of graphite oxide in 200 mL of de-ionized water using the same probe sonicator with KE-76 tapered tip at running amplitude of 70%. Net exfoliation energy of 194.4 kJ was obtained after exfoliating graphite oxide for 30 min with a substantial amount of stability in the given solvent. The procedure adopted for graphite oxide was different from MoS2 NSs.
The fundamental disadvantage of LPE of 2DMs is that it gives poly disperse nature of exfoliated 2D NSs in the given medium. These consist of un-exfoliated material, unstable dispersed NSs and of course separated and exfoliated nanoflakes in the same medium which could be a surfactant or a suitable solvent with matching surface tension that of the material. The larger dense particles tend to sediment faster than the less dense because of the earth’s gravitational field. In general, LPE produces a wide distribution of thickness and lateral sizes of 2D nanoflakes which makes it more preferable candidate to study its potential for fundamental applications of different areas of interest. Then, it is very crucial to separate this poly-disperse 2D NSs on the basis of their lateral size and thicknesses, what was achieved by means of a versatile bench top centrifuge model (Eppendorf Centrifuge 5810 R, Rotor F-34-6-38).
The un-exfoliated MoS2 NSs were removed by discarding the sediment at low centrifugal force of 100 g for 90 min. The obtained supernatant contained lower monolayer content with wide distribution of thickness and lateral sizes of NSs. The supernatant was then centrifuged at higher centrifugal force of 1000 g for 90 min followed by the re-dispersion of sediment into the fresh elix water in 3–5 mL. The above procedure was repeated twice with 2000 and 3000 g centrifugal force, respectively. Subsequently, the obtained supernatants were analyzed for further characterizations such as UV-Visible spectroscopy, Raman spectroscopy, ζ- potential, SEM and TEM.
The GO NSs dispersion was centrifuged at 3500 rpm for 30 min followed by the re-dispersion of the sediment in a smaller volume and separation of supernatant for further characterization analysis.
Optical extinction spectra were acquired on Jasco V-530 UV-Vis spectrophotometer using 1 cm optics quartz cuvettes. The extinction spectra of MoS2 dispersion was analyzed to determine the Mean layer number < N >, Mean lateral size < L >, and Mean concentration < C > of the NSs by metrics as explained by Backes et al. (2014).
Electrostatic stabilization is an important parameter to analyze the stability of the liquid exfoliated dispersions. The surface charges generated during the exfoliation can be attributed to electrophoretic mobility measurements (μ). So, these μ measurements were carried out on laser interferometric technique (Malvern Zetasizer Nano system) with irradiation from 633 nm He-Ne laser. The samples were injected in folded capillary cells, and the μ value was measured using a combination of electrophoresis and laser Doppler velocimetry techniques. The Henry’s equation (see Supplementary Material) was used to estimate the ζ-potential from the μ data. For the possible upper and lower limits of the ζ-potential, Henry’s equation was approximated to both the Huckel and Smoluchowsky limits (see Supplementary Material). The reason for this approximation is due to the particular solvent-sample relationship; Henry’s equation is approximated to get an estimate of surface charge values of exfoliated NSs. All the measurements were carried out at 25°C.
A confocal Raman microscope (Jasco, NRS-3100) was used to obtain Raman and photoluminescence spectra. The 514 nm line of an air-cooled Ar+ laser (Melles Griot, 35 LAP431 220), was injected into an integrated Olympus microscope and focused to a spot diameter of approximately 3 μm by a 20x objective with a final 4 mW power at the sample. A holographic notch filter was used to reject the excitation laser line. The Raman backscattering was collected using a 0.1 mm slit and a diffraction lattice of 1200 grooves/mm, corresponding to an average spectral resolution of 8 cm–1. Solutions were left evaporating on Si substrates, and it took 60 s to collect a complete data set by a Peltier-cooled 1024 × 128 pixel CCD photon detector (Andor DU401BVI). Raman micro-spectroscopic measurements of both GO and MoS2 samples were at least triplicated for scope of reproducibility and as a check of spatial homogeneity of the samples. Wavelength calibration was performed by using cyclohexane as a standard.
Morphological analyses of samples were performed with a scanning electron microscope (SEM) JEOL-JSM 5310 (CISAG laboratory, at University of Naples, Federico II). The SEM operating at 15 kV, is equipped with energy dispersive X-Ray spectroscopy (EDS); data were processed with INCA version 4.081. The samples were metalized with gold by using a sputter coater. Oxford Instruments (2006): INCA - The microanalysis suite issue 17a + SP1 – Version 4.08. Oxford Instr. Anal. Ltd., Oxfordshire, United Kingdom.
TEM micrographs were collected using a FEI TECNAI G2 S-twin 200kV apparatus operating at 120 kV (LaB6 source). A drop (5 μL) of flakes (suspension in water) was transferred on carbon-coated copper grids and then left at room temperature until the solvent was completely evaporated. Concerning samples containing both viruses and nanomaterials, a drop (5 μL) of suspension was deposited onto a formvar/carbon TEM grid until the solvent was completely evaporated and then the sample was stained with phosphotungstic acid (2%, pH 6.5) for 30s to enhance the contrast.
The antibacterial activity was then further characterized by performing the plate microdilution method, according to the guidelines established by the National Committee on Clinical Laboratory Standards (NCCLS).
To uniform the bacterial suspension for this antimicrobial assay, fresh colonies of each strain, grown on agarized Brain Heart Infusion (brain infusion solids 12.5 g/L, beef heart infusion solids 5 g/L, proteose peptone 10 g/L, sodium chloride 5 g/L, glucose 2 g/L and disodium phosphate 2.5 g/L), were inoculated in Brain Heart Infusion liquid and incubated at 37° C overnight. The bacteria cells were harvested via centrifugation (4000 rpm for 10 min). They were washed three times with deionized water to remove residual growth medium constituents. The pellets were then suspended in ultrapure water, PBS buffer and Brain Heart Infusion liquid broth. Bacterial cell suspensions were diluted in the specific buffers or solutions to obtain cell samples having a turbidity (OD600) corresponding to 1 × 10⁸ CFU/mL. Hundred and eighty μl of cells in different buffers were incubated with 20 μl of fresh nanosheet suspensions (12.5–1.56 μg/ml) for 3–6–20 h in Brain Heart Infusion broth with shaking at 37°C. The viability was evaluated by measuring OD600. The tests were performed in triplicate.
Susceptibility testing was performed following the broth microdilution method outlined by the National Committee on Clinical Laboratory Standards (NCCLS) using sterile 96-well microliter plates. One bacterial species for each group, based on the Gram classification, were selected: for Gram-negative bacteria, we selected (E. coli ATCC CRM-11229); for Gram-positive bacteria, we selected (S. aureus ATCC 6538). The dilutions (25 to 0.39 μg/mL and 100 to 0.39 μg/mL) of each NSs (GO-1 = 1400 μg/mL and GO-2 = 600 μg/mL) were prepared in water at a volume of 100 μL/well.
Each well was inoculated with 50 μl of the standardized bacterial inoculum, corresponding to a final test concentration of approximately 5 × 10⁵ CFU/mL. The microbial growth was observed after 3, 6, and 20 h of incubation at 37°C. The positive controls consisted of ampicillin and vancomycin for E. coli and S. aureus, respectively. The bacterial inhibition percentage (IC%) was determined according to the following equation:
where OD600 is the optical density of the sample measured at 600 nm. The tests were performed in triplicate.
HSV-1 (strain SC16), HSV-2 (strain 333) and HSV-1-GFP were propagated on Vero cells monolayers. Vero cells (ATCC CCL-81) are African green monkey kidney cells and they were grown in MEM supplemented with 10% fetal bovine serum (FBS). Measles virus (strain Edmonston) was propagated on Vero-hSLAM cells (ECACC 04091501). Vero/hSLAM are Vero cells transfected with a vector plasmid (pCXN2) and an expression plasmid (pCAG-hSLAM) coding for the human measles virus’s receptor, the signaling lymphocytic activation molecule (SLAM). Vero-hSLAM cells were grown in MEM supplemented with 10% FBS and selected in 0.4mg/ml Geneticin (G418).
The viability of Vero cells was determined through MTT assay (Sigma Aldrich, code 11465007001). 2 × 10⁴ cells/well were treated with different concentrations ranging from 0.39 to 100 μg/mL for a total of 24 h in 96 wells plate. The day after MTT powder was added for 3 h and then the purple formazan crystals were dissolved in dimethyl sulfoxide (DMSO) (100 μL/well). Finally the absorbance was recorded on a microplate reader at a wavelength of 570nm. Not treated cells represented the positive control (CTR+), meanwhile cells treated with DMSO were the negative control (CTR−). The tests were performed in triplicate.
To evaluate the effect of the NSs on HSV-1 infectivity inhibition, a co-treatment experiment was performed: the cells were incubated with different concentrations of MoS2 (0.39, 0.78, 1.5, 3.125, 6.25, 12.5, 25, and 50 μg/mL) and GO NSs (10, 25, 50, and 100 μg/mL) in the presence of the virus (103PFU/cell) for 1 h at 37°C. At the end of the treatment, the cell monolayer was washed with Phosphate Buffer Saline (PBS) 1X and incubated for 48 h in MEM supplemented with carboxymethylcellulose. After 2 days, the cells were fixed and stained with 0.5% crystal-violet, and the plaques were counted. The percentage of viral inhibition was calculated compared to the untreated HSV-1 control (CTR-) as followed:-
Not infected and not treated cells represented the positive control (CTR+), meanwhile infected cells were the negative control (CTR−). The tests were performed in triplicate.
To evaluate the effect of the MoS2 NSs on HSV-1 infectivity inhibition, a virus pre-treatment experiment was performed. MoS2 and GO NSs were added to the virus (1 × 10⁴ PFU/cell) and incubated for 1 h at 37°C at different concentrations (10, 25, 50, 75, and 100 μg/mL). After incubation, each mixture (virus + NSs) was diluted and the virus was infected with MOI of 0.01 PFU/cell. The dilutions were added to Vero cells monolayers for 1 h. At the end of the treatment, the cell monolayer was washed with PBS 1X and incubated for 48 h in MEM supplemented with carboxymethylcellulose. After 2 days, the cells were fixed and stained with 0.5% crystal-violet, and the plaques were counted. The experiments were performed in triplicate.
The NSs, used at the same concentrations as the other assays, and the positive control dextran sulfate (PMID: 10618073) (Sigma: 67578) were added on Vero cells and incubated for 1 h at 37°C. The virus was added to a MOI of 0.01 PFU/cell for 1 h at 37°C. Finally, the cells were incubated with CMC for 48 h at 37°C. Cells were fixed, stained and the number of plaques was scored.
Vero cells were incubated with HSV-1 (MOI 0.01 PFU/cell) for 1 h at 37°C, after that the virus was removed and the NSs were added at the same concentrations as the other assays and incubated for 1 h at 37°C. Acyclovir (Sigma: A7678) was used as positive control. Then the cells were incubated with CMC for 48 h at 37°C. The cells were then fixed, stained and the plaques counted.
The bacterial and viral strains used in this study belong to biosafety level 2, based on U.S. Public Health Service Guidelines. Therefore, we adhered to standard laboratory safety procedures, which included disinfection of laboratory surfaces before and after completing the experiments and the use of adequate personal protective equipment.
All datasets generated for this study are included in the article/Supplementary Material.
MS conceived the experiments, fabricated and characterized the nanomaterials, analyzed the results, and wrote the manuscript. CZ contributed to the viral experimental organization, data production, data analysis, text composition, analyzed the results, and wrote the manuscript. LA conceived the experiments and analyzed the results. FB analyzed the results and wrote the manuscript. AC contributed to the viral experimental, data production, and data analysis. AD fabricated the GO NSs. MD contributed to the bacteria-nanomaterial modeling. RD and AV analyzed the samples by TEM microscopy. VF contributed to the bacterial experimental organization, data production, data analysis, and text composition. GF contributed to the experimental supervision, experimental organization, data analysis, and text composition. CI contributed to the data analysis and text composition. MR analyzed the samples by SEM microscopy. MoV contributed to the data analysis, data production, bacteria-nanomaterial modeling, and text composition. MiV contributed to the data analysis and text composition. MG contributed to the experimental conception, data analysis, text composition, and main supervision. CA conceived the experiments, data analysis, bacteria-nanomaterial modeling, text composition, and main supervision. All the authors contributed to the article and approved the submitted version.
CA, MoV, and MS acknowledge partial support for this research from MIUR (Italian Ministry for Research) under project PRIN “Predicting and controlling the fate of bio-molecules driven by extreme-ultraviolet radiation” (Prot. 20173B72NB). CA and FB acknowledge partial support for this research from MIUR under the project “Tecnologie Innovative per lo Studio di Interazioni tra Acidi Nucleici e Proteine: Metodi Sperimentali e Modelli” (Dottorato Innovativo E62G17000000007). LA acknowledges partial support for this research from Università della Campania “Luigi Vanvitelli” under the project VALERE: Vanvitelli per la Ricerca, from the Campania Regional Government Technology Platform Lotta alle Patologie Oncologiche under the project iCURE, from the Campania Regional Government under the project FASE2: IDEAL and from MIUR under the project Proof of Concept POC01_00043.
The authors declare that the research was conducted in the absence of any commercial or financial relationships that could be construed as a potential conflict of interest.
The Supplementary Material for this article can be found online at: https://www.frontiersin.org/articles/10.3389/fbioe.2020.569967/full#supplementary-material
Akhavan, O., Ghaderi, E., and Esfandiar, A. (2011). Wrapping bacteria by graphene nanosheets for isolation from environment, reactivation by sonication, and inactivation by near-infrared irradiation. J. Phys. Chem. B 115, 6279–6288. doi: 10.1021/jp200686k
Anto Jeffery, A., Nethravathi, C., and Rajamathi, M. (2014). Two-dimensional nanosheets and layered hybrids of MoS2 and WS2 through exfoliation of ammoniated MS2 (M = Mo,W). J. Phys. Chem. C 118, 1386–1396. doi: 10.1021/jp410918c
Backes, C., Hanlon, D., Szydlowska, B. M., Harvey, A., Smith, R. J., Higgins, T. M., et al. (2016a). Preparation of liquid-exfoliated transition metal dichalcogenide nanosheets with controlled size and thickness: a state of the art protocol. J. Vis. Exper. 118:e54806. doi: 10.3791/54806
Backes, C., Szydłowska, B. M., Harvey, A., Yuan, S., Vega-Mayoral, V., Davies, B. R., et al. (2016b). Production of highly monolayer enriched dispersions of liquid-exfoliated nanosheets by liquid cascade centrifugation. ACS Nano 10, 1589–1601. doi: 10.1021/acsnano.5b07228
Backes, C., Higgins, T. M., Kelly, A., Boland, C., Harvey, A., Hanlon, D., et al. (2017). Guidelines for exfoliation, characterization and processing of layered materials produced by liquid exfoliation. Chem. Mater. 29, 243–255. doi: 10.1021/acs.chemmater.6b03335
Backes, C., Smith, R. J., McEvoy, N., Berner, N. C., McCloskey, D., Nerl, H. C., et al. (2014). Edge and confinement effects allow in situ measurement of size and thickness of liquid-exfoliated nanosheets. Nat. Commun. 5:4576. doi: 10.1038/ncomms5576
Bayoudh, S., Othmane, A., Mora, L., and Ben Ouada, H. (2009). Assessing bacterial adhesion using DLVO and XDLVO theories and the jet impingement technique. Coll. Surf. B Biointerf. 73, 1–9. doi: 10.1016/j.colsurfb.2009.04.030
Brown, L., Wolf, J. M., Prados-Rosales, R., and Casadevall, A. (2015). Through the wall: extracellular vesicles in Gram-positive bacteria, mycobacteria and fungi. Nat. Rev. Microbiol. 13, 620–630. doi: 10.1038/nrmicro3480
Brown, S., Santa Maria, J. P., and Walker, S. (2013). Wall teichoic acids of gram-positive bacteria. Annu. Rev. Microbiol. 67, 313–336. doi: 10.1146/annurev-micro-092412-155620
Cao, W., Yue, L., and Wang, Z. (2019). High antibacterial activity of chitosan – molybdenum disulfide nanocomposite. Carbohyd. Polym. 215, 226–234. doi: 10.1016/j.carbpol.2019.03.085
Cheeveewattanagul, N., Morales-Narváez, E., Hassan, A. R. H. A., Bergua, J. F., Surareungchai, W., Somasundrum, M., et al. (2017). Straightforward immunosensing platform based on graphene oxide-decorated nanopaper: a highly sensitive and fast biosensing approach. Adv. Funct. Mater. 27:1702741. doi: 10.1002/adfm.201702741
Chekin, F., Bagga, K., Subramanian, P., Jijie, R., Singh, S. K., Kurungot, S., et al. (2018). Nucleic aptamer modified porous reduced graphene oxide/MoS2 based electrodes for viral detection: Application to human papillomavirus (HPV). Sens. Actuat. B Chem. 262, 991–1000. doi: 10.1016/j.snb.2018.02.065
Chen, Y. N., Hsueh, Y. H., Hsieh, C. T., Tzou, D. Y., and Chang, P. L. (2016). Antiviral activity of graphene–silver nanocomposites against non-enveloped and enveloped viruses. Intern. J. Environ. Res. Public Health 13:430. doi: 10.3390/ijerph13040430
Cheng, C., Li, S., Thomas, A., Kotov, N. A., and Haag, R. (2017). Functional graphene nanomaterials based architectures: biointeractions, fabrications, and emerging biological applications. Chem. Rev. 117, 1826–1914. doi: 10.1021/acs.chemrev.6b00520
Chimene, D., Alge, D. L., and Gaharwar, A. K. (2015). Two-dimensional nanomaterials for biomedical applications: emerging trends and future prospects. Adv. Mater. 27, 7261–7284. doi: 10.1002/adma.201502422
Cooper, R., and Heldwein, E. (2015). Herpesvirus gB: a finely tuned fusion machine. Viruses 7, 6552–6569. doi: 10.3390/v7122957
Cunningham, G., Lotya, M., Cucinotta, C. S., Sanvito, S., Bergin, S. D., Menzel, R., et al. (2012). Solvent exfoliation of transition metal dichalcogenides: dispersibility of exfoliated nanosheets varies only weakly between compounds. ACS Nano 6, 3468–3480. doi: 10.1021/nn300503e
Deokar, A. R., Nagvenkar, A. P., Kalt, I., Shani, L., Yeshurun, Y., Gedanken, A., et al. (2017). Graphene-Based “hot Plate” for the capture and destruction of the herpes simplex virus Type 1. Bioconjug. Chem. 28, 1115–1122. doi: 10.1021/acs.bioconjchem.7b00030
Domingue, G. (1996). Bacterial doubling time modulates the effects of opsonisation and available iron upon interactions between Staphylococcus aureus and human neutrophils. FEMS Immunol. Med. Microbiol. 16, 223–228. doi: 10.1111/j.1574-695X.1996.tb00139.x
Donskyi, I. S., Azab, W., Cuellar-Camacho, J. L., Guday, G., Lippitz, A., Unger, W. E. S., et al. (2019). Functionalized nanographene sheets with high antiviral activity through synergistic electrostatic and hydrophobic interactions. Nanoscale 11, 15804–15809. doi: 10.1039/C9NR05273A
Du, T., Lu, J., Liu, L., Dong, N., Fang, L., Xiao, S., et al. (2018). Antiviral activity of graphene oxide-silver nanocomposites by preventing viral entry and activation of the antiviral innate immune response. ACS Appl. Biol. Mater. 1, 1286–1293. doi: 10.1021/acsabm.8b00154
Dua, V., Surwade, S. P., Ammu, S., Agnihotra, S. R., Jain, S., Roberts, K. E., et al. (2010). All-organic vapor sensor using inkjet-printed reduced graphene oxide. Angew. Chem. Intern. Edn. 49, 2154–2157. doi: 10.1002/anie.200905089
Eda, G., and Chhowalla, M. (2009). Graphene-based composite thin films for electronics. Nano Lett. 9, 814–818. doi: 10.1021/nl8035367
Fan, X., Xu, P., Zhou, D., Sun, Y., Li, Y. C., Nguyen, M. A. T., et al. (2015). Fast and Efficient preparation of exfoliated 2H MoS2 nanosheets by sonication-assisted lithium intercalation and infrared laser-induced 1T to 2H phase reversion. Nano Lett. 15, 5956–5960. doi: 10.1021/acs.nanolett.5b02091
Farahat, M., Hirajima, T., Sasaki, K., and Doi, K. (2009). Adhesion of Escherichia coli onto quartz, hematite and corundum: extended DLVO theory and flotation behavior. Coll. Surf. B Biointerf. 74, 140–149. doi: 10.1016/j.colsurfb.2009.07.009
Franci, G., Falanga, A., Zannella, C., Folliero, V., Martora, F., Galdiero, M., et al. (2017). Infectivity inhibition by overlapping synthetic peptides derived from the gH/gL heterodimer of herpes simplex virus type 1. J. Pept. Sci. 23, 311–319. doi: 10.1002/psc.2979
Frirdich, E., and Whitfield, C. (2005). Lipopolysaccharide inner core oligosaccharide structure and outer membrane stability in human pathogens belonging to the Enterobacteriaceae. J. Endot. Res. 11, 133–144. doi: 10.1179/096805105X46592
Geesey, G. G., Wigglesworth-Cooksey, B., and Cooksey, K. E. (2000). Influence of calcium and other cations on surface adhesion of bacteria and diatoms: a review. Biofouling 15, 195–205. doi: 10.1080/08927010009386310
Gholami, M. F., Lauster, D., Ludwig, K., Storm, J., Ziem, B., Severin, N., et al. (2017). Functionalized graphene as extracellular matrix mimics: toward well-defined 2D nanomaterials for multivalent virus interactions. Adv. Funct. Mater. 27:1606477. doi: 10.1002/adfm.201606477
Ghosal, K., and Sarkar, K. (2018). Biomedical applications of graphene nanomaterials and beyond. ACS Biomater. Scie. Eng. 4, 2653–2703. doi: 10.1021/acsbiomaterials.8b00376
Gibson, B., Wilson, D. J., Feil, E., and Eyre-Walker, A. (2018). The distribution of bacterial doubling times in the wild. Proc. R. Soc. B Biol. Sci. 285:20180789. doi: 10.1098/rspb.2018.0789
Gravagnuolo, A. M., Morales-Narváez, E., Longobardi, S., Da Silva, E. T., Giardina, P., and Merkoçi, A. (2015). In situ production of biofunctionalized few-layer defect-free microsheets of graphene. Adv. Funct. Mater. 25, 2771–2779. doi: 10.1002/adfm.201500016
Guo, N., Yam, K. M., and Zhang, C. (2018). Substrate engineering of graphene reactivity: towards high-performance graphene-based catalysts. NPJ 2D Mater. Appl. 2:1. doi: 10.1038/s41699-017-0046-y
Gupta, A., Arunachalam, V., and Vasudevan, S. (2015). Water dispersible, positively and negatively charged Mos 2 Nanosheets: surface chemistry and the role of surfactant binding. J. Phys. Chem. Lett. 6, 739–744. doi: 10.1021/acs.jpclett.5b00158
Hai, X., Chang, K., Pang, H., Li, M., Li, P., Liu, H., et al. (2016). Engineering the edges of MoS2 (WS2) crystals for direct exfoliation into monolayers in polar micromolecular solvents. J. Am. Chem. Soc. 138, 14962–14969. doi: 10.1021/jacs.6b08096
Ho, T. D., and Waldor, M. K. (2007). Enterohemorrhagic Escherichia coli O157:H7 gal mutants are sensitive to bacteriophage P1 and defective in intestinal colonization. Infect. Immun. 75, 1661–1666. doi: 10.1128/IAI.01342-06
Hu, X., Yu, Y., Hou, W., Zhou, J., and Song, L. (2013). Effects of particle size and pH value on the hydrophilicity of graphene oxide. Appl. Surf. Sci. 273, 118–121. doi: 10.1016/j.apsusc.2013.01.201
Huang, X., Zeng, Z., and Zhang, H. (2013). Metal dichalcogenide nanosheets: preparation, properties and applications. Chem. Soc. Rev. 42, 1934–1946. doi: 10.1039/c2cs35387c
Hwang, G., Ahn, I., Mhin, B. J., and Kim, J. (2012). Adhesion of nano-sized particles to the surface of bacteria: mechanistic study with the extended DLVO theory. Coll. Surf. B Biointerf. 97, 138–144. doi: 10.1016/j.colsurfb.2012.04.031
Kang, X., Wang, J., Wu, H., Liu, J., Aksay, I. A., and Lin, Y. (2010). A graphene-based electrochemical sensor for sensitive detection of paracetamol. Talanta 81, 754–759. doi: 10.1016/j.talanta.2010.01.009
Kaur, J., Gravagnuolo, A. M., Maddalena, P., Altucci, C., Giardina, P., and Gesuele, F. (2017a). Green synthesis of luminescent and defect-free bio-nanosheets of MoS2: interfacing twodimensional crystals with hydrophobins. RSC Adv. 7, 22400–22408. doi: 10.1039/C7RA01680H
Kaur, J., Vergara, A., Rossi, M., Gravagnuolo, A. M., Valadan, M., Corrado, F., et al. (2017b). Electrostatically driven scalable synthesis of MoS2-graphene hybrid films assisted by hydrophobins. RSC Adv. 7, 50166–50175. doi: 10.1039/C7RA09878B
Kaur, J., Singh, M., Dell‘Aversana, C., Benedetti, R., Giardina, P., and Manuela, Rossi, et al. (2018). Biological interactions of biocompatible and water-dispersed MoS2 nanosheets with bacteria and human cells. Sci. Rep. 8:16386. doi: 10.1038/s41598-018-34679-y
Kaushik, V., Wu, S., Jang, H., Kang, J., Kim, K., and Suk, J. W. (2018). Scalable exfoliation of bulk MoS2 to single-and few-layers using toroidal taylor vortices. Nanomaterials 8:587. doi: 10.3390/nano8080587
Klukova, L. J. F., Belicky, S., Vikartovska, A., and Tkac, J. (2016). Graphene oxide-based electrochemical label-free detection of glycoproteins down to aM level using a lectin biosensor. Analyst 141, 4278–4282. doi: 10.1039/C6AN00793G
Kong, D., Cha, J. J., Wang, H., Lee, H. R., and Cui, Y. (2013). First-row transition metal dichalcogenide catalysts for hydrogen evolution reaction. Energy Environ. Sci. 6, 3553–3558. doi: 10.1039/c3ee42413h
Lai, Q., Zhu, S., Luo, X., Zou, M., and Huang, S. (2012). Ultraviolet-visible spectroscopy of graphene oxides. AIP Adv. 2:032146. doi: 10.1063/1.4747817
Laquerre, S., Anderson, D. B., Argnani, R., and Glorioso, J. C. (1998). Herpes simplex virus type 1 glycoprotein B requires a cysteine residue at position 633 for folding, processing, and incorporation into mature infectious virus particles. J. Virol. 72, 4940–4949. doi: 10.1128/JVI.72.6.4940-4949.1998
Late, D. J., Liu, B., Matte, H. S. S. R., Dravid, V. P., and Rao, C. N. R. (2012). Hysteresis in single-layer MoS 2 field effect transistors. ACS Nano 6, 5635–5641. doi: 10.1021/nn301572c
Liu, K. K., Zhang, W., Lee, Y. H., Lin, Y. C., Chang, M. T., Su, C. Y., et al. (2012). Growth of large-area and highly crystalline MoS 2 thin layers on insulating substrates. Nano Lett. 12, 1538–1544. doi: 10.1021/nl2043612
Liu, S., Hu, M., Zeng, T. H., Wu, R., Jiang, R., Wei, J., et al. (2012). Lateral dimension-dependent antibacterial activity of graphene oxide sheets. Langmuir 8, 12364–12372. doi: 10.1021/la3023908
Lovering, A. L., Safadi, S. S., and Strynadka, N. C. J. (2012). Structural perspective of peptidoglycan biosynthesis and assembly. Annu. Rev. Biochem. 81, 451–478. doi: 10.1146/annurev-biochem-061809-112742
Malanovic, N., and Lohner, K. (2016). Gram-positive bacterial cell envelopes: the impact on the activity of antimicrobial peptides. Biochim. Biophys. Acta Biomemb. 1858, 936–946. doi: 10.1016/j.bbamem.2015.11.004
Maurer, J. J., Schmidt, D., Petrosko, P., Sanchez, S., Bolton, L., and Lee, M. D. (1999). Development of primers to O-antigen biosynthesis genes for specific detection of Escherichia coli O157 by PCR. Appl. Environ. Microbiol. 65, 2954–2960. doi: 10.1128/AEM.65.7.2954-2960.1999
Mohona, T. M., Gupta, A., Masud, A., Chien, S., Lin, L., Nalam, P. C., et al. (2019). Aggregation behavior of inorganic 2D nanomaterials beyond graphene: insights from molecular modeling and modified DLVO theory. Environ. Sci. Technol. 53, 4161–4172. doi: 10.1021/acs.est.8b05180
Morales-Narváez, E., Baptista-Pires, L., Zamora-Gálvez, A., and Merkoçi, A. (2017). Graphene-based biosensors: going simple. Adv. Mater. 29:1604905. doi: 10.1002/adma.201604905
Morales-Narváez, E., Naghdi, T., Zor, E., and Merkoçi, A. (2015). Photoluminescent lateral-flow immunoassay revealed by graphene oxide: highly sensitive paper-based pathogen detection. Analyt. Chem. 87, 8573–8577. doi: 10.1021/acs.analchem.5b02383
Nicolosi, V., Chhowalla, M., Kanatzidis, M. G., Strano, M. S., and Coleman, J. N. (2013). Liquid exfoliation of layered materials. Science 340, 1226419–1226419. doi: 10.1126/science.1226419
Oh, J. K., Yegin, Y., Yang, F., Zhang, M., Li, J., Shifeng Huang, S., et al. (2018). The influence of surface chemistry on the kinetics and thermodynamics of bacterial adhesion. Sci. Rep. 8:17247. doi: 10.1038/s41598-018-35343-1
Ohshima, H. (2014). “Interaction of colloidal particles,” in Colloid and Interface Science in Pharmaceutical Research and Development, ed. H. Ohshima (Amsterdam: Elsevier), 1–28. doi: 10.1016/B978-0-444-62614-1.00001-6
Ottaviano, L., Palleschi, S., Perrozzi, F., D’Olimpio, G., Priante, F., Donarelli, M., et al. (2017). Mechanical exfoliation and layer number identification of MoS2 revisited. 2D Mater. 4:045013. doi: 10.1088/2053-1583/aa8764
Pajerski, W., Ochonska, D., Brzychczy-Wloch, M., Indyka, P., Jarosz, M., Golda-Cepa, M., et al. (2019). Attachment efficiency of gold nanoparticles by Gram-positive and Gram-negative bacterial strains governed by surface charges. J. Nanopart. Res. 21:186. doi: 10.1007/s11051-019-4617-z
Palmieri, V., Bugli, F., Lauriola, M. C., Cacaci, M., Torelli, R., Ciasca, G., et al. (2017). Bacteria Meet graphene: modulation of graphene oxide nanosheet interaction with human pathogens for effective antimicrobial therapy. ACS Biomater. Sci. Eng. 3, 619–627. doi: 10.1021/acsbiomaterials.6b00812
Pan, L., Liu, Y. T., Xie, X. M., and Ye, X. Y. (2016). Facile and green production of impurity-free aqueous solutions of WS2 nanosheets by direct exfoliation in water. Small 12, 6703–6713. doi: 10.1002/smll.201601804
Patchkovskii, S., Tse, J. S., Yurchenko, S. N., Zhechkov, L., Heine, T., and Seifert, G. (2005). Graphene nanostructures as tunable storage media for molecular hydrogen. Proc. Natl. Acad. Sci. U.S.A. 102, 10439–10444. doi: 10.1073/pnas.0501030102
Qi, Y., Wang, N., Xu, Q., Li, H., Zhou, P., Lu, X., et al. (2015). A green route to fabricate MoS2 nanosheets in water-ethanol-CO2. Chem. Commun. 51, 6726–6729. doi: 10.1039/C5CC00106D
Qu, F., Liu, Y., Kong, R., and You, J. (2017). A versatile DNA detection scheme based on the quenching of fluorescent silver nanoclusters by MoS2 nanosheets: application to aptamer-based determination of hepatitis B virus and of dopamine. Microchim. Acta 184, 4417–4424. doi: 10.1007/s00604-017-2486-7
Quinn, M. D. J., Ho, N. H., and Notley, S. M. (2013). Aqueous dispersions of exfoliated molybdenum disulfide for use in visible-light photocatalysis. ACS Appl. Mater. Interf. 5, 12751–12756. doi: 10.1021/am404161k
Ramanathan, T., Abdala, A. A., Stankovich, S., Dikin, D. A., Herrera-Alonso, M., Piner, R. D., et al. (2008). Functionalized graphene sheets for polymer nanocomposites. Nat. Nanotechnol. 3, 327–331. doi: 10.1038/nnano.2008.96
Rathinam, N. K., Saravanan, C., Parimal, P., Perumal, V., and Perumal, M. (2014). Molecular interactions of graphene with HIV-Vpr, Nef and gag proteins: a new approach for treating HIV infections. Korea. J. Chem. Eng. 31, 744–747. doi: 10.1007/s11814-014-0049-8
Rodriguez, C. L. C., Muñoz, P. A. R., Donato, K. Z., Seixas, L., Donato, R. K., and Fechine, G. J. M. (2020). Understanding the unorthodox stabilization of liquid phase exfoliated molybdenum disulfide (MoS2) in water medium. Phys. Chem. Chem. Phys. 22, 1457–1465. doi: 10.1039/C9CP06422B
Romaniuk, J. A. H., and Cegelski, L. (2015). Bacterial cell wall composition and the influence of antibiotics by cell-wall and whole-cell NMR. Philos. Trans. R. Soc. B Biol. Sci. 370:20150024. doi: 10.1098/rstb.2015.0024
Romero-Vargas Castrillón, S., Perreault, F., De Faria, A. F., and Elimelech, M. (2015). Interaction of graphene oxide with bacterial cell membranes: insights from force spectroscopy. Environ. Sci. Technol. Lett. 2, 112–117. doi: 10.1021/acs.estlett.5b00066
Roy, S., Mondal, A., Yadav, V., Sarkar, A., Banerjee, R., Sanpui, P., et al. (2019). Mechanistic insight into the antibacterial activity of chitosan exfoliated MoS2 nanosheets: membrane damage, metabolic inactivation, and oxidative stress. ACS Appl. Biol. Mater. 2, 2738–2755. doi: 10.1021/acsabm.9b00124
Sametband, M., Kalt, I., Gedanken, A., and Sarid, R. (2014). Herpes simplex virus type-1 attachment inhibition by functionalized graphene oxide. ACS Appl. Mater. Interf. 6, 1228–1235. doi: 10.1021/am405040z
Santos, H. M., Lodeiro, C., and Capelo-Martínez, J. L. (2009). “The power of ultrasound,” in Ultrasound in Chemistry: Analytical Applications, eds H. M. Santos, C. Lodeiro, and J. L. C. Martínez (Weinheim: Wiley-VCH Verlag GmbH & Co. KGaA), 1–16. doi: 10.1002/9783527623501.ch1
Schedin, F., Geim, A. K., Morozov, S. V., Hill, E. W., Blake, P., Katsnelson, M. I., et al. (2007). Detection of individual gas molecules adsorbed on graphene. Nat. Mater. 6, 652–655. doi: 10.1038/nmat1967
Song, Z., Wang, X., Zhu, G., Nian, Q., Zhou, H., Yang, D., et al. (2015). Virus capture and destruction by label-free graphene oxide for detection and disinfection applications. Small 11, 1771–1776. doi: 10.1002/smll.201401706
Stelitano, D., Franci, G., Chianese, A., Galdiero, S., Morelli, G., and Galdiero, M. (2019). “HSV membrane glycoproteins, their function in viral entry and their use in vaccine studies,” in Amino Acids, Peptides and Proteins, eds D. Stelitano, G. Franci, A. Chianese, S. Galdiero, G. Morelli, and M. Galdiero (Cham: Springer), 14–43. doi: 10.1039/9781788013857-00014
Sun, W., and Wu, F. G. (2018). Two-dimensional materials for antimicrobial applications: graphene materials and beyond. Chem. Asian J. 13, 3378–3410. doi: 10.1002/asia.201800851
Szabo, T., Maroni, P., and Szilagyi, I. (2020). Size-dependent aggregation of graphene oxide. Carbon (Elsevier Ltd) 160, 145–155. doi: 10.1016/j.carbon.2020.01.022
Tang, K., Wang, L., Geng, H., Qiu, J., Cao, H., and Liu, X. (2020). Molybdenum disulfide (MoS2) nanosheets vertically coated on titanium for disinfection in the dark. Arab. J. Chem. 13, 1612–1623. doi: 10.1016/j.arabjc.2017.12.013
Thwala, J. M., Li, M., Wong, M. C. Y., Kang, S., Hoek, E. M. V., and Mamba, B. B. (2013). Bacteria-polymeric membrane interactions: atomic force microscopy and XDLVO predictions. Langmuir 29, 13773–13782. doi: 10.1021/la402749y
Varrla, E., Backes, C., Paton, K. R., Harvey, A., Gholamvand, Z., McCauley, J., et al. (2015). Large-scale production of size-controlled MoS2 nanosheets by shear exfoliation. Chem. Mater. 27, 1129–1139. doi: 10.1021/cm5044864
Wang, F., Shifa, T. A., Zhan, X., Huang, Y., Liu, K., Cheng, Z., et al. (2015). Recent advances in transition-metal dichalcogenide based nanomaterials for water splitting. Nanoscale 7, 19764–19788. doi: 10.1039/C5NR06718A
Wu, N., Yu, Y., Li, T., Ji, X., Jiang, L., Zong, J., et al. (2016). Investigating the influence of MoS2 nanosheets on E. coli from metabolomics level. Edited by Yogendra kumar mishra. PLoS One 11:e0167245. doi: 10.1371/journal.pone.0167245
Wu, R., Ou, X., Tian, R., Zhang, J., Jin, H., Dong, M., et al. (2018). Membrane destruction and phospholipid extraction by using two-dimensional MoS2 nanosheets. Nanoscale 10, 20162–20170. doi: 10.1039/C8NR04207A
Xing, J., Weng, L., Yuan, B., Wang, Z., Jia, L., Jin, R., et al. (2016). Identification of a role for TRIM29 in the control of innate immunity in the respiratory tract. Nat. Immunol. 17, 1479–1479. doi: 10.1038/ni1216-1479a
Xing, J., Zhang, A., Zhang, H., Wang, J., Li, X. C., Zeng, M. S., et al. (2017). TRIM29 promotes DNA virus infections by inhibiting innate immune response. Nat. Commun. 8:945. doi: 10.1038/s41467-017-00101-w
Yang, X. X., Li, C. M., Li, Y. F., Wang, J., and Huang, C. Z. (2017). Synergistic antiviral effect of curcumin functionalized graphene oxide against respiratory syncytial virus infection. Nanoscale 9, 16086–16092. doi: 10.1039/C7NR06520E
Yao, Y., Tolentino, L., Yang, Z., Song, X., Zhang, W., Chen, Y., et al. (2013). High-concentration aqueous dispersions of MoS2. Adv. Funct. Mater. 23, 3577–3583. doi: 10.1002/adfm.201201843
Ye, S., Shao, K., Li, Z., Guo, N., Zuo, Y., Li, Q., et al. (2015). Antiviral activity of graphene oxide: how sharp edged structure and charge matter. ACS Appl. Mater. Interf. 7, 21578–21579. doi: 10.1021/acsami.5b06876
Yu, F., Liu, Q., Gan, X., Hu, M., Zhang, T., Li, C., et al. (2017). Ultrasensitive pressure detection of few-layer MoS 2. Adv. Mater. 29:1603266. doi: 10.1002/adma.201603266
Yun, Q., Lu, Q., Zhang, X., Tan, C., and Zhang, H. (2018). Three-dimensional architectures constructed from transition-metal dichalcogenide nanomaterials for electrochemical energy storage and conversion. Angew. Chem. Intern. Edn. 57, 626–646. doi: 10.1002/anie.201706426
Yuwen, L., Sun, Y., Tan, G., Xiu, W., Zhang, Y., Weng, L., et al. (2018). MoS2@polydopamine-Ag nanosheets with enhanced antibacterial activity for effective treatment of: Staphylococcus aureus biofilms and wound infection. Nanoscale 10, 16711–16720. doi: 10.1039/C8NR04111C
Zeng, Z., Wang, Y., Zhou, Q., Yang, K., and Lin, D. (2019). New insight into the aggregation of graphene oxide in synthetic surface water: carbonate nanoparticle formation on graphene oxide. Environ. Pollut. 250, 366–374. doi: 10.1016/j.envpol.2019.03.112
Zeng, Z., Yin, Z., Huang, X., Li, H., He, Q., Lu, G., et al. (2011). Single-layer semiconducting nanosheets: high-yield preparation and device fabrication. Angew. Chem. Intern. Edn. 50, 11093–11097. doi: 10.1002/anie.201106004
Zhang, C., Hu, D. F., Xu, J. W., Ma, M. Q., Xing, H., Yao, K., et al. (2018). Polyphenol-Assisted exfoliation of transition metal dichalcogenides into nanosheets as photothermal nanocarriers for enhanced antibiofilm activity. ACS Nano 12, 12347–12356. doi: 10.1021/acsnano.8b06321
Zhang, W., Mou, Z., Wang, Y., Chen, Y., Yang, E., Guo, F., et al. (2019). Molybdenum disulfide nanosheets loaded with chitosan and silver nanoparticles effective antifungal activities: in vitro and in vivo. Mater. Sci. Eng. C 97, 486–497. doi: 10.1016/j.msec.2018.12.052
Zhang, W., Shi, S., Wang, Y., Yu, S., Zhu, W., Zhang, X., et al. (2016). Versatile molybdenum disulfide based antibacterial composites for: in vitro enhanced sterilization and in vivo focal infection therapy. Nanoscale 8, 11642–11648. doi: 10.1039/C6NR01243D
Zhang, X., Zhang, W., Liu, L., Yang, M., Huang, L., Chen, K., et al. (2017). Antibiotic-loaded MoS 2 nanosheets to combat bacterial resistance via biofilm inhibition. Nanotechnology 28:225101. doi: 10.1088/1361-6528/aa6c9b
Keywords: 2D materials, biocompatibility, antibacterial, antivirals, DLVO, E. coli, S. aureus, HSV-1 virus
Citation: Singh M, Zannella C, Folliero V, Di Girolamo R, Bajardi F, Chianese A, Altucci L, Damasco A, Del Sorbo MR, Imperatore C, Rossi M, Valadan M, Varra M, Vergara A, Franci G, Galdiero M and Altucci C (2020) Combating Actions of Green 2D-Materials on Gram Positive and Negative Bacteria and Enveloped Viruses. Front. Bioeng. Biotechnol. 8:569967. doi: 10.3389/fbioe.2020.569967
Received: 05 June 2020; Accepted: 17 August 2020;
Published: 28 September 2020.
Edited by:
Eden Morales-Narváez, Centro de Investigaciones en Optica, MexicoReviewed by:
Angello Retamal-Diaz, Universidad de Antofagasta, ChileCopyright © 2020 Singh, Zannella, Folliero, Di Girolamo, Bajardi, Chianese, Altucci, Damasco, Del Sorbo, Imperatore, Rossi, Valadan, Varra, Vergara, Franci, Galdiero and Altucci. This is an open-access article distributed under the terms of the Creative Commons Attribution License (CC BY). The use, distribution or reproduction in other forums is permitted, provided the original author(s) and the copyright owner(s) are credited and that the original publication in this journal is cited, in accordance with accepted academic practice. No use, distribution or reproduction is permitted which does not comply with these terms.
*Correspondence: Massimiliano Galdiero, bWFzc2ltaWxpYW5vLmdhbGRpZXJvQHVuaWNhbXBhbmlhLml0; Carlo Altucci, Y2FsdHVjY2lAdW5pbmEuaXQ=; Y2FybG8uYWx0dWNjaUB1bmluYS5pdA==
†These authors have contributed equally to this work
Disclaimer: All claims expressed in this article are solely those of the authors and do not necessarily represent those of their affiliated organizations, or those of the publisher, the editors and the reviewers. Any product that may be evaluated in this article or claim that may be made by its manufacturer is not guaranteed or endorsed by the publisher.
Research integrity at Frontiers
Learn more about the work of our research integrity team to safeguard the quality of each article we publish.