- 1Joint Engineering Research Center for Health Big Data Intelligent Analysis Technology, Shenzhen Institutes of Advanced Technology, Chinese Academy of Sciences, Shenzhen, China
- 2Shenzhen College of Advanced Technology, University of Chinese Academy of Sciences, Shenzhen, China
- 3Department of Neurology and Stroke Center, The First Affiliated Hospital of Jinan University, Guangzhou, China
- 4Clinical Neuroscience Institute, The First Affiliated Hospital of Jinan University, Guangzhou, China
Due to the cost and complexity of biological experiments, many computational methods have been proposed to predict potential miRNA-disease associations by utilizing known miRNA-disease associations and other related information. However, there are some challenges for these computational methods. First, the relationships between miRNAs and diseases are complex. The computational network should consider the local and global influence of neighborhoods from the network. Furthermore, predicting disease-related miRNAs without any known associations is also very important. This study presents a new computational method that constructs a heterogeneous network composed of a miRNA similarity network, disease similarity network, and known miRNA-disease association network. The miRNA similarity considers the miRNAs and their possible families and clusters. The information of each node in heterogeneous network is obtained by aggregating neighborhood information with graph convolutional networks (GCNs), which can pass the information of a node to its intermediate and distant neighbors. Disease-related miRNAs with no known associations can be predicted with the reconstructed heterogeneous matrix. We apply 5-fold cross-validation, leave-one-disease-out cross-validation, and global and local leave-one-out cross-validation to evaluate our method. The corresponding areas under the curves (AUCs) are 0.9616, 0.9946, 0.9656, and 0.9532, confirming that our approach significantly outperforms the state-of-the-art methods. Case studies show that this approach can effectively predict new diseases without any known miRNAs.
1. Introduction
MicroRNAs (miRNAs) are a class of short non-coding single-stranded RNA molecules (22 nt) encoded by endogenous genes (Ambros, 2001). Studies have shown that miRNAs are involved in the emergence and development of various human diseases (Alvarez-Garcia and Miska, 2005; Jopling et al., 2005). Therefore, finding the associations between miRNAs and diseases could contribute to pathological classifications, individualized diagnoses, and disease treatments. However, experimental methods for identifying associations between miRNAs and diseases are expensive and time-consuming. Therefore, computational methods have drawn wide attention to reveal potential associations between miRNAs and diseases.
Based on the known miRNA-disease associations, a number of computational methods have been proposed to predict candidate miRNAs for diseases. These methods cover three main categories: network algorithms, machine learning, and matrix-based methods.
Jiang et al. (2010) proposed the first computational method, which integrated a miRNA functional similarity network, disease phenotype similarity, known disease-miRNA association network and discrete probability distribution named the hypergeometric distribution to predict the potential associations. Xuan et al. (2013) developed a model named HDMP. The miRNA functional similarity was calculated according to disease terms and the disease phenotype similarity. HDMP could not predict candidate miRNAs for new diseases without any known associated miRNAs, however. Both methods considered only local neighbor similarity information of each miRNA, so they did not achieve satisfactory performance. To make full use of network information, Chen et al. (2012) developed the global network method RWRMDA that implemented random walks on a miRNA functional similarity network. However, this model could not address new diseases associated with no miRNAs. Many other models have incorporated complex interaction networks to present the relationship between miRNA and disease. For example, Mørk et al. (2014) proposed a model of miRNA-protein-disease (miRPD) association prediction with proteins as mediators. The authors verified the associations between miRNAs and diseases by integrating both miRNA-protein and protein-disease associations.
Recently, some machine-learning-based models were also developed to predict potential miRNA-disease associations. Based on the K-nearest-neighbor approach for miRNAs and diseases, RKNNMDA (Chen et al., 2017) was used to rank K-nearest neighbors with SVMs and utilized weighted voting for each predicted miRNA-disease association. Zhao et al. (2019) developed a novel model of adaptive boosting for miRNA-disease association prediction (ABMDA). They used a decision tree as a weak classifier and combined weak classifiers, which could score samples to form a strong classifier based on corresponding weights.
Based on the information of known miRNA-disease associations and the similarity matrix, an inductive matrix completion algorithm was used to complete the missing entries of a known miRNA-disease association matrix. Li et al. (2017) released a method of matrix completion for an miRNA-disease association prediction model (MCMDA), which updated the adjacency matrix of known miRNA-disease association networks using matrix completion algorithms. Chen et al. (2018) also developed a model of inductive matrix completion for miRNA-disease association prediction (IMCMDA).
The methods of the three categories mentioned above have their own strengths and limitations. Combining the network algorithm, machine learning and matrix completion, we developed a matrix completion method based on graph convolutional networks for miRNA-disease association prediction. First, we constructed a heterogeneous network by integrating the miRNA similarity network, disease similarity network and known miRNA-disease associations. Inspired by Wan et al. (2019), we then obtained new node embedding by aggregating neighborhood information derived from the heterogeneous network based on graph convolutional operations, which can pass the information of a node to its intermediate and distant neighbors. To the largest extent, to preserve the topological information of the heterogeneous network, the loss function of reconstructing the entire heterogeneous network (matrix) was minimized during the training process. Finally, by comparing the reconstructed and original matrices, we discovered novel miRNA-disease associations. To evaluate the effectiveness of the proposed method, we implemented 5-fold cross-validation, leave-one-disease-out cross-validation (LODOCV), and global and local leave-one-out cross-validation (LOOCV) and obtained AUCs of 0.9616, 0.9946, 0.9656, and 0.9532, respectively. Furthermore, two types of case studies were carried out. As a result, most of the predicted miRNAs were confirmed by related databases. In conclusion, the proposed method can effectively predict potential miRNA-disease associations.
2. Materials and Methods
2.1. MiRNA-Disease Network
To construct the known miRNA-disease network, we downloaded the verified miRNA-disease associations from the HMDD database (Li et al., 2014). We used an adjacency matrix RD to describe the network. The element RD(i, j) is 1 if miRNA mi is associated with disease dj and 0 otherwise. We obtained 6,441 associations between 577 miRNAs and 336 diseases after duplicates were removed.
2.2. Disease Functional Similarity Network
Similar diseases have a great probability of being regulated by similar genes. Therefore, we constructed a disease similarity network based on the gene functional information. The data can be downloaded from the HumanNet database (Li et al., 2011), which contains an associated log-likelihood score (LLS) of each interaction between two genes or gene sets. The similarity DS(i, j) between diseases di and dj can be calculated as follows:
where S(di) represents the gene sets related to disease di; |S(di)| represents the cardinalities of S(di); and LLS(x, S(dj)) is the LLS between gene x and gene set S(dj).
2.3. MiRNA Similarity Network
MiRNA families feature a common sequence or structure configuration in sets of genes (Kaczkowski et al., 2009). The miRNA cluster is a set of two or more miRNAs that are transcribed from physically adjacent miRNA genes. MiRNAs belonging to the same family or cluster are expected to have similar functions and thus be associated with the same diseases. Therefore, we constructed a miRNA similarity network by combining verified miRNA-target associations, family information, cluster information, and verified miRNA-disease associations. In this process, first, the verified miRNA-target associations is downloaded from miRTarBase (Hsu et al., 2014). Two miRNAs are connected if they share common targets. The element value of RST (miRNA similarity based on target) represents the number of shared targets between miRNAs. Then, we can obtain the family information of miRNAs from miRBase (Griffiths-Jones et al., 2003). If two miRNAs belong to the same miRNA family, we set their RSF (miRNA similarity based on family) value to 1; otherwise, we set it to 0. Third, the miRNA cluster information is accessible in miRBase (Kozomara and Griffiths-Jones, 2014). If two miRNAs belong to the same cluster, then the RSC (miRNA similarity based on cluster) value is set to 1. Finally, we utilize MISIM, a miRNA similarity network based on verified miRNA-disease associations, to define RSD (miRNA similarity based on disease). Once the data are prepared, we combine the four matrices to calculate the similarity RS(i, j) between miRNA ri and miRNA rj:
where α = 0.2, β = 0.1, γ = 0.2, and θ = 0.5 are described as in the work (Zeng et al., 2018).
2.4. Heterogeneous Graph Convolutional Networks
2.4.1. Heterogeneous Network Construction
As shown in Figure 1, we constructed a heterogeneous network based on the miRNA similarity network RS, disease similarity network DS, and miRNA-disease network RD. The heterogeneous network can be represented as follows:
where N is the node set that contains two kinds of nodes NT = {miRNA, disease} , and E is the edge set ET = {miRNA-miRNA, miRNA-disease, disease-disease}. The three kinds of edges and their weights are described as miRNA similarity network, miRNA-disease network, and disease functional similarity network, respectively. For s ∈ ET and network As ∈ {RS, RD, DS}, normalization is first implemented before further processing as follows:
where Col(As) is the size of the As column dimension and As(i, j) is the element in the ith line and jth column.
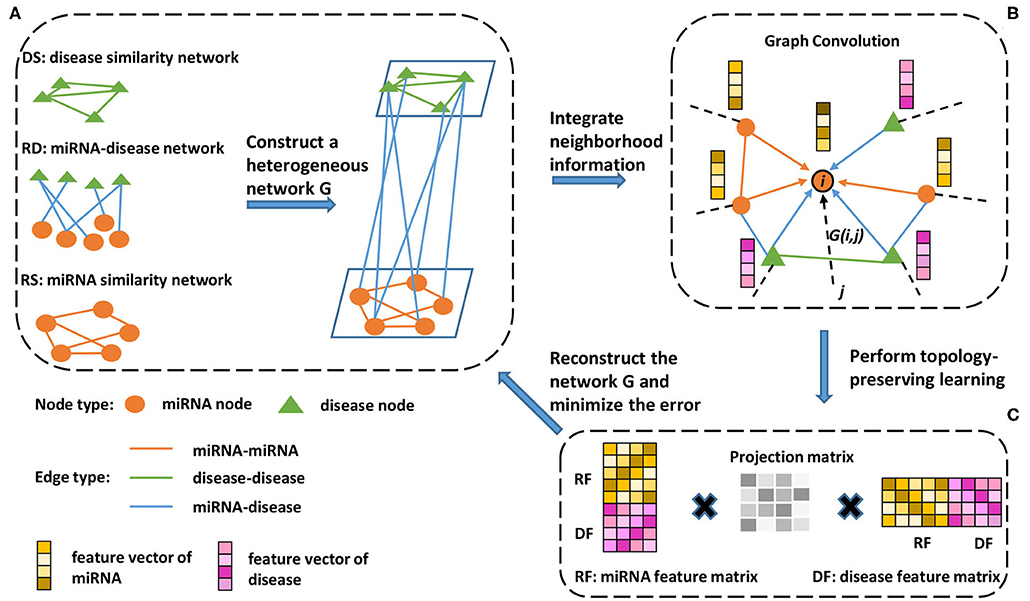
Figure 1. Schematic workflow of the proposed method. (A) A miRNA similarity network, disease similarity network, and miRNA-disease association network are used to construct a heterogeneous network. (B) To extract information from the neighborhood, a neighborhood information aggregation operation (Formula 5) is applied on every node. Then, each node updates its feature representation by concatenating its current representation with the aggregated information (Formula 6). (C) A feature matrix is constructed, each row of which is a new node feature representation (Formula 7). Then, the feature matrix is used to reconstruct the heterogeneous network, and topology-preserving learning is implemented by minimizing the reconstructed error (Formula 8).
2.4.2. Neighborhood Information Aggregation
To take full advantage of the heterogeneous network information, we adopted the neighborhood information aggregation strategy. First, an initial node embedding function f:N → Rd maps each node u to its d-dimensional vector representation f(u). In our experiment, d is equal to 1024, and f is a function that outputs random values from a truncated normal distribution. Then, the neighborhood information aggregation can be defined as:
where and are the parameters trained in the neural network. In addition, σ(·) is the activation function in the neural network, and we used the RELU function here. Based on the graph convolutional operation, we pass the information of a node to its intermediate and distant neighbors and therefore realize the implicit influence among nodes on the network level.
2.4.3. Updating the Node Embedding
Obtaining the aggregated neighbor information au, the process of updating the node embedding can be defined as:
where f1(u) is a new node embedding, W1 ∈ Rd × 2d is the weights, b1 ∈ Rd is the bias and || · ||2 is the l2 norm.
2.4.4. Topology-Preserving Learning
Considering the same importance of preserving the known miRNA similarity (RS), disease similarity (DS) and miRNA-disease association (RD), we share all the parameters among these three subnetworks and minimize the loss function of reconstructing the entire heterogeneous network during the training process, as shown in Figure 1C. First, we use RF ∈ Rm × d and DF ∈ Rn × d to represent the feature matrix of miRNA and disease, respectively, where each row of the feature matrix represents a new node embedding f1(u), m is the number of miRNA nodes, n is the number of disease nodes and d is the dimension of new node embedding. Then, topology-preserving learning of the node embedding can be defined as:
where P ∈ Rd × k and H ∈ Rk × d are projection matrices used to extract the principle features from node representations, and G is the graph constructed in Equation (3). We set k to 512 in our experiment. The unknown parameters can be trained in an end-to-end manner by performing gradient descent to minimize the total squared reconstruction error. In the training phase, we iterate 2,000 epochs to establish the optimal parameters with the minimum error value.
2.5. Interaction Probability Between MiRNA and Disease
Finally, the predicted interaction probability between miRNAs and diseases can be obtained from the reconstructed heterogeneous network as follows:
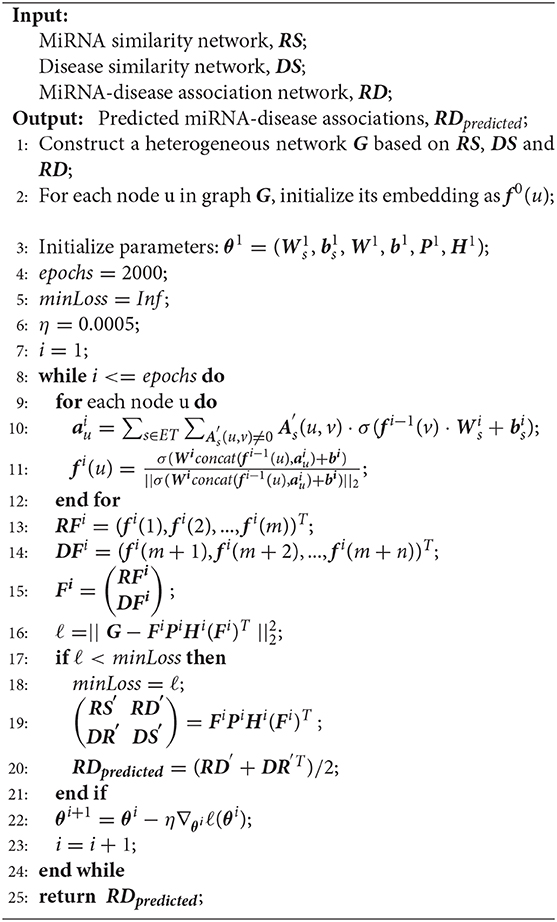
By comparing the reconstructed RDpredicted and the original RD matrix, we can discover potential miRNA-disease associations. The prediction procedure is summarized in Algorithm 1. The code and data can be obtained online1.
2.6. Baseline Methods
We choose the following state-of-the-art methods as our baseline methods:
1) MiRNA-disease association prediction based on matrix completion and label propagation (MCLPMDA): Yu et al. (2019) proposed a novel method named MCLPMDA. This method first reconstructs a similarity matrix of miRNA and disease by a matrix completion algorithm based on known experimentally verified miRNA-disease associations and then utilizes the label propagation algorithm to reliably predict potential disease-related miRNAs.
2) Ensemble of decision tree based MiRNA-disease association prediction (EDTMDA): Chen et al. (2019) proposed a method named EDTMDA, which innovatively builds a computational framework integrating ensemble learning and dimensionality reduction.
3) Predicting microRNA-disease associations based on sparse neighborhoods (SNMDA): Qu et al. (2018a) presented a method named SNMDA that takes advantage of the sparsity of the miRNA-disease association network and integrates the sparse information into the current similarity matrices for both miRNAs and diseases.
4) MiRNA-disease association prediction based on global linear neighborhoods (GLNMDA): Yu et al. (2018) proposed a novel method that obtains a new miRNA/disease similarity matrix by linearly reconstructing each miRNA/disease according to the known experimentally verified miRNA-disease associations and then adopts label propagation to infer the potential associations between miRNAs and diseases.
5) Predicting miRNA gene and disease relationship based on locality-constrained linear coding (LLCMDA): Qu et al. (2018b) proposed LLCMDA. This method first reconstructs similarity networks for both miRNAs and diseases using locality-constrained linear coding and then applies label propagation on the similarity networks to obtain relevant scores.
6) Path-based computational model for miRNA-disease association prediction (PBMDA): You et al. (2017) constructed a heterogeneous graph consisting of three interlinked subgraphs and further adopted a depth-first search algorithm to infer potential miRNA-disease associations.
7) Heterogeneous graph inference for miRNA-disease association prediction (HGIMDA): Chen et al. (2016) developed the computational model of HGIMDA to uncover potential miRNA-disease associations by integrating miRNA functional similarity, disease semantic similarity, Gaussian interaction profile kernel similarity, and experimentally verified miRNA-disease associations into a heterogeneous graph. HGIMDA adopts an iterative process to find the optimal solutions based on global network similarity information, which leads to superior performance over local network similarity-based methods.
3. Results
3.1. Performance Evaluation
Considering the uniqueness and limitedness of available miRNA and disease samples, we implemented LOOCV, LODOCV, and 5-fold cross-validation to evaluate the performance of our method (Jiao and Du, 2016). In each framework, we selected 5 state-of-the-art baseline models and plotted the receiver operating characteristic (ROC) curves of our method and the selected methods by calculating the false-positive rate (FPR) and true-positive rate (TPR) at varying thresholds.
LOOCV is conducted in two different ways: global and local LOOCV. In the framework of global LOOCV, one of the known miRNA-disease associations is left out in turn as a test sample, and the other known associations are regarded as training samples. All the unknown associations in the original RD matrix can be candidate samples. We ranked the predicted interaction scores of the test sample and the candidate samples. If the ranking of the test sample was higher than a threshold for a given true-positive rate (TPR), it was marked as positive. In the framework of local LOOCV, only the unknown associations of a specific disease are ranked with the test sample.
In 5-fold cross-validation, all the known miRNA-disease associations were randomly divided into five subsets. Each subset was taken as test samples in turn, and the others were considered training samples. All unknown miRNA-disease associations were considered candidate samples.
To further test the performance of our method in predicting associations for diseases without any known related miRNAs, we adopted LODOCV (Fu and Peng, 2017). In this framework, all the known miRNAs associated with a given disease were regarded as test samples.
The area under the curve (AUC) was then calculated to evaluate the performance of our method. As a result, our method obtained AUCs of 0.9656, 0.9532, and 0.9616 in global LOOCV, local LOOCV, and 5-fold cross-validation, respectively, as shown in Figure 2. The performance of our method outperformed the baseline methods. For LODOCV, our method achieved the highest AUC value of 0.9946, which proved that our method could effectively predict new associations between miRNAs and diseases. We also note that the AUC value of LODOCV was much higher than that of LOOCV. The reason may be that the test samples of LODOCV are from the known miRNA-disease associations, the predicted interaction scores of which can be higher than those of the original unknown associations.
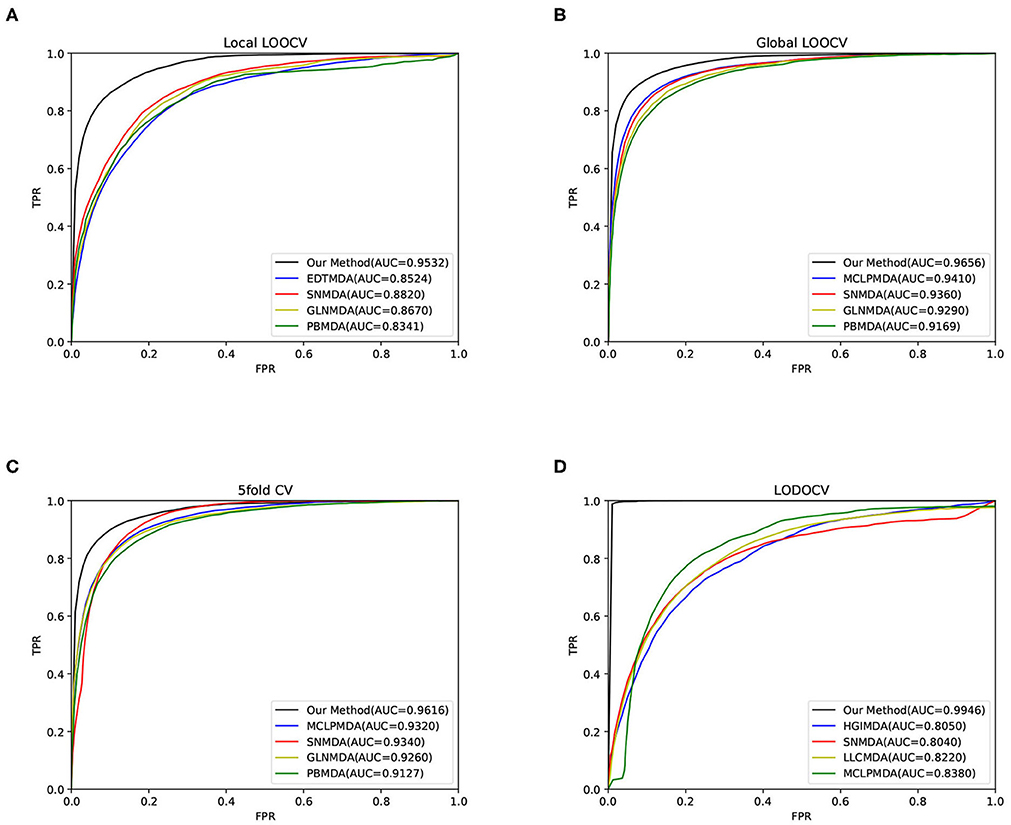
Figure 2. The results of our method and baseline methods in terms of (A) local LOOCV, (B) global LOOCV, (C) 5-fold cross-validation, and (D) LODOCV.
3.2. Case Studies
Two types of case studies were conducted to further validate the performance of the proposed method for novel miRNA-disease association prediction.
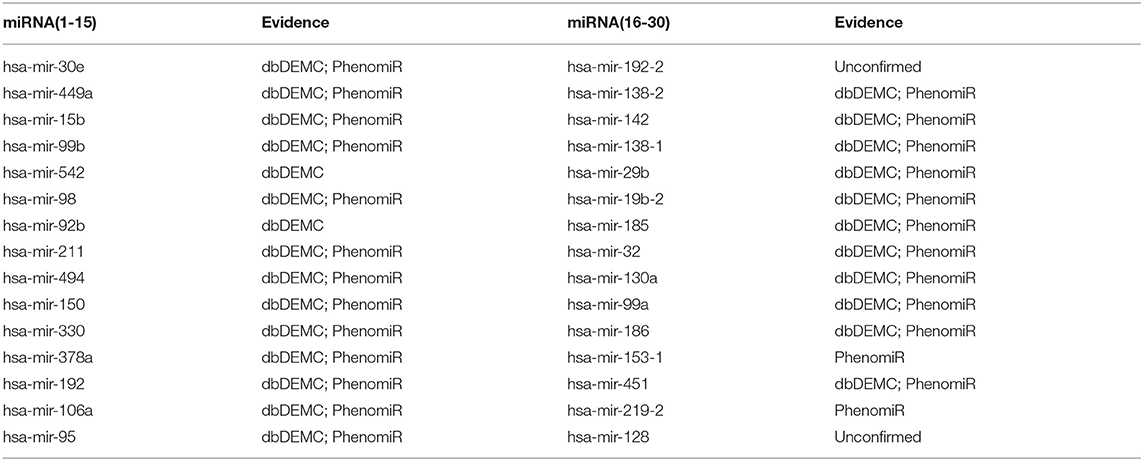
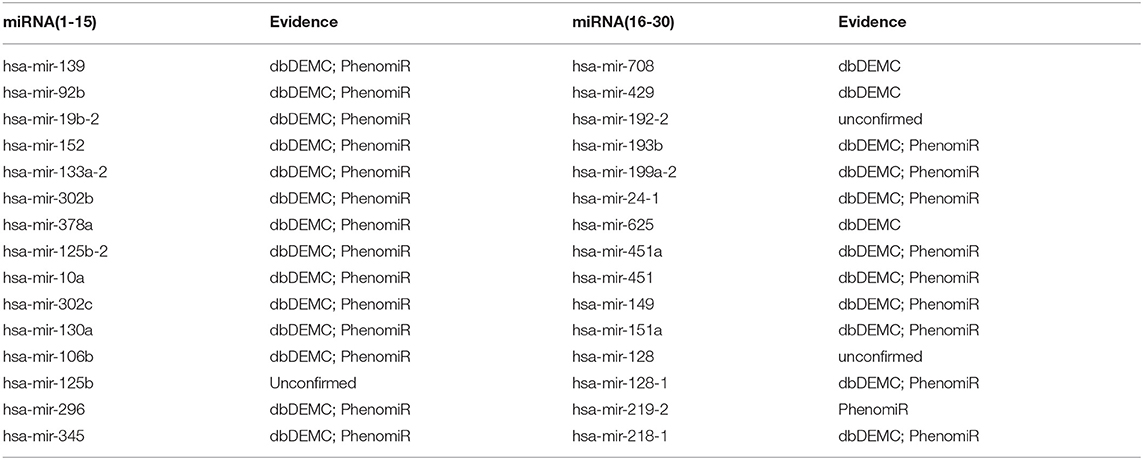
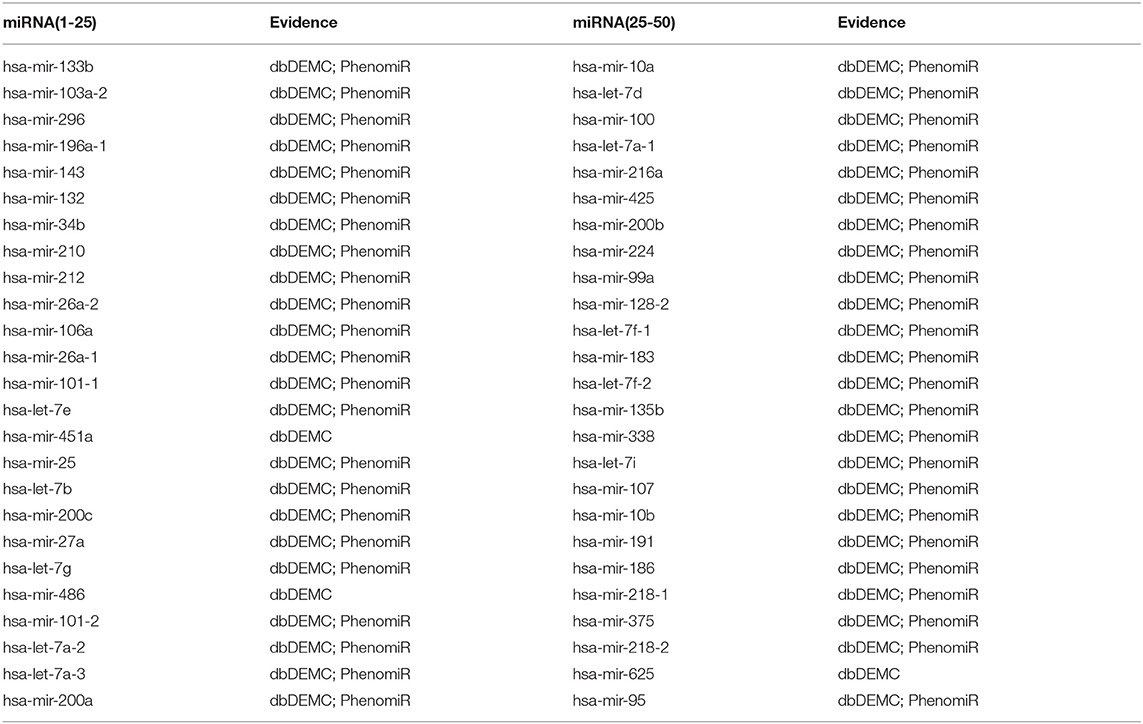
For the first type of case study, we applied the proposed method to predict novel miRNA-disease associations for three common human diseases (breast neoplasms, lung neoplasms, and prostate neoplasms) based on the known associations from HMDD. For a specific disease, known associations of all diseases were regarded as training samples, and unknown associations with this disease were regarded as candidate samples. After training the network, we ranked the prediction score of the candidate associations and selected the top 30 candidate associations with this disease. The prediction results were then verified by two databases: dbDEMC V2.0 (Yang et al., 2017) and PhenomiR (Ruepp et al., 2010). As a result, 28 out of the top 30 miRNAs were verified to be associated with breast neoplasms (Table 1), 27 out of the top 30 miRNAs were verified to be associated with lung neoplasms (Table 2), and 27 out of the top 30 miRNAs were verified to be associated with prostate neoplasms (Table 3). The results proved that our method can effectively predict potential miRNA-disease associations.
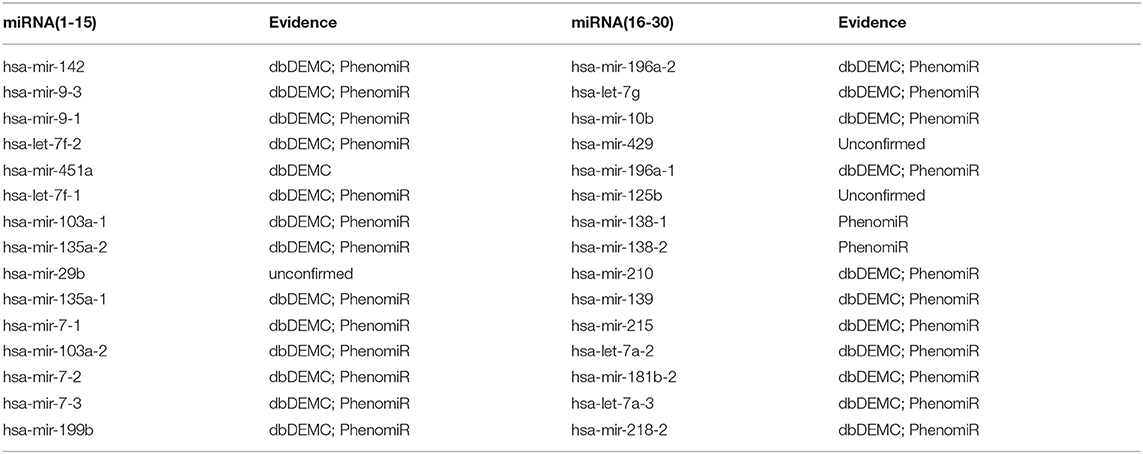
In the second case study, we evaluated the ability of the proposed method to predict new associations for diseases without any known related miRNAs. We selected pancreatic neoplasms as an example in this case study. First, we set the known associations of pancreatic neoplasms as unknown associations, and all miRNAs were considered candidate miRNAs. Then, we implemented our method to obtain the prediction scores of these candidate miRNAs associated with pancreatic neoplasms. We found that 50 out of the top 50 miRNAs were confirmed by at least one database from dbDEMC v2.0 and Phe-nomiR v2.0 (Table 4). The results demonstrate that our method can be applied to predict potential associations for disease without any known related miRNAs.
4. Discussion
In this paper, we propose a novel method to predict potential associations between miRNAs and diseases. The method constructs a heterogeneous network composed of the miRNA similarity network, disease similarity network, and known miRNA-disease association network. The miRNA similarity depends on the miRNAs and their possible families and clusters. The information of each node in this network is obtained by aggregating neighborhood information through graph convolutional networks. We compared the method with several state-of-the-art baseline methods. The method performed well in four types of cross-validations. Furthermore, two types of case studies were implemented. The results demonstrate that our proposed method is powerful in discovering potential disease-related miRNAs. In addition, the method can be used to predict the related miRNAs of diseases without any known association.
The reliable performance of the proposed method is due mainly to the following several important factors. First, we integrated useful datasets to construct a heterogeneous network. Second, the method made full use of the available information by aggregating neighborhood information derived from the heterogeneous network. Third, the parameters of the neural network were learned by minimizing the error of reconstructing the whole heterogeneous network, rather than that of just the miRNA-disease network.
However, there are still some limitations in our method. First, the datasets we used to construct the network possibly contain noise and outliers. Second, the heterogeneous network we constructed was insufficient to represent the complex relationships between miRNAs and diseases. Thus, our future research will focus on the diverse relationships between miRNAs and diseases.
Data Availability Statement
All datasets generated for this study are included in the article/Supplementary Material.
Author Contributions
RZ, YC, and HW conceived of the presented idea. RZ carried out the experiment and wrote the draft. CJ and YW helped shape the research, analysis, and manuscript. All authors discussed the results and contributed to the final manuscript.
Funding
This work has been supported by the Shenzhen Basic Research Project (JCYJ20180507182818013 and JCYJ20180703145002040) and the Strategic Priority Research Program of Chinese Academy of Sciences (XDB38050100).
Conflict of Interest
The authors declare that the research was conducted in the absence of any commercial or financial relationships that could be construed as a potential conflict of interest.
Supplementary Material
The Supplementary Material for this article can be found online at: https://www.frontiersin.org/articles/10.3389/fbioe.2020.00901/full#supplementary-material
Footnote
References
Alvarez-Garcia, I., and Miska, E. A. (2005). MicroRNA functions in animal development and human disease. Development 132, 4653–4662. doi: 10.1242/dev.02073
Ambros, V. (2001). micrornas: tiny regulators with great potential. Cell 107, 823–826. doi: 10.1016/S0092-8674(01)00616-X
Chen, X., Liu, M.-X., and Yan, G.-Y. (2012). RWRMDA: predicting novel human MicroRNA–disease associations. Mol. BioSyst. 8, 2792–2798. doi: 10.1039/c2mb25180a
Chen, X., Wang, L., Qu, J., Guan, N.-N., and Li, J.-Q. (2018). Predicting miRNA–disease association based on inductive matrix completion. Bioinformatics 34, 4256–4265. doi: 10.1093/bioinformatics/bty503
Chen, X., Wu, Q.-F., and Yan, G.-Y. (2017). RKNNMDA: ranking-based KNN for miRNA-disease association prediction. RNA Biol. 14, 952–962. doi: 10.1080/15476286.2017.1312226
Chen, X., Yan, C. C., Zhang, X., You, Z.-H., Huang, Y.-A., and Yan, G.-Y. (2016). HGIMDA: Heterogeneous graph inference for MiRNA-disease association prediction. Oncotarget 7:65257. doi: 10.18632/oncotarget.11251
Chen, X., Zhu, C.-C., and Yin, J. (2019). Ensemble of decision tree reveals potential mirna-disease associations. PLoS Comput. Biol. 15:e1007209. doi: 10.1371/journal.pcbi.1007209
Fu, L., and Peng, Q. (2017). A deep ensemble model to predict MiRNA-disease association. Sci. Rep. 7, 1–13. doi: 10.1038/s41598-017-15235-6
Griffiths-Jones, S., Bateman, A., Marshall, M., Khanna, A., and Eddy, S. R. (2003). Rfam: an RNA family database. Nucleic Acids Res. 31, 439–441. doi: 10.1093/nar/gkg006
Hsu, S.-D., Tseng, Y.-T., Shrestha, S., Lin, Y.-L., Khaleel, A., Chou, C.-H., et al. (2014). mirtarbase update 2014: an information resource for experimentally validated MiRNA-target interactions. Nucleic Acids Res. 42, D78–D85. doi: 10.1093/nar/gkt1266
Jiang, Q., Hao, Y., Wang, G., Juan, L., Zhang, T., Teng, M., et al. (2010). Prioritization of disease micrornas through a human phenome-micrornaome network. BMC Syst. Biol. 4:S2. doi: 10.1186/1752-0509-4-S1-S2
Jiao, Y., and Du, P. (2016). Performance measures in evaluating machine learning based bioinformatics predictors for classifications. Quant. Biol. 4, 320–330. doi: 10.1007/s40484-016-0081-2
Jopling, C. L., Yi, M., Lancaster, A. M., Lemon, S. M., and Sarnow, P. (2005). Modulation of hepatitis C virus RNA abundance by a liver-specific microRNA. Science 309, 1577–1581. doi: 10.1126/science.1113329
Kaczkowski, B., Torarinsson, E., Reiche, K., Havgaard, J. H., Stadler, P. F., and Gorodkin, J. (2009). Structural profiles of human MiRNA families from pairwise clustering. Bioinformatics 25, 291–294. doi: 10.1093/bioinformatics/btn628
Kozomara, A., and Griffiths-Jones, S. (2014). miRbase: annotating high confidence micrornas using deep sequencing data. Nucleic Acids Res. 42, D68–D73. doi: 10.1093/nar/gkt1181
Li, J.-Q., Rong, Z.-H., Chen, X., Yan, G.-Y., and You, Z.-H. (2017). MCMDA: Matrix completion for MiRNA-disease association prediction. Oncotarget 8:21187. doi: 10.18632/oncotarget.15061
Li, X., Wang, Q., Zheng, Y., Lv, S., Ning, S., Sun, J., et al. (2011). Prioritizing human cancer micrornas based on genes-functional consistency between microRNA and cancer. Nucleic Acids Res. 39:e153. doi: 10.1093/nar/gkr770
Li, Y., Qiu, C., Tu, J., Geng, B., Yang, J., Jiang, T., et al. (2014). HMDD v2. 0: a database for experimentally supported human microRNA and disease associations. Nucleic Acids Res. 42, D1070–D1074. doi: 10.1093/nar/gkt1023
Mørk, S., Pletscher-Frankild, S., Palleja Caro, A., Gorodkin, J., and Jensen, L. J. (2014). Protein-driven inference of miRNA–disease associations. Bioinformatics 30, 392–397. doi: 10.1093/bioinformatics/btt677
Qu, Y., Zhang, H., Liang, C., Ding, P., and Luo, J. (2018a). SNMDA: A novel method for predicting micro RNA-disease associations based on sparse neighbourhood. J. Cell. Mol. Med. 22, 5109–5120. doi: 10.1111/jcmm.13799
Qu, Y., Zhang, H., Lyu, C., and Liang, C. (2018b). LLCMDA: a novel method for predicting MiRNA gene and disease relationship based on locality-constrained linear coding. Front. Genet. 9:576. doi: 10.3389/fgene.2018.00576
Ruepp, A., Kowarsch, A., Schmidl, D., Buggenthin, F., Brauner, B., Dunger, I., et al. (2010). Phenomir: a knowledgebase for microRNA expression in diseases and biological processes. Genome Biol. 11:R6. doi: 10.1186/gb-2010-11-1-r6
Wan, F., Hong, L., Xiao, A., Jiang, T., and Zeng, J. (2019). NeoDTI: neural integration of neighbor information from a heterogeneous network for discovering new drug–target interactions. Bioinformatics 35, 104–111. doi: 10.1093/bioinformatics/bty543
Xuan, P., Han, K., Guo, M., Guo, Y., Li, J., Ding, J., et al. (2013). Prediction of microRNAs associated with human diseases based on weighted k most similar neighbors. PLoS ONE 8:e70204. doi: 10.1371/annotation/a076115e-dd8c-4da7-989d-c1174a8cd31e
Yang, Z., Wu, L., Wang, A., Tang, W., Zhao, Y., Zhao, H., et al. (2017). DBDEMC 2.0: updated database of differentially expressed mirnas in human cancers. Nucleic Acids Res. 45, D812–D818. doi: 10.1093/nar/gkw1079
You, Z.-H., Huang, Z.-A., Zhu, Z., Yan, G.-Y., Li, Z.-W., Wen, Z., et al. (2017). PBMDA: A novel and effective path-based computational model for MiRNA-disease association prediction. PLoS Comput. Biol. 13:e1005455. doi: 10.1371/journal.pcbi.1005455
Yu, S.-P., Liang, C., Xiao, Q., Li, G.-H., Ding, P.-J., and Luo, J.-W. (2018). GLNMDA: a novel method for MiRNA-disease association prediction based on global linear neighborhoods. RNA Biol. 15, 1215–1227. doi: 10.1080/15476286.2018.1521210
Yu, S.-P., Liang, C., Xiao, Q., Li, G.-H., Ding, P.-J., and Luo, J.-W. (2019). MCLPMDA: A novel method for MiRNA-disease association prediction based on matrix completion and label propagation. J. Cell. Mol. Med. 23, 1427–1438. doi: 10.1111/jcmm.14048
Zeng, X., Liu, L., Lü, L., and Zou, Q. (2018). Prediction of potential disease-associated micrornas using structural perturbation method. Bioinformatics 34, 2425–2432. doi: 10.1093/bioinformatics/bty112
Keywords: miRNA disease, matrix completion, GCNs, heterogeneous graph, association prediction
Citation: Zhu R, Ji C, Wang Y, Cai Y and Wu H (2020) Heterogeneous Graph Convolutional Networks and Matrix Completion for miRNA-Disease Association Prediction. Front. Bioeng. Biotechnol. 8:901. doi: 10.3389/fbioe.2020.00901
Received: 15 May 2020; Accepted: 13 May 2020;
Published: 20 August 2020.
Edited by:
Wen Zhang, Huazhong Agricultural University, ChinaReviewed by:
Pu-Feng Du, Tianjin University, ChinaLe Zhang, Sichuan University, China
Xiaobo Zhou, University of Texas Health Science Center at Houston, United States
Copyright © 2020 Zhu, Ji, Wang, Cai and Wu. This is an open-access article distributed under the terms of the Creative Commons Attribution License (CC BY). The use, distribution or reproduction in other forums is permitted, provided the original author(s) and the copyright owner(s) are credited and that the original publication in this journal is cited, in accordance with accepted academic practice. No use, distribution or reproduction is permitted which does not comply with these terms.
*Correspondence: Yunpeng Cai, eXAuY2FpQHNpYXQuYWMuY24=; Hongyan Wu, aHkud3VAc2lhdC5hYy5jbg==
 Rongxiang Zhu
 Chaojie Ji
 Yingying Wang
 Yunpeng Cai
 Hongyan Wu