 Chaolu Meng
 Yang Hu
 Ying Zhang4*
 Fei Guo
- 1College of Intelligence and Computing, Tianjin University, Tianjin, China
- 2College of Computer and Information Engineering, Inner Mongolia Agricultural University, Hohhot, China
- 3School of Life Sciences and Technology, Harbin Institute of Technology, Harbin, China
- 4Department of Pharmacy, Heilongjiang Province Land Reclamation Headquarters General Hospital, Harbin, China
Polystyrene binding peptides (PSBPs) play a key role in the immobilization process. The correct identification of PSBPs is the first step of all related works. In this paper, we proposed a novel support vector machine-based bioinformatic identification model. This model contains four machine learning steps, including feature extraction, feature selection, model training and optimization. In a five-fold cross validation test, this model achieves 90.38, 84.62, 87.50, and 0.90% SN, SP, ACC, and AUC, respectively. The performance of this model outperforms the state-of-the-art identifier in terms of the SN and ACC with a smaller feature set. Furthermore, we constructed a web server that includes the proposed model, which is freely accessible at http://server.malab.cn/PSBP-SVM/index.jsp.
Introduction
The immobilization of a biological functional molecule on a solid surface is one of the most important topics in the field of biology. Immobilized enzymes are a typical application of this technology and are commonly used in industrial reactors (Es̨ et al., 2015). The nature of the biocompatibility on the implant surface is considered to be a protein absorption process (Yin et al., 2020). The enzyme-linked immunosorbent assay (ELISA) (Engvall and Perlmann, 1971) is a well-known method for identifying counterparts in biological interactions. This assay is derived from the immobilization target antigen molecules (Li et al., 2018). There are two principles in immobilization: one principle is orienting the target part in the preferred direction, and the other principle is avoiding any unnecessary interaction between the target and the solid surface.
Polystyrene (PS) is used as a protein solid surface in ELISAs and animal cell cultures because of its biological inertia (Kumada et al., 2010). Polystyrene with binding peptides can be used to immobilize bioactive peptides, enzymes and antigens in water at room temperature. These functional monolayer protein layers can be widely applied in the medicine, textile and automobile industries (Yaman et al., 2009; Moritomi et al., 2010; Mrozek and Malysiak-Mrozek, 2011; Modjarrad, 2013). Polystyrene binding peptides (PSBPs) can combine with target proteins or peptides to determine their improper orientation in the immobilization process (Bakhshinejad and Sadeghizadeh, 2016; Wang et al., 2020). The correct recognition of PSBPs is the first and most important step of its related application. It is time-consuming and expensive to use a wet experiment to verify these peptides. To identify PSBPs, we turn to machine learning-based computing strategies. To date, machine learning algorithms have been widely used in biological sequence recognition (Wang et al., 2008, 2010, 2018; Zhou et al., 2017, 2018, 2019; He et al., 2018; Liao et al., 2018; Xu et al., 2018a, b; Bao et al., 2019; Cheng et al., 2019; Ding et al., 2019; Fang et al., 2019; Jin et al., 2019; Liu et al., 2019a; Meng et al., 2019; Shen et al., 2019; Zhu et al., 2019). This process generally includes data collection, feature extraction, feature selection and model training. The positive and negative samples are collected to form a training dataset, and the sequence recognition problem is transformed into a binary classification problem. Discrete features are extracted from training datasets via the feature extraction process. The pseudo amino acid composition (PseAAC) is one of the most commonly used feature extraction algorithms, and many improved algorithms have been produced (Shen and Chou, 2008). The MRMD (Max-Relevance-Max-Distance) (Zou et al., 2018), ANOVA (analysis of variance) (Anderson, 2001) and mRMR (Minimal Redundancy Maximal Relevance) (Ding and Peng, 2005) are commonly used feature selection algorithms. The aim of these feature selection algorithms is overcoming the data redundancy problem. Choosing a good classification algorithm is another particularly important step, and the SVM (support vector machine), random forest, and Bayes classifiers have been widely used to address sequence recognition problems (Li et al., 2019). Ning et al. combined a SVM and the dipeptide composition (DPC) feature, named PSBinder, to construct an identifier to recognize PSBPs (Li N. et al., 2017)1. In this study, we used the same training dataset as PSBinder.
In the “Materials and methods” section, we describe the data collection process, the feature extraction method, the ANOVA feature selection, the SVM and the evaluation metrics. We depict the workflow of the proposed identifier and comprehensively analyze the performance of the identifier in the “Results and discussion” section. In the “Conclusion” section, we analyze the shortcomings of the model and look forward to its future improvement.
Materials and Methods
Data Collection
We use the same training dataset as PSBinder. This benchmark dataset includes 104 positive samples (PSBPs) and 104 negative samples (non-PSBPs). This dataset is collected from the BDB database (released in January 2017) according to the following criteria. The raw positive samples are selected from nine different phage display libraries. Furthermore, in order to ensure the difference between the positive and negative samples, we attempt to select the same numbers of negative and positive samples from each of the above-mentioned libraries. For those libraries that do not have enough negative samples, we select the same length sequences from the other libraries instead. Then, cysteine amino acids are deleted because they found are at both ends of the circular peptides (Fu et al., 2018). Peptides that contain two specific kinds of characters are removed. One kind is ambiguous characters including “B,” “J,” “O,” “U,” “X,” and “Z.” The other kind is non-alphabetic characters. Two measures are used to screen the above data. Then, we compare each sequence in the positive and negative sample sets, delete the same negative sample sequences and positive sample sequences and replace them with other new negative samples (Yang et al., 2019b). Moreover, the Generalized Jaccard similarity is applied to keep the similarity between the positive and negative samples below 90% (Pan et al., 2009).
Feature Extraction
The amino acid residue frequency is one of the most important features of protein sequences (Małysiak-Mrozek et al., 2018a; Liu, 2019). The frequency feature can be calculated via the single amino acid composition (AAC), the DPC, three or more peptides’ composition or peptides with a certain gap. There are several proteins or peptide identifiers that have been proposed based on these features. In this paper, we use the weighted frequency of the single AAC and the DPC as the discrete extraction feature.
A peptide consists of 20 kinds of amino acid residues. Thus, a peptide can be presented as follows:
where Ai is the ith amino acid residue of peptide p with a length of L.
(i) 20-dimensional amino acid composition (AAC)
The weighted frequency of the single AAC is defined as follows:
where count(Ai) is the number of Ai in peptide p. FeatureAAC consists of 20 vectors, and these vectors represent the weighted frequency of “G,” “A,” “V,” “L,” “I,” “P,” “F,” “Y,” “W,” “S,” “T,” “C,” “M,” “N,” “Q,” “D,” “E,” “K,” “R” and “H.”
(ii) 400-dimensional dipeptide composition (DPC)
The weighted frequency of the DPC is defined as follows:
where count(AiAj) represents the number of amino acid residue pairs that consist of Ai and Aj. FeatureDPC includes 400 vectors. These vectors represent the weighted frequencies of {“GG,” “GA,”…, “GH,” “AG,” “AA,”…,“HR” and “HH”}.
Feature Selection
Generally, the extracted discrete features cannot be directly used in the training of the recognition model because there is noise in them (Yan et al., 2019). Therefore, after feature extraction, we need to use feature selection algorithms to filter the optimal features (Malysiak-Mrozek et al., 2018b). This process is also often considered to be a feature dimensionality reduction process in which noisy features are removed. In this paper, we use ANOVA and the IFS (incremental feature selection) strategy to rank and select the optimal feature set. First, all the extracted features are ranked by their ANOVA scores, and then optimal feature set is selected via incremental feature selection according to a certain criterion (Tang et al., 2019a, b).
(i) ANOVA
The training dataset is composed of positive and negative samples. Thus, each feature can naturally be divided into two groups, that is, the positive group and the negative group. If the difference between the positive and negative groups of a feature is large, then the discriminative ability is good. In ANOVA, the mean square between (MSB) groups and the mean square within (MSW) groups are used to measure the discriminative ability of a feature (Li B. et al., 2017). The MSB groups and the MSW groups of the ξth feature are calculated as follows:
where mi is total number of samples in the ith group. feaξ(i,j) represents the value of the jth sample in the ith group of the ξth feature. MSB2(ξ) and MSW2(ξ) follow a chi-square distribution with 1 and degrees of freedom, respectively.
From eqs 6 and 7, can deduce the following equation:
F(ξ) follows an F-distribution with () degrees of freedom. The larger F(ξ) is, the greater the contribution of the ξth feature to the classification is.
(ii) Incremental feature selection
All the features are sorted in descending order after calculating eq. 8. The feature sets are generated by adding one new feature at a time as follows:, and . The classification models are generated using the above new feature sets, and the best model is selected according to some criteria, such as the accuracy, F1 score or another.
Support Vector Machine
A support vector machine (SVM) is a kind of generalized linear classifier that classifies data via supervised learning. The SVM maps labeled data to a high-dimensional space and then uses the maximum-margin hyperplane to classify those data. In addition, the SVM is also one of the common kernel learning methods for non-linear classification (Yang et al., 2019a). In recent years, SVMs have been successfully applied in bioinformatics fields (Xiong et al., 2012, 2019; Zhang et al., 2015; Zhang J. et al., 2019; Ding et al., 2016a, b; Wei et al., 2016; Zeng et al., 2017; Zhao et al., 2017; Bu et al., 2018; Xu et al., 2018c; Hu et al., 2019; Liu and Li, 2019; Liu et al., 2019b; Wang et al., 2019; Dou et al., 2020). The LIBSVM is a widely used SVM tool. In addition to the standard SVM algorithm, LIBSVM also includes a support vector regression, multiple classifiers and probability output functions. The source code of LIBSVM is written using C, and it provides a call interface for the mainstream development languages including Java, Python, R and MATLAB. In this paper, the radial basis function (RBF) is used as the kernel function of the SVM. In addition, the grid.py program is used to find the kernel width parameter γ and the penalty constant C that optimize the model. In this paper, the search range of is set to [6, 20] and the step size is −0.5. Similarly, the search range of is [−10, 20], and the step size is 0.5. We use LIBSVM version 3.24, and it can be downloaded from https://www.csie.ntu.edu.tw/~cjlin/libsvm/.
Evaluation Measurement
K-fold cross validation, leave-one-out cross-validation (LOOCV) and independent tests are three major validation methods. In this paper, we use five-fold cross validation to evaluate and compare the different identifiers (Jiang et al., 2013; Ding et al., 2017; Wei et al., 2017a, b,c,2019; Chu et al., 2019; Liu et al., 2019c, d; Shan et al., 2019; Xu et al., 2019c; Zeng et al., 2019a, c; Zhang X. et al., 2019). five-fold cross validation first divides the whole training dataset into five parts. Then, this validation selects four parts to train the model, and the remaining part is used for testing. The above process iterates until all five subsets are used as test datasets. Finally, the five groups of evaluation metric scores are averaged to evaluate the trained model’s performance. To evaluate the model’s performance, we employ the sensitivity (SN), specificity (SP) and accuracy (ACC) to compare the different models. It is worth mentioning that ACC is also used as the objective of model optimization. These evaluation metrics are defined as follows:
where TN represents true negatives, and TP represents true positives. FN and FP represent false negatives and false positives, respectively.
In addition, the area under the curve (AUC) is also used to evaluate the overall performance of the model. The AUC is the value of the area enclosed by the X, Y coordinates and the receiver operating characteristic curve (ROC curve). The AUC reflects the performance stability of the model. The greater the AUC is, the better the stability of the model.
Results and Discussion
The Framework of the Proposed PSBP-SVM Identifier
There are four steps in the process of constructing our proposed identifier. As illustrated in Figure 1, these steps are data collection, feature extraction, feature selection and model generation and optimization. In the data collection step, the positive and negative samples are collected as described in the “data collection” section. The 420-dimensional AAC and DPC feature is generated from the above benchmark dataset in the feature extraction step. Then, the resulting feature vectors are ranked via their ANOVA scores and a 123-dimensional optimal feature set (123D optimal set) is selected via the IFS process using the ACC as the criterion. This optimal feature set is input into the SVM classifier to train and optimize the model. Finally, the proposed identifier is obtained and called the PSBP-SVM. “PSBP” refers to PSBPs, and the SVM is applied as the classification algorithm.
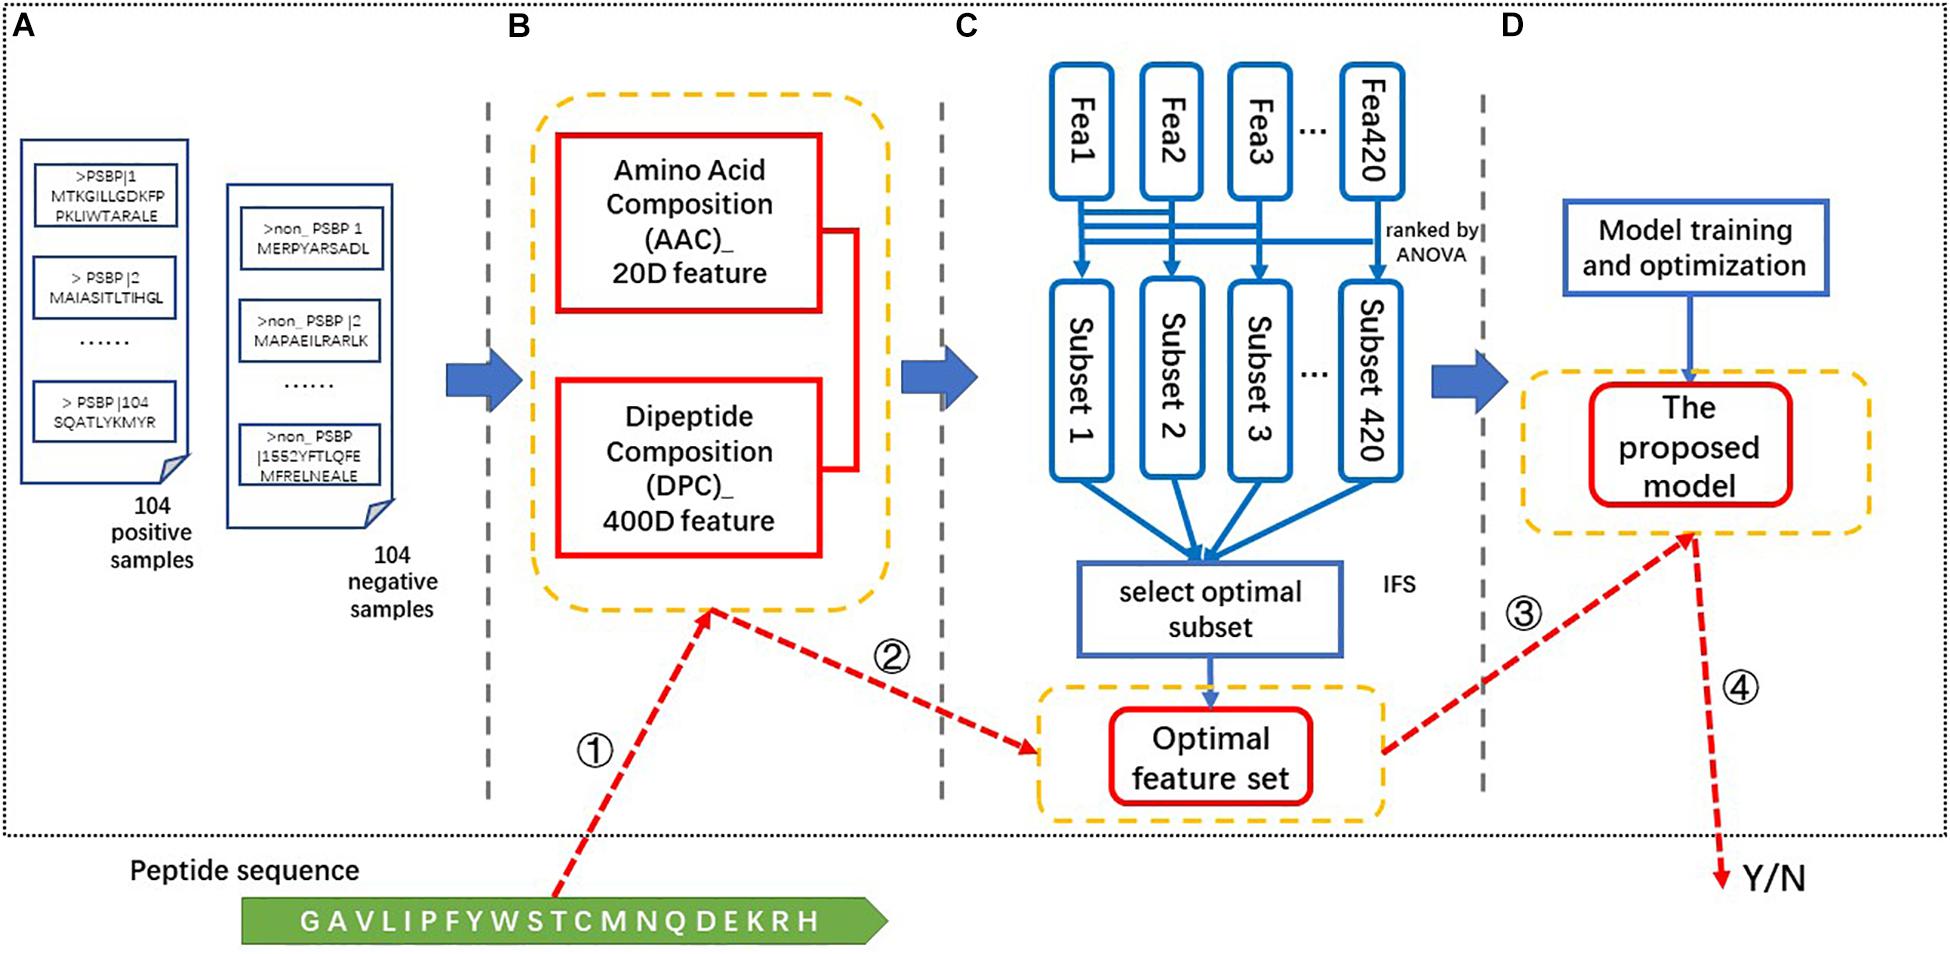
Figure 1. The framework and identification process of the PSBP-SVM. (A) Data collection. The benchmark dataset consists of 104 positive samples and 104 negative samples. (B) Feature extraction. A 420-dimensional feature is extracted from the benchmark dataset. (C) Feature selection. The optimal feature set is generated by the ANOVA ranking algorithm and the IFS process. (D) Model training and optimization. The optimal feature set is used to train and optimize the model. The PSBP identification process is based on the four parts in yellow boxes. These parts are ➀ feature extraction, ➁ feature selection, ➂ PSBP identification, and ➃ the result.
The identification of a peptide is as follows. ➀The 420-dimensional (AAC + DPC) feature is extracted from this peptide. ➁ Then, we select the feature vectors from the above feature according to the optimal feature set. ➂ ➃Finally, the selected feature vectors are put into the proposed model (PSBP-SVM) to identify whether a peptide is a PSBP or not.
Comparison With Other Identifiers
To comprehensively investigate the performance of the PSBP-SVM, we compare it with other identifiers including the state-of-the-art identifier. All models presented in this section have been optimized. The optimization conditions of SVM related models are the same as PSBP-SVM.
The 188-bit (Wei et al., 2018) and Izlti (Diener et al., 2016) feature extraction algorithms are combined with the SVM classifier to generate the 188D_SVM and Iztli_SVM, respectively. The comparison of the PSBP-SVM with the 188D_SVM and Iztli_SVM is illustrated in Figure 2A. In the five-fold cross validation test, the PSBP-SVM achieves 90.38, 84.62, 87.50, and 0.90% SN, SP, ACC, and AUC, respectively. It is observed that the PSBP-SVM is better than the other two identifiers by approximately 20% in terms of the SN, SP, ACC and AUC. This finding demonstrates that the 188-bit and Iztli extraction features might not include important discriminative features of PSBPs and non-PSBPs compared with the 123-dimensional optimal feature set.
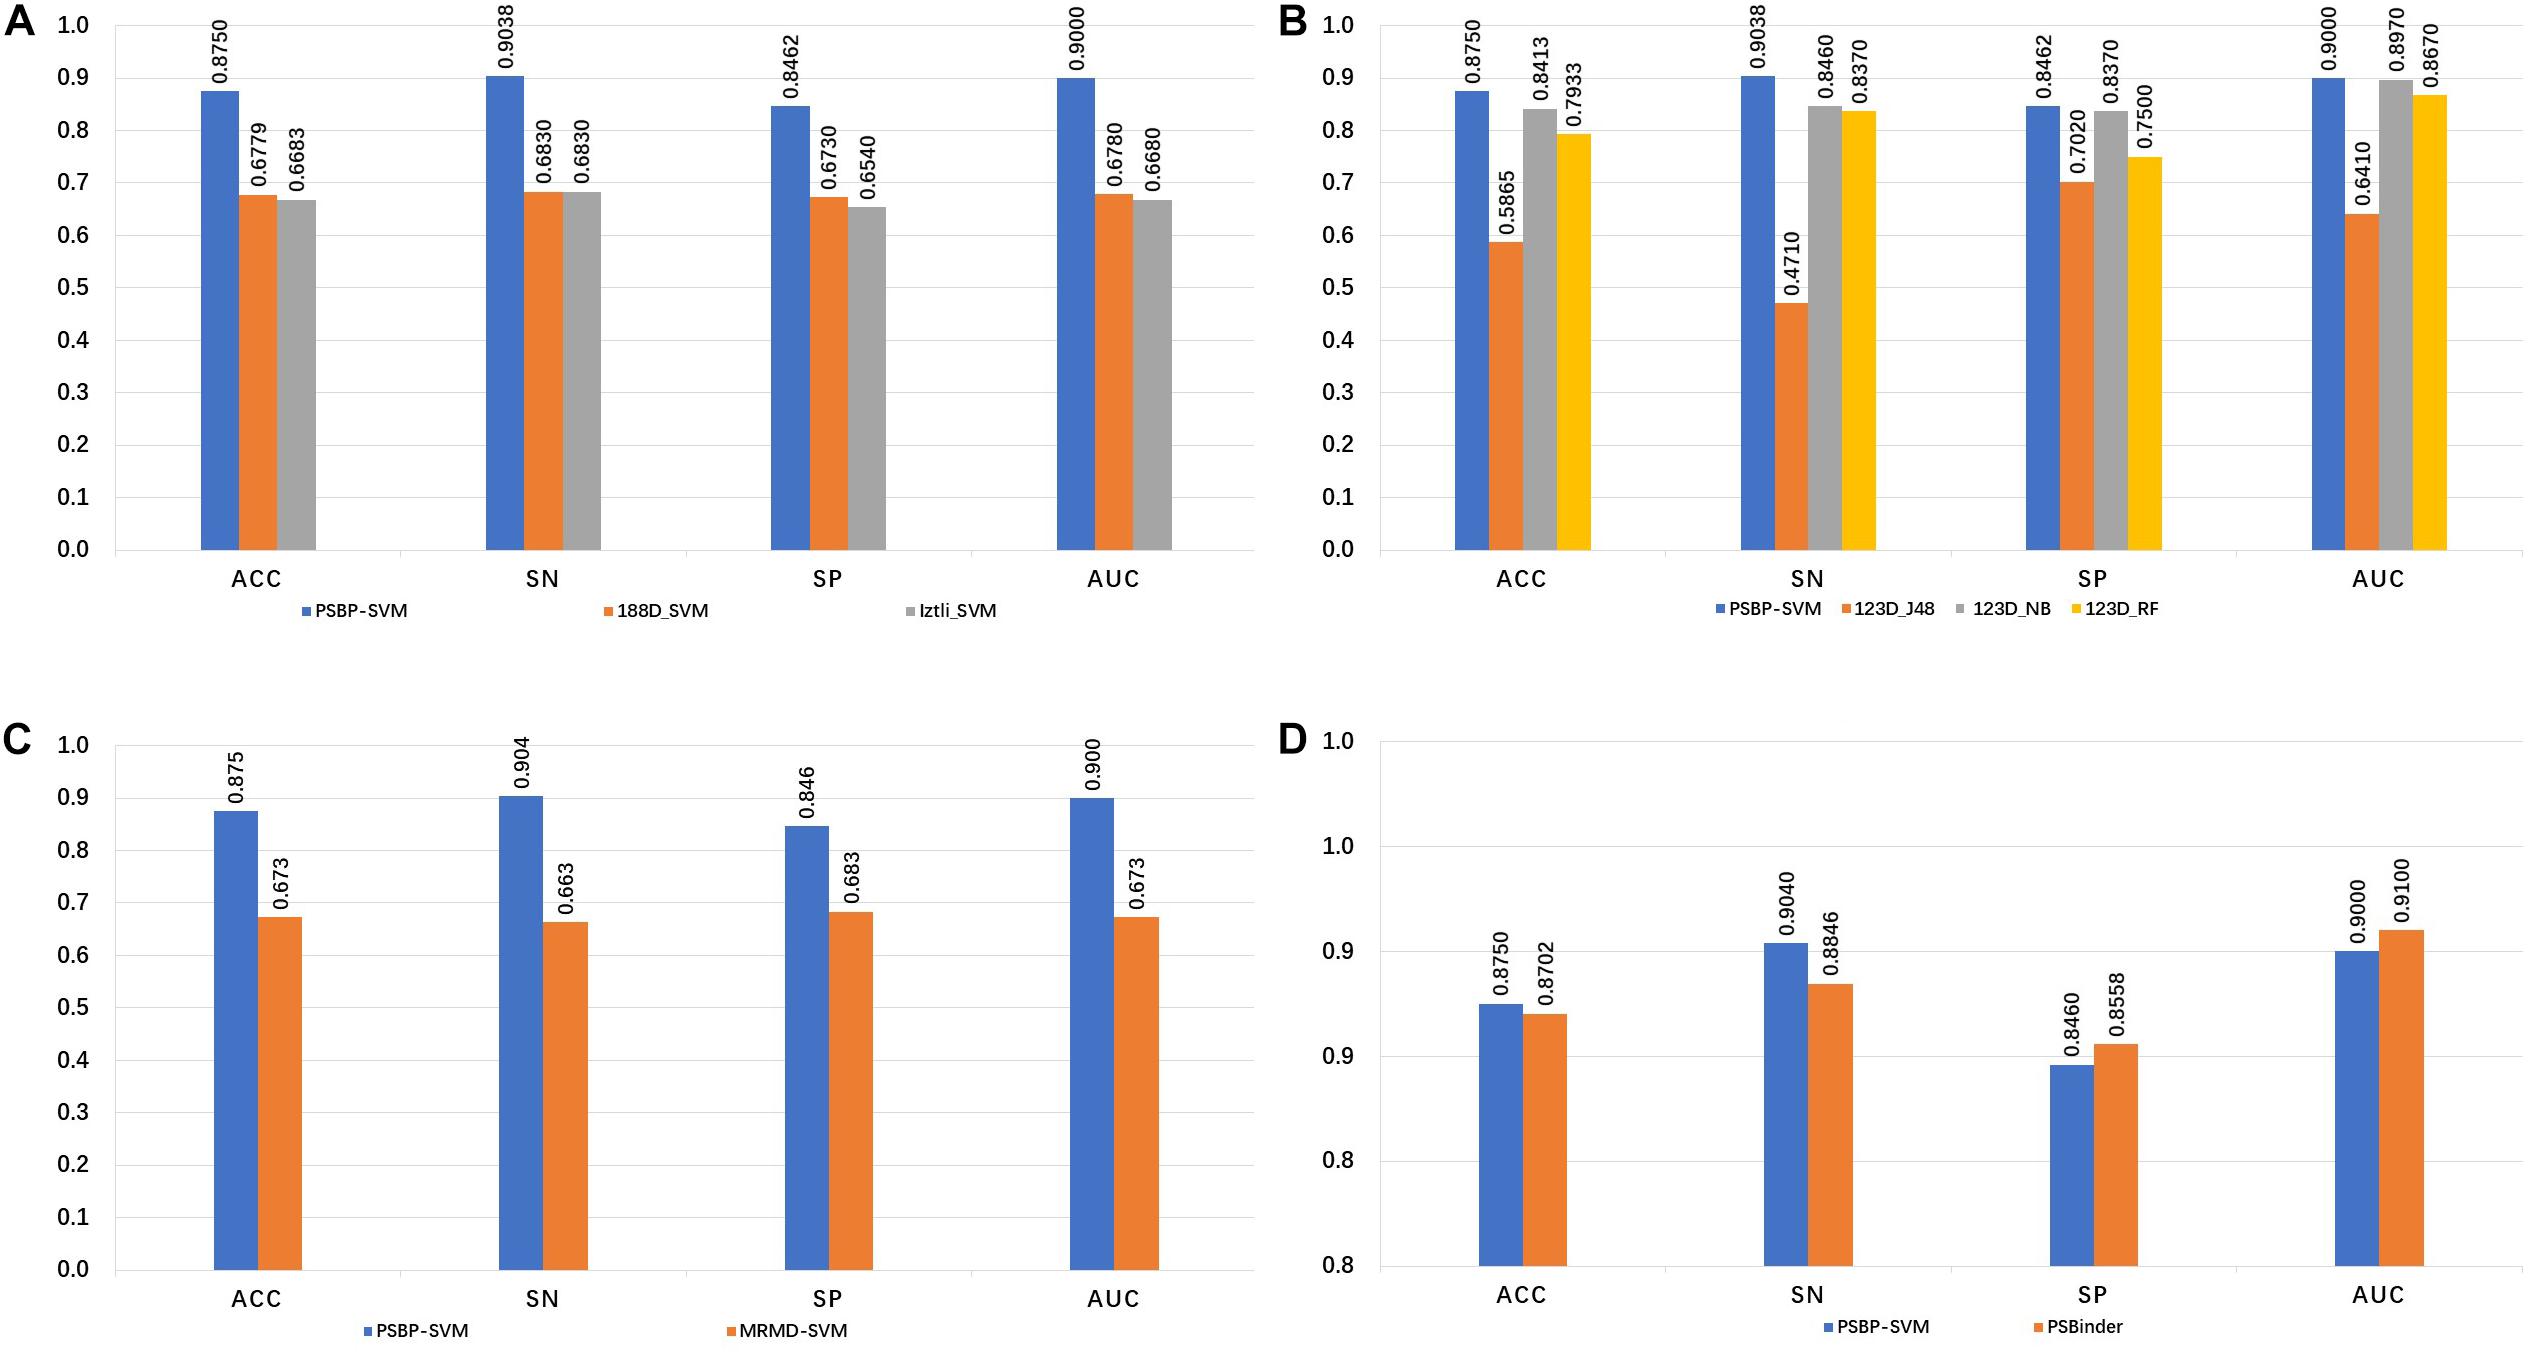
Figure 2. Comparison of the PSBP-SVM and other identifiers. (A) Comparison with other feature extraction identifiers. (B) Comparison with other classification algorithm identifiers. (C) Comparison with other feature selection identifiers. (D) Comparison with the state-of-the-art identifier.
To investigate the effectiveness of the SVM classifier, the naive Bayes, random forest and J48 are used to train the identifiers on the 123D optimal set. The generated identifiers of these algorithms are named 123D_NB, 123D_RF and 123D_J48, respectively. From Figure 2B, it is observed that the PSBP-SVM still outperforms the other three identifiers. The performance of 123D_NB follows. The SN, SP, ACC and AUC of 123D_NB are 84.6, 83.7, 84.13, and 0.897%, respectively, which are 5.78, 0.92, 3.37 and 0.003% lower than those of the PSBP-SVM, respectively. 123D_J48 is the worst of all. 123D_J48 only exhibits 47.1, 70.2, 58.65, and 0.641% SN, SP, ACC and AUC, respectively. In particular, the SN of 123D_J48 is below that of random classification. The performance of 123D_RF is worse than that of 123D_NB and better than that of 123D_J48. Thus, it can be concluded that the SVM classifier performs better than other classifier on the 123D optimal feature set.
Different feature selection algorithms lead to different classification effects. Figure 2C represents the influence of two different feature selection algorithms on the model. The MRMD-SVM is generated by replacing part C of Figure 1 with MRMD, that is, MRMD is used as the feature selection algorithm. Finally, a 178-dimensional new optimal feature set is selected by MRMD. From the comparison result, we observe that the MRMD-SVM only achieves 66.3, 68.3, 67.31, and 0.673% in terms of the SN, SP, ACC, and AUC, respectively. The performance of MRMD-SVM is much worse than that of the PSBP-SVM. This result indicates that MRMD may not select important features from the 420-dimensional feature set (Hong et al., 2019).
As shown in Figure 2D, the SN, SP, ACC and AUC values of PSBinder are 88.46, 85.58, 87.02 and 0.91%, respectively, according to the five-fold cross validation test. The SN and ACC of the PSBP-SVM are higher than those of PSBinder by 1.92 and 0.48%, respectively, although the other two metrics are slightly lower. It is worth mentioning that the number of features for the PSBP-SVM is 123, which is smaller than the 146 of PSBinder. Therefore, the PSBP-SVM can effectively avoid overfitting problems compared with PSBinder. For the computing model, the SN value is more significant because it can improve the positive sample identification accuracy by reducing its scope.
Feature Contribution and Importance Analysis
Figure 3A shows that the ACC values vary with the incremental feature selection process. When the top 123 features are selected, the ACC reaches the highest value of 87.5%. This is also the reason why 123 features are chosen as training features. The analysis of the composition of these optimal features is represented in Figure 3B. It is found that there are 8 AAC features and 115 DPC features, respectively accounting for 40 and 28.75% of the original features. This finding indicates that the AAC features have higher participation rates. Furthermore, the appearance frequencies of 20 amino acids are calculated using the AAC and DPC separately. From the result shown in Figure 3C, we can observe that the top six amino acids both in the AAC and DPC are tryptophan (W), phenylalanine (F), leucine (L), tyrosine (Y), cysteine (C) and glutamine (Q). The counts of the dipeptide types are presented in Figure 3D. The dipeptides that begin with glycine (G), tryptophan (W), phenylalanine (F) and tyrosine (Y) are the top four dipeptide types in the 123D optimal feature set. From the above analysis, we can conclude that tryptophan (W), phenylalanine (F) and tyrosine (Y) play important roles in identifying PSBPs from non-PSBPs.
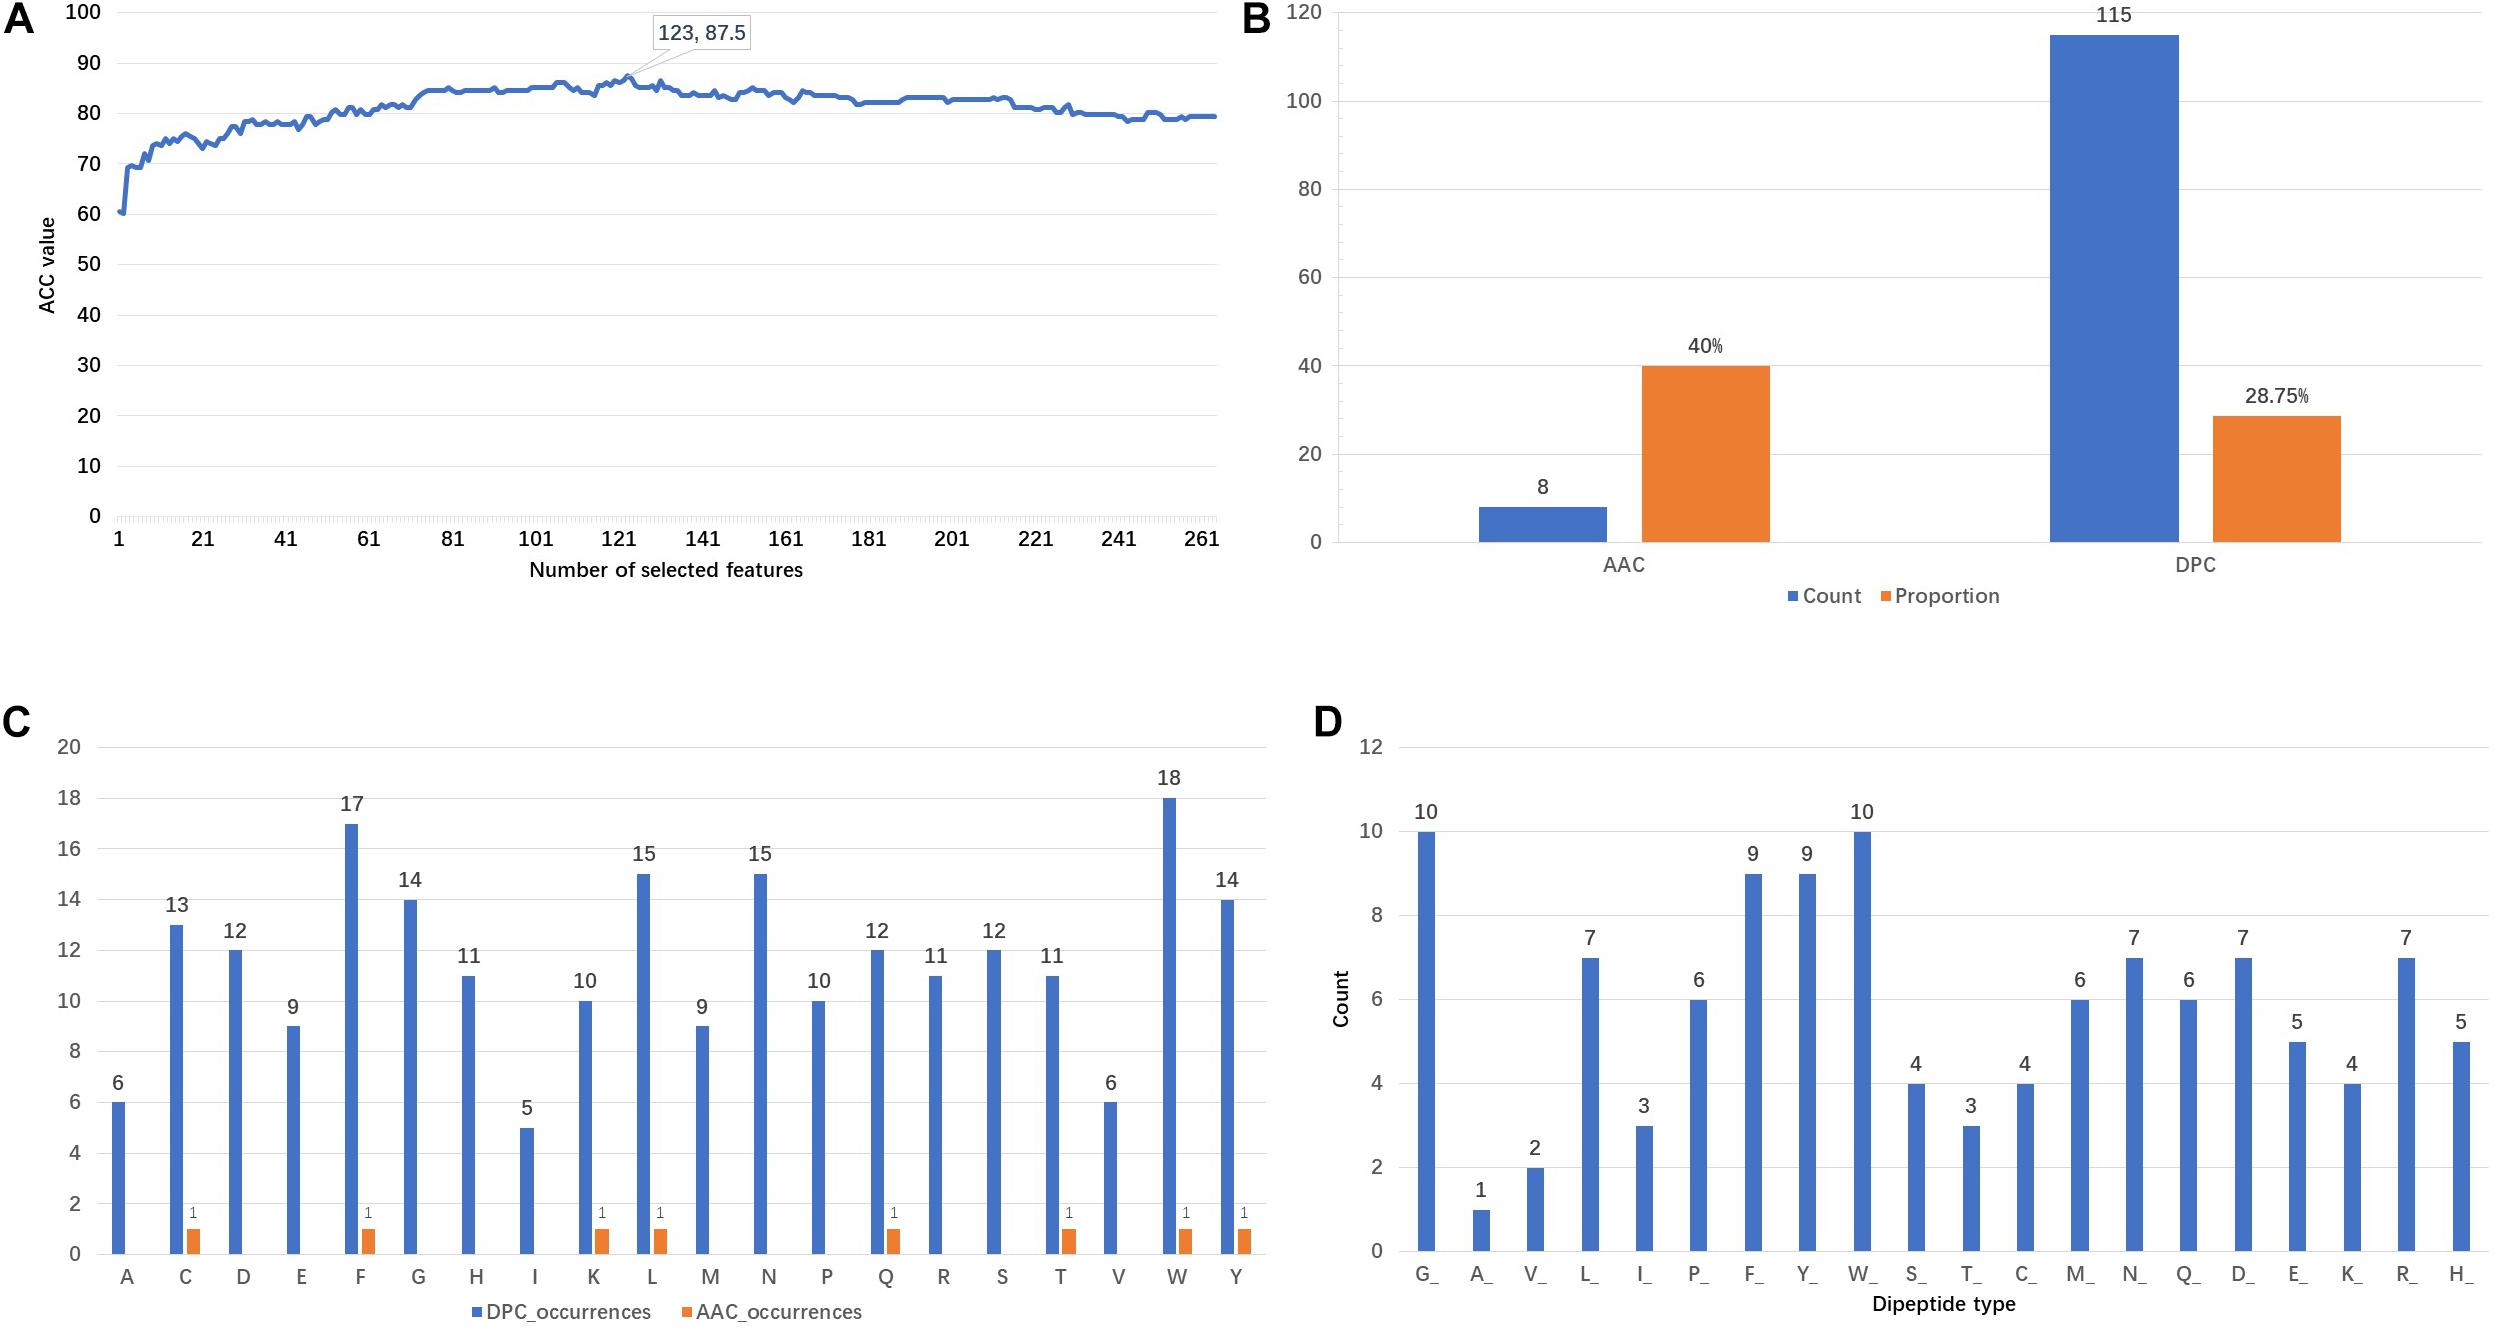
Figure 3. Analysis of the 123D optimal feature set. (A) Plot of the accuracy of incremental feature selection. (B) Composition of the optimal feature set. (C) DPC and AAC occurrences. (D) Number of dipeptide types in the DPC.
Web Server Guidelines
For the convenience of other researchers, we have constructed a web server including the PSBP-SVM, and free access is provided at http://server.malab.cn/PSBP-SVM/index.jsp. This web server includes “Home,” “Dataset,” “About” and “Contact us” pages. One can enter a sequence into the input box of the “Home” page and click the “submit” button to identify whether it is a PSBP or not. Note that only the FASTA format is supported. The “Dataset” page provides a link to download positive and negative samples. The “About” and “Contact us” pages give related information about our proposed model and the authors, respectively.
Conclusion
In this study, we proposed a novel SVM-based polystyrene binding peptide identification model and incorporated it in an identifier called the PSBP-SVM. The construction process of this model includes feature extraction, feature selection, model training and optimization. The performance comparison shows that the PSBP-SVM outperforms other identifiers, including the state-of-the-art identifier. Furthermore, in order to investigate the contribution of features, we comprehensively analyzed the composition and importance of the optimal feature set used in model training. However, there is still room for improvement in the future. With the help of multiview learning, ensemble learning strategies (Liu and Zhu, 2019; Ru et al., 2019; Zeng et al., 2019b) and evolutionary optimization (Xu et al., 2019a, b), the accuracy can be improved, and the range of the effective features can be further reduced.
Data Availability Statement
Publicly available datasets were analyzed in this study. This data can be found here: http://server.malab.cn/PSBP-SVM/data.jsp.
Author Contributions
CM and YH wrote the manuscript, participated in the research design and developed the web server. YZ and FG participated in preparation of the manuscript. CM, YH, FG, and YZ read and approved the final manuscript.
Funding
The work was supported by the National Key R&D Program of China (2018YFC0910405) and the National Natural Science Foundation of China (Nos. 61772362 and 61801147).
Conflict of Interest
The authors declare that the research was conducted in the absence of any commercial or financial relationships that could be construed as a potential conflict of interest.
Footnotes
References
Anderson, M. J. (2001). A new method for non-parametric multivariate analysis of variance. Austral Ecol. 26, 32–46. doi: 10.1111/j.1442-9993.2001.01070.pp.x
Bakhshinejad, B., and Sadeghizadeh, M. (2016). A polystyrene binding target-unrelated peptide isolated in the screening of phage display library. Anal. Biochem. 512, 120–128. doi: 10.1016/j.ab.2016.08.013
Bao, S., Zhao, H., Yuan, J., Fan, D., Zhang, Z., Su, J., et al. (2019). Computational identification of mutator-derived lncRNA signatures of genome instability for improving the clinical outcome of cancers: a case study in breast cancer. Brief. Bioinform. doi: 10.1093/bib/bbz118 [Epub ahead of print].
Bu, H. D., Hao, J. Q., Guan, J. H., and Zhou, S. G. (2018). Predicting enhancers from multiple cell lines and tissues across different developmental stages based on SVM method. Curr. Bioinform. 13, 655–660. doi: 10.2174/1574893613666180726163429
Cheng, L., Wang, P., Tian, R., Wang, S., Guo, Q., Luo, M., et al. (2019). LncRNA2Target v2.0: a comprehensive database for target genes of lncRNAs in human and mouse. Nucleic Acids Res. 47, D140–D144. doi: 10.1093/nar/gky1051
Chu, Y., Kaushik, A. C., Wang, X., Wang, W., Zhang, Y., Shan, X., et al. (2019). DTI-CDF: a cascade deep forest model towards the prediction of drug-target interactions based on hybrid features. Brief. Bioinform. bbz152. doi: 10.1093/bib/bbz152
Diener, C., Martínez, G. G. R., Blas, D. M., González, D. A. C., Corzo, G., Castro-Obregon, S., et al. (2016). Effective design of multifunctional peptides by combining compatible functions. PLoS Comput. Biol. 12:e1004786. doi: 10.1371/journal.pcbi.1004786
Ding, C., and Peng, H. (2005). Minimum redundancy feature selection from microarray gene expression data. J. Bioinform. Comput. Biol. 3, 185–205. doi: 10.1142/s0219720005001004
Ding, Y., Tang, J., and Guo, F. (2016a). Identification of protein–protein interactions via a novel matrix-based sequence representation model with amino acid contact information. Int. J. Mol. Sci. 17:1623. doi: 10.3390/ijms17101623
Ding, Y., Tang, J., and Guo, F. (2016b). Predicting protein-protein interactions via multivariate mutual information of protein sequences. BMC Bioinformatics 17:398. doi: 10.1186/s12859-016-1253-9
Ding, Y., Tang, J., and Guo, F. (2017). Identification of drug-target interactions via multiple information integration. Inf. Sci. 418–419, 546–560. doi: 10.1016/j.ins.2017.08.045
Ding, Y., Tang, J., and Guo, F. (2019). Identification of drug-side effect association via multiple information integration with centered kernel alignment. Neurocomputing 325, 211–224. doi: 10.1016/j.neucom.2018.10.028
Dou, L., Li, X., Ding, H., Xu, L., and Xiang, H. (2020). Is there any sequence feature in the RNA pseudouridine modification prediction problem? Mol. Ther. Nucleic Acids 19, 293–303. doi: 10.1016/j.omtn.2019.11.014
Engvall, E., and Perlmann, P. (1971). “Enzyme-linked immunosorbent assay (ELISA),” in Proceedings of the Twenty-Second Colloquium Protides of the Biological Fluids, (London: Pergamon Press), 553–556.
Es̨, I., Vieira, J. D. G., and Amaral, A. C. (2015). Principles, techniques, and applications of biocatalyst immobilization for industrial application. Appl. Microbiol. Biotechnol. 99, 2065–2082. doi: 10.1007/s00253-015-6390-y
Fang, T., Zhang, Z., Sun, R., Zhu, L., He, J., Huang, B., et al. (2019). RNAm5CPred: prediction of RNA 5-methylcytosine sites based on three different kinds of nucleotide composition. Mol. Ther. Nucleic Acids 18, 739–747. doi: 10.1016/j.omtn.2019.10.008
Fu, J., Tang, J., Wang, Y., Cui, X., Yang, Q., Hong, J., et al. (2018). Discovery of the consistently well-performed analysis chain for SWATH-MS based pharmacoproteomic quantification. Front. Pharmacol. 9:681. doi: 10.3389/fphar.2018.00681
He, J., Fang, T., Zhang, Z., Huang, B., Zhu, X., and Xiong, Y. (2018). PseUI: pseudouridine sites identification based on RNA sequence information. BMC Bioinformatics 19:306. doi: 10.1186/s12859-018-2321-0
Hong, J., Luo, Y., Mou, M., Fu, J., Zhang, Y., Xue, W., et al. (2019). Convolutional neural network-based annotation of bacterial type IV secretion system effectors with enhanced accuracy and reduced false discovery. Brief. Bioinform. bbz120. doi: 10.1093/bib/bbz120
Hu, Y., Zhao, T., Zhang, N., Zang, T., Zhang, J., and Cheng, L. (2019). Identifying diseases-related metabolites using random walk. BMC Bioinformatics 19(Suppl. 5):116. doi: 10.1186/s12859-018-2098-1
Jiang, Q. H., Wang, G. H., Jin, S. L., Li, Y., and Wang, Y. D. (2013). Predicting human microRNA-disease associations based on support vector machine. Int. J. Data Min. Bioinform. 8, 282–293. doi: 10.1504/ijdmb.2013.056078
Jin, S., Wang, L., Guo, F., and Zou, Q. (2019). AOPs-SVM: a sequence-based classifier of antioxidant proteins using a support vector machine. Front. Bioeng. Biotechnol. 7:224. doi: 10.3389/fbioe.2019.00224
Kumada, Y., Kuroki, D., Yasui, H., Ohse, T., and Kishimoto, M. (2010). Characterization of polystyrene-binding peptides (PS-tags) for site-specific immobilization of proteins. J. Biosci. Bioeng. 109, 583–587. doi: 10.1016/j.jbiosc.2009.11.005
Li, B., Tang, J., Yang, Q., Li, S., Cui, X., Li, Y., et al. (2017). NOREVA: normalization and evaluation of MS-based metabolomics data. Nucleic Acids Res. 45, W162–W170. doi: 10.1093/nar/gkx449
Li, N., Kang, J., Jiang, L., He, B., Lin, H., and Huang, J. (2017). PSBinder: a web service for predicting polystyrene surface-binding peptides. Biomed Res. Int. 2017:5761517. doi: 10.1155/2017/5761517
Li, Y. H., Li, X. X., Hong, J. J., Wang, Y. X., Fu, J. B., Yang, H., et al. (2019). Clinical trials, progression-speed differentiating features and swiftness rule of the innovative targets of first-in-class drugs. Brief. Bioinform. doi: 10.1093/bib/bby130 [Epub ahead of print].
Li, Y. H., Yu, C. Y., Li, X. X., Zhang, P., Tang, J., Yang, Q., et al. (2018). Therapeutic target database update 2018: enriched resource for facilitating bench-to-clinic research of targeted therapeutics. Nucleic Acids Res. 46, D1121–D1127. doi: 10.1093/nar/gkx1076
Liao, Z. J., Li, D. P., Wang, X. R., Li, L. S., and Zou, Q. (2018). Cancer diagnosis through IsomiR expression with machine learning method. Curr. Bioinform. 13, 57–63. doi: 10.2174/1574893611666160609081155
Liu, B. (2019). BioSeq-analysis: a platform for DNA, RNA, and protein sequence analysis based on machine learning approaches. Brief. Bioinform. 20, 1280–1294. doi: 10.1093/bib/bbx165
Liu, B., Gao, X., and Zhang, H. (2019a). BioSeq-Analysis2.0: an updated platform for analyzing DNA, RNA, and protein sequences at sequence level and residue level based on machine learning approaches. Nucleic Acids Res. 47:e127. doi: 10.1093/nar/gkz740
Liu, X., Hong, Z., Liu, J., Lin, Y., Rodríguez-Patón, A., Zou, Q., et al. (2019b). Computational methods for identifying the critical nodes in biological networks. Brief. Bioinform. bbz011. doi: 10.1093/bib/bbz011
Liu, B., Li, C., and Yan, K. (2019c). DeepSVM-fold: protein fold recognition by combining support vector machines and pairwise sequence similarity scores generated by deep learning networks. Brief. Bioinform. bbz098. doi: 10.1093/bib/bbz098
Liu, B., Zhu, Y., and Yan, K. (2019d). Fold-LTR-TCP: protein fold recognition based on triadic closure principle. Brief. Bioinform. bbz139. doi: 10.1093/bib/bbz139
Liu, B., and Li, K. (2019). iPromoter-2L2.0: identifying promoters and their types by combining smoothing cutting window algorithm and sequence-based features. Mol. Ther. Nucleic Acids 18, 80–87. doi: 10.1016/j.omtn.2019.08.008
Liu, B., and Zhu, Y. (2019). ProtDec-LTR3.0: protein remote homology detection by incorporating profile-based features into Learning to Rank. IEEE Access 7, 102499–102507. doi: 10.1109/access.2019.2929363
Małysiak-Mrozek, B., Baron, T., and Mrozek, D. (2018a). Spark-IDPP: high-throughput and scalable prediction of intrinsically disordered protein regions with Spark clusters on the Cloud. Cluster Comput. 22, 487–508. doi: 10.1007/s10586-018-2857-9
Malysiak-Mrozek, B., Stabla, M., and Mrozek, D. (2018b). Soft and declarative fishing of information in big data lake. IEEE Trans. Fuzzy Syst. 26, 2732–2747. doi: 10.1109/tfuzz.2018.2812157
Meng, C., Wei, L., and Zou, Q. (2019). SecProMTB: support vector machine-based classifier for secretory proteins using imbalanced data sets applied to Mycobacterium tuberculosis. Proteomics 19:1900007. doi: 10.1002/pmic.201900007
Modjarrad, K. (2013). Handbook of Polymer Applications in Medicine and Medical Devices, 1st Edn. Amsterdam: Elsevier.
Moritomi, S., Watanabe, T., and Kanzaki, S. (2010). Polypropylene compounds for automotive applications. Sumitomo Kagaku 1, 1–16.
Mrozek, D., and Malysiak-Mrozek, B. (2011). An improved method for protein similarity searching by alignment of fuzzy energy signatures. Int. J. Comput. Intell. Syst. 4, 75–88. doi: 10.2991/ijcis.2011.4.1.7
Pan, L., Lei, Y., Wang, C., and Xie, J. (2009). Method on entity identification using similarity measure based on weight of Jaccard. J. Beijing Jiaotong Univ. 34, 141–145.
Ru, X. Q., Li, L. H., and Zou, Q. (2019). Incorporating distance-based top-n-gram and random forest to identify electron transport proteins. J. Proteome Res. 18, 2931–2939. doi: 10.1021/acs.jproteome.9b00250
Shan, X., Wang, X., Li, C. D., Chu, Y., Zhang, Y., Xiong, Y., et al. (2019). Prediction of CYP450 enzyme-substrate selectivity based on the network-based label space division method. J. Chem. Inf. Model. 59, 4577–4586. doi: 10.1021/acs.jcim.9b00749
Shen, H.-B., and Chou, K.-C. (2008). PseAAC: a flexible web server for generating various kinds of protein pseudo amino acid composition. Anal. Biochem. 373, 386–388. doi: 10.1016/j.ab.2007.10.012
Shen, Y., Tang, J., and Guo, F. (2019). Identification of protein subcellular localization via integrating evolutionary and physicochemical information into Chou’s general PseAAC. J. Theor. Biol. 462, 230–239. doi: 10.1016/j.jtbi.2018.11.012
Tang, J., Fu, J., Wang, Y., Li, B., Li, Y., Yang, Q., et al. (2019a). ANPELA: analysis and performance assessment of the label-free quantification workflow for metaproteomic studies. Brief. Bioinform. doi: 10.1093/bib/bby127 [Epub ahead of print].
Tang, J., Fu, J., Wang, Y., Luo, Y., Yang, Q., Li, B., et al. (2019b). Simultaneous improvement in the precision, accuracy, and robustness of label-free proteome quantification by optimizing data manipulation chains. Mol. Cell. Proteomics 18, 1683–1699. doi: 10.1074/mcp.RA118.001169
Wang, G., Luo, X., Wang, J., Wan, J., Xia, S., Zhu, H., et al. (2018). MeDReaders: a database for transcription factors that bind to methylated DNA. Nucleic Acids Res. 46, D146–D151. doi: 10.1093/nar/gkx1096
Wang, G., Wang, Y., Feng, W., Wang, X., Yang, J. Y., Zhao, Y., et al. (2008). Transcription factor and microRNA regulation in androgen-dependent and -independent prostate cancer cells. BMC Genomics 9(Suppl. 2):S22. doi: 10.1186/1471-2164-9-S2-S22
Wang, G., Wang, Y., Teng, M., Zhang, D., Li, L., and Liu, Y. (2010). Signal transducers and activators of transcription-1 (STAT1) regulates microRNA transcription in interferon gamma-stimulated HeLa cells. PLoS One 5:e11794. doi: 10.1371/journal.pone.0011794
Wang, Y., Shi, F. Q., Cao, L. Y., Dey, N., Wu, Q., Ashour, A. S., et al. (2019). Morphological segmentation analysis and texture-based support vector machines classification on mice liver fibrosis microscopic images. Curr. Bioinform. 14, 282–294. doi: 10.2174/1574893614666190304125221
Wang, Y., Zhang, S., Li, F., Zhou, Y., Zhang, Y., Wang, Z., et al. (2020). Therapeutic target database 2020: enriched resource for facilitating research and early development of targeted therapeutics. Nucleic Acids Res. 48, D1031–D1041. doi: 10.1093/nar/gkz981
Wei, L., Hu, J., Li, F., Song, J., Su, R., and Zou, Q. (2018). Comparative analysis and prediction of quorum-sensing peptides using feature representation learning and machine learning algorithms. Brief. Bioinform. 10, 1–14. doi: 10.1093/bib/bby107
Wei, L., Wan, S., Guo, J., and Wong, K. K. (2017a). A novel hierarchical selective ensemble classifier with bioinformatics application. Artif. Intell. Med. 83, 82–90. doi: 10.1016/j.artmed.2017.02.005
Wei, L., Xing, P., Su, R., Shi, G., Ma, Z., and Zou, Q. (2017b). CPPred-RF: a sequence-based predictor for identifying cell-penetrating peptides and their uptake efficiency. J. Proteome Res. 16, 2044–2053. doi: 10.1021/acs.jproteome.7b00019
Wei, L., Xing, P., Zeng, J., Chen, J., Su, R., and Guo, F. (2017c). Improved prediction of protein–protein interactions using novel negative samples, features, and an ensemble classifier. Artif. Intell. Med. 83, 67–74. doi: 10.1016/j.artmed.2017.03.001
Wei, L., Xing, P., Shi, G., Ji, Z., and Zou, Q. (2019). Fast prediction of methylation sites using sequence-based feature selection technique. IEEE/ACM Trans. Comput. Biol. Bioinform. 16, 1264–1273. doi: 10.1109/TCBB.2017.2670558
Wei, L., Zou, Q., Liao, M., Lu, H., and Zhao, Y. (2016). A novel machine learning method for cytokine-receptor interaction prediction. Comb. Chem. High Throughput Screen. 19, 144–152. doi: 10.2174/1386207319666151110122621
Xiong, Y., Liu, J., Zhang, W., and Zeng, T. (2012). Prediction of heme binding residues from protein sequences with integrative sequence profiles. Proteome Sci. 10(Suppl. 1):S20. doi: 10.1186/1477-5956-10-S1-S20
Xiong, Y., Qiao, Y., Kihara, D., Zhang, H. Y., Zhu, X., and Wei, D. Q. (2019). Survey of machine learning techniques for prediction of the isoform specificity of cytochrome P450 substrates. Curr. Drug Metab. 20, 229–235. doi: 10.2174/1389200219666181019094526
Xu, H., Zeng, W., Zeng, X., and Yen, G. G. (2019a). An evolutionary algorithm based on minkowski distance for many-objective optimization. IEEE Trans. Cybern. 49, 3968–3979. doi: 10.1109/tcyb.2018.2856208
Xu, H., Zeng, W., Zhang, D., and Zeng, X. (2019b). MOEA/HD: a multiobjective evolutionary algorithm based on hierarchical decomposition. IEEE Trans. Cybern. 49, 517–526. doi: 10.1109/TCYB.2017.2779450
Xu, L., Liang, G., Liao, C., Chen, G.-D., and Chang, C.-C. (2019c). k-Skip-n-Gram-RF: a random forest based method for Alzheimer’s disease protein identification. Front. Genet. 10:33. doi: 10.3389/fgene.2019.00033
Xu, L., Liang, G., Liao, C., Chen, G.-D., and Chang, C.-C. (2018a). An efficient classifier for Alzheimer’s disease genes identification. Molecules 23:3140. doi: 10.3390/molecules23123140
Xu, L., Liang, G., Shi, S., and Liao, C. (2018b). SeqSVM: a sequence-based support vector machine method for identifying antioxidant proteins. Int. J. Mol. Sci. 19:1773. doi: 10.3390/ijms19061773
Xu, L., Liang, G., Wang, L., and Liao, C. (2018c). A novel hybrid sequence-based model for identifying anticancer peptides. Genes 9:E158. doi: 10.3390/genes9030158
Yaman, N., Özdoðan, E., Seventekin, N., and Ayhan, H. (2009). Plasma treatment of polypropylene fabric for improved dyeability with soluble textile dyestuff. Appl. Surf. Sci. 255, 6764–6770. doi: 10.1016/j.apsusc.2008.10.121
Yan, K., Fang, X., Xu, Y., and Liu, B. (2019). Protein fold recognition based on multi-view modeling. Bioinformatics 35, 2982–2990. doi: 10.1093/bioinformatics/btz040
Yang, Q., Hong, J., Li, Y., Xue, W., Li, S., Yang, H., et al. (2019a). A novel bioinformatics approach to identify the consistently well-performing normalization strategy for current metabolomic studies. Brief. Bioinform. bbz137. doi: 10.1093/bib/bbz137
Yang, Q., Li, B., Tang, J., Cui, X., Wang, Y., Li, X., et al. (2019b). Consistent gene signature of schizophrenia identified by a novel feature selection strategy from comprehensive sets of transcriptomic data. Brief. Bioinform. bbz049. doi: 10.1093/bib/bbz049
Yin, J., Sun, W., Li, F., Hong, J., Li, X., Zhou, Y., et al. (2020). VARIDT 1.0: variability of drug transporter database. Nucleic Acids Res. 48:D1171. doi: 10.1093/nar/gkz878
Zeng, X., Liao, Y., Liu, Y., and Zou, Q. (2017). Prediction and validation of disease genes using HeteSim scores. IEEE/ACM Trans. Comput. Biol. Bioinform. 14, 687–695. doi: 10.1109/tcbb.2016.2520947
Zeng, X., Wang, W., Chen, C., and Yen, G. (2019a). A consensus community-based particle swarm optimization for dynamic community detection. IEEE Trans. Cybern. doi: 10.1109/TCYB.2019.2938895 [Epub ahead of print].
Zeng, X., Zhong, Y., Lin, W., and Zou, Q. (2019b). Predicting disease-associated circular RNAs using deep forests combined with positive-unlabeled learning methods. Brief. Bioinform. bbz080. doi: 10.1093/bib/bbz080
Zeng, X., Zhu, S., Liu, X., Zhou, Y., Nussinov, R., and Cheng, F. (2019c). deepDR: a network-based deep learning approach to in silico drug repositioning. Bioinformatics 35, 5191–5198. doi: 10.1093/bioinformatics/btz418
Zhang, C., Song, X., Zhao, Y., Zhang, H., Zhao, S., Mao, F., et al. (2015). Mycobacterium tuberculosis secreted proteins as potential biomarkers for the diagnosis of active tuberculosis and latent tuberculosis infection. J. Clin. Lab. Anal. 29, 375–382. doi: 10.1002/jcla.21782
Zhang, J., Chen, Q., and Liu, B. (2019). DeepDRBP-2L: a new genome annotation predictor for identifying DNA-binding proteins and RNA-binding proteins using Convolutional neural network and long short-term memory. IEEE/ACM Trans. Comput. Biol. Bioinform. doi: 10.1109/TCBB.2019.2952338 [Epub ahead of print].
Zhang, X., Zou, Q., Rodriguez-Paton, A., and Zeng, X. (2019). Meta-path methods for prioritizing candidate disease miRNAs. IEEE/ACM Trans. Comput. Biol. Bioinform. 16, 283–291. doi: 10.1109/TCBB.2017.2776280
Zhao, Y., Wang, F., Chen, S., Wan, J., and Wang, G. (2017). Methods of MicroRNA promoter prediction and transcription factor mediated regulatory network. Biomed Res. Int. 2017:7049406. doi: 10.1155/2017/7049406
Zhou, M., Hu, L., Zhang, Z., Wu, N., Sun, J., and Su, J. (2018). Recurrence-associated long non-coding RNA signature for determining the risk of recurrence in patients with colon cancer. Mol. Ther. Nucleic Acids 12, 518–529. doi: 10.1016/j.omtn.2018.06.007
Zhou, M., Zhao, H., Wang, X., Sun, J., and Su, J. (2019). Analysis of long non-coding RNAs highlights region-specific altered expression patterns and diagnostic roles in Alzheimer’s disease. Brief. Bioinform. 20, 598–608. doi: 10.1093/bib/bby021
Zhou, M., Zhao, H., Xu, W., Bao, S., Cheng, L., and Sun, J. (2017). Discovery and validation of immune-associated long non-coding RNA biomarkers associated with clinically molecular subtype and prognosis in diffuse large B cell lymphoma. Mol. Cancer 16:16. doi: 10.1186/s12943-017-0580-4
Zhu, X., He, J., Zhao, S., Tao, W., Xiong, Y., and Bi, S. (2019). A comprehensive comparison and analysis of computational predictors for RNA N6-methyladenosine sites of Saccharomyces cerevisiae. Brief. Funct. Genomics 18, 367–376. doi: 10.1093/bfgp/elz018
Keywords: polystyrene binding peptides, support vector machine, bioinformatic, machine learning, identifier
Citation: Meng C, Hu Y, Zhang Y and Guo F (2020) PSBP-SVM: A Machine Learning-Based Computational Identifier for Predicting Polystyrene Binding Peptides. Front. Bioeng. Biotechnol. 8:245. doi: 10.3389/fbioe.2020.00245
Received: 31 January 2020; Accepted: 09 March 2020;
Published: 31 March 2020.
Edited by:
Yongchun Zuo, Inner Mongolia University, ChinaReviewed by:
Hao Lin, University of Electronic Science and Technology of China, ChinaXiangxiang Zeng, Xiamen University, China
Copyright © 2020 Meng, Hu, Zhang and Guo. This is an open-access article distributed under the terms of the Creative Commons Attribution License (CC BY). The use, distribution or reproduction in other forums is permitted, provided the original author(s) and the copyright owner(s) are credited and that the original publication in this journal is cited, in accordance with accepted academic practice. No use, distribution or reproduction is permitted which does not comply with these terms.
*Correspondence: Ying Zhang, emhhbmd5aW5nX2htdUAxNjMuY29t; Fei Guo, Zmd1b0B0anUuZWR1LmNu
†These authors have contributed equally to this work