
95% of researchers rate our articles as excellent or good
Learn more about the work of our research integrity team to safeguard the quality of each article we publish.
Find out more
ORIGINAL RESEARCH article
Front. Appl. Math. Stat. , 21 May 2019
Sec. Mathematics of Computation and Data Science
Volume 5 - 2019 | https://doi.org/10.3389/fams.2019.00022
This article is part of the Research Topic Computational Methods for Data Analytics View all 4 articles
 Yann Cabon1,2*
 Carey Suehs3,4
 Sébastien Bommart5,6
 Isabelle Vachier1,4
 Gregory Marin3Arnaud Bourdin4,6Nicolas Molinari2,3
Background: Lung disease quantification via medical image analysis is classically difficult. We propose a method based on normalized nearest neighborhood distance classifications for comparing individual CT scan air-trapping distributions (representing 3D segmented parenchyma). Previously, between-image comparisons were precluded by the variation inherent to parenchyma segmentations, the dimensions of which are patient- and image-specific by nature.
Method: Nearest neighbor distance estimations are normalized by a theoretical distance according to the uniform distribution of air trapping. This normalization renders images (of different sizes, shapes, and/or densities) comparable. The estimated distances for the k-nearest neighbor describe the proximity of point patterns over the image. Our approach assumes and requires a defined homogeneous space; therefore, a completion pretreatment is applied beforehand.
Results: Model robustness is characterized via simulation in order to verify that the required initial transformations do not bias uniformly sampled results. Additional simulations were performed to assess the discriminant power of the method for different point pattern profiles. Simulation results demonstrate that the method robustly recognizes pattern dissimilarity. Finally, the model is applied on real data for illustrative purposes.
Conclusion: We demonstrate that a parenchyma-cuboid completion method provides the means of characterizing air-trapping patterns in a chosen segmentation and, importantly, comparing such patterns between patients and images.
Many lung diseases involve changes at the alveoli scale, i.e., at around 0.125 mm2. To capture changes at such a fine scale, CT scans must be of high resolution and thus correspond to an information-dense situation. In addition, the information that is extracted must characterize the parenchyma, a zone whose size and shape vary between individuals and that further includes borders and shapes (e.g., large bronchi and blood vessels) that require separation from the rest of the image, which additionally lacks validated landmarks. The parenchyma is therefore a non-empty, hard-to-delimit space that is difficult to compare between patients [1].
In terms of disease characterization, granularity patterns within lung tissue are especially insightful. Each voxel of a CT scan is associated with an attenuation (density) score, which is abnormally low on expiration when lung disease leads to air trapping (as in asthma), or overly large alveoli spaces (as in emphysema). Attenuation scores are considered as representative of air trapping when ranging from −900 to −856 Hounsfield units (HU); those analogous for emphysema are under −900 HU. Beyond affected-voxel percentages or mean lung densities [2], studies characterizing low-attenuation lung voxels patterns are relatively rare.
Considering the current literary corpus, few articles provide techniques for evaluating lung parenchyma image data [1–3]. All reported methods require either a total lung volume or imaging landmarks as a prerequisite to voxel-matching techniques. Venegas et al. proposed a mathematical simulation [4] to represent air-trapping patterns characterizing different phenotypes of asthma (large airway disease vs. small airway disease). Bodduluri et al. [2] proposed a solution based on parenchyma (voxel) matching, which is not applicable to situations encountered by our clinical teams due to between-patient anatomical variability.
Recent advances have nevertheless enabled intrapatient CT-data comparisons by using regional patient landmarks (in combination with Jacobian matrix transformations) to pair voxels between inspiratory and expiratory scans on a given patient [1]. To our knowledge, there is currently no solution for comparing CT scan parenchyma modifications between patients due to the lack of appropriate landmarks. Surpassing this step is nevertheless crucial for advancing science. In clinical contexts, whether or not diseased tissues follow a uniform pattern or are clumped in space is an important issue [4]. We therefore propose a solution based on normalization, which leaves behind the constraints of size and shape by focusing on voxel distributions. By comparing observed voxel patterns with normalized distributions, one can quantify the deviation from normality.
For a given voxel range, the distribution of distances to its nearest neighbors (i.e., a k-nearest neighbor transformation) simultaneously characterizes fine-scale granularity as well as the regional clumping of similarly attenuated voxels. Studying distributions over space via the moment of the k-nearest neighbor distribution has been presented by Liitiäinen et al. [5], and we used this same idea to normalize observed air-trapping spatial distributions by theoretical ones based on a uniform hypothesis. This repartition has also been observed by Venegas et al. [4]. In short, the characterization of the observed moment divided by a theoretical one is dimension and proportion free and all air-trapping distributions across different patients could thus be compared.
Following the k-nearest neighbor (knn) transformation, we can therefore normalize data by computing the divergence from the theoretical knn distance expected under uniformity. The ensuing derived parameters (for example, means and variances of normalized knn mean distance) provide a novel means of describing parenchyma granularity.
In this context, data pretreatment is required to obtain a convenient data form. The pretreatment method must transform the segmented lung parenchyma space onto a bounded space (for example, a cuboid). Most importantly, the transformation must also preserve local voxel distributions. As concerns the isolation of parenchyma information via segmentation (to which our data pretreatment is applied), different solutions exist [6]. Most of the time, these segmentation tools are not applicable to our specific data (because we are dealing with, for example, only partial lung images). Other efficient segmentation tools use complex topological solutions and are used for vastly different segmentation contexts [7, 8]. However, improvement of the existing lung segmentation methods is not the purpose of this article. Rather, we are focusing on how to render the granularity of different segmentations comparable. In this case, care should be taken to not apply filters for noise (as in Muhammad et al. [9, 10]), which would likely alter the targeted information.
Quantification of individual parenchyma granularity patterns and associated changes with time are a potentially powerful, but poorly studied, means of characterizing lung disease. Our aim is that this technique will provide a means of further characterizing chronic airway diseases, as well as phenotyping patients within diseases. With this aim in mind, our objective in this paper is to classify equivalent point pattern repartitions in asthmatic patients.
The present work uses data generated by the SCANN'AIR protocol (clinicaltrials.gov: NCT03102749), whose primary objective required multiple serial CT scan data from patients. This study received the approval of the local research ethics committee “Comité de Protection des personnes Sud-Mediterranee III” (register: 2011-A01396-35) and the agreement of the French Health Products Safety Agency (ANSM) before the start of the research. CT-scan parameters are commonly set for stacking consecutive image slices of given thicknesses for the reconstruction of 3D volumes. Each measurement generates a 3D model, composed of voxels (the 3D equivalent of a pixel on a correspondingly 3D grid), with output in the DICOM format (Digital Imaging and Communications in Medicine). To limit radiation exposure, the ethics committee overseeing SCANN'AIR insisted on small scanning areas as opposed to total lung acquisitions. Thus, for each patient, this paper focuses on the two transversal small volumes made of 10 consecutive and jointed slices that were acquired (i.e., the volume of each region was 520 × 520 × 10 voxels): one in the superior part of the thorax at the carina level and the second in the inferior part at the right atrium level as presented in Figure 1.
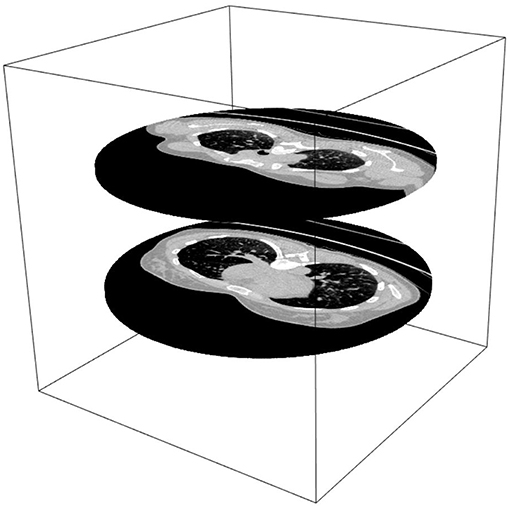
Figure 1. CT scan images from the SCANN'AIR study. Data are two thoracic slices: one from the upper lung and the other from the lower lung.
The lung parenchyma segmentation method used is based on Heuberger et al.'s work [11]. Specifically, we employed a segmentation method based on binary thresholds and region identification tools to extract the lung parenchyma. An additional trachea identification and segmentation step is also computed. Trachea extraction is important in the segmentation process because it represents a bias in low voxel attenuation value exploration. The segmentations were reviewed by a pulmonologist (AB) and a radiologist (SB), who both considered the actual method as sufficient for the data analysis.
In order to compare voxel distributions over the segmented parenchyma in the air-trapping range ([−900,−856] HU), we have to normalize the observed mean knn distance. Moreover, to compute the theoretical moment of the knn distribution, the segmented parenchyma space requires pretreatment in order to achieve a bounded, Euclidian space. To achieve the latter and transform segmented lung parenchyma images into comparable elements, we chose to include them on a cuboid and then complete the empty space in said cuboids in such a way as to not distort granularity patterns. The transformation completes the segmented lung to the smallest inclusive cuboid. Briefly, this completion method uses symmetry-through-the-border around the lung segmentation to create a cuboid without significantly changing point patterns. The result is a 3D voxel space with convenient mathematical properties representing the granularity observed in the lung parenchyma.
Three different data transformations were considered for completing our segmented lung parenchyma cuboids: random replacement, dilation of existing tissue borders, or symmetric completion. Random completion methods would distort granularity distributions and were thus ruled out. Completion via dilatation would modify the shape structure via non-uniform deformation (positively correlated with surface area/complexity) and was also ruled out. Finally, symmetric completion was chosen because, under a hypothesis of border regularity, we can demonstrate that symmetries through the border do not create clusters (i.e., simulations demonstrate that mirroring tissue images over their borders does not bunch up image information). Non-defined voxels were thus “filled” using symmetric existing values through the “border,” which, in turn, is defined as a voxel with an empty neighbor on segmented frames. This symmetric strategy is applied, starting with empty voxels nearest a border, until cuboid completion (see Algorithm 1). In the end, a symmetry mask is applied from the opposite corner of the cuboid in order to smooth the modification.
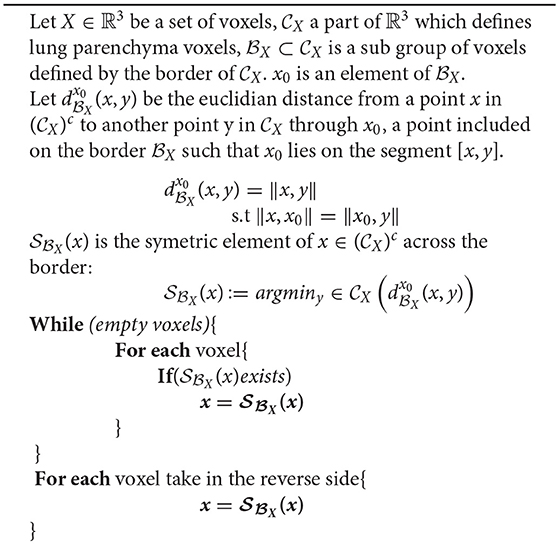
Algorithm 1.
The cuboid is in high resolution, so we consider the discrete space as a continuous one. Indeed, the distance between a voxel and its kth neighbor rapidly increases because the phenomenon studied is rare and rather homogeneous in the lung. By ignoring a small number of ordered neighbors (the first neighbor, the second, up to a weak number of neighbor, the 20th in our case), the number of possible voxels at the kth neighbor distance that can have air trapping is large (i.e., the grid of discrete space has a very fine mesh, comparable to a continuous space). In our case, we consider then that the discrete space can be approximated by a continuous space.
Following pretreatment, we obtained a set of completed cuboids representative of low-attenuation parenchyma patterns. These cuboids are comparable in shape but do not have the same volume. The data were defined as a set of P modified cuboid spaces, composed by a vector of xp voxels included in a 3D space:
where ap, bp and cp define the size of the smallest completed cuboid including the segmented lung parenchyma of the pth patient and is defined as the border of .
Attenuation values are regrouped according to the desired classes of voxels. The method is specifically interesting for the following voxel class: Xp = −900 < xp ≤ −856, which defines air trapping. This class regroups the N = Np number of voxels for the pth patient. For simplification purposes, the notation p is hidden until required for patient discretization.
We suppose that the point patterns X are independent and identically distributed on a Euclidian space representative of a patient p. The studied point pattern definition is
As defined by Liitiäinen et al. [5], we consider only Euclidian metric spaces when exploring distance granularity between point patterns within a given voxel class. We will proceed by defining (i) first the notion of “neighborhoods,” then (ii) how neighborhoods are distributed under uniformity, and finally (iii) how the latter can be used to classify data.
Let the first neighbor V [i, 1] of a voxel Xi be defined as:
Then, the kth nearest neighbor V [i, k] is recursively defined as:
The distance to the kth neighbor is consequently defined as:
Regarding the uniform distribution, the latter was the easiest theoretical approximation to calculate for normalizing the observed kth nearest neighbor distances and to obtain a comparable distance repartition for each patient. Moreover, a theoretical approximation exists for the kth distance distribution for this specific distribution and avoids density estimations. These advantages lead to reduced calculation times, with the simultaneous limitation that a bounded Euclidian space definition is required.
Under a uniform repartition of a point pattern , the α moment of di, k is distributed as:
where is the volume of a sphere, p(x) is the point pattern density over and represents the correction applied to the distance distribution according to the border definition.
Finally, we have the approximate term , where ξ is an approximation of rounded elements.
According to Liitiäinen et al. [5], because we are in three dimensions, the h function (which represents how interpoint distances behave in a bonded space) is defined as
Using numerical approximation, we obtained the same estimated value for D ≈ 0.42 as defined by the authors [5].
In our case,
Then, we obtained:
The approximation is possible because N is large; therefore, Γ (N) ≈ Γ (N + k) [5].
The mean and variance of the average nearest neighbor characterize the neighborhood distribution of each category m. This results in a unique representation of the voxel pattern. Each scanner is summarized by the associated knn distance curves. Dimensionality is thus greatly decreased while simultaneously preserving information.
To further simplify notation:
• dk represents the mean estimated distance
• represents the associated theoretical mean value.
How the data deviate from uniformity is summarized as follows:
• .
Changes in neighbor distance distributions characterize spatial patterns for a range of values from 1 to the highest possible number of neighbors (K), defined as:
The curve generated by plotting K on the abscissa and rk on the ordinate axis is called a “uniform neighborhood deviation curve” or UNDC. Obviously, the neighborhood range considered can be truncated and does not necessarily start at the first neighbor. A summary of the method is presented in Supplementary Files.
Similar UNDCs correspond to similar point patterns. In this context, previously described curve classification methods, such as B-splines [12], are well-suited. In our case, neighborhood variance is an important characteristic of our point patterns and should also be taken into account. The B-spline method thus takes on added value as it enables weighting the spline regression using the observed precision of the distance estimates. In addition to providing a relevant means of weighting B-spline parameters, variance can also differentiate otherwise similar distance repartitions. Variance represents the discrepancy between the kth nearest points and is used to measure the degree of dispersion between points.
The (rK)p = [1, …, P] sets of UNDCs for all patients are fit by piecewise polynomial spline functions of order n. The spline parameters are defined on a given set of m knots between 1 < t1 ≤ … ≤ tm ≤ K. Equivalent knot definitions are important for enabling comparisons [12] among all P patients. Spline functions are expressed as linear combinations of B-splines for each patient as follows:
The spline parameters Bi, n can be obtained with a Cox-de Boor [13] recurrence formula,
Let be a set of K observations of UNDCs, defined on [1, K] × ℝ. Data are adjusted on the spline reference matrix using a weighted least squares regression [14]. The dimension of theBp matrix is K × (m + n + 1).
The estimated spline parameters obtained for all patients are then submitted to a cluster analysis [15] in order to determine, in an unsupervised fashion, naturally occurring groups of similar UNDCs. In our case, we chose a hierarchical ascendant classification using Ward's method (complete linkage with unweighted pair group method with arithmetic mean (UPGMA) [16]) as our preferred clustering method. This method has the advantages of flexibility and dendrogram generation.
Simulations used to assess the method are based on a single CT image-specific lung shape extracted from the SCANN'AIR [17] study. An empty cuboid is built around the lung shape. The volume in pixels was
In order to assess the stability of the completion method, we simulated uniform point patterns on the lung with random numbers of points. Then, we completed these simulations, termed “uniform lung completions” (ULCs), over the cuboid using a completion method. Additionally, a cuboid of similar volume without a lung shape, termed the “uniform resampled cuboid” (URC), was filled via a uniform resampling of the ULC.
A comparison between the ULC and the URC was performed (via ) to demonstrate conservation of a uniform distribution by the completion method.
The resulting distribution curves are compared using a Kullback–Leibler divergence test. A boxplot of maximum paired curve differences is also performed to represent deviations between the obtained from ULC vs. URC.
In order to assess the power of the method, sensitivity and sensibility were computed for different UNDCs from (non-uniform) theoretical point pattern distributions (different profiles of H1; see Figures 4, 5). The two following hypotheses are used to assess the discriminant capacity of the UNDCs:
HO: point patterns are uniformly distributed on the lung and then completed over the space.
H1: point patterns are distributed according to non-uniform distributions (we will test multiple parameter combinations).
Alternative H1 hypotheses are based on a 3D multimodal Gaussian probability density function. Construction of this density function is performed by combining several Gaussian 3D kernel distributions in order to create clusters. The variance of the latter can be selected so as to create variation in pattern densities. These 3D density functions are then normalized in order to obtain a 3D probability density equal to 1 inside the lung shape (H1).
For a given H1, the number of points sampled was 5% above that present in the extracted lung shape. We used a n = 500 simulation sample size to model density distributions. Different combinations of number of 3D kernels and associated variance were used (thus generating a range of H1 hypotheses): 3 Gaussian probability kernels with variances σ of 10, 15, 40, 70, and 100; 5 kernels with a variance of 20; and 10 kernels with a variance of 10.
The air-trapping sampling solution is based on a sampling with specific probabilities according to the number of kernels and their corresponding variance. Each voxel x has the following probability to be trapped, defined by the kernel center ci, i = {1, 2, 3} in our case,
Let us define as the n samples of the multivariate distribution describing the UNDCs from the 1st to the Kth neighbor, as previously defined:
Let us define as the n samples of the multivariate distribution describing the UNDCs from the 1st to the Kth neighbor, as previously defined:
A density plot is constructed for each hypothesis. Because the K neighbors are independent, sensitivity and sensibility probabilities are computed as means over K as:
An adjusted Rand index (ARI) is used to quantify the similarity between two clusterings [18], with an ARI = 1 representing complete agreement. This was used to compare classification results between different alternative hypothesis profiles. Results are provided for each comparison.
The work is based on the SCANN'AIR study. The 20 first neighbors are not considered for the distribution characterization. This cutoff is performed to avoid grid-imposed constraints, resulting in repartitions of voxels at very small neighborhoods. Beyond the first 20 neighbors, the possibility of observing another voxel in a given range evens out, and the space is considered Euclidian and no longer discrete.
For 200 simulations of ULCs vs. URCs, we obtained a Kullback–Leibler divergence [19] value of 0.01, which means that we could not detect a difference between curves (Figure 2). The maximal difference boxplot is slightly positive because the completion method regroups points on concave spaces, creating a systematic bias. This particularity mechanically decreases the distance between knn patterns and is negligibly < 0.025 for distances >1. Furthermore, the region impacted by this problem is negligible in size.
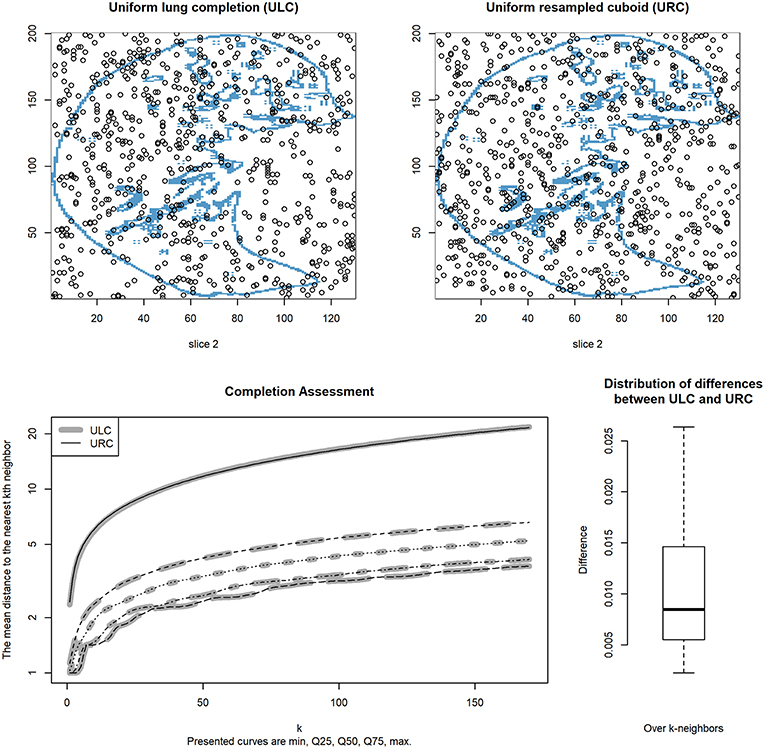
Figure 2. Mean distance to the kth nearest neighbor vs. k for 200 simulations. Curves for the uniform lung completion (ULC) are indicated in gray and are superimposed on those for the uniform resampled cuboid (URC) in black; they very closely overlap. The five curve positions (from bottom to top) represent the minimum, 25% quartile, median, 75% quartile, and maximum, respectively, for mean distances between ULC and URC curves over the 200 simulations. The top left CT scan contains a uniform point repartition inside the segmented lung and is completed on the cube with the method. The top right image is a uniform point repartition over the data. The bottom right graphic represents the knn difference distribution between the completed and the uniform point pattern distribution.
As concerns the completion of non-defined regions, either the neighboring regions were compact enough to support the density conservation hypothesis or discontinuity rendered the hypothesis false. For example, if considering a missing region similar to a hole (often identified as blood vessels), symmetric completion can modify distributions moving toward the center of the area via symmetry vector overlap. Another example is the point or peak shape position (i.e., an isolated “dot” or “peninsula” of lung parenchyma surrounded by space requiring completion), for which the distribution is repeated like “orange slices” until completion.
Similarity indices that compare voxels by voxels or gray-level distributions on a grid could not be applied because our method completes non-existing data. Moreover, the completed space is very varied in shape, making assessment of the completion method difficult. Comparison between the original data and the transformed is to our knowledge not possible, especially regarding spatial distributions.
One must note that the symmetric mathematical transformation method used for completion is surjective because of the non-regularity of the border. The corresponding non-reversibility of the symmetric transformation hinders direct assessments of how well-granularity distributions were conserved across borders. To overcome this limitation, we demonstrate the relative conservation of granularity distributions during completion using uniform resampling of segmented lung parenchyma slices.
However, overall voxel distribution between completed regions and not completed ones is similar. For that purpose, the sum of the absolute difference density histogram is computed showing a slice difference with a median of 0.05 and an interquartile [Q25%, Q75%] of [0.03, 0.07], based on the subsample. Some examples of the distribution conservation are presented in the Supplementary Files.
These results demonstrate, on average, a relative conservation in distribution that cannot be demonstrated using similarity indices. In addition, differences in knn repartition indicated conservation of the uniform distribution. Furthermore, completed regions with non-smooth borders involve only a small portion of the overall non-defined spaces. Segmented lung parenchymas have a regular border almost everywhere. We were not able to demonstrate that the symmetric method preserved the spatial distributions, but given the simulation results, this method did not create new patterns on resampled uniform completed cuboids.
For each alternative H1 hypothesis, H0 and H1 UNDCs were portrayed on the same plot (right side of Figures 3, 4, as well as further examples in Supplementary Files). We observed that the density repartitions of the curves were widest when large variances were used. This can be explained by the superposition of kernel centers.
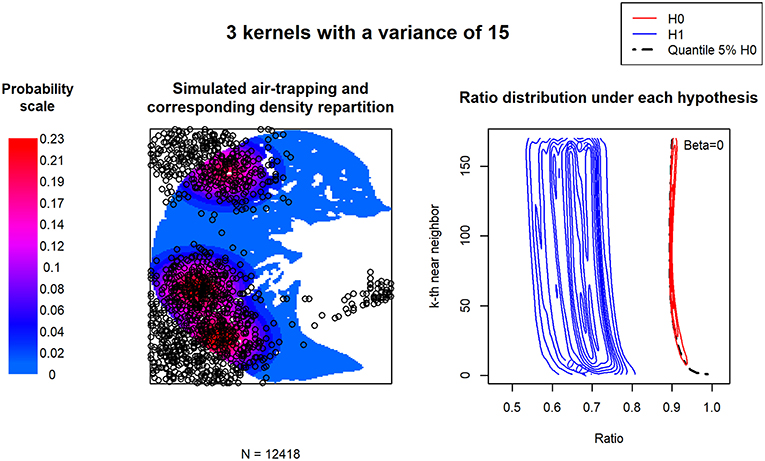
Figure 3. Uniform neighborhood deviation curve (UNDC) ratios according to a clustered or heterogeneous point pattern. Three kernels define the density of the simulated air trapping. The low associated variance simulates a rather clustered repartition of air trapping. The density repartition of the Rk curves is presented for 500 simulations.
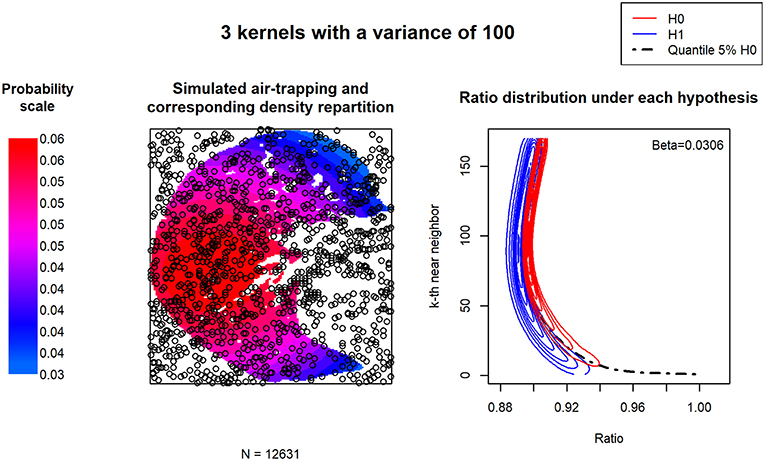
Figure 4. UNDC ratios according to a homogeneous point pattern. Three kernels define the density of the simulated air trapping. The relatively high associated variance simulates homogeneous air trapping throughout the image. The density repartition of the Rk curves is presented for 500 simulations.
As concerns the distribution of , we observed the same structural bias identified by Liitiäinen et al. [5]. As expected, this ratio is not aligned with 1. Approximations of the theoretical knn distribution are biased and cannot be avoided in our data. The latter is explained by the shape of the borders and the underlying theoretical approximations.
In order to assess the discriminant capacity of these transformations, we computed the type 2 error (β). Over all simulations, the latter is increased by 0.03 only.
ARI results are presented in Table 1. We observed that ARIs are able to detect differences between point patterns only when the latter are quite different in density; small density differences between cuboids result in high ARI scores. This was expected because certain simulations result in similar point patterns, especially when kernel centers were close together.
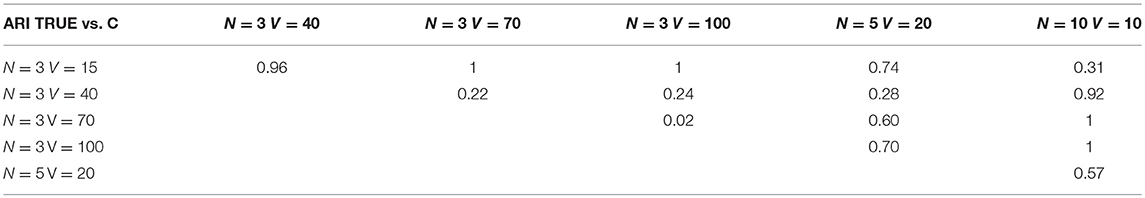
Table 1. Concordance between classification results and simulated hypothesis.
The method was applied to the SCANNAIR' dataset, which includes CT scans from asthmatic patients (see Figure 1). We searched for three groups using a Ward's clustering algorithm. Representative CT slices and the UNDCs for each group are presented in Figure 5.
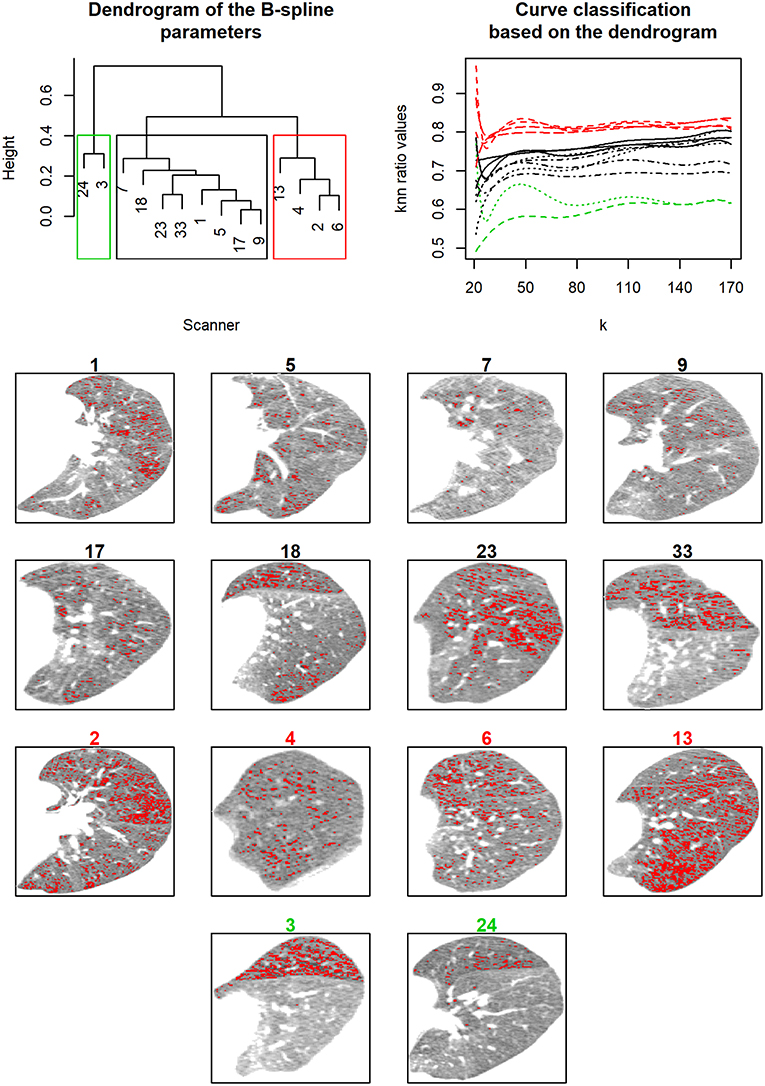
Figure 5. Clinical application. Upper left: The dendrogram resulting from hierarchical ascendant classification using Ward's method (complete linkage with UPGMA [16]) on spline parameters. Upper right: knn ratio value vs. k curves color-coded according to the hierarchical ascendant classification (red = a likely uniform repartition, with air trapping distributed all over the parenchyma, black = an average distribution neither uniform nor in clusters, green = high divergence from uniformity—point patterns are gathered in clusters). The CT scan images presented are number-colored according to dendrogram results.
Results are based on the exploration of the air-trapping attenuation range: [−900,−850] HU. We consider four knots based on the 31, 71, 111, and 151 nearest neighbors modeled by a 3° spline. During a methacholine bronchoconstriction challenge, each subject was characterized by the upper left parenchyma observed at the maximal methacholine dose given.
The first group (shown in green in Figure 5) consists of patients with high divergence from uniformity: point patterns are gathered in clusters. The second group represents patients with a likely uniform repartition, with air trapping distributed all over the parenchyma (shown in red in Figure 5). The last group is composed of patients with an average distribution neither uniform nor in clusters (shown in black). UNDC groups are well-defined and distinguished different patterns over the parenchyma.
In this study, we started with segmented lung parenchyma from partial lung imaging data and then constructed comparable cuboids for the purpose of comparing lung parenchyma granularity or texture between images. The resulting program is publicly available at https://github.com/YannCabon/ChymaSeg and represents our proposals to overcome two general problems: (1) the segmentation possibilities for partial images and (2) the non-existence of 3D cuboid completion algorithms.
Even if the completion is not uniform on the parenchyma, the proposed solution preserves local distributions. Obviously, completion by symmetry modifies the overall distribution of the parenchyma, but simulation demonstrated that the distribution characterization is not impacted by this bias. This can be explained by the fact that all segmented parenchymas are transformed in the same way.
We considered that observing a nearest neighbor < 20 could not respect the Euclidean metric because there are not enough possibilities on a grid system for observing other points. However, at farther and farther neighborhoods, more and more possibilities for observation exist. That is why we do not use the 20 first nearest neighbors, thus avoiding grid constraints.
Finally, completion can also be envisioned using other geometrical spaces, such as spheres or ellipsoids; however, the cuboid seems to be the easiest solution for obtaining a fully defined space.
We propose a method for clustering point patterns articulated around two transformations: (1) a completion method required before calculating and (2) UNDCs. The major advantage of UNDCs is that they are comparable within and between images/patients. Subsequent advantages include greatly reducing the dimension of the image data while simultaneously quantifying heretofore non-measured lung parameters. Though a slight systematic bias has been demonstrated within the knn method, the latter is known, negligible, normally distributed, and constant and does not affect comparisons between curves.
A given UNDC curve characterizes how voxel patterns differ from uniformity across a range of distances. rK values close to 1.0 indicate more-uniform distributions and therefore an absence of clusters or total air trapping. In our sample dataset, our smallest rK values, near 0.6, indicate relatively large-scale clustering, i.e., localized disease within a single lobe. rK values between 0.6 and 1.0 correspond to a gradient of more or less fragmented voxel landscapes.
The relationship between k and distance is necessarily smooth, and classification according to B-spline parameters is therefore appropriate. This forced smoothness precludes discontinuities on a single curve. Nevertheless, when comparing different lung sections, we found that within-patient UNDC curves can greatly vary in the y-intercept and the slope. This suggests that regional heterogeneity is a lung parameter that should not be ignored or glossed over by averaging (for example), and merits further study.
There are certain methodological choices and limitations that the reader should be aware of regarding (1) the completion methods and (2) the limits in neighbor distance definitions.
1) The stability of completion method results under the theoretical H0 hypothesis (uniformity of the point pattern distribution) has been verified. However, there is no certitude that the completion method will not result in non-conservation of parenchyma point patterns if other non-uniform H0 hypotheses were used. However, because the method used is symmetric through the border, the density can be considered as locally equivalent.
2) Usable minimal k values are chosen according to image resolution and the inherent qualities of a grid. We consider that excluding low k values (e.g., k = 1 to 19, as presented herein) is important for avoiding distance overestimations within a rigid voxel grid structure. Usable maximal k values are chosen according to the common number of observations within point patterns across the dataset and computer limits. Indeed, because calculations include gamma functions, aiming for a k beyond 170 is impractical.
In conclusion, the presented method uses non-supervised classification on B-spline knn curve ratios to enable granularity characterization between image comparisons of individual patients. This smooth-curve classification is robust to data shape and repartition, thus providing a framework in which between-image comparisons can be performed. Other methods fall short of this possibility.
The data used were generated by the SCANN'AIR project (clinicaltrials.gov NCT03102749), which was evaluated by an independent ethics committee [Comité de Protection des personnes Sud-Mediterranee III (register: 2011-A01396-35)] and for which patients provided informed consent in accordance with French law.
YC and NM developed the methodology and the software. GM, IV, SB, and AB provided the data. SB and AB assessed the segmentation method. CS was a major contributor in writing the manuscript. All authors read and approved the final manuscript.
This research was supported by grant AOI GCS MERRI n°8836 obtained from the Montpellier and Nîmes University Hospitals for the SCANN'AIR data set and by grant ANRT CIFRE n°2014/1025, which funded YC's Ph.D. studies.
The authors declare that the research was conducted in the absence of any commercial or financial relationships that could be construed as a potential conflict of interest.
The Supplementary Material for this article can be found online at: https://www.frontiersin.org/articles/10.3389/fams.2019.00022/full#supplementary-material
knn, k-nearest neighbor; ARI, adjusted Rand index; HU, Hounsfield unit; UNDC, uniform neighborhood deviation curve; ULC, uniform lung completion; URC, uniform resampled cuboid.
1. Farrow CE, Salome CM, Harris BE, Bailey DL, Bailey E, Berend N, et al. Airway closure on imaging relates to airway hyperresponsiveness and peripheral airway disease in asthma. J Appl Physiol. (2012) 113:958–66. doi: 10.1152/japplphysiol.01618.2011
2. Bodduluri S, Newell JD, Hoffman EA, Reinhardt JM. Registration-based lung mechanical analysis of chronic obstructive pulmonary disease (COPD) using a supervised machine learning framework. Acad Radiol. (2013) 20:527–36. doi: 10.1016/j.acra.2013.01.019
3. Galbán CJ, Han MK, Boes JL, Chughtai KA, Meyer CR, Johnson TD, et al. Computed tomography-based biomarker provides unique signature for diagnosis of COPD phenotypes and disease progression. Nat Med. (2012) 18:1711–5. doi: 10.1038/nm.2971
4. Venegas JG, Winkler T, Musch G, Vidal Melo MF, Layfield D, Tgavalekos N, et al. Self-organized patchiness in asthma as a prelude to catastrophic shifts. Nature. (2005) 434:777–82. doi: 10.1038/nature03490
5. Liitiäinen E, Lendasse A, Corona F. A boundary corrected expansion of the moments of nearest neighbor distributions. Random Struct Algor. (2010) 37:223–47. doi: 10.1002/rsa.20311
6. Mansoor A, Bagci U, Foster B, Xu Z, Papadakis GZ, Folio LR, et al. Segmentation and image analysis of abnormal lungs at CT: current approaches, challenges, and future trends. RadioGraphics. (2015) 35:1056–76. doi: 10.1148/rg.2015140232
7. Irshad M, Muhammad N, Sharif M, Yasmeen M. Automatic segmentation of the left ventricle in a cardiac MR short axis image using blind morphological operation. Eur Phys J Plus. (2018) 133:148. doi: 10.1140/epjp/i2018-11941-0
8. Mughal B, Muhammad N, Sharif M, Rehman A, Saba T. Removal of pectoral muscle based on topographic map and shape-shifting silhouette. BMC Cancer. (2018) 18:778. doi: 10.1186/s12885-018-4638-5
9. Muhammad N, Bibi N, Wahab A, Mahmood Z, Akram T, Naqvi SR, et al. Image de-noising with subband replacement and fusion process using Bayes estimators. Comput Electr Eng. (2018) 70:413–27. doi: 10.1016/j.compeleceng.2017.05.023
10. Muhammad N, Bibi N, Jahangir A, Mahmood Z. Image denoising with norm weighted fusion estimators. Pattern Anal Appl. (2018) 21:1013–22. doi: 10.1007/s10044-017-0617-8
11. Heuberger J, Geissbuhler A, Muller H. Lung CT segmentation for image retrieval using the Insight Toolkit (ITK). Med Imaging Telemed. (2005) 30.
12. Prautzsch H, Boehm W, Paluszny M. Bézier and B-Spline Techniques. Berlin: Springer Science & Business Media (2013). p. 3–4.
13. de Boor C. A Practical Guide to Splines. New York, NY: springer-verlag. Available online at: http://www.springer.com/gp/book/9780387953663 (accessed March 30, 2018).
14. Chambers JM, Hastie T. Statistical Models in S. Pacific Grove, CA: Wadsworth & Brooks/Cole Advanced Books & Software (1992).
15. Abraham C, Cornillon PA, Matzner-Løber E, Molinari N. Unsupervised curve clustering using B-splines. Scand J Stat. (2003). 30:581–95. doi: 10.1111/1467-9469.00350
16. Romesburg C. Cluster Analysis for Researchers. North Carolina. Lulu.com (2004).
17. Mechanism, and Dynamics of Bronchial Hyper-Reactivity to Methacholine in Distal Airway on Obese Patients With Asthma. ClinicalTrials.gov. Available online at: https://clinicaltrials.gov/ct2/show/NCT03102749 (accessed February 3, 2018).
Keywords: point pattern comparisons, imaging data, k-nearest neighbor curve, B-spline classifiers, CT scan
Citation: Cabon Y, Suehs C, Bommart S, Vachier I, Marin G, Bourdin A and Molinari N (2019) k-Nearest Neighbor Curves in Imaging Data Classification. Front. Appl. Math. Stat. 5:22. doi: 10.3389/fams.2019.00022
Received: 29 November 2018; Accepted: 15 April 2019;
Published: 21 May 2019.
Edited by:
Haizhao Yang, National University of Singapore, SingaporeReviewed by:
Nazeer Muhammad, COMSATS University Islamabad, PakistanCopyright © 2019 Cabon, Suehs, Bommart, Vachier, Marin, Bourdin and Molinari. This is an open-access article distributed under the terms of the Creative Commons Attribution License (CC BY). The use, distribution or reproduction in other forums is permitted, provided the original author(s) and the copyright owner(s) are credited and that the original publication in this journal is cited, in accordance with accepted academic practice. No use, distribution or reproduction is permitted which does not comply with these terms.
*Correspondence: Yann Cabon, eWFubmNhYm9uQGhvdG1haWwuY29t
Disclaimer: All claims expressed in this article are solely those of the authors and do not necessarily represent those of their affiliated organizations, or those of the publisher, the editors and the reviewers. Any product that may be evaluated in this article or claim that may be made by its manufacturer is not guaranteed or endorsed by the publisher.
Research integrity at Frontiers
Learn more about the work of our research integrity team to safeguard the quality of each article we publish.