Introduction: X-ray computed tomography (CT) is a widely used diagnostic imaging technique providing non-invasive imaging at high spatial resolution and relatively low cost[1],[2]. However, clinical CT is limited by relatively low sensitivity and soft tissue contrast[2]. Spectral CT and nanoparticle contrast agents can address these limitations and potentially enable molecular imaging with CT[3]. By imaging at energy levels above and below the K-edge of contrast agents, multiple agents can be separated based upon spectral differences. Recent advances in photon-counting detectors have made spectral CT clinically feasible[3]. Therefore, the objective of this study was to investigate the feasibility of molecular imaging with spectral CT using a photon-counting detector and nanoparticle (NP) contrast agents.
Methods: Acrylic imaging phantoms were prepared with an outer diameter of 15 mm and 5 evenly spaced wells 3 mm in diameter and 10 mm deep. Wells were filled with Au NPs,[4] gadolinium oxide (Gd2O3) NPs, and/or hafnium oxide (HfO2) NPs dispersed in water at concentrations ranging from 5 to 50 mM. Water and aluminum (Al) wire were also included to simulate soft tissue and bone tissue, respectively. Spectral CT utilized a photon-counting detector (Medipix 3), enabling four detector energy thresholds in a prototype commercial scanner (MARS Bioimaging). Tomographic reconstructions with voxel sizes of approximately 180 µm were produced using a continuous helical scan. A custom Matlab code for linear unmixing was used to separate contrast agents based on energy dependent attenuation coefficients.
Results and Discussion: The detection limit was evaluated by imaging a phantom containing Au NPs at concentrations ranging from 0 to 50 mM. Au NPs were able to be detected and discriminated from bone or soft tissue at concentrations as low as 10 mM (Fig. 1), which is suitable for use in preclinical animal models[2]. Delineation of multiple contrast agents was evaluated by imaging phantoms containing Au, Gd2O3, and HfO2 NPs ranging in concentration from 10 to 50 mM. Each NP composition was clearly delineated for phantoms containing 50 mM concentrations (Fig. 2), but images for phantoms containing 10 mM concentrations exhibited signal overlap between water and Gd2O3 NPs. Overlap was attributed to the use of four energy bands to unmix 6 endgroups and could be corrected by using 6 energy bands. The feasibility of quantitative imaging and in vivo imaging in mice is ongoing.
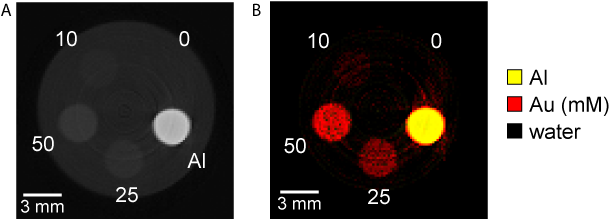
Figure 1: Representative CT image slices from an acrylic phantom containing Au NPs at concentrations ranging from 0 mM to 50 mM showing (A) a grayscale image compared to (B) a false colored image after spectral unmixing.
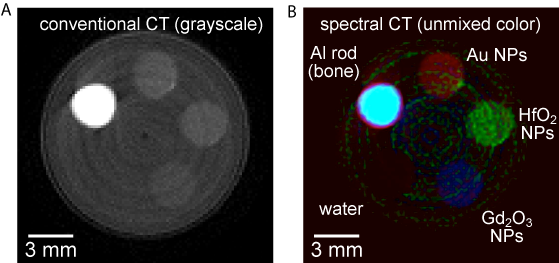
Figure 2: Representative CT image slices from an acrylic phantom containing 50 mM concentrations of Au, HfO2, and Gd2O3 NPs, as well as Al wire and water to model bone and soft tissue, respectively, showing (A) a representative grayscale image compared with (B) a false colored image after spectral umixing.
Conclusion: Spectral CT was able to detect and clearly delineate multiple contrast agents at concentrations suitable for preclinical imaging using a photon-counting detector and a linear unmixing algorithm.
References:
[1] Popovtzer R et al., Nano Lett. 2008, 8, 4593
[2] Cole LE et al., Nanomedicine. 2015, 10, 321.
[3] Anderson N et al., Eur. Radiol. 2010, 20, 2126.
[4] Ross RD et al., Chem. Mater. 2014, 26, 1187.