1
Department of Neurobiology, Weizmann Institute of Science, Rehovot, Israel
2
Department of Biomedical Engineering, Ben-Gurion University of the Negev, Beer Sheva, Israel
A recent controversy has emerged concerning the existence of long pauses, presumably reflecting bistability of membrane potential, in the cerebellar Purkinje cells (PC) of awake animals. It is generally agreed that in the anesthetized animals and in vitro, these cells switch between two stable membrane potential states: a depolarized state (the ‘up-state’) characterized by continuous firing of simple spikes (SS) and a hyperpolarized state (the ‘down-state’) characterized by long pauses in the SS activity. To address the existence of long pauses in the neural activity of cerebellar PCs in the awake and behaving animal we used extracellular recordings in cats andÃÂ find that approximately half of the recorded PCs exhibit such long pauses in the SS activity and transition between activity – periods with uninterrupted SS lasting an average of 1300ÃÂ msÃÂ – and pauses up to several seconds. We called these cells pausing Purkinje cells (PPC) and they can easily be distinguished from continuous firing Purkinje cells. In most PPCs, state transitions in both directions were often associated (25% of state transitions) with complex spikes (CSs). This is consistent with intracellular findings of CS-driven state transitions. In sum, we present proof for the existence of long pauses in the PC SS activity that probably reflect underlying bistability, provide the first in-depth analysis of these pauses and show for the first time that transitions in and out of these pauses are related to CS firing in the awake and behaving animal.
Cerebellar Purkinje cells (PC) are one of the most physically striking and enigmatic neurons in the central nervous system. The PC is the only neuron capable of generating two different forms of spikes (Bell and Grimm, 1969
): simple spikes (SS) and complex spikes (CS). The cerebellar PC has also been shown to have bistable membrane potentials in vitro (Llinas and Sugimori, 1980
; Tal et al., 2008
; Williams et al., 2002
) and recently in vivo in anesthetized animals (Loewenstein et al., 2005
; Schonewille et al., 2006
). The membrane potential of the PC has been shown to transition between a depolarized state (often referred to as the ‘up-state’) and a hyperpolarized state (often referred to as the ‘down-state’). Furthermore, the state of the membrane potential is mirrored in the SS firing rate: SSs occur solely when the PC membrane potential is in the ‘up-state’ (‘active state’) and pause their firing during the ‘down-state’ (‘pausing state’). The pausing state can last for periods ranging from several hundreds of milliseconds up to several seconds (Loewenstein et al., 2005
; Schonewille et al., 2006
). Although the existence of these long pauses in the SSs activity, presumably reflecting underlying membrane potential bistability, is unarguably observed in vitro and in anesthetized animals, their existence in the awake animal is highly controversial and is currently a matter of heated debate. On the one hand, a recent report failed to observe these long pauses in the awake animal (Schonewille et al., 2006
). On the other hand, long pauses in SS firing in awake, behaving animals have been observed, without any detailed analysis of these pauses, in the cerebella of awake mice (Servais et al., 2004
), cats (Armstrong and Rawson, 1979
; Edgley and Lidierth, 1988
; McCarley and Hobson, 1972
), monkeys (Kobayashi et al., 1998
) and recently in preliminary data from rats (Lev et al., 2006
). It is important to mention that all of these represent passing, anecdotal references to the existence of pauses and completely lack any quantification of the phenomenon, let alone a detailed analysis. The exception to this is Lev et al. (2006)
, which is a conference abstract that reflects a small sample size and limited analysis. Nevertheless, the existence of such long pauses has begun to play a key role in contemporary models of cerebellar function (Fernandez et al., 2007
; Jacobson et al., 2008
; Loewenstein et al., 2005
). The field is therefore in need of convincing proof of the existence of such pauses and a thorough analysis of their characteristics in the awake animal is required in order to settle the controversy and provide the basis for serious modeling. Another prominent issue in the current controversy revolves around the relationship of long pauses in SS activity to that of the second PC neural signature, the CS. In intracellular and extracellular recordings from anesthetized animals and in in vitro experiments, the CS can trigger a transition either from the pausing state of the PCs to its active state or vice versa (Loewenstein et al., 2005
; Schonewille et al., 2006
). This striking link between the two spiking signatures of the cerebellar PCs has never been observed to occur in the awake and behaving animals and is both surprising and difficult to explain with current cerebellar models.
To address the current controversy concerning (1) the existence of long pauses in the SS spiking activity in the awake animal and (2) their link to CSs, we recorded the extracellular neural activity of PCs in awake, behaving cats. We report the existence of such long pauses in the SS firing pattern in a large proportion of PCs, provide in-depth analysis of these pauses, and show that transitions in and out of these pauses can be related to CS. Parts of these results have appeared earlier in abstract form (Yartsev et al., 2007
).
Data was collected from two healthy cats – M (4.5ÃÂ kg) and K (6.5ÃÂ kg), both approximately 2ÃÂ years old – obtained from a certified animal facility at Weizmann Institute of Science (Rehovot, Israel). Cats were group-housed, provided with water ad libitum and food twice daily. Treatment complied with the regulations of Ben-Gurion University and the State of Israel. The experiments were approved by the University ethics committee.
Both cats underwent MRI scans (Magnetic Resonance Imaging Center at Soroka Hospital, Beer Sheva, 1.5 Tesla, Philips Intera) before and after surgery to establish desired chamber implantation and plan penetrations (Figure 1 and Movie in Supplementary Material). A recording chamber and head holder were implanted under gas anaesthesia (isoflourane, 1%) in antiseptic conditions. The recording chamber covered a craniotomy extending from the tentorium to the bony ridge on the right side of the midline, exposing the cerebellum.
Before surgery, cats were trained for a period of approximately 2ÃÂ months to sit quietly in a support frame using food reward. Cats received food mixture delivered through a tube placed near the cat’s mouth by a pump activated manually by the experimenter every 1–3ÃÂ min to ensure the animal remained awake. Regular vocalization also demonstrated wakefulness. The experimental setup is demonstrated in Figure 2 in Supplementary Material. After surgery, cats were accustomed to head restraint for 1–2ÃÂ weeks before neural recording began.
Neural activity was recorded using one to four glass coated tungsten microelectrodes (impedance 0.6–1.5ÃÂ MΩ at 1ÃÂ kHz, Alpha-Omega Engineering, Israel) inserted using microdrives (NaN Instruments, Israel) into the cerebellar cortex. The signal was amplified (×10,000), filtered (1–10,000ÃÂ Hz), digitized at 25ÃÂ kHz, and stored to disk (AlphaLab Pro, Alpha-Omega Engineering, Israel). We also recorded the TTL signal activating the feeding pump and the sound from the microphone, used to identify licking and vocalizing. We isolated neurons offline using custom Matlab (MathWorks) code developed by Beerend Winkelman and Prof. Maarten Frens (Erasmus University, Rotterdam) employing principal component analysis (Figure 3 in Supplementary Material). SSs and CSs were considered isolated from a single PC if the CS caused a statistically significant 8ÃÂ ms pause in SSs (Figure 4 in Supplementary Material).
Pausing Purkinje cells (PPC) and continuous firing Purkinje cells (CFPC) were categorized using the coefficient of variation of the inter spike interval [ISI; CVISIÃÂ =ÃÂ std (ISI)/mean (ISI)] with PPCs having CVÃÂ >ÃÂ 1. It should be emphasized that the selection of a single categorization method was not critical as other categorization methods including bi-exponential fit to the ISI histogram (see below), or testing for unimodality of the instantaneous firing rate (IFR) distribution (dip test, Hartigan, 1985
) gave identical categorization, as shown in Section ‘Results’. Pauses in PPCs were defined as ISIs above the cell’s pause threshold. Our approach for defining the pause threshold was to provide a method which would take into account the variability in baseline firing rates between different PCs rather then using a fixed threshold disregarding this variability. For example: a pause of 100ÃÂ ms might seem unusual if a cell has a baseline firing rate of 80ÃÂ Hz but is not very surprising if theÃÂ baseline firing rate is 10ÃÂ Hz. Thus, in order to determine the pause threshold on a per-cell basis, we modeled ISIs of PPCs as a mixture of two Poisson processes. The faster process, generating relatively short ISIs, is responsible for the active state, and the slower process generating the long ISIs is responsible for pausing state. Under this model, the ISI frequency should drop off as a bi-exponential:

Because the waiting time of a Poisson process has an exponential distribution, it should appear linear on a semi-log scale and the two separate Poisson processes, if they indeed exist in the data, should appear as a combination of two linear segments. We generated a semi-log plot of the number of ISIs as a function of bin size (t). The initial bin size was the median ISI time, but bins with less then 20 ISI detections were combined with successive bins so that there were at least 20 counts per bin, this in order to reduce noise in the algorithm which might arise due to bins with very low counts. A non-linear fitting routine (MATLAB, lsqnonlin) found parameters A1, A2, λ1, and λ2 that minimized the difference between the log of the function above (Eq. 1) to that of the histogram. We then selected the threshold which minimized the probability of error: the point where the two exponentials intersect. For CFPCs, the non-linear minimization routine either did not converge or converged to a solution in which both exponents were identical, implying a single Poisson process. This never occurred for the PCs classified as PPCs. For those cells, the fit was always successful and the two time constants were well separated, implying the existence of two Poisson processes. Thus, the bi-exponential analysis used to identify pauses could also be used to distinguish PPCs from CFPCs providing additional support for our categorization. We also examined (1) different absolute pause thresholds (such as 158ÃÂ ms, the longest SS ISI observed during the up-state in all intracellular recordings by Schonewille et al., 2006
), (2) different methods of extracting the threshold from the ISI histogram and (3) a definition of pauses as an unbroken sequence of ISIs above the cell’s pause threshold. In the last definition, a pause might contain an isolated spike surrounded by long ISIs. None of these variations caused a significant change in any of our results.
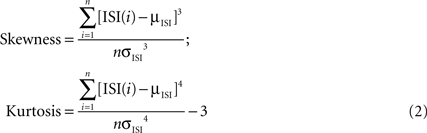
As a further comparison between the ISIs of the PPCs and CFPCs, we calculated the skewness and kurtosis of the log10 of the ISIs distribution (Schonewille et al., 2006
):
and the IFR distribution, a measure of firing rate distribution un-biased by bin size selection:

Following recent reports assessing the bimodality in PC SS activity (Loewenstein et al., 2005
; Schonewille et al., 2006
), the deviation of IFR from unimodality was tested using the dip test (Hartigan, 1985
). The dip test was calculated by sampling the IFR distribution at a number of points equal to the number of spikes generated by the test. Statistical significance was evaluated by calculating the same dip statistic on 5,000 random redistributions of the spikes over the time interval.
To evaluate the contribution of long pauses to the overall PPC firing pattern we computed the variance explained by the pauses. This variance is the total variance of the firing rate minus variance within the active state and the variance within the pauses (see formula below). Variance in firing rate during pauses was always 0 as there were no spikes during pauses:

CS relation to state transitions was examined using a peri-stimulus time histogram of CS around transitions binned at 50ÃÂ ms. Significance was tested on four bins (the bins before and after both up- and down-state transitions) whose firing rate was tested against the overall firing rate of the neuron using a z-test with a Bonferroni corrected significance of pÃÂ <ÃÂ 0.05 (pÃÂ <ÃÂ 0.0125 for each bin).
For each cell achieving significance, we measured the percentage of CS related to state transitions and state transitions related to CS using a fixed window of 60ÃÂ ms. For example, if the significant bin was the bin before the start of a pause, we counted the number of CSs that occurred in the 60ÃÂ ms before the start of a pause and divided byÃÂ the total number of CSs. Similarly, we counted the number of pauses that began within 60ÃÂ ms after a CS and divided by the total number of pauses. If the significant bin was after the start of a pause, the windows were taken in the opposite direction. Similar counts were made if significance was found before or after the end of pauses. We tested the validity of the 60ÃÂ s window width by developing an algorithm where the window was determined for each cell by determining the width in which CS firing was elevated relative to the overall firing rate (see Methods and Data in Supplementary Material).
We performed 52 recording sessions (M 35, K 17) with a total of 82ÃÂ electrodes (M 50, K 32) and recorded 38 well identified PCs (MÃÂ 22, K 16). Recordings in cat M are from vermal lobuli VI (FigureÃÂ 1 and Movie in Supplementary Material) and showed orofacial somatosensory response in agreement with previous recordings from this region (Mano et al., 1996
). In cat K, technical difficulties impeded precise localization. We estimate that our recordings were lateral-caudal to those in cat M, probably in crus II. Neurons responded during vocalizations and there was little or no response to orofacial stimulation. Neuronal recordings lasted between 130 and 790às (mean 373às). Mean SS firing rate was 47à±Ã 24àHz; mean CS firing rate was 1.3à±Ã 0.4àHz. There was almost no difference between the two cats (mean SS firing rate M/Kà=à47.6/45.9àHz, mean CS firing rate M/Kà=à1.2/1.3àHz).
Pausing and Continuous Firing Purkinje Cells Exist in the Cerebellar Cortex of the Awake Animal
Previous work in vitro and in vivo in anesthetized animals have shown that PCs often exhibit long pauses in their SS firing, strongly associated with the PC membrane potential down-state, ranging from hundreds of milliseconds up to several seconds (Loewenstein et al., 2005
; Schonewille et al., 2006
). Our primary aim was to examine whether such pauses exist in the cerebellar PCs of the awake animal. As we show below, we found many PCs exhibiting such pauses and called these cells PPCs. Other cells were always active and we called these cells CFPCs. The differences between the two groups of cells were robust and we later show that different methods of categorization produced identical categorization of the cells.
Figure 1
presents data from two PPCs (Figures 1
A,B) and one CFPC (Figure 1
C), showing the difference in firing patterns between these two groups of PCs: PPCs were constantly changing their states between active firing and long pauses. As can be seen in the rasters and raw traces presented in Figures 1
A,B this pattern of activity persisted and was not a transient change in theÃÂ activity of the PCs. In sharp contrast, CFPCs were continuously active throughout the recording session lacking long pauses in their activity [Figures 1
C(I),(II)]. A histogram of the SS IFR shows that PPCs always had a large peak near the 0 firing rate due to the long pauses in their SS firing [Figures 1
A(III),B(III)and usually (61%) had a clearly visible bimodal distribution [Figure 1
A(III)]. In some cells the second peak was harder to discern visually due to its close proximity to the large peak near the 0 firing rate [Figure 1
B(III)]. It should be noted, that the latter cells, in comparison to the cells where the second peak was clearly visible, did not exhibit unusually long pause lengths (pÃÂ >ÃÂ 0.5). Rather, the pauses occurred more frequently (pÃÂ <ÃÂ 0.005) resulting in the cell spending more time pausing (pÃÂ <ÃÂ 5eÃÂ −ÃÂ 5) which explains the larger peak near 0 firing rate. These cells also fired at a significantly lower frequency in the active state (pÃÂ <ÃÂ 0.005) which explains the proximity of the second peak to the first and makes it hard to discern by eye. Thus, in order to have an objective assessment of the nature of the distribution, we tested for bimodality in firing rates of both PPCs and CFPCs using the dip test, a statistical method that assesses the deviation of a distribution from unimodality. Using this method we found that the IFR distributions of all PPCs were significantly multimodal [Figures 1
A(III),B(III); pÃÂ <ÃÂ 0.0009]. On the other hand, no CFPC IFR histogram ever had a peak near 0 and they were all unimodal both by eye and according to the dip test [Figure 1
C(III); pÃÂ >ÃÂ 0.2]. The bimodality and unimodality in the firing rate distribution of the PPCs and CFPCs was maintained using either the IFR, a method that does not depend on arbitrary bin size selection, or by calculating the firing rate using fixed bin sizes (see Figure 5 in Supplementary Material).
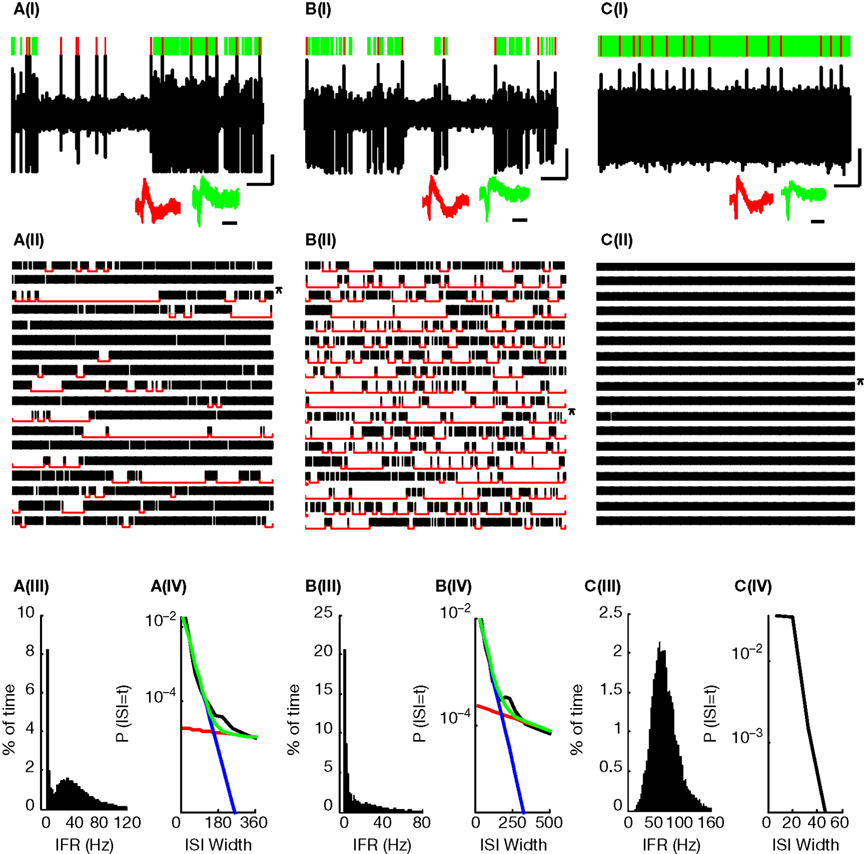
Figure 1. Three typical PCs. (A,B) PPCs; (C) CFPC. (I) 10ÃÂ s Extracellular recording trace. Lines above trace indicate SS (green) and CS (red) identifications. Insets (also in all subsequent plots) show waveforms of 50 consecutive SSs (green) and CSs (red) showing 0.5ÃÂ ms before and 3ÃÂ ms after spike detection. Vertical and horizontal black lines below the voltage trace (also in all subsequent plots) indicate 1ÃÂ mv and 1ÃÂ s, respectively and the horizontal black line below the waveforms indicates 1ÃÂ ms. (II) 180ÃÂ s Continuous raster plot (each row is of 10ÃÂ s). Raw trace in (I) is indicated by an asterix. Red lines indicate the identified pauses. (III) Distribution of the SS instantaneous firing rate (IFR), bin sizeÃÂ =ÃÂ 1ÃÂ Hz. (IV) ISI distribution of PPCs (black line) was well fit (green) as the sum of two exponential distributions presumably representing regular ISIs (blue) and pauses (red). For the CFPC, the fitting routine converged to a solution where both exponents were identical.
The bimodality of the IFR histograms led us to hypothesize that the ISIs for PPCs could be modeled as the combination of two Poisson-like processes. Indeed, we found that we were able to fit the ISI histogram of the PPCs using a bi-exponential (Eq. 1), which looks like two separate straight line segments on a semi-log plot [Figures 1
A(IV),B(IV)]. Consistent with our results of the unimodality of the CFPCs we found that the ISI histograms of CFPCs had a single exponential drop off, that is, a single line on a semi-log plot [Figure 1
C(IV)], and we did not succeed in fitting a bi-exponential to any of the CFPCs histograms.
In order to consider the differences in firing patterns of the various PPCs, we used parameter estimates from the bi-exponential fit to determine a pause threshold by minimizing the error in pause detection (see Materials and Methods). This process resulted in a per-cell pause threshold definition which considered each cell’s individual SS firing pattern used in later analysis.
Differences in Firing Patterns Between Pausing and Continuously Firing Purkinje Cells
PCs could easily be categorized as being PPCs or CFPCs by several methods all resulting in identical categorization. (1) A bi-exponential fit to the ISI histogram: cells for which the fit produced two distinct exponentials were PPCs and the rest were CFPCs. (2)ÃÂ The CV value of the ISIs: The CV of the ISIs was >2.4 for all PPCs and <0.9 for all CFPCs (Figure 2
). Across the population, CV values were 2.07à±Ã 0.32 (meanà±Ã SEM), in agreement with a recent report (Shin et al., 2007
). (3) The dip test: for all PPCs, the test rejected the possibility of a unimodal IFR distribution (pà<à0.025 for two cells and pà<à0.0005 for all the rest) whereas for all CFPCs, the IFR distribution was consistent with unimodality (pà>à0.05 for all tests). By either method the same 47% (18/38) of our PCs were categorized as PPCs and the rest as CFPCs. Similar ratios were obtained from both cats (Mà10/22, 45%; K 8/16, 50%). Using the Wilson Score to determine a one sided confidence interval, this allows us to say with 90% confidence that the number of pausing PCs in the cerebellar cortex is at least 34%. Recording times were similar for the two groups: 362à±Ã 188às (meanà±Ã STD) for PPCs and 383.2à±Ã 185.2às for CFPCs. Independently of all methods specified above, the same categorization could also be obtained visually (as seen in Figure 1
).
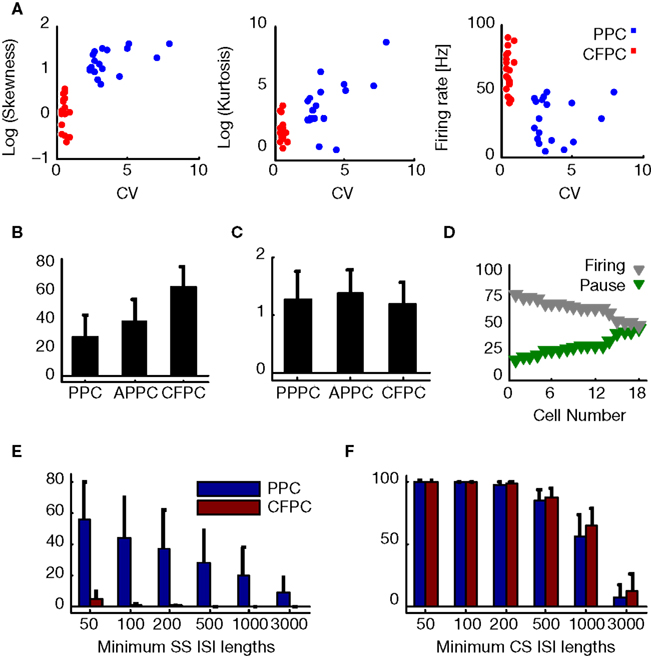
Figure 2. (A) Skewness and kurtosis (Eq.2) and firing rate against CV for PPC (blue) and CFPC (red). (B) SS firing rates for PPC overall, PPC active state (APPC), and CFPC. (C) CS firing rate for PPC during pauses (PPPC), PPC during active state (APPC), and CFPC. (D) Percentage of variance explained by pauses (green) and active state firing (gray) for all PPCs, sorted by increasing percentage of pause variance. (E) Fraction of time neurons spent in pauses plotted against various pause thresholds (PPCs: blue, CFPCs: red). Error bars represent std. (F) Analysis in (E) applied to CS.
Other measures distinguished PPCs and CFPCs statistically. InÃÂ agreement with recent findings in anesthetized animals (Schonewille et al., 2006
), the ISI distribution of PPCs had larger skewness and kurtosis and lower firing rates (Figure 2
A; pÃÂ <ÃÂ 0.001 for all tests). SS firing rates during PPC active states were also lower then CFPC firing rates (Figure 2
B; pÃÂ <ÃÂ 5eÃÂ −ÃÂ 5). Differences in firing rate for the CSs did not reach significance (Figure 2
C; pÃÂ >ÃÂ 0.12, Bonferroni corrected). Also, PPCs spent a significantly larger fraction of time in long ISIs than CFPCs (pÃÂ <ÃÂ 1eÃÂ −ÃÂ 5, Sidak-Holm correction; Figure 2
E), mirroring findings in anaesthetized animals (Schonewille et al., 2006
, Figure 1E). CFPC ISIs were usually <200ÃÂ ms whereas those of PPC often were as long as several seconds. There was no difference in the CS ISIs between the two groups (Figure 2
F; pÃÂ >ÃÂ 0.35). Variance in the SS activity explained by pauses ranged from 19.2 to 48.9% (mean of 32.7%; Figure 2
D) indicating that pauses were significant in the overall activity of these cells but that the variation in the up-state firing rate was at least as significant. PPC pause thresholds determined using our algorithm averaged 189.8à±Ã 64.5àms (meanà±Ã STD), and mean pause length averaged 701.2à±Ã 329.3àms (meanà±Ã STD). Pause frequency was 0.54à±Ã 0.23àHz (meanà±Ã STD across cells), and the amount of time neurons spent pausing varied from 9.5 to 86.7% (median 28.1%). Active states had average durations of 1,357.3à±Ã 995àms (meanà±Ã STD). There was no significant difference between the two cats in any of these parameters (pà>à0.2 for pause thresholds, pà>à0.5 for mean pause lengths, pà>à0.5 for pause frequencies, pà>à0.2 for the amount of time spent in pause, pà>à0.15 for the mean active state duration).
Linking Complex Spikes and State Transitions
In vitro and in anesthetized animals, state transitions can occur spontaneously, and it has recently been shown that mossy-fiber input can shift PCs to the up-state via direct excitation from granule cells and to the down-state by indirect inhibition via molecular layer interneurons (Jacobson et al., 2008
). In addition, the CSs have also been shown to trigger both down–up and up–down-state transitions. However, this phenomenon has thus far been observed exclusively in vitro and in anesthetized animals (Fernandez et al., 2007
; Loewenstein et al., 2005
). We explored whether this intriguing connection between the CS spiking and SS pausing also exists in the awake animal. We found that up–down and down–up transitions in PPCs often occurred in close conjunction with CSs. Figure 3
A demonstrates this in an extracellular voltage trace, and Figure 3
B shows the cell’s CS activity aligned on the two directions of state transition (beginning of a pause – up–down – and end of a pauseÃÂ – down–up). The strength of the relation between (1)ÃÂ the probability of a state transition to occur near a CSs and (2) the probability of a CS to occur near a state transition was found to beÃÂ much higher then what would be expected at random for a range of time windows surrounding these events (Figure 3
C). Overall, 72.2% of PPCs (13/18) showed a significant increase in CSÃÂ occurrences around either up–down or down–up transitions. Of these, more than half (53.85%) showed a significant increase in CS occurrences around both up–down and down–up transitions. The rest were related exclusively to the up–down transition (30.75%) or down–up transitions (15.4%). To assess the strength of this phenomenon, we used a fixed window of 60ÃÂ ms in the direction of the significant bin in the crosscorrelation. We calculated the percent of transitions near CS and the percent of CSs near transitions (Figures 4
A,B, respectively). Overall, 25à±Ã 2.9% (meanà±Ã SEM) of state transitions occurred in close conjunction with CS events, compared with 6% for the randomized data (aàsignificant difference, Figure 4
A, pà<à5eà−à7). 12à±Ã 2.1% of all CSs (meanà±Ã SEM) were associated with state transitions. This percentage is higher then the mean value of 3% obtained for the randomized data (Figure 4
B) and significantly different from random for all cells (pÃÂ <ÃÂ 5eÃÂ −ÃÂ 4). We tested this analysis by developing an algorithm that identified for each cell the optimal window in which CSs and state transitions can be considered related (see Methods and Data in Supplementary Material). Using the algorithm we obtained qualitatively identical results with no significant difference (see Figure 8 in Supplementary Material).
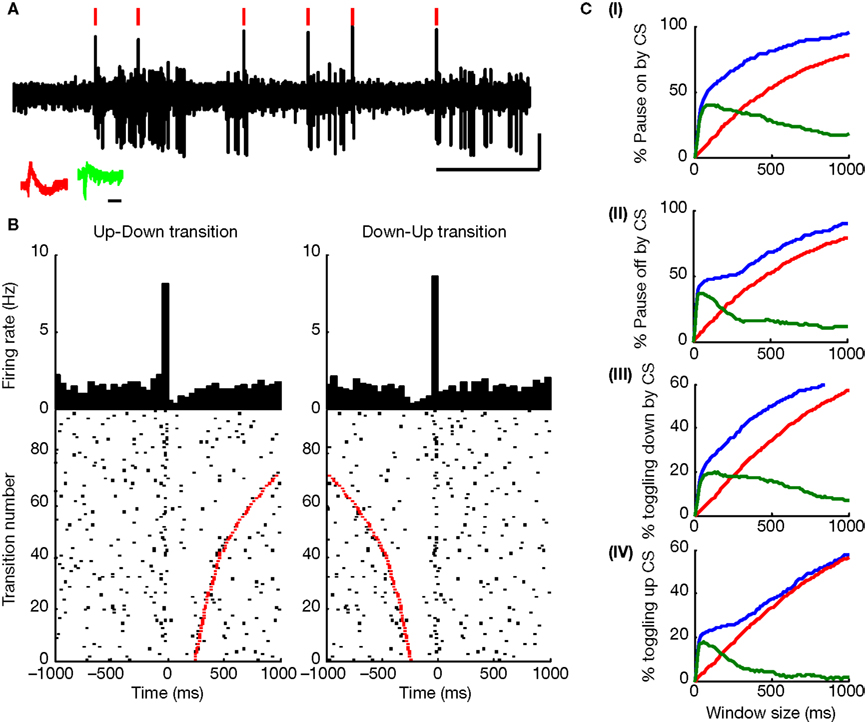
Figure 3. (A) 5ÃÂ s Extracellular voltage trace showing CSs (red lines) near state transitions. (B) The same cell, with CSs aligned to up–down (left) and down–up (right) state transitions. Red dots show pause end (left) or beginning (right). Raster shows every fourth state transition to ease visualization (Figure 7 in Supplementary Material shows all transitions). Raster is sorted by pause length (red dots). (C) Plots showing the percentage of pause (I) onsets and (II) offsets related to CSs, and the percentage of CS related to transitions to the (III) down and (IV) up states as a function of window size, as observed for the original data of this cell (blue curve) in comparison to what would be expected by random (red curve). Green curve indicates the difference between the blue and red curves showing that the increased probability for state transitions to occur near CSs and vice versa does not depend on a highly specific window size, but rather holds for a range of window sizes.
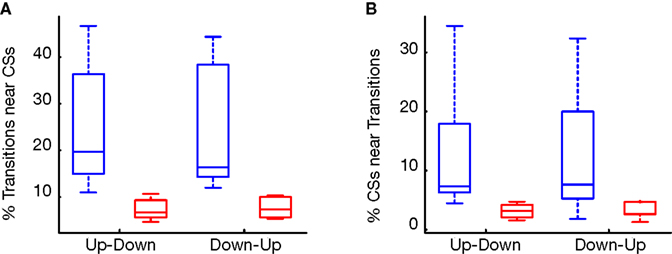
Figure 4. (A) Percentage of transitions near CSs (blue) compared to random (red). (B) Percentage of CSs related to transitions (blue) compared to random (red).
Thus, in agreement with recent data from anesthetized animals (Loewenstein et al., 2005
; Schonewille et al., 2006
) we find that many of the state transitions are closely related to CS events and vice versa.
Long pauses in SS activity were evident in half of the cells we recorded in non-anesthetized cats. PPCs repeatedly transitioned between active firing and long pauses whereas CFPCs did not pause. The two PC categories were well separated on coefficient of variation, bi-exponential fit to the ISI histogram, and bimodality of the IFR suggesting that the categories are not artifacts of any particular data analysis. Because our recordings were from awake and behaving animals, an alternative explanation that these pauses were simply the result of synaptic inhibition due to behavioral events, a well known feature in the central nervous system (Kandel et al., 2000
), must be considered. However, we can exclude this possibility because although the behavioral events elicited neural responses in the majority of cells in both the PPC and CFPC groups, we never observe a shift in category or an obvious disruption of the cell’s activity (see Figure 6 and Data in Supplementary Material). That is, pauses in SS activity were distinct from behavioral modulation of firing rate: PPCs continued to transition in and out of pauses both during behavioral events and in their absence and CFPCs didÃÂ not change their continuous firing pattern. Finally, we observed none of the high frequency bursts of neural activity associated with injured cells in any of our PCs. Taken together with a lack of difference between the PPC and CFPC groups in (1) CS firing rates, (2) recording duration, (3) stability of the spike waveforms, and with the fact that CSs continued to occur regularly during the SS pauses, we are confident that our results were not biased by unstable recording or recordings of injured cells.
Can the pausing behavior we observed be the result of the underlying PC membrane potential bistability previously reported both in vitro as well as in vivo in anesthetized animals? First, it should be emphasized that the question of bistability in the awake animals is in its essence a question of the PC membrane potential state and can thus only be truly solved using stable intracellular recordings in the awake animal, a technically complicated matter. Yet, two arguments lead us to believe that extracellular recording can provide a good answer to this question. First, recent findings have shown that the state of the PC membrane potential can be reliably deduced from the temporal pattern of the extracellulary recorded SS activity. This is because (1) simultaneous intracellular and extracellular recording of SSs and CSs showed a perfect match as every SS and CS recorded intracellular corresponded to a matching single spike in the extracellular voltage trace (Schonewille et al., 2006
), and (2)ÃÂ SSs occur during the membrane potential up-state and cease to occur during the down-state (Loewenstein et al., 2005
; Williams et al., 2002
) and are thus a reliable indicator of the state of the membrane potential. Second, cerebellar PC bistability has several distinctive features which can be evaluated in extracellular recordings. Comparing these traits between the PCs SS pausing behaviour to its intracellular parallel, obtained recently from anesthetized animals, lead us to believe that the pausing behaviour we observed might reflect underlying PC membrane bistability: (1) the most prominent feature of bistability is the existence of long pauses in SS firing interleaved with active periods, in agreement with our observations in the PPCs, (2) in contrast to the SS long pauses and in agreement with recent findings on bistability, the CS firing rate did not change during the pauses, nor did the CS exhibit unusually long pauses in their activity, (3) PC bistability is unique in that the SS pauses, caused by the membrane potential down-state, often occur in close conjunction with CSs, and in our data over 25% of state transitions occurred near CSs, much higher then what would be expected by random, (4) we observed pauses that lasted around 700ÃÂ ms, consistent with the time scale of pauses observed intracellular in vivo under isolfurane anesthesia (800ÃÂ ms by Schonewille et al., 2006
) and only slightly lower then the values reported under ketamine/xylazine anesthesia (1200ÃÂ ms by Schonewille et al., 2006 and 1500ÃÂ ms by Loewenstein et al., 2005
), (5) the mean duration of the active states we observed were 1350ÃÂ ms, consistent with the average values obtained intracellular in vivo under both forms of anesthesia (1100ÃÂ ms using isolfurane by Schonewille et al., 2006 and 1450 using ketamine/xylazine by Loewenstein et al., 2005
). Thus, it would appear reasonable to speculate that the pauses we observed in the awake animal reflect the underlying bistability in the PC membrane potential.
Our findings contrast with a recent report in mice that sought pauses in awake animals (Schonewille et al., 2006
), but we are in agreement with recent results obtained in vivo both in anesthetized rats and guinea pigs as well as with preliminary observations obtained in rats, where long pauses in SS activity have been observed (Lev et al., 2006
; Loewenstein et al., 2005
). The discrepancy between Schonewille’s results and other researchers is hard to explain. It might reflect differences in experimental procedures and/or different recording locations, but we believe that the most probable explanation for this discrepancy resides in the species difference: Schonewille’s data is from mice whereas our results were obtained from cats. This claim is bolstered by the fact that Schonewille et al. (2006)
results under ketamine/xylazine anesthesia, where pausing is not disputed, were dramatically different from recent findings obtained from rats and guinea pigs using the exact same anesthetic procedures (Loewenstein et al., 2005
). Specifically, Loewenstein reported pausing in 100% (24/24) of PCs, Schonewille reported only 60% (6/10). Moreover, the percentage of time the membrane potential was hyperpolarized in Schonewille was reported to be 3à±Ã 2% in contrast with 52à±Ã 4% reported by Loewenstein. Thus, Schonewille’s results in mice were generally much lower then in other species which suggests that the generality of Schonewille et al. (2006)
results to other species is questionable.
What might be the functional role of the long pauses in the behaving animal? We found that a significant fraction of SSs firing rate variance was explained by the pauses. However, we did not find a link between the behavioral events that drove variation in the SS firing rate in our cells and the pauses. However, we also did not find a correlation between the CS firing rate and the behavioral events. As we have shown here, over 25% of state transitions were closely related to CSs. This percentage is well above what would be expected by chance, but cannot be taken as evidence either for or against a causal relationship. One possibility is that our behavioral setup simply did not require the functional role of the pauses mediated by the CSs. If so, we would predict that a task that causes changes in the rate of CS firing will also cause correlated changes in the rate of pausing. Indeed, in a recent paper where the modulation of state transitions by sensory events were examined in the anesthetized animal, an air puff stimulation eliciting an increase in CS firing rate resulted in a dramatic increase in state transition aligned on the air-puff. In that work, over 66% of elicited CSs caused state transitions (Loewenstein et al., 2005
). This indicates that pauses in the SS firing may have important functional roles.
The current prevailing hypothesis of cerebellar function suggests that the cerebellar output through the deep cerebellar nuclei (DCN) is determined by the PC SS and that the CS serve as a teaching signal (Kandel et al., 2000
). A current problem with this theory is that the high firing rate and powerful convergence from the PC layer to the DCN means that DCN neurons are bombarded with an enormous amount of inhibitory input (Ito, 1984
). It is possible that long pauses in PCs cause sudden and powerful reductions in this inhibition, leading to release firing of the DCN. This would be especially true if there is synchronization of SS pauses within cerebellar microzones (Andersson and Oscarsson, 1978
; Sugihara et al., 1999
): a small cluster of neurons in the inferior olive (IO) can generate nearly simultaneous CS throughout the extent of a single cerebellar microzone, and thus CS firing could lead to synchronous pause onset and offset in the cerebellar cortex microzone which in turn will either silence or activate a single DCN. The outcome of such a process across the entire cerebellar output might result in a simple temporal pattern from the cerebellum outward. An alternative theory suggests that long pauses in SS activity are crucial for cerebellar timing but via a different mechanism. This theory, based largely on the complex patterns of synchrony that can develop in the IO network, suggests a reversal of roles between the cerebellar cortex and the IO, the model suggests that long pauses in SS firing pattern reconfigure the IO network through the DCN enabling the generation of temporal patterns in the olivary output (Jacobson et al., 2008
).
In sum, we found PCs in the cerebellar cortex of awake cats exhibiting long pauses in their firing rate and provided the first in-depth analysis of these pauses. We also reported here, for the first time in the awake animal, the modulation of the PC SS state transition by CS events. Further work is needed, specifically involving intracellular recording from the PC of awake animals, to provide conclusive evidence of whether the pauses we observed are due to the underling bistability of the PC membrane potential. Future work aimed directly at addressing the role of these pauses in mediating behavior, specifically involving simultaneous recordings from multiple PCs and from cerebellar cortex and DCN, is required to decipher the function of these pauses in mediating cerebellar output in the awake and behaving animals.
Michael M. Yartsev: experimental design, experimental procedures, data collection, data analysis, and writing of the manuscript; Ronit Givon-Mayo: experimental design, experimental procedures and data collection; Michael Maller: experimental procedures and data collection; and Opher Donchin: experimental design, experimental procedures, data analysis, and writing of the manuscript.
The authors declare that the research was conducted in the absence of any commercial or financial relationships that could be construed as a potential conflict of interest.
We would like to thank Beerend Winkelman and Prof. Maarten Frens for the use of their spike sorting software. The staff of the Soroka MRI facility – particularly Assaf Kreh and Dr. Ilan ShelefÃÂ – were tirelessly helpful in imaging and image processing. Akiva Feintuch not only helped with the MRI but also helped us prepare the movies showing the MRI data. Dr. Shira Ovadia provided veterinary oversight and helpful scientific and technical suggestions. We would like to thank Dr. Dana Cohen, Ido Lev, Dr. Yonatan Loewenstein and Prof. Yosef Yarom for useful commnets and insight and Prof. Maarten Frens, and Dr. Fernando Fernandez for their careful reading and insightful comments on early versions of the manuscript. This work was supported the National Institute for Psychobiology, and the ISRAEL SCIENCE FOUNDATION (Grant No. 624/06).
The Supplementary Material for this article can be found online at http://www.frontiersin.org/systemsneuroscience/paper/10.3389/ neuro.06.002.2009
.
Schonewille, M., Khosrovani, S., Winkelman, B. H., Hoebeek, F. E., DeÃÂ Jeu, M. T., Larsen, I. M., Van der Burg,ÃÂ J., Schmolesky, M. T., Frens,ÃÂ M.ÃÂ A., and De Zeeuw, C. I. (2006). Purkinje cells in awake behaving animals operate at the upstate membrane potential. Nat. Neurosci. 9, 459–461; author reply 461.