Computational morphometry for detecting changes in brain structure due to development, aging, learning, disease and evolution
Structural Brain Mapping Group, Department of Psychiatry, University of Jena, D – 07743 Jena, Germany
The brain, like any living tissue, is constantly changing in response to genetic and environmental cues and their interaction, leading to changes in brain function and structure, many of which are now in reach of neuroimaging techniques. Computational morphometry on the basis of Magnetic Resonance (MR) images has become the method of choice for studying macroscopic changes of brain structure across time scales. Thanks to computational advances and sophisticated study designs, both the minimal extent of change necessary for detection and, consequently, the minimal periods over which such changes can be detected have been reduced considerably during the last few years. On the other hand, the growing availability of MR images of more and more diverse brain populations also allows more detailed inferences about brain changes that occur over larger time scales, way beyond the duration of an average research project. On this basis, a whole range of issues concerning the structures and functions of the brain are now becoming addressable, thereby providing ample challenges and opportunities for further contributions from neuroinformatics to our understanding of the brain and how it changes over a lifetime and in the course of evolution.
“It is tempting to take the volume of the brain, or the number of neurons in it, as a measure of its efficiency. Also, the relative sizes of various subdivisions of the brain in different animal species (and even in individual human beings) are sometimes taken as indicating different attitudes or different proficiencies in various performances. These claims usually do not go much beyond the journalistic level.”
Valentino Braitenberg (2007)
The central nervous system is a complex entity with an evolutionary history of over half a billion years that processes humongous amounts of internal and external information across multiple orders of magnitude in time and space. Consequently, a profound understanding of brain structures and functions (and changes thereof) across scales can only be achieved by integrating insights from a range of experimental and theoretical approaches, which poses a considerable challenge for both the generators and analyzers of the underlying data. From this perspective, Magnetic Resonance (MR) techniques are of particular interest, since their nature as a macroscopically observable ensemble property of essentially subatomic origin makes them suitable as a bridge between scales in space and time and applicable almost uniformly across biological systems, living or not.
Brain morphometry (also known as computational neuroanatomy or, particularly in the earlier literature, neuromorphometry) is concerned with the quantification of anatomical features, and changes thereof, in individual brains or brain populations. These structural changes take place on longer time scales than changes in brain function, which makes them robust indicators in clinical diagnostics of full-fledged disease but challenging in early stages.
A brain morphometric study consists of two major components: First, a spatial representation of the brain or its components is obtained by repetitive application of some non-invasive neuroimaging technique (for an overview of the available options, see Kim and Zee, 2007
). This can be done with a number of different brains (a so-called cross-sectional study) or with one brain at several points in time (a longitudinal study). Under some conditions (most notably for progress monitoring in patients), longitudinal studies are imperative but for many purposes (especially changes that occur on time scales longer than a research project) cross-sectional studies can provide supplementary information whose value outweighs the effects of the additional source of error provided by interindividual variance. Second, the morphometric measures can then be extracted from the image series and statistically analyzed, typically in the framework of a group comparison (for a comprehensive treatise, see Toga and Mazziotta, 2002
).
The quantification of brain structural changes in time series of Magnetic Resonance (MR) images has previously been reviewed in detail, most notably by Toga and Thompson (2003)
. Building on this foundation, we will provide an outline of more recent developments and highlight that, while the current focus of brain morphometry clearly is on clinically relevant changes, the computational approaches can also generate new insights into development, aging, learning and evolution. Their integration with findings based on different methodologies and model systems provides ample challenges and opportunities on the way to an improved understanding of the relationships between brain structure and function. That these relationships are not obvious, is illustrated by Braitenberg’s (2007)
comment.
Magnetic Resonance Imaging
Magnetic Resonance (MR) is the selective absorption, by some atomic nuclei, of electromagnetic radiation at a frequency dependent upon the magnetic field strength they experience. Dedicated protocols (MR pulse sequences) that vary these electromagnetic fields in a precise manner across space and time allow to record the three-dimensional distribution of these nuclei and some properties of their physicochemical environment, particularly the relaxation constants T1 and T2 (Dawson and Lauterbur, 2008
).
Image contrast can then be generated for specific purposes on the basis of a selected subset of these properties, e.g. blood oxygenation for functional MR imaging (Ogawa and Sung, 2007
), diffusion for nerve fiber tracking (Hagmann et al., 2006
), and tissue magnetic susceptibility (Haacke et al., 2009
) or – most relevant to brain morphometry – relaxation characteristics for differentiating between different types of brain tissue (Mikulis and Roberts, 2007
; Roberts and Mikulis, 2007
). Albeit approaches based on T2 or other contrasts and combinations thereof are gaining ground along with the spread of high-field MR imaging systems (Willinek and Kuhl, 2006
; Conklin et al., 2008
; Bandettini, 2009
), MR-based brain morphometry is usually performed on the basis of T1-weighted imaging data (van der Kouwe et al., 2008
), on which we will concentrate here.
In the wake of a wider availability of high-quality T1-weighted MR images of diverse brain populations, MR-based brain morphometry has gained considerable momentum over recent years. Even within a given class of MR imaging protocols, however, details of the implementation can confound any analysis and have to be taken into account (for studies comparing different T1-weighted pulse sequences, see Segall et al., 2009
; Tardif et al., 2009
).
As implied by Braitenberg (2007)
, measures on the whole-brain scale, e.g. the volume of the brain, or the total number of neurons in it
1
, are the result of many different processes and will rarely reflect specific proficiencies. Nonetheless, if two subjects (or the same subject, measured on several occasions) consistently differ in their proficiencies in various performances, it is hard to imagine how they could be structurally identical across all of their levels of brain organization.
Taking advantage of the relatively high spatial resolution with respect to other in vivo neuroimaging techniques, MR-based brain morphometric measures now typically used are of a local nature – e.g. the volume or thickness of the cerebral cortex in a specific part of a gyrus, or the local extent of the cortical convolutions (i.e. gyrification) – and analyzed within a larger region of interest or even across the whole brain. Indeed, it is often a whole-brain pattern of local-level structural changes that distinguishes between groups of participants in a study or correlates with other measures of interest. These measures are predominantly demographic but can, in principle, be any quantifiable phenotype hypothesized to be reflected in morphology, e.g. clinical diagnosis, medication or genotype. While many of these also modulate brain function, morphometric measures are more stable over time.
Preprocessing of MR Images for Brain Morphometry
As pointed out above, MR images are generated by a complex interaction between static and dynamic electromagnetic fields and the tissue of interest, i.e. the brain that is encapsulated in the head of the subject. Hence, the raw images contain noise from various sources – namely head movements (a scan suitable for morphometry typically takes on the order of 10 min) that can hardly be corrected or modeled, and bias fields (neither of the electromagnetic fields involved is homogeneous across the whole head nor brain) which can be modeled (Vovk et al., 2007
).
In the following, the image is segmented into non-brain and brain tissue, with the latter usually being sub-segmented into at least gray matter (GM), white matter (WM) and cerebrospinal fluid (CSF; for a review of available segmentation methods, see Pham et al., 2000
, see also Figure 1
). Since image voxels near the class boundaries do not generally contain just one kind of tissue, partial volume effects ensue that can be corrected for (Van Leemput et al., 2003
).

Figure 1. Image segmentation using a priori information. In the first step, the image intensities of the T1 image (upper left) are used to plot their frequencies in a histogram. Several peaks – corresponding to different image intensities of the tissue classes – can be differentiated. In the next step, gaussian curves for each tissue class are fitted into the histogram to estimate the probability of a voxel belonging to that tissue class (bottom left). A map for gray matter is shown (upper right) with the estimated probability for two selected locations (red circles). Based solely on a similar image intensity, the cerebral and the extracranial spot exhibit a similar probability for belonging to gray matter. This can be corrected by combining the image intensity-based information with prior information (below), e.g. using a Bayesian approach.
For comparisons across different scans (within or across subjects), differences in brain shape are usually eliminated by registering the individual images to the stereotactic space of a template brain (Talairach and Tournoux, 1988
; Evans et al., 1993
). This registration process also often involves a normalization of brain size, though this is not always desirable (e.g. when cortical thickness is of interest). Registration can be performed using low-resolution (i.e. rigid-body or affine transformations) or high-resolution (i.e. highly non-linear) methods (for review, see Crum et al., 2004
), and templates can be generated from the study’s pool of brains (e.g. Ashburner, 2007
), from a brain atlas (e.g. Rohlfing et al., 2008
) or a derived template generator (e.g. Wilke et al., 2008
).
Both the registered images and the deformation fields generated upon registration can be used for morphometric analyses, thereby providing the basis for Voxel-Based Morphometry (VBM) and Deformation-Based Morphometry (DBM). Images segmented into tissue classes can also be employed to convert segmentation boundaries into surface representations, the analysis of which is the focus of Surface-Based Morphometry (SBM). In the next section, we will briefly describe these three approaches to extract morphometric features from MR images.
Computational Approaches to Local Brain Morphometry
Voxel-based morphometry
After the individual images were segmented, they are registered to the template. Each voxel then contains a measure of the probability, according to which it belongs to a specific segmentation class. For gray matter, this quantity is usually referred to as gray matter density (GMD) or gray matter concentration (GMC), or gray matter probability (GMP).
In order to correct for the volume changes due to the registration, the gray matter volume (GMV) in the original brain can be calculated by multiplying the GMD with the Jacobian determinants of the deformations used to register the brain to the template. Class-specific volumes for WM and CSF are defined analogously.
The local differences in the density or volume of the different segmentation classes can then be statistically analyzed across scans and interpreted in anatomical terms (e.g. as gray matter atrophy). Since VBM is freely available for many of the major neuroimaging software packages (e.g. FSL
2
and SPM
3
), it provides an efficient tool to test or generate specific hypotheses about brain changes over time.
Deformation-based morphometry
In DBM (cf. Figure 2
), highly non-linear registration algorithms are used, and the statistical analyses are not performed on the registered voxels but on the deformation fields used to register them (which requires multivariate approaches) or derived scalar properties thereof (which allows for univariate approaches; for overview, see Chung et al., 2001
; Gaser et al., 2001
). One common variant – sometimes referred to as Tensor-based morphometry (TBM) – is based on the Jacobian determinant of the deformation matrix (Lepore et al., 2008
).
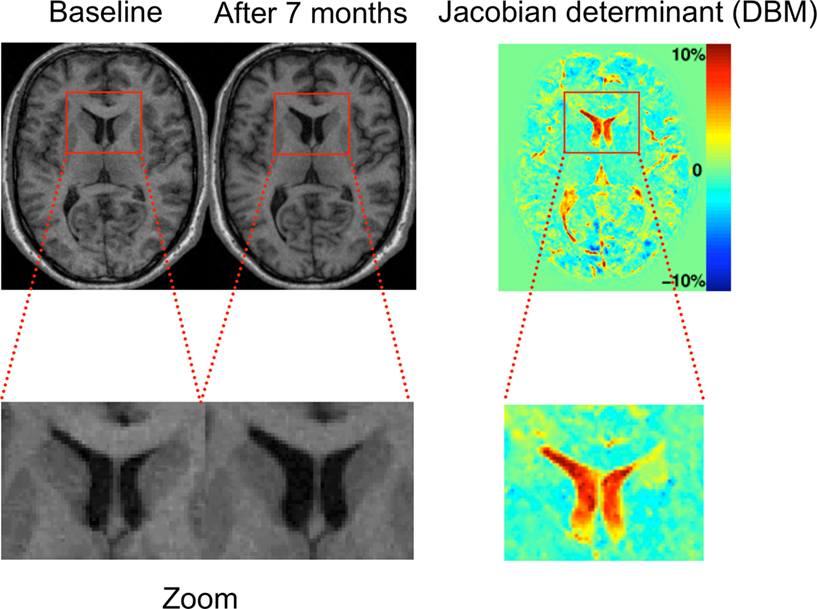
Figure 2. The principle of deformation-based morphometry (DBM). Left: This example shows two T1 images of a male patient with schizophrenia at his first episode and after 7 months. In the close-up views at the bottom, the enlarged lateral ventricles at the second time point can be clearly seen. The principle of DBM is to warp the second scan to the baseline scan by introducing high-dimensional deformations. Once this is achieved, the differences between both images are encoded in the deformations applied for the warp. These deformations can then be used to calculate volume changes by way of the Jacobian determinant (right image).
Of course, multiple solutions exist for such non-linear warping procedures, and to balance appropriately between the potentially opposing requirements for global and local shape fit, ever more sophisticated registration algorithms are being developed (Holden, 2008
). Most of these, however, are computationally expensive if applied with a high-resolution grid. Furthermore, DBM and VBM can be considered a continuum in terms of the resolution of image registration algorithms, and so it is difficult to delineate a clear boundary between the two in practice, despite important differences in the underlying theoretical frameworks (Ashburner, 2007
). Due to the vast variety of registration algorithms, no widely accepted standard for DBM exists, even though a number of stand-alone tools (e.g. MNI_AutoReg
4
) or toolboxes for some neuroimaging software packages (e.g. SPM) are freely available.
Surface-based morphometry
Surface-based morphometry (SBM) involves the creation of a surface representation (i.e. a mesh) of structural boundaries defined by or on the basis of the segmentation of a brain. This does not always require registering the individual brain images to a template brain, though comparisons across brains demand a reference surface that belongs to the same topological genus (i.e. 0) and is normalized in size. The brains are thus mapped to a reference surface (typically a unit sphere) on which their original properties can be compared with each other, and results are mapped back to a reference brain surface.
The surfaces most appropriate for cortical analyses are the boundaries between WM and GM or between GM and CSF (the latter is also often referred to as pial surface, since the pia mater is not commonly segmented into a class of its own) but various representations of the so-called central surface (roughly corresponding to the anatomical lamina IV) are also in use. For some subcortical structures (e.g. the hippocampus or basal ganglia), appropriate surfaces can be defined in a similar way, while lateral delineation of the corpus callosum, for instance, is difficult.
Statistical analyses in SBM are based on properties of the individual mesh elements and aggregations thereof. These latter ones include, foremostly, some measure of the distance between different surfaces – typically the cortical thickness (e.g. Salat et al., 2004
) – or sulcal depth but also some local or global measures of surface area (e.g. Panizzon et al., 2009
, here shown not to be correlated with cortical thickness in a large sample of adult male–male twin pairs), curvature (e.g. gyrification; cf. Van Essen et al., 2006
) or overall shape (e.g. via spherical wavelets, spherical harmonics or Laplace-Beltrami spectra, cf. Niethammer et al., 2007
). In the following, we will concentrate on gyrification (also known, e.g., as cortical folding, cortical convolution, cortical complexity, fissuration or fissurization), a rather stable property of a given brain, suitable for comparisons across long time spans.
Gyrification refers to both the process and the extent of folding of the mammalian cerebral cortex as a consequence of brain growth during embryonic and early postnatal development. In the process (also known as gyrogenesis), gyri (ridges) and sulci (fissures) form on the cortical surface. A low extent of gyrification in a given brain is commonly referred to as lissencephaly (which may range from agyria, the total absence of folding, to pachygyria, a reduced extent of folding), while gyrencephaly describes a high degree of folding (Francis et al., 2006
).
The degree of folding can be quantified in multiple ways (cf.Pienaar et al., 2008
; Rodriguez-Carranza et al., 2008
): Currently the most popular is the slice-based gyrification index (GI; Zilles et al., 1988
, see also Figure 3
). It involves tracing the contour of the brain’s surface either by going into the sulci (like the pia mater; complete contour) or by bridging sulci (like the arachnoid mater; outer contour) and is defined as the ratio between the complete and the outer contours within a given slice. Consequently, the more folded a surface, the higher its GI. The GI can be averaged across slices and even across image orientations but it cannot quantify local curvature, while some mesh-based measures can – an example is the generalization of the GI from slice-based to surface-based contour ratios, as illustrated in Figure 3
.
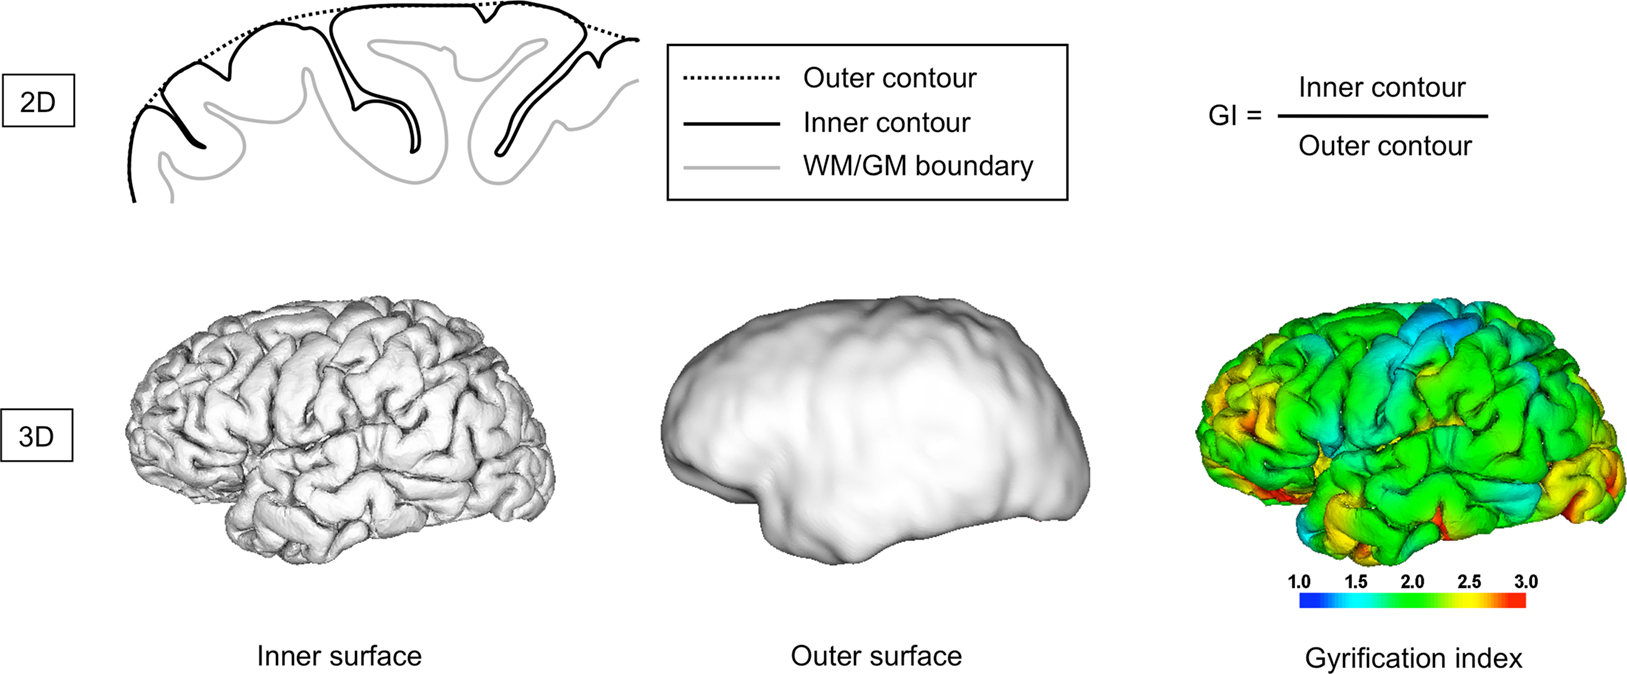
Figure 3. Estimation of gyrification. The traditional gyrification index can be calculated as the ratio between the outer and inner contour of the cortex in coronal slices (upper row). This allows to approximate the global degree of gyrification or convolution. More recently developed gyrification measures extend this idea to 3D, e.g. by replacing the ratio of outer and inner contours by the ratio of outer and inner surface area (which allows the local estimation of gyrification, bottom row), or by using other measures of contour, shape or curvature.
Automation of SBM is a field of active research, and even though some surface-based atlases (e.g. Van Essen and Dierker, 2007
; Rohlfing et al., 2008
) and software packages exist (e.g. Caret
5
, FreeSurfer
6
, BrainVISA
7
, AFNI SUMA
8
and the commercial BrainVoyager
9
) that provide, in principle, for an automated generation, analysis and visualization of brain surface meshes and that perform reasonably well on individual brains of healthy adult humans (e.g. Lyttelton et al., 2009
), they are generally computationally demanding, and manual interaction is often required to allow for surface-based comparisons (e.g. Nordahl et al., 2007
, particularly of brains that differ considerably in size).
Brain changes generally affect several levels of organization in the brain – particularly the cellular one – whose individual contributions are hard to disentangle at the spatial scales currently employed by MR-based morphometry. The qualitatively largest changes within an individual occur during early development and more subtle ones during aging and learning, whereas pathological changes can vary highly in their extent, and interindividual differences increase both during and across lifetimes. MR imaging has been applied to ever more brain populations relevant to all of these time scales, both within humans and across species, and the above-described morphometric methods provide the means to analyze such changes quantitatively on spatial scales in the millimeter range (thus covering large numbers of cells, usually belonging to different cell types).
Currently, most applications of MR-based brain morphometry have a clinical focus (Mazziotta et al., 2000
; Toga and Thompson, 2003
), i.e. they help to diagnose and monitor neuropsychiatric disorders, in particular neurodegenerative diseases (like Alzheimer) or psychotic disorders (like schizophrenia). In this section, we will shift the emphasis from clinical to non-clinical studies and indicate how they complement each other. To balance between depth and breadth of the examples, we will discuss morphometric changes across these broad time scales but focus (where appropriate) on just two brain morphometric measures – gray matter density as a relatively sensitive measure useful for comparisons over shorter time scales and gyrification as a robust structural property suitable for comparisons over large time scales. Both are observable with existing methodologies, and both highlight, at different spatial scales, the multiple levels at which biological processes interact to produce changes in brain structure.
Brain Changes Over Lifetime
Development
Gyrogenesis usually starts during fetal development – in humans around mid-gestation (Armstrong et al., 1995
) – or shortly after birth, as in ferrets (Neal et al., 2007
). It proceeds synchronously in both hemispheres by an expansion of gyral tissue, while some areas (the sulcal roots) remain in a relatively stable position throughout gyrogenesis (Régis et al., 2005
). In humans, all major gyri and sulci are usually present around birth, and gyrification reaches adult values around the age of 10 years (Armstrong et al., 1995
).
The primary effect of a folding process is always an increase of surface area relative to volume. Due to the laminar arrangement of the cerebral cortex, an increased cortical surface area correlates with an increased number of neurons (see also Panizzon et al., 2009
), which is presumed to enhance the computational capacities of the cortex within some metabolic and connectivity limits (Wen and Chklovskii, 2005
).
While the extent of cortical folding has been found to be partly determined by genetic factors (Kippenhan et al., 2005
; Kerjan and Gleeson, 2007
), the underlying biomechanical mechanisms are not yet well understood. The overall folding pattern, however, can be mechanistically explained in terms of the cerebral cortex buckling under the influence of non-isotropic forces (Van Essen, 1997
; Hilgetag and Barbas, 2006
; Mora and Boudaoud, 2006
). Possible causes of the non-isotropy include differential growth of the cortical layers due to variations in the number and timing of cell divisions, cell migration, myelination, cortical connectivity, thalamic input, synaptic pruning, brain size and metabolism (phospholipids in particular), all of which may interact (for an overview, see Francis et al., 2006
).
MR imaging is rarely performed during pregnancy and the neonatal period, in order to avoid stress for mother and child. In the cases of complications during pregnancy or birth, however, such data are being acquired. Grossman et al. (2006)
, for instance, performed in utero MR-based brain volumetry and found associations between different brain pathologies and ventricular or parenchymal volumes. Dubois et al. (2008)
analyzed gyrification in premature newborns at birth and found it to be predictive of a functional score at term-equivalent age. Beyond preterms, there have been a number of large-scale longitudinal MR-morphometric studies (often combined with cross-sectional approaches and other neuroimaging modalities) of normal brain development in humans, most notably by Giedd et al. (1999) and Thompson et al. (2000) and, more recently, by Evans and Brain Development Cooperative Group (2006) and Almli et al. (2007)
.
Using voxel-based and a number of complementary approaches, these studies revealed (or non-invasively confirmed, from the perspective of previous histological studies which cannot be longitudinal) that brain maturation involves differential growth of gray and white matter, that the time course of the maturation is not linear and that it differs markedly across brain regions. For reviews of MR morphometric studies of brain maturation, see Paus (2005)
; focused on adolescence, Toga et al. (2006)
, Lenroot and Giedd (2006)
; from early development onto adolescence. In order to interpret these findings, cellular processes have to be taken into consideration, especially those governing the pruning of axons, dendrites and synapses (reviewed by Luo and O’Leary, 2005
) until an adult pattern of whole-brain connectivity is achieved (for which diffusion-based MR imaging techniques have proven essential, cf. Hagmann et al., 2008
).
Aging
Aging – the prototypical change over a lifetime – manifests itself in multiple ways (for reviews, see Cabeza et al., 2005
; Raz and Rodrigue, 2006
), including reductions in synaptic density (Morrison and Hof, 1997
), myelination (Pakkenberg et al., 2003
), vascularization (Conde and Streit, 2006
) and possibly even the number of neurons (Pakkenberg et al., 2003
) and some glial subpopulations (Pelvig et al., 2008
).
Consequently, even though VBM findings of gray matter reduction in elderly subjects are consistent with each other (e.g. Tisserand et al., 2004
; Smith et al., 2007
), they are hard to interpret at a mechanistic level because the signal intensity in a voxel is a function of all these contributions, and image registration is complicated by an age-related increase in morphological variability. Age-associated changes in gyrification (albeit measurable; Magnotta et al., 1999
) face the same interpretational difficulties. It is thus clear that a deeper understanding of aging processes at the spatial scale of MR-based morphometry will require integration with histological (Miller et al., 1980
; Duan et al., 2003
; Pakkenberg et al., 2003
; Salat et al., 2004
; Greenberg et al., 2008
) and cognitive techniques (Reuter-Lorenz and Lustig, 2005
; Raz and Rodrigue, 2006
) as well as an extensive use of animal models (Toussaint et al., 2000
; Tapp et al., 2006
; Alexander et al., 2008
), perhaps in conjunction with MR techniques applicable at the cellular level (e.g. contrast agents; Heyn et al., 2006
).
Learning and plasticity
Perhaps the most profound impact to date of brain morphometry on our understanding of the relationships between brain structure and function has been provided by a series of VBM studies targeted precisely at proficiency in various performances: Licensed cab drivers in London were found to exhibit bilaterally increased gray matter volume in the posterior part of the hippocampus, both relative to controls from the general population (Maguire et al., 2000
) and to London bus drivers matched for driving experience and stress levels (Maguire et al., 2006
, this study also reported an accompanying gray matter reduction in the anterior part of the hippocampus). Similarly, gray matter changes were also found to correlate with professional experience in musicians (Gaser and Schlaug, 2003
; Azizi, 2009
; Han et al., 2009
), mathematicians (Aydin et al., 2007
) and meditators (Luders et al., 2009
), and with second-language proficiency (Mechelli et al., 2004
). What is more, bilateral gray matter changes in the posterior and lateral parietal cortex of medical students memorizing for an intermediate exam could be detected over a period of just 3 months (Draganski et al., 2006
).
These studies of professional training inspired questions about the limits of MR-based morphometry in terms of time periods over which structural brain changes can be detected. Important determinants of these limits are the speed and spatial extent of the changes themselves. Of course, some events like accidents, a stroke, a tumor metastasis or a surgical intervention (cf. Figure 4
) can profoundly change brain structure during very short periods, and these changes can be visualized with MR and other neuroimaging techniques. Given the time constraints under such conditions, brain morphometry is rarely involved in diagnostics but rather used for progress monitoring over periods of weeks and months and longer (for an overview with respect to stroke, see Makris et al., 2005
).
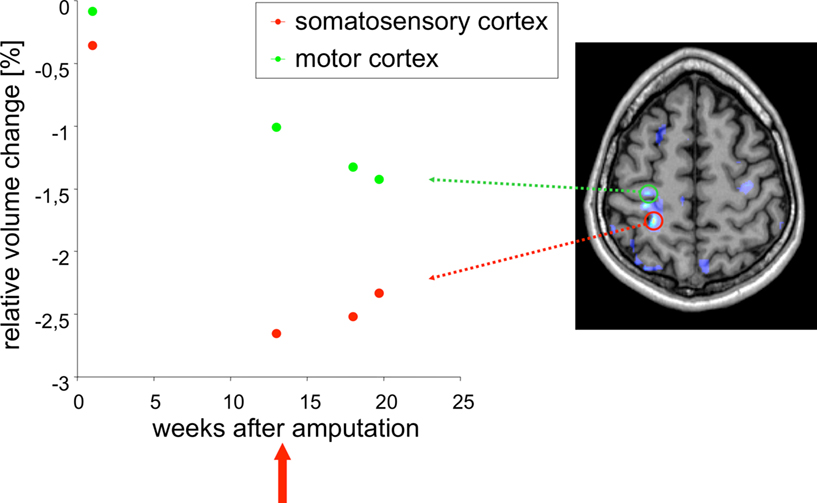
Figure 4. Example application: plasticity. DBM can be used to detect very subtle changes in the brain even in a single case. In this example, T1-weighted images were acquired from a male patient (32 years old) at several time points after amputation of the right forearm. DBM was used to estimate the volume changes of each image with respect to the baseline image. A linear volume loss was found for example in the primary motor cortex on the contra-lateral side to the amputation (green dots). The image on the right shows a brain scan overlaid with a statistical map of areas that changed significantly over time. After week 13 the patient received a myoelectrical prosthesis (red arrow). The time course in the somatosensory cortex (red dots) shows a volume decrease until week 13, followed by a small volume increase. This means that the primary motor cortex is unaffected by the prosthesis, while the somatosensory cortex reveals a small increase in volume after stimulating the sensory system with the prosthesis.
Draganski et al. (2004)
found that juggling novices showed a bilateral gray matter expansion in the medial temporal visual area (also known as V5) over a 3-month period during which they had learned to sustain a three-ball cascade for at least a minute. No changes were observed in a control group that did not engage in juggling. The extent of these changes in the jugglers reduced during a subsequent 3-month period in which they did not practice juggling. To further resolve the time course of these changes, Driemeyer et al. (2008)
repeated the experiment with another young cohort but scanned them in shorter intervals, and the by then typical changes in V5 could already be found after just 7 days of juggling practice. Interestingly, the observed changes were larger in the initial learning phase than during continued training.
Whereas the former two studies involved students in their early twenties, the experiments were recently repeated with an elderly cohort, revealing the same kind structural changes, although attenuated by lower juggling performance of this group (Boyke et al., 2008
).
Using a completely different kind of intervention – application of Transcranial Magnetic Stimulation (TMS) in daily sessions over 5 days – May et al. (2007)
observed changes in and near the TMS target areas as well as in the basal ganglia of volunteers in their mid-twenties, compared to a control group that had received placeboic TMS treatment. It is possible, though, that these changes simply reflect vascularization effects.
Taken together, these morphometric studies strongly support the notion that brain plasticity – the potential for changes in brain structure – remains possible throughout life (Draganski and May, 2008
) and may well be an adaptation to changes in brain function which has also been shown to change with experience (e.g. Golestani et al., 2002
). In other words, learning and plasticity provide two perspectives – functional and structural – at the same phenomenon, a brain that changes over time.
Disease
Brain diseases are the field to which brain morphometry is most often applied, and the volume of the literature on this is vast: For chronic schizophrenics alone, 19 VBM studies were recently reviewed by Williams (2008)
, and a review of our current understanding of schizophrenia makes heavy use of brain morphometric findings (DeLisi, 2008
). The situation is similar for Alzheimer’s disease (Apostolova and Thompson, 2007
; Thompson et al., 2007
; Davatzikos et al., 2008
; Klöppel et al., 2008
) and other neuropsychiatric disorders (Mazziotta et al., 2000
; Gordon, 2002
; Toga and Thompson, 2003
).
As for gyrification, a number of disorders exist of which abnormal gyrification is a dominant feature, e.g. polymicrogyria or lissencephalic disorders like agyria and pachygyria. They usually occur bilaterally but cases of, e.g., unilateral lissencephaly, have been described. Beyond these gross modifications of gyrification, more subtle variations occur in a number of neuropsychiatric disorders whose variety reflects the multitude of processes underlying gyrification (for overview, see Francis et al., 2006
; Razek et al., 2009
).
MR-based morphometry of gyrification is gaining importance for clinical diagnostics, precisely because the cortical folding pattern is very stable throughout adult life in non-patient populations (Armstrong et al., 1995
). This means that a deviation from normal gyrification rates has a high probability to indicate a brain malformation. As a result, a number of reports have been published that found globally or regionally abnormal gyrification in a variety of disorders, including schizophrenia (White et al., 2003
), autism (Hardan et al., 2004
), dyslexia (Casanova et al., 2004
), velocardiofacial syndrome (Bearden et al., 2009
), attention deficit hyperactivity disorder (Wolosin et al., 2009
) or Williams syndrome (Gaser et al., 2006
; Van Essen et al., 2006
).
Brain changes across lifetimes
Brain changes also accumulate over periods longer than an individual life but even though twin studies have established that human brain structure is highly heritable (Thompson et al., 2001
; Wright et al., 2002
), brain morphometric studies with such a broadened scope are rare. However, in the context of disorders with a known or suspected hereditary component, a number of studies have compared the brain morphometry of patients with both that of non-affected controls and that of subjects at high risk for developing the disorder. The latter group usually includes family members, and brain morphometry across parents and offspring was thus part of, e.g., a study identifying the GMD of the caudate nucleus as correlating with the severity of verbal dyspraxia (Watkins et al., 2002
) and a study that found thalamic GMD to differ between the parents of schizophrenics with, respectively, high and low genetic risks for developing schizophrenia (Lui et al., 2009
).
Even larger time gaps can be bridged by comparing human populations with a sufficiently long history of genetic separation, such as Central Europeans and Japanese. One surface-based study compared the brain shape between these two groups and found a difference in their gender-dependent brain asymmetries (Zilles et al., 2001
). Neuroimaging studies of this kind, combined with functional ones and behavioural data, provide promising and so far largely unexplored avenues to understand similarities and differences between different groups of people (Rilling, 2008
).
Whereas morphological analyses that compare brains at different ontogenetic or pathogenetic stages can reveal important information about normal or abnormal development within a given species, cross-species comparative studies have a similar potential to reveal evolutionary trends and phylogenetic relationships. Indeed, shape comparisons (though historically with an emphasis on qualitative criteria) formed the basis of biological taxonomy before the era of genetics.
Three principle sources exist for comparative evolutionary investigations: Fossils, fresh-preserved post-mortem or in vivo studies. The fossil record is dominated by structures that were already biomineralized during the lifetime of the respective organism (in the case of vertebrates, mainly teeth and bones). Brains, like other soft tissues, rarely fossilize, but occasionally they do. The probably oldest vertebrate brain known today belonged to a ratfish that lived around 300 million years ago (Pradel et al., 2009
). While the technique most widely used to image fossils is Computed Tomography (CT; reviewed in Zollikofer and Ponce de León, 2005
), this particular specimen was imaged by synchrotron tomography, and recent MR imaging studies with fossils (Mietchen et al., 2008
) suggest that this method can be used to image at least a subset of fossilized brains.
MR images have also been obtained from the brain of a 3200-year-old Egyptian mummy (Karlik et al., 2007
), and MRI investigations of a semi-fossil human brain (aged over 2000 years) found at the Heslington site near York are currently under way (Sonia O’Connor, Gary Green, personal communication). The perspectives are slim, however, that any three-dimensional imaging dataset of a fossil, semi-fossil or mummified brain will ever be of much use to morphometric analyses of the kind described here, since the processes of mummification and fossilization heavily alter the structure of soft tissues in a way specific to the individual specimen and subregions therein.
Post-mortem samples of living or recently extinct species, on the other hand, generally allow to obtain MR image qualities sufficient for morphometric analyses, though preservation artifacts would have to be taken into account. Previous MR imaging studies include specimens preserved in formalin (Pfefferbaum et al., 2004
; Hakeem et al., 2005
, human and elephant brains), by freezing (Corfield et al., 2008
, kiwi brains) or in alcohol (Chanet et al., 2009
, carps).
The third line of comparative evidence would be cross-species in vivo MR imaging studies like the one by Rilling and Insel (1998
, this is the first in a series of papers) who investigated brains from 11 primate species by VBM in order to shed new light on primate brain evolution. Other studies have combined morphometric with behavioural measures (social uprearing in monkeys, Sanchez et al., 1998
), and brain evolution does not only concern primates: Gyrification occurs across mammalian brains if they reach a size of several centimeters – with cetaceans dominating the upper end of the spectrum – and generally increases slowly with overall brain size, following a power law (Hofman, 1989
). Finally, since many biological mechanisms behind development, aging, learning and disease are shared between a wide range of organisms (for an overview, see Carroll, 2005
), evolutionary studies can feed back on clinical ones through model organisms (see Discussion below).
Given that in vivo MR images have been acquired (by different teams, on different scanners, in different locations, for different purposes) from the brains of many different species – including dolphins (Ridgway et al., 2006
), ferrets (Barnette et al., 2009
), rodents (Jack et al., 2005
), birds (Van der Linden et al., 2009
) and even insects (Null et al., 2008
) – the major barrier to cross-species MR-based brain morphometry is not the lack of data nor analytical tools but barriers preventing to combine them. Some exceptions already exist, though: Rilling and Insel (1998)
, for instance, have shared their dataset
10
, and a number of multicenter initiatives have been set up for that same purpose.
Amongst the many open research questions pertaining to MR-based brain morphometry, we have selected four, progress in which we expect to have a broad impact on the field.
Relationships between Morphometric Measures
The relationship between different morphometric measures across time scales or brain populations has not received much attention so far, partly because the focus of most studies was on group differences, for which simply the most suited measure was used. A profound understanding of brain structure and its changes, however, has to systematically seek answers to questions like the following: Given that allometric studies found both gyrification (Hofman, 1989
) and cortical thickness (Wen and Chklovskii, 2005
) to increase with a species’ brain size according to power laws, what does this mean for the relationship between gyrification and cortical thickness within a species? Clearly, addressing such issues requires computational models that iteratively integrate brain morphometric and functional data (e.g. Toro and Burnod, 2005
; Hilgetag and Barbas, 2006
).
Structure-Function Relationships
Many details of the interaction between brain structure and function remain to be understood (Casey et al., 2000
) but it is clear that most of it takes place at the cellular level. Synaptic activity, for instance, controls both the remodeling of axons (Saxena and Caroni, 2007
) and dendritic spines (Bloodgood and Sabatini, 2007
) but is mediated by glia cells which, in turn guided by synaptic activity, control myelination and vascularization (Haydon and Carmignoto, 2006
). A single voxel in brain morphometric MR images usually contains large numbers of such cellular interaction sites and can thus at present not be used to distinguish the individual contributions.
Spatial and temporal resolution in MR imaging can be traded for each other and for gains and losses in a number of other parameters over several orders of magnitude, so most resolution limits will be soft and lend themselves to further technological developments, e.g. in terms of the strength and homogeneity of the applied fields, the arrangement of the coils, or the pulse sequences (Blamire, 2008
). MR imaging of single cells has been performed in various model systems (e.g. Lee et al., 2007
) and application of contrast agents allowed to reach that level also in the mouse brain (Heyn et al., 2006
). Other, and much less negotiable, limits have to be kept in mind, however. These include the comfort of the subjects – they (patients and children in particular) will rarely be available for scan sessions of an hour or more – and their safety: MR spectroscopy has been performed in static fields of up to 45 T (Gan et al., 2008
), but MR imaging of humans at that field strength would be prohibitive because the blood flow-induced current density at the cardiac pacemaker then approaches the threshold for causing arrhythmia (for review, see Schenck, 2005
).
In order to address questions like whether professionals (e.g. musicians, mathematicians) have their specialized brain architecture because of their profession or whether their brain structure predisposed them to this decision, MR-based morphometric approaches will thus have to be integrated with results obtained by complementary methodologies.
Animal Models
There are ethical and practical limits to investigations of human brains, be they healthy or not. While rare clinical cases like that of the late Henry Gustav Molaison (better known as H. M. – a patient who became amnesic after bilateral removal of major parts of his hippocampus; Salat et al., 2006
) may provide for significant advances in a whole field of inquiry (in this case memory research), systematic experimentation is only possible in other species. Cross-species MR imaging studies involving suitably chosen model organisms (naturally, the focus is on species closely related to humans or easy to keep in the laboratory) can thus provide important insights into structural and functional aspects of these processes in the intact or malfunctioning human brain – e.g. perinatal injury (Lodygensky et al., 2008
), gyrification (Neal et al., 2007
), plasticity (Fisher and Scharff, 2009
; Van der Linden et al., 2009
), aging (Toussaint et al., 2000
; Tapp et al., 2006
; Alexander et al., 2008
), heritability of brain structure (Rogers et al., 2007
), or monitoring of Alzheimer therapy (Jack et al., 2007
) – and this is a very active field of research (for an overview, see Dijkhuizen and Nicolay, 2003
; Beuf et al., 2006
).
Knowledge Sharing
Neuroimaging research is currently experiencing a transition to high-throughput data generation that previously led a number of other fields to adopt a culture in which data, tools and computational models are shared (Marcus et al., 2007
). Despite important technical, legal and – perhaps most notably – cultural barriers to this transition (Eckersley et al., 2003
), initiatives like the Biomedical Informatics Research Network
11
, the National Alliance for Medical Image Computing
12
and the Neuroscience Information Framework
13
demonstrate possible ways of implementation.
Once the data, tools and models are accessible to every researcher, new kinds of research become possible. Looking backward, legacy neuroimaging data can be combined with new analytical tools to provide insights that would not have been possible at the time of original acquisition (Fennema-Notestine et al., 2006
), and existing data from different scanners can be pooled to reach higher statistical power (Moorhead et al., 2009
; Segall et al., 2009
). Looking forward, existing tools and platforms allow to extend the data sharing practice to presenting public data interactively (Shotton et al., 2009
), to keeping lab notebooks in public (e.g. at OpenWetWare
14
), to benchmarking of different algorithms
15
, to collaborative problem-solving (Nielsen, 2009
), and to embed the results of these activities into a hyperlinked contextual framework of structured knowledge that can be continuously updated and expanded, as examplified by the fledgling scholarly wikis Scholarpedia
16
and Citizendium
17
, or the recently proposed Wave Protocol
18
.
As an experiment to test the potential of such collaborative environments, we have drafted parts of this manuscript directly in the “Brain morphometry” and “Gyrification” entries at Citizendium. If you take a look at these and related wiki entries and start to improve them, this would be a new experience of knowledge sharing for all of us, and we are very much looking forward to it.
MR-based brain morphometry is currently in a phase of fast development and diversification. Specifically, brain morphometric approaches based on structural MR images allow to quantify changes in cortical gray matter across both broad and narrow time scales. Further integration with other neuroimaging data, analytical tools and computational models can be expected to lead to considerable progress in understanding brain changes due to development, aging, learning, disease and evolution in both structural and functional terms.
The authors declare that the research was conducted in the absence of any commercial or financial relationships that could be construed as a potential conflict of interest.
We thank Dr. Thomas Weiss for providing the data underlying Figure 4
. This work was supported in part by BMBF grants 01EV0709 and 01GW0740.
- ^ Words set in italics refer to the introductory quote.
- ^ http://www.fmrib.ox.ac.uk/fsl/
- ^ http://www.fil.ion.ucl.ac.uk/spm/
- ^ http://www.bic.mni.mcgill.ca/users/louis/MNI_AUTOREG_home/readme/
- ^ http://brainvis.wustl.edu/wiki/index.php/Caret:About
- ^ http://surfer.nmr.mgh.harvard.edu/
- ^ http://brainvisa.info/
- ^ http://afni.nimh.nih.gov/afni/suma
- ^ http://www.brainvoyager.com/
- ^ http://www.fmridc.org/f/fmridc/77.html
- ^ http://www.loni.ucla.edu/BIRN/
- ^ http://www.na-mic.org/
- ^ http://neurogateway.org/
- ^ http://www.openwetware.org/
- ^ http://sve.loni.ucla.edu/
- ^ http://www.scholarpedia.org/
- ^ http://www.citizendium.org/
- ^ http://www.waveprotocol.org/
Bearden, C. E., van Erp, T. G. M., Dutton, R. A., Lee, A. D., Simon, T. J., Cannon, T. D., Emanuel, B. S., Mcdonald-Mcginn, D., Zackai, E. H., and Thompson, P. M. (2009). Alterations in midline cortical thickness and gyrification patterns mapped in children with 22q11.2 deletions. Cereb. Cortex 19, 115–126.
Eckersley, P., Egan, G. F., Amari, S.-I., Beltrame, F., Bennett, R., Bjaalie, J. G., Dalkara, T., Schutter, E. D., Gonzalez, C., Grillner, S., Herz, A., Hoffmann, K. P., Jaaskelainen, I. P., Koslow, S. H., Lee, S.-Y., Matthiessen, L., Miller, P. L., Da Silva, F. M., Novak, M., Ravindranath, V., Ritz, R., Ruotsalainen, U., Subramaniam, S., Toga, A. W., Usui, S., Van Pelt, J., Verschure, P., Willshaw, D., Wrobel, A., Tang, Y., and OECD Working Group on Neuroinformatics (2003). Neuroscience data and tool sharing: a legal and policy framework for neuroinformatics. Neuroinformatics 1, 149–165.
Fennema-Notestine, C., Ozyurt, I. B., Clark, C. P., Morris, S., Bischoff-Grethe, A., Bondi, M. W., Jernigan, T. L., Fischl, B., Segonne, F., Shattuck, D. W., Leahy, R. M., Rex, D. E., Toga, A. W., Zou, K. H., and Brown, G. G. (2006). Quantitative evaluation of automated skull-stripping methods applied to contemporary and legacy images: effects of diagnosis, bias correction, and slice location. Hum. Brain Mapp. 27, 99–113.
Heyn, C., Ronald, J. A., Ramadan, S. S., Snir, J. A., Barry, A. M., MacKenzie, L. T., Mikulis, D. J., Palmieri, D., Bronder, J. L., Steeg, P. S., Yoneda, T., MacDonald, I. C., Chambers, A. F., Rutt, B. K., and Foster, P. J. (2006). In vivo MRI of cancer cell fate at the single-cell level in a mouse model of breast cancer metastasis to the brain. Magn. Reson. Med. 56, 1001–1010.
Jack, C. R., Marjanska, M., Wengenack, T. M., Reyes, D. A., Curran, G. L., Lin, J., Preboske, G. M., Poduslo, J. F., and Garwood, M. (2007). Magnetic resonance imaging of Alzheimer’s pathology in the brains of living transgenic mice: a new tool in Alzheimer’s disease research. Neuroscientist 13, 38–48.
Lepore, N., Brun, C., Chou, Y. Y., Chiang, M. C., Dutton, R. A., Hayashi, K. M., Luders, E., Lopez, O. L., Aizenstein, H. J., Toga, A. W., Becker, J. T., and Thompson, P. M. (2008). Generalized tensor-based morphometry of HIV/AIDS using multivariate statistics on deformation tensors. IEEE Trans. Med. Imaging 27, 129–141.
Lui, S., Deng, W., Huang, X., Jiang, L., Ouyang, L., Borgwardt, S. J., Ma, X., Li, D., Zou, L., Tang, H., Chen, H., Li, T., McGuire, P., and Gong, Q. (2009). Neuroanatomical differences between familial and sporadic schizophrenia and their parents: an optimized voxel-based morphometry study. Psychiatry Res. 171, 71–81.
Moorhead, T., Gountouna, V., Job, D., McInitosh, A., Romaniuk, L., Lymer, G., Whalley, H., Waiter, G., Brennan, D., Ahearn, T., Cavanagh, J., Condon, B., Steele, J., Wardlaw, J., and Lawrie, S. (2009). Prospective multi-centre Voxel Based Morphometry study employing scanner specific segmentations: Procedure development using CaliBrain structural MRI data. BMC Med. Imaging 9, 8.
Panizzon, M., Fennema-Notestine, C., Eyler, L., Jernigan, T., Prom-Wormley, E., Neale, M., Jacobson, K., Lyons, M., Grant, M., Franz, C., Xian, H., Tsuang, M., Fischl, B., Seidman, L., Dale, A., and Kremen, W. (2009). Distinct genetic influences on cortical surface area and cortical thickness. Cereb. Cortex (in press).
Segall, J. M., Turner, J. A., van Erp, T. G. M., White, T., Bockholt, H. J., Gollub, R. L., Ho, B. C., Magnotta, V., Jung, R. E., McCarley, R. W., Schulz, S. C., Lauriello, J., Clark, V. P., Voyvodic, J. T., Diaz, M. T., and Calhoun, V. D. (2009). Voxel-based morphometric multisite collaborative study on schizophrenia. Schizophr. Bull. 35, 82–95.
Toussaint, O., Baret, P. V., Brion, J. P., Cras, P., Collette, F., De Deyn, P. P., Geenen, V., Kienlen-Campard, P., Labeur, C., Legros, J. J., Nève, J., Octave, J. N., Piérard, G. E., Salmon, E., van den Bosch de Aguilar, P., Van der Linden, M., Leuven, F. V., and Vanfleteren, J. (2000). Experimental gerontology in Belgium: from model organisms to age-related pathologies. Exp. Gerontol. 35, 901–916.