Cortical hubs form a module for multisensory integration on top of the hierarchy of cortical networks
1
Interdisciplinary Center for Dynamics of Complex Systems, University of Potsdam, Potsdam, Germany
2
Department of Physics, Centre for Nonlinear Studies, Hong Kong Baptist University, Hong Kong, China
3
The Beijing-Hong Kong-Singapore Joint Centre for Nonlinear and Complex Systems, Hong Kong Baptist University, Hong Kong, China
4
Transdisciplinary concepts and methods, Potsdam Institute for Climate Impact Research, Potsdam, Germany
5
Institute of Physics, Humboldt University, Berlin, Germany
Sensory stimuli entering the nervous system follow particular paths of processing, typically separated (segregated) from the paths of other modal information. However, sensory perception, awareness and cognition emerge from the combination of information (integration). The corticocortical networks of cats and macaque monkeys display three prominent characteristics: (i) modular organisation (facilitating the segregation), (ii) abundant alternative processing paths and (iii) the presence of highly connected hubs. Here, we study in detail the organisation and potential function of the cortical hubs by graph analysis and information theoretical methods. We find that the cortical hubs form a spatially delocalised, but topologically central module with the capacity to integrate multisensory information in a collaborative manner. With this, we resolve the underlying anatomical substrate that supports the simultaneous capacity of the cortex to segregate and to integrate multisensory information.
The mammalian nervous system is responsible for collecting and processing of information, and for providing adaptive responses which permit the organism to survive in a permanently changing environment. Sensory neurones encode environmental information into electrical signals which propagate in a “bottom-up” manner through different processing stages (Kandel et al., 2000
; Bear et al., 2006
). Each level provides responses of increasing complexity and at different time scales, e.g. reflex arcs, emotional responses and more elaborate cognitive responses. Information of the same modality (e.g. visual, auditory, somatosensory, etc.) traverses the body together, typically separated from the processing paths of other modalities. This permits that particular regions of the cortex specialise in detecting different features of the sensory stimuli, e.g. orientation, velocity and colour of the visual input; or frequency and pitch of the auditory stimuli. However, in order to generate a coherent perception of the reality, the brain needs to combine (integrate) this multisensory information at some place (Robertson, 2003
) and during some time (Fahle, 1993
; Singer and Gray, 1995
; Engel and Singer, 2001
). For that, the paths of information need to converge.
It has been argued that the functional capacity of the NS to balance between segregation (specialisation) and integration might be facilitated by its structural organisation (Sporns and Tononi, 2001
). Analysis of the connectivity between regions of the cerebral cortex in macaque monkeys and cats has revealed the following characteristics: (i) clustered organisation of the cortical areas (Scannell and Young, 1993
; Scannell et al., 1995
; Hilgetag et al., 2000
; Hilgetag and Kaiser, 2004
) (see Figure 2
), (ii) a large density of connections, and (iii) a broad degree distribution containing highly connected areas which are referred as hubs (Zemanová et al., 2006
; Sporns et al., 2007
; Zhou et al., 2007
; Hagmann et al., 2008
). While the organisation of cortical areas into clusters permits the segregated processing of information of different modality, the large number of connections involves that sensory information is highly accessible to all cortical areas, regardless of its modal origin. A detailed analysis of the corticocortical communication substrate has revealed the central role of the cortical hubs, by facilitating the communication between the different sensory modalities (Zamora-López et al., 2009
).
Whether the cortical hubs act as passive transmitters of information, or they perform a more active function is a relevant question that we try to answer in the present paper. We start by summarising principles of complex network analysis and information theory in Section “Materials and Methods”. Section “Topological Capacity of Integration” contains a thorough application of graph theoretical measures which reveal that the cortical hubs form an additional module, expressed as a higher hierarchical level. In Section “Functional Capacity of Integration”, we challenge the intuitively assigned integrative properties of this central module by means of dynamical and information theoretical measures. On the one hand, we find that only simultaneous lesion of particular hubs leads to a dynamical segregation of the sensory modules (visual, auditory, somatosensory-motor and frontolimbic). On the other hand, the same hubs form a dynamical cluster after simultaneous excitation of primary sensory areas, a clear sign of their integrative capacities.
Graph Analysis
We first introduce basic concepts of graph theory. A network is an abstract manner to represent different aspects of a real system, providing it with a form (topology) which can be mathematically tractable. A network 𝒢 (N, L), composed of N nodes interconnected by L links, is described by an adjacency matrix A with entries Aij = 1 when there is a link pointing from node i to node j, and Aij = 0 otherwise. The density of 𝒢 is the fraction between the number of links L and the total number of links possible:  . In order to characterise the topological scales of networks, there exist many statistical descriptors, all measurable from the information encoded in the adjacency matrix. The output degree
  of a node i is the number of efferent connections that it projects to other nodes, and its input degree
  , is the number of the afferent connections it receives. The degree distribution p(k) is the probability that a randomly chosen node has degree k. One of the key discoveries that triggered a renewed interest in graph theory is that the distribution p(k) of many empirical networks approximately follows a power-law p(k) ∼ k−γ (Newman, 2003
), where γ is the degree exponent. In such scale-free(-like) networks the majority of nodes possess a small number of neighbours, and few nodes (the hubs) are highly connected.
, is the number of the afferent connections it receives. The degree distribution p(k) is the probability that a randomly chosen node has degree k. One of the key discoveries that triggered a renewed interest in graph theory is that the distribution p(k) of many empirical networks approximately follows a power-law p(k) ∼ k−γ (Newman, 2003
), where γ is the degree exponent. In such scale-free(-like) networks the majority of nodes possess a small number of neighbours, and few nodes (the hubs) are highly connected.
. In order to characterise the topological scales of networks, there exist many statistical descriptors, all measurable from the information encoded in the adjacency matrix. The output degree of a node i is the number of efferent connections that it projects to other nodes, and its input degree , is the number of the afferent connections it receives. The degree distribution p(k) is the probability that a randomly chosen node has degree k. One of the key discoveries that triggered a renewed interest in graph theory is that the distribution p(k) of many empirical networks approximately follows a power-law p(k) ∼ k−γ (Newman, 2003
), where γ is the degree exponent. In such scale-free(-like) networks the majority of nodes possess a small number of neighbours, and few nodes (the hubs) are highly connected.Distance and centrality
The distance dij between two nodes i and j is the length of the shortest path between them, i.e. the minimal number of links crossed to travel from i to j. If there is a link i → j, then dij = 1. If there is no other choice than going through an intermediate node k such that i → k → j, then dij = 2, and so on. When there exists no path from i to j then dij = ∞. The average pathlength l is the average distance between all pairs of nodes. The shortest path between two nodes is usually not unique and there are several alternative shortest paths. In order to characterise the influence of individual nodes on the flow and the spread of information through a network, the betweenness centrality CB(i), is defined as the fraction of all shortest paths passing through i (Anthonisse, 1971
; Freeman, 1977
):

where σst(i) is the number of shortest paths starting in s, running through i and finishing in t, and σst is the number of all shortest paths from s to t.
Matching index
The topological similarity of two nodes can be characterised as the number of common neighbours they share. In the extreme case, two nodes are topologically identical if both have the same set of connections. The neighbourhood of node i is defined as the set of nodes it connects with, Γ(i) = {j : Aij = 1}. In graphs without multiple links the size of the neighbourhood |Γ(i)| equals the degree of i. The matching index of two nodes i and j is thus the overlap of their neighbourhoods: MI(i,j) = |Γ(i) ∩ Γ(j)|. Defined in this manner MI(i,j) depends on the degrees of i and j, and the values for different pairs are not comparable. Imagine two nodes with degrees k(i) = k(j) = 3 which are connected to the same neighbours. As Γ(i) = Γ(j) their matching is MI(i,j) = 3. Imagine other two nodes with degrees k(i′) = 3 and k(j′) = 4. Maximally, they could share three neighbours and have MI(i′,j′) = 3 as well, despite i and j are topologically equivalent but i′ and j′ are not. In order to compare the values for different pairs the measure can be normalised by the number of distinct neighbours of the two nodes, i.e. the union of the two neighbourhoods |Γ(i) ∪ Γ(j)| as illustrated in Figure 1
. The normalised matching index can be computed as:
Now, MI(i,j) = 1 only if i and j are connected exactly to the same nodes, Γ(i) = Γ(j), and MI(i,j) = 0 if they have no common neighbours.
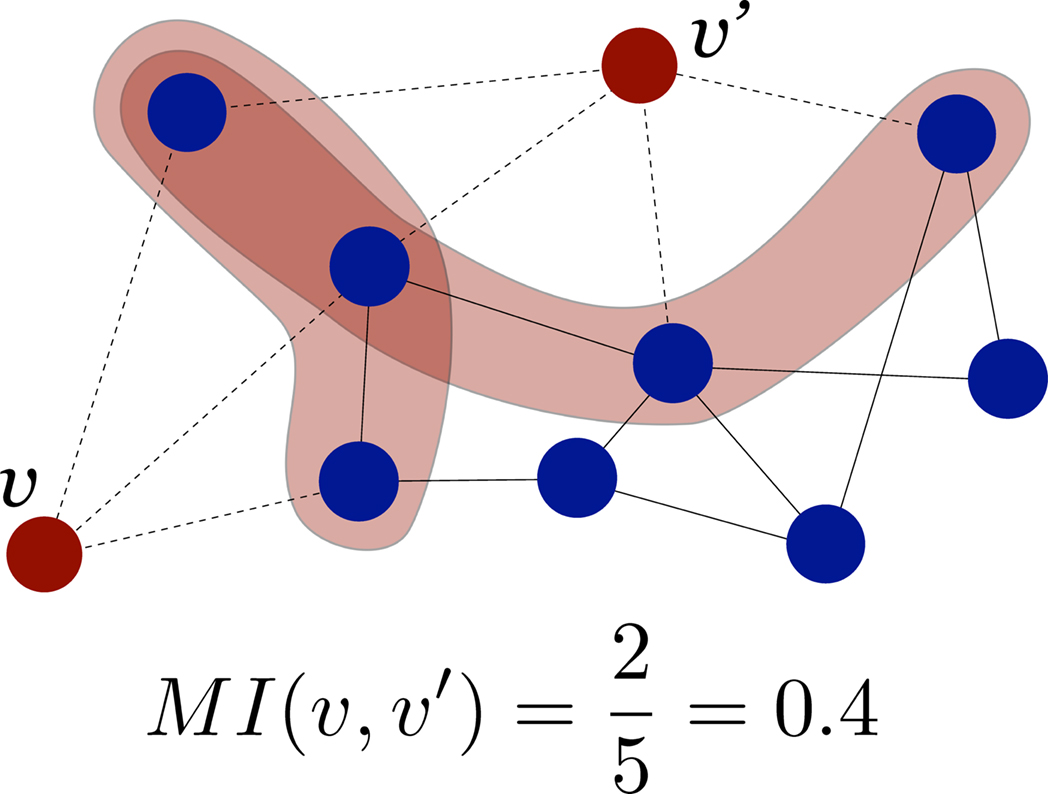
Figure 1. Schematic representation of the normalised matching index, computed as in Eq. 2. For proper comparison between pairs, the measure is normalised by the number of different neighbours of v and v′.
Reference surrogate networks
Graph theoretical measures help understand the topological organisation of networks. Equally relevant is to uncover the features which are characteristic to the underlying system and the fundamental properties of its development. In this sense, the question is not whether a graph measure takes a specific numerical value, but whether this value distinguishes the empirical network 𝒢emp from others of similar characteristics. For that, the formulation of appropriate null-models is required. A typical such null case is to generate surrogate networks with the same size N, number of links L and degree distribution p(k) as in 𝒢emp. The link switching method (Katz and Powell, 1957
; Holland and Leinhardt, 1977
; Rao et al., 1996
; Kannan et al., 1999
; Roberts, 2000
) consists of the following iterative process: starting from 𝒢emp, at each iteration two links are chosen at random (i1 → j1) and (i2 → j2). The links are rewired as (i1 → j 2) and (i2 → j1) provided that the new links do not already exist and do not introduce self-loops, i.e. i → i. Repeating the process sufficient times the resulting surrogate network conserves the initial degree distribution but any higher order structure is destroyed.
Data
The classical textbook illustration of the cerebral cortex as a surface (grey matter) which can be subdivided into functional or cytoarchitectonic regions is only a limited picture. Additionally, long-range fibres link the cortical areas via the white matter forming a complex network which is neither regular nor completely random. This intricated structure enhances the richness and complexity of information processing capabilities of the cerebral cortex. In this paper we focus on the analysis of the cortical connectivity of the cat because it is, up to date, the most complete and reliable dataset of this kind.
Corticocortical connectivity of the cat
The dataset of the corticocortical connections within the cortex of cats was created after an extensive collation of literature reporting anatomical tract-tracing experiments (Scannell and Young, 1993
; Scannell et al., 1995
). It consists of a parcellation into 53 cortical areas and 826 fibres of axons between them as summarised in Figure 2
. The connections are weighted according to the axonal density of the projections. After application of data mining methods (Scannell and Young, 1993
; Hilgetag and Kaiser, 2004
), the network was found to be organised into four distinguishable clusters which closely follow functional subdivisions: visual (V), auditory (A), somatosensory-motor (SM) and frontolimbic (FL).
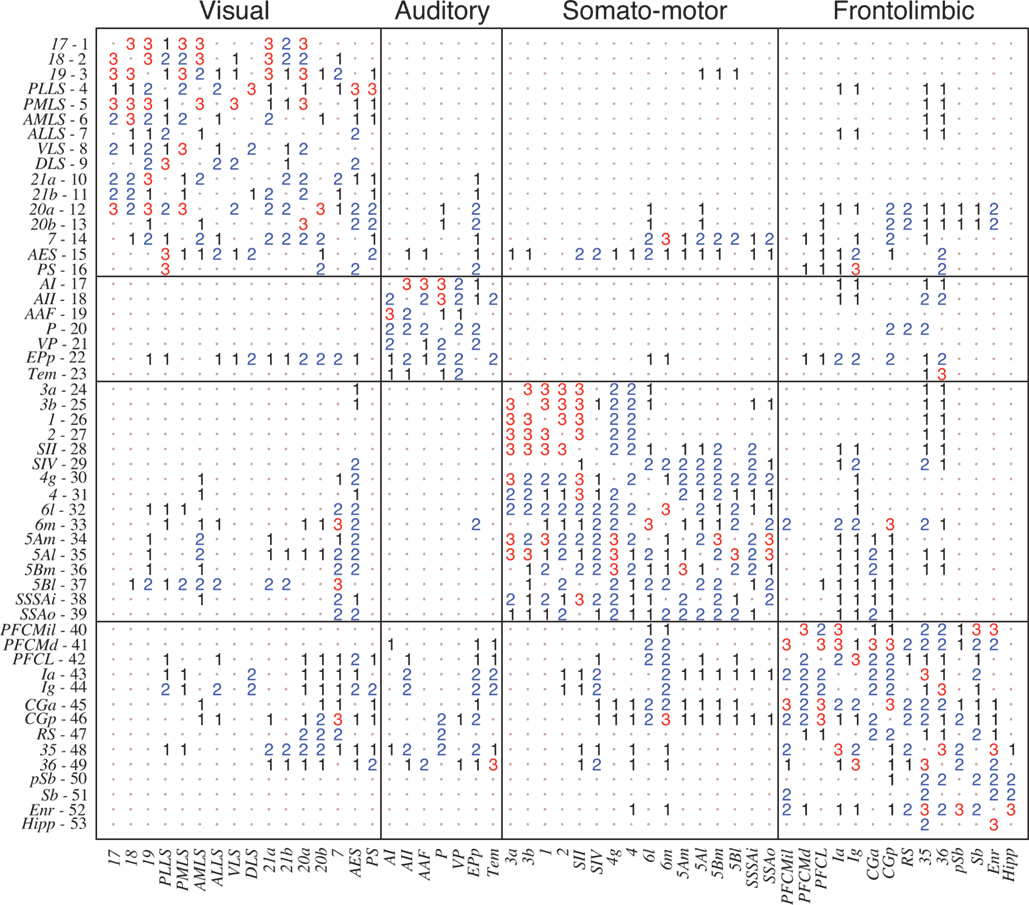
Figure 2. Weighted adjacency matrix W of the corticocortical connectivity of the cat comprising of L = 826 directed connections between N = 53 cortical areas (Scannell and Young, 1993
; Scannell et al., 1995
). For visualisation purposes, the non-existing connections (0) have been replaced by dots. The network has clustered organisation, reflecting four functional subdivisions: visual (V), auditory (A), somatosensory-motor (SM) and frontolimbic (FL).
Surrogate data
In order to perform significance tests of the graph measures, an ensemble of 1000 surrogate networks has been created following the link switching method (see Section “Graph Analysis”). All the resulting networks have the same size N = 53, the same number of links L = 826 and the same degree distribution as the corticocortical network of the cat. To assure that any further internal structure is destroyed, each surrogate network is the product of 10 × L iterations. In the following, this set will be referred as the rewired ensemble {𝒢1n}, and the original corticocortical network of the cat as 𝒢cat. The ensemble average of graph measures applied on the surrogate set {𝒢1n} will be considered as the expected values.
Information Theory and Integration
Information theory has been very successful to describe transmission of information, encoding and channel capacity. At the root of this success lies the original idea of Shannon to apply concepts of statistical physics to represent the nature of communication. Consider a system A with M possible states. That is, a measurement made on A yields the values a1,a2,…,aM, with a probability p(ai). The average amount of information gained from a measurement that specifies one particular value ai is given by the entropy of the system (Shannon, 1948
; Cover and Thomas, 1991
):

The entropy can be interpreted as the amount of surprise one should feel upon reading the result of a measurement (Faser and Swinney, 1986
). It vanishes when the system has only one accessible state because the value a is always obtained, i.e. there is no surprise. H(A) is maximum when all the states are equally likely, i.e. there are no preferred states.
The statistical dependence between two systems x1 and x2 is quantified by their mutual information:

By definition, the joint entropy is H(x1,x2) ≤ H(x1) + H(x2). The equality is only fulfilled if x1 and x2 are statistically independent, hence MI(x1,x2) = 0, and otherwise MI(x1,x2) > 0.
Integration
In a series of papers Tononi and Sporns proposed a particular measure of integration (Tononi and Sporns, 1994
; Tononi et al., 1996
, 1998
). Given a system X composed of N subsystems x1, integration is defined as:

where H(xi) is the entropy of one subsystem and H(X) = H(x1,x2,…,xn) is the joint entropy of the system considered as a whole. I(X) = 0 only if all xi ∈ X are statistically independent of each other, and positive otherwise. After this definition, integration is the extension of mutual information for more than two systems. In other words, I(X) measures the internal level of statistical dependence among all the subsystems xi ∈ X.
Linear dynamical systems
The steady-state of a linear system whose N subsystems x = (x1,x2,…,xn) are driven by a Gaussian noise ξ = (ξ1,ξ2,…,ξN), is described by  , where g is the coupling strength and At is the transpose of the adjacency matrix. Otherwise the dynamics of xi would be characterised by its own outputs, not by the inputs it receives. Written in matrix form:
, where g is the coupling strength and At is the transpose of the adjacency matrix. Otherwise the dynamics of xi would be characterised by its own outputs, not by the inputs it receives. Written in matrix form:
In practical terms the variable xi might be interpreted as the activity level of the cortical area i (Kötter and Sommer, 2000
; Young et al., 2000
), or as the mean firing rate of the neurones in the area i (Graben et al., 2007
). The entropy of such a multivariate Gaussian system can be analytically calculated out of its covariance matrix such that  , where |·| stands for the determinant (Papoulis, 1991
; Tononi and Sporns, 1994
). The entropy of an individual Gaussian process is
, where |·| stands for the determinant (Papoulis, 1991
; Tononi and Sporns, 1994
). The entropy of an individual Gaussian process is  where νi is the variance of xi, say, the ith diagonal element of the COV(X) matrix. Replacing H(X) and H(xi) into Eq. 5 and applying basic algebra, we reduce the integration of such a multivariate Gaussian system as:
, where |·| stands for the determinant (Papoulis, 1991
; Tononi and Sporns, 1994
). The entropy of an individual Gaussian process is where νi is the variance of xi, say, the ith diagonal element of the COV(X) matrix. Replacing H(X) and H(xi) into Eq. 5 and applying basic algebra, we reduce the integration of such a multivariate Gaussian system as:
This expression shows that I(X) of the linear system is properly normalised and is independent of system size N. The covariance matrix can be analytically computed by solving the system such that  , and averaging over the states produced by successive values of ξ one finds: COV(X) = 〈x · xt〉=〈(Q · ξ)·(ξt · Qt)〉 =Q · Qt.
, and averaging over the states produced by successive values of ξ one finds: COV(X) = 〈x · xt〉=〈(Q · ξ)·(ξt · Qt)〉 =Q · Qt.Comparing different systems
To compare I(X) of different systems, the matrix At needs to be adequately normalised because application of the same coupling strength g to different networks might set them into different dynamical states. Hence, they might not be comparable. The linear System (6) has several poles depending on g. The smallest pole corresponds to  where λmax is the largest eigenvalue of the transposed adjacency matrix At. The solutions only have physical meaning for g < g1, otherwise the stationarity condition does not hold. In Figure 3
the poles corresponding to the corticocortical network of the cat are shown. Notice that at the poles, both entropy and integration diverge. To make the comparison of the dynamics of different networks possible, we normalise the adjacency matrices as
where λmax is the largest eigenvalue of the transposed adjacency matrix At. The solutions only have physical meaning for g < g1, otherwise the stationarity condition does not hold. In Figure 3
the poles corresponding to the corticocortical network of the cat are shown. Notice that at the poles, both entropy and integration diverge. To make the comparison of the dynamics of different networks possible, we normalise the adjacency matrices as  In this manner, all systems have the smallest pole at g = 1.
where λmax is the largest eigenvalue of the transposed adjacency matrix At. The solutions only have physical meaning for g < g1, otherwise the stationarity condition does not hold. In Figure 3
the poles corresponding to the corticocortical network of the cat are shown. Notice that at the poles, both entropy and integration diverge. To make the comparison of the dynamics of different networks possible, we normalise the adjacency matrices as In this manner, all systems have the smallest pole at g = 1.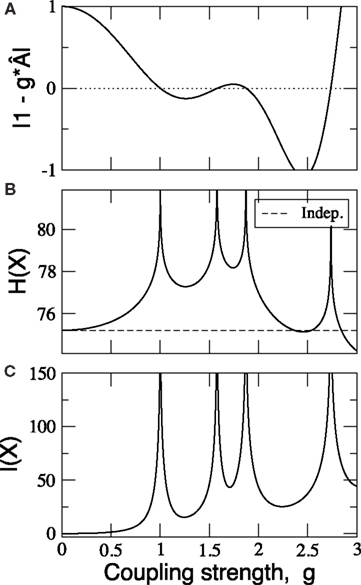
Figure 3. Parametric study of the linear System (6) using the cortical network of the cat. (A) Integrability range. When the determinant.1 − gÂ. = 0 the system has a pole. Negative values lead to non-physical solutions. (B) Entropy and (C) Integration diverge around the poles.
Finally, a proper coupling strength g needs to be chosen. For that, we have estimated the covariance matrices of the cat cortical network under different coupling strengths (Figure 4
). They are similar to the correlation patterns arising from more complex models (Zemanová et al., 2006
; Honey et al., 2007
; Zhou et al., 2006
, 2007
). This similarity indicates the validity of the simple linear System (6) for the exploratory purposes here intended. All networks considered in Section “Functional Capacity of Integration” are normalised by their first pole and a coupling strength of g = 0.5 is applied. Unless otherwise stated, the noise level is set to ξi = 1.0.
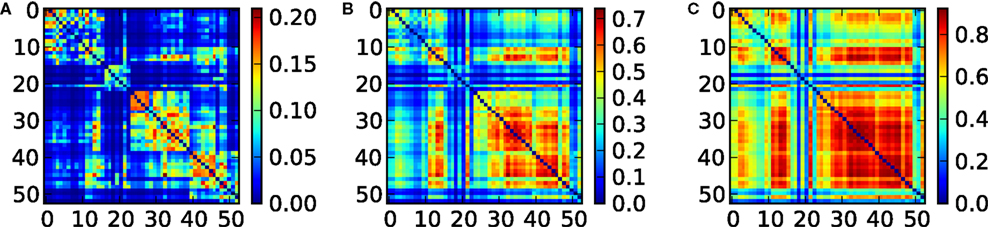
Figure 4. Covariance matrix of the cat cortical network as a linear system. The adjacency matrix has been previously normalised by 1/λmax and the noise level set to ξi = 1.0. Coupling strengths are: (A) g = 0.52, (B) g = 0.84 and (C) g = 0.92.
Subsets of elements
The entropy of a subset of systems S ⊆ X can be obtained by first computing COV(X) as indicated above, and then extracting the covariance submatrix COV(S) out of COV(X) by considering only the elements xi ∈ S. The entropy of the subset is then  , and its integration I(S) is:
, and its integration I(S) is:
Topological Capacity of Integration
In order to characterise the connectional organisation of the nervous system and to understand its functional implications, the complex network approach has been applied in the recent years, particularly at the level of the cerebral cortex. This analysis has revealed several organisation properties, e.g. the clustering of cortical areas according to their sensory modality (visual, auditory, somatosensory-motor and frontolimbic). Recently, it has been reported that communication paths between cortical areas in different sensory modules are not random, but mediated by the hubs of the network (Zamora-López et al., 2009
). In this section we present a more detailed graph analysis aiming to characterise the potential function of the cortical hubs.
Inter-modal communication
The betweenness centrality CB(ν) quantifies the relevance of a node v within the communication paths in a network. As represented in Figure 5
A, we observe that within each of the sensory systems, few cortical areas possess a large betweenness. With CB(ν) > 500 we find: visual areas 20a, 7 and AES; auditory area EPp; somatosensory-motor areas 6m and 5Al; and frontolimbic areas Ia, Ig, CGp, 35 and 36. On the contrary, only the visual primary cortex (area 17) and the hippocampus have CB(ν) = 0. In general, we observe that cortical regions known to perform highly specialised sensory function have few connections and very low centrality, e.g. primary and secondary visual or auditory areas, and early somatosensory-motor areas. These areas typically contain ordered mappings of the sensory stimuli such as retinotopic or tonotopic maps, see Appendix of Scannell et al. (1995)
.
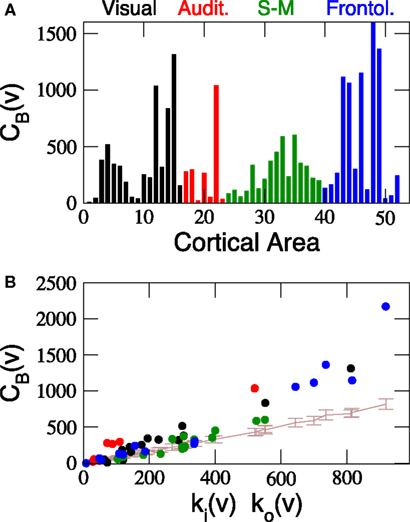
Figure 5. Centrality of cortical areas. (A) Betweenness of cortical areas shows that at each sensory system few areas are very central. (B) Comparison between CB of cortical areas and the expected centrality due to their degree (brown line). As a consequence of the modular and hierarchical organisation of the network, low degree areas closely follow the expected centrality but hubs are significantly more central than expected. Communication paths between sensory systems are centralised through the hubs.
The centrality of a node usually correlates with its degree, hence, it is trivial to find out that precisely the hubs have larger centrality. Drawing any further conclusion requires performing a proper significance test. For comparison, the average CB(ν) of the nodes in all the 1000 rewired networks of the surrogate ensemble {𝒢1n} has been computed. The ascending line in Figure 5
B shows the expected dependence of the betweenness centrality on the degree of the nodes. As a node receives ki(ν) inputs and projects ko(ν) outputs, the number of shortest paths passing through v is linearly proportional to ki(ν)ko(ν) in the surrogate networks. The most prominent observation is that, while CB of the low degree areas follow the expected centrality, the centrality of the hubs is largely significant. This is an evident consequence of the modular organisation of the network and the particular role of the cortical hubs for the inter-modal communication. Communication paths running between low-degree areas of different modules are usually mediated through the hubs (Zamora-López et al., 2009
).
This significance test permits us to uncover the most likely candidates to be a hub of the network, not only in terms of their number of links, but considering their contribution for the corticocortical communications. The hubs found here are potential candidates to perform high level integration because they have access to the information of different modalities. However, with the current results we can only affirm with certainty that the hubs are useful for the transmission of information from one modality to another. Concluding whether they perform any further function or not, it requires a more careful analysis.
Collective organisation of cortical hubs
A relevant question is now whether the cortical hubs are functionally independent of each other, i.e. each hub has a specialised function, or they perform some collaborative function. A graph measure to characterise the relation between the hubs of a network is the rich-club phenomenon. The k-density φ(k), is defined as the internal density of links between the nodes with degree larger than k′:

where  is the number of nodes with k(v) ≥ k′ and
  is the number of links between them. Notice that φ(k) is an increasing function of k. As
  is the density of the network, after the nodes with low degrees are removed the remaining reduced network contains more links per node. Thus, a plain measure of φ(k) is not very informative because hubs have a higher intrinsic chance of being connected to each other. Again, a conclusive interpretation requires the comparison to random networks with the same degree distribution. The question is then whether φ(k) of the real network grows faster or slower with k than the expected k-density φ1n(k) out of the surrogate networks {𝒢1n}. If φ(k) grows faster than φ1n(k), it means that the hubs are more connected than expected and form a dense module (a rich-club). On the contrary, if φ(k) grows slower than φ1n(k), the hubs are more independent of each other than expected.
is the number of nodes with k(v) ≥ k′ and is the number of links between them. Notice that φ(k) is an increasing function of k. As is the density of the network, after the nodes with low degrees are removed the remaining reduced network contains more links per node. Thus, a plain measure of φ(k) is not very informative because hubs have a higher intrinsic chance of being connected to each other. Again, a conclusive interpretation requires the comparison to random networks with the same degree distribution. The question is then whether φ(k) of the real network grows faster or slower with k than the expected k-density φ1n(k) out of the surrogate networks {𝒢1n}. If φ(k) grows faster than φ1n(k), it means that the hubs are more connected than expected and form a dense module (a rich-club). On the contrary, if φ(k) grows slower than φ1n(k), the hubs are more independent of each other than expected.In Figure 6
A the k-density φcat(k) of 𝒢cat is presented together with the ensemble average φ1n(k). For low degrees, φcat(k) follows very close the expectation, but for degrees k(v) > 15, φcat(k) starts to grow faster showing that the hubs of the network form a rich-club. The largest difference occurs for k = 23, comprising of 11 cortical hubs from all the four sensory systems (Figure 6
B). Compared to the internal density of the four modules of the network, we find that the hubs form an even denser module (Table 1
).
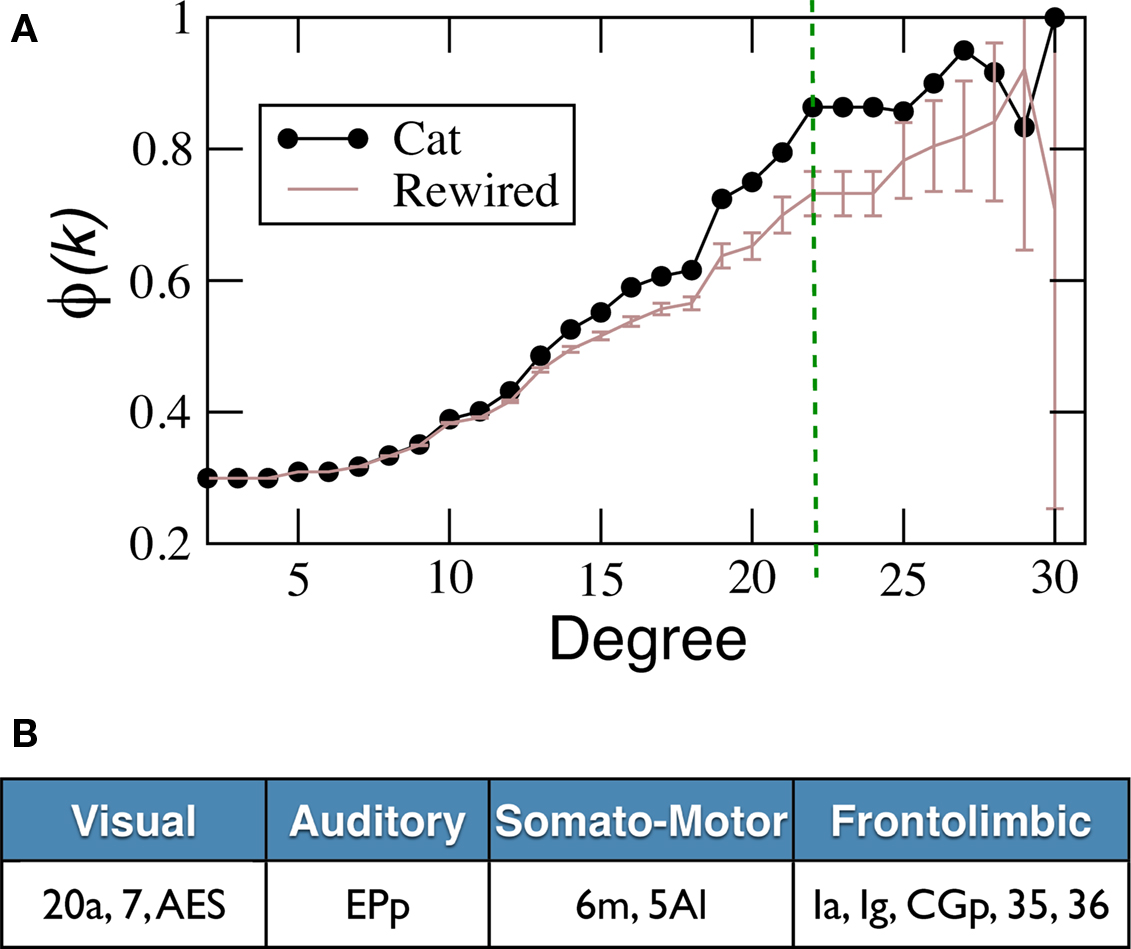
Figure 6. Rich-club organisation. (A) k-density of the corticocortical network of the cat φcat, compared to the expectation out of the surrogate ensemble {𝒢1n}. The largest difference occurs at k = 23 (vertically dashed line) giving rise to (B) a rich-club composed of 11 areas.
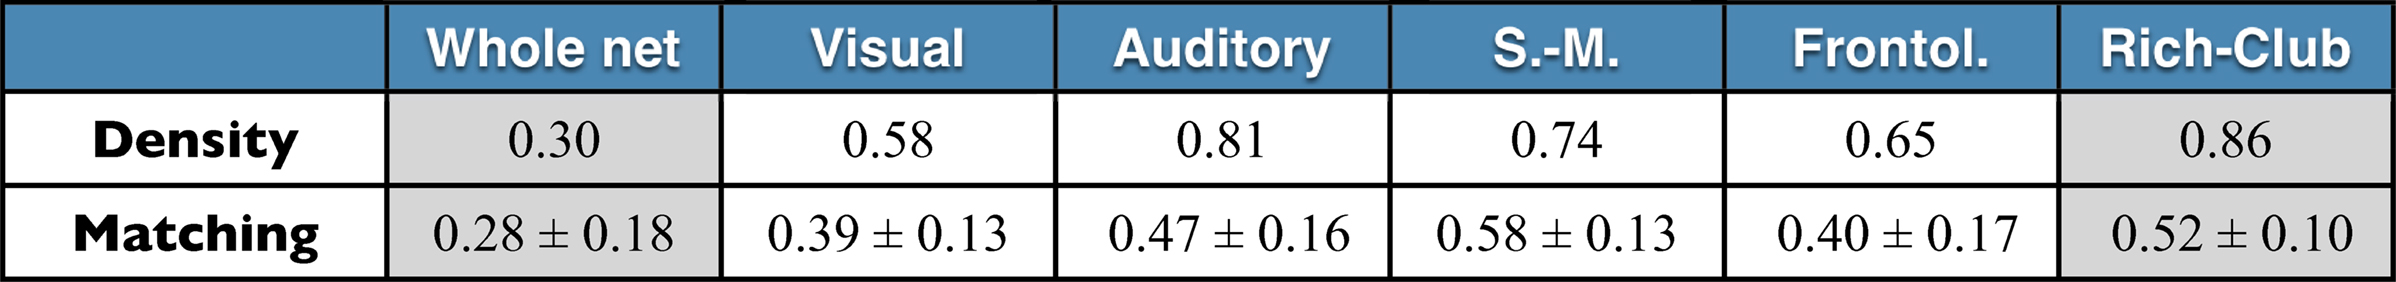
Table 1. Comparison between the anatomical modules and the Rich-Club. Both the internal density of links and the average matching of the areas in each of the functional modules V, A, SM and FL are larger than the whole network averages. The same happens for the areas in the Rich-Club, with values comparable to, or larger than those for the anatomical modules.
Topological similarity of cortical hubs
A central assumption in systems neuroscience is that the function of brain regions are specified by their afferents and efferents (Passingham et al., 2002
). Under this assumption, it is to be expected that cortical areas of similar function, i.e. specialised in the processing of same modal information, should display a similar pattern of projections. In the case of the cortical hubs, it has been shown in the previous section that they form a tightly connected module. Whether this module could be regarded as a functional module, at least from a topological point of view, is the goal of the following analysis. The matching index MI(v,v′) is a graph measure to estimate the topological similarity of two nodes, by counting the number of common neighbours of v and v′ (Section “Graph Analysis”). In order to compare the values obtained for different pairs, the measure is normalised such that MI(v,v′) = 1 only if all the neighbours of node v are also all the neighbours of v′. See the example in Figure 1
.
We have computed the matching index for all pairs of cortical areas and the result is shown in matrix form, Figure 7
A. Visual inspection reveals the modular organisation of the network. This is reflected by the fact that MI(v,v′) is typically larger if both v and v′ belong to the same anatomical module, than if they belong to different modules. To highlight this difference, in Figure 7
B the distribution of the matching values is shown: when the areas belong to the same module (internal matching), or to different modules (external matching). The external matching has a broad skewed distribution but peaking near MI = 0.15. The internal matching displays a more constrained distribution with maximum at approximately MI = 0.55. In Table 1
the average matching of the network is compared to the average internal matching for each of the anatomical modules V, A, SM and FL. The internal averages are always larger than the global average despite the broad deviations, confirms the expected functional cohesiveness of the modules; not only in terms of their internal density of connections, but also in terms of their common connectivity.
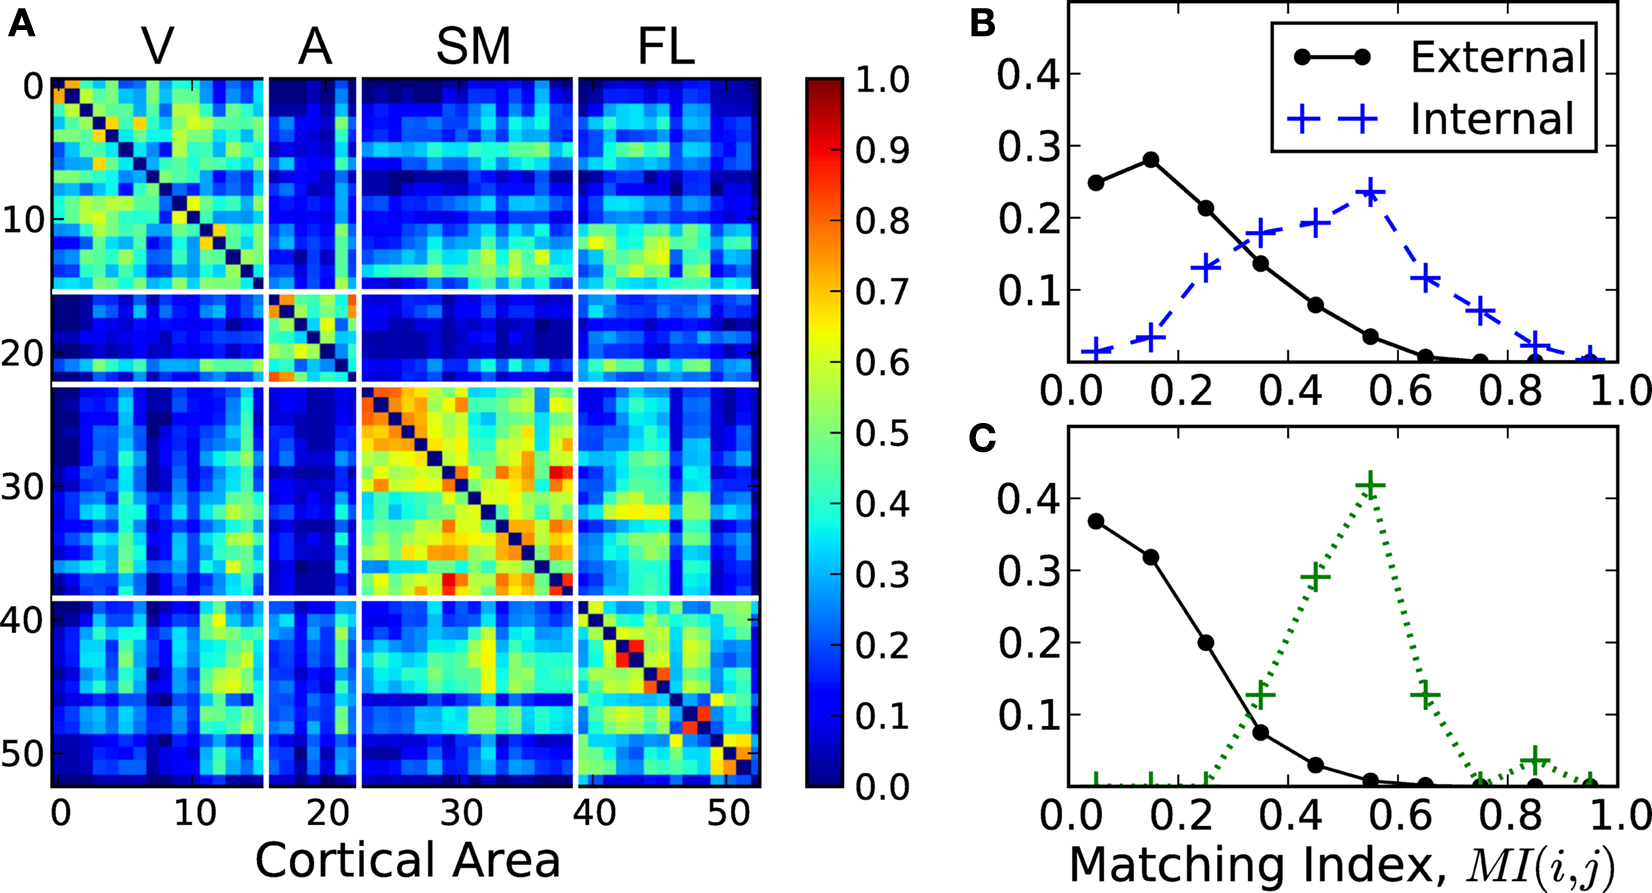
Figure 7. Topological similarity of cortical areas. (A) Pairwise matching index MI(v,v′) for all areas summarised in matrix form. Self-matching MI(v,v) is ignored for visualisation. (B) Distribution of the MI values in (A) if the areas v and v′ are in the same anatomical module V, A, SM or FL (dashed line), and if they belong to different modules (solid line). (C) Recomputed distribution of MI if the areas belong to different modules, but cortical hubs are discarded (solid line). And distribution of MI(v,v′) only if v and v′ are hubs in the Rich-Club (dotted line).
As pointed out, the distribution of external matching is skewed and contains some larger values up to MI ≈ 0.6. We find that most of these larger values are contributed precisely by the links between the cortical hubs which lie in different modules. We have recomputed the distribution of external matching, but ignoring the matching between the cortical hubs (solid line in Figure 7
C). The distribution decays now faster than in Figure 7
B. Finally, the distribution of the internal matching for the 11 hubs forming the rich-club is displayed (dotted line of Figure 7
C). It appears clearly separated from that of the distribution of external matching and peaking near MI = 0.55. Its average is 0.52 ± 0.10, comparable to, or larger than, the internal matching of the anatomical modules, Table 1
. These observations support the idea that the cortical hubs form a functional module on their own, as the anatomical modules do.
Hierarchical organisation and integration capacity
The two structural properties of the cortical hubs here presented, (i) hubs are densely connected with each other and (ii) they are functionally interrelated in terms of their inputs and outputs, extend the current understanding of cortical networks by uncovering that the multisensory hubs form yet another module which lies at a higher level in the hierarchical organisation. In the complex networks literature one finds two types of hierarchical topologies. The model after Arenas et al. (2006)
considers hierarchies as the agglomeration of modules, say, small modules join to form larger modules, Figure 8
A. Another type of hierarchy after Ravasz and Barabási (2003)
can be regarded as a tree-like fractal structure which produces modular networks with scale-free degree distribution. At each level, there is a central community connecting to all the modules at the same level, and to all modules in the hierarchies below. Such centralised patterns are repeated through different scales, Figure 8
B.
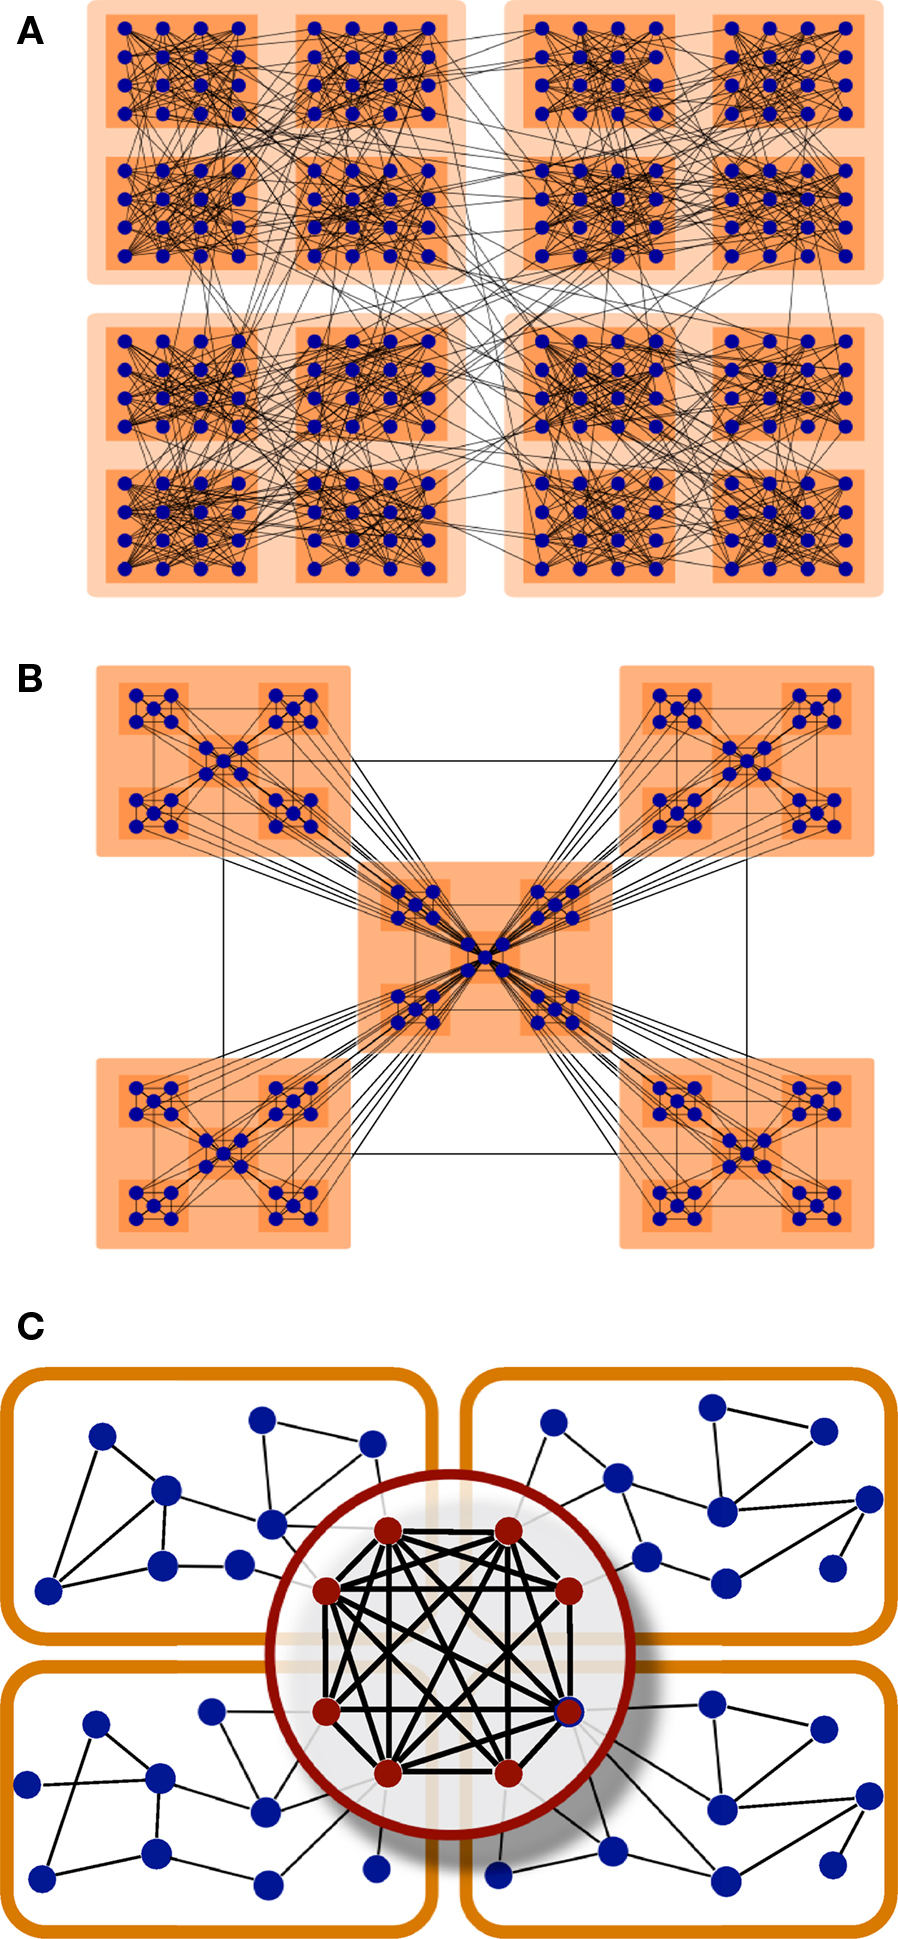
Figure 8. Hierarchical organisation of complex networks. (A) Hierarchies as agglomeration of modules (Arenas et al., 2006
). (B) Centralised and fractal hierarchical model (Ravasz and Barabási, 2003
). (C) Illustrative representation of the modular and hierarchical structure found in the corticocortical connectivity of the cat. The highest hierarchical level is formed by a densely interconnected overlap of the modules.
The organisation that we uncover here is none of these two, but it might be regarded as a combination of them. Notice that in the model by Arenas et al. (2006)
, the small communities are randomly linked to each other such that their union forms a larger community. In the present case, the inter-community links are not random, but centralised. Therefore, the highest hierarchical level is formed by a partial overlap of the underlying modules. See Figure 8
C for a schematic representation.
The functional implications of the topological findings described in this section, necessarily arise from intuitive interpretation of the intrinsic relationship between structure and function in neural systems. To provide a more solid ground to these intuitive interpretations, in the following section we challenge them by means of dynamical and information theoretical measures. We focus in a very simple dynamical model which has the benefit of being analytically solvable, although its validity for our purposes is confirmed by comparison to the dynamical output of more complex models, see Section “Information Theory and Integration”.
Functional Capacity of Integration
The structural organisation described in the previous section supports the idea that the cortical hubs might be responsible for combining the multisensory information hence facilitate the emergence of a global (integrated) perception. In this sense, we aim for a definition of integration which characterises the capacity of one or more nodes to receive information of different character and combine it to produce new useful information. Certainly, this definition involves crucial theoretical problems, e.g. what the character of information is, or what are the rules under which information is combined. Nevertheless, within a networked system, the nodes with a capacity to integrate information should obey certain measurable conditions. We propose the following:
1) Accessibility to information: A node can perform an integrative function only if it has general access to the information contained within the system.
2) Sharing of information: Two or more nodes can perform integrative function in a collaborative manner only if they are sufficiently connected with each other.
3) Segregation after selective damage: If a node has an integrative function, its removal should lead to a decrease of the integrative capabilities of the whole system.
From the structural point of view, the hubs listed in Figure 6
B obey these three conditions. They are the most central areas and they are densely connected to each other. Besides, robustness studies (Kaiser et al., 2007
) have shown that intentional lesion of the highly connected cortical areas largely affect the communication within the network. In the following, we introduce a framework to characterise the integrative function of the hubs by means of dynamical systems and information theory. Additionally, we perform a probabilistic analysis of the composition of the dynamical core, rather than a deterministic one. The reason is that even if the corticocortical networks of the cat is the most complete and reliable dataset of its kind up to date, it is not free of experimental errors. For example, some of the real connections might still be absent in the data. We aim to discriminate those hubs which, grouped together, possess a larger potential to integrate multisensory information from those groups which might have lesser capacities. For that, we arbitrarily choose all the areas with output degree ko(ν) ≥ 20 as potential members of the integrator module giving rise to a set of Ns = 19 areas:
Shubs = {20a, 7, AES, EPp, 6l, 6m, 5Am, 5Al, 5Bm, 5Bl, SSSAi, SSAo, PFCL, Ia, Ig, CGa, CGp, 35, 36}.
The statistical analysis consists in measuring the integrative capacities of all the 524,097 combinations of sizes Ns = 1 to Ns = 19 out of the 19 hubs in Shubs.
Integration capacity after sensory stimulation
Consider the linear System (6) with  being the transposed and normalised adjacency matrix of the cat 𝒢eat. All areas are driven by a small Gaussian noise level ξi = 1.0 and coupled by g = 0.5. This case might be regarded as the activity of the network in the resting-state because all xi are driven by noise of small intensity and there is no sensory input. Now, we intend to illustrate the joint capacity of a group of areas to integrate information of different character. Even if it is unclear how to define the character of information, in the case of cortical networks it is known that sensory information enters the cortex through specific regions termed as primary sensory areas: primary visual cortex (area 17), primary auditory cortex (area AI) and primary somatosensory cortex (areas 1, 2 and 3b). According to Scannell et al. (1995)
the cortical areas 1, 2 and 3b are subregions of the primary somatosensory area, named by some authors as SI. Hence, we simultaneously excite all the primary sensory areas {17, AI, 1, 2, and 3b} by assigning them a larger noise level ξj = 10.0) and we measure the integration I(S) of all the subsets S of hubs out of Shubs. Because of the excited condition, we denote the integration of the subsets as Ie(S).
The results depicted in Figure 9
A show that Ie(S) can largely differ. For example, among all the subsets of size Ns = 10, the integration of some of them is very small, Ie(S) ∼ 0.1, while the integration of others becomes much larger, Ie(S) ∼ 0.5. These differences permit us to identify those cortical hubs which, grouped together, become more statistically dependent among them as a consequence of the multisensory stimulation. Considering only those subsets whose Ie(S) lies within the largest 10% (red crosses in Figure 9
A) a co-participation matrix C is constructed such that Cij is the number of times (given in frequency) that two cortical hubs participate together in one of the maximal sets, Figure 9
B. It is observed that areas {7, AES; EPp; 6m; Ia, Ig, CGp, 35, 36} participate together in over 75% of all the maximal sets. Visual area 20a and the somatosensory-motor area 6l participate only in 50% of the occasions with those areas in the core. The remaining areas, {5Am, 5Al, 5Bm, 5Bl, SSSAi, SSSAo and PFCL}, can be discarded as members of the dynamical core.
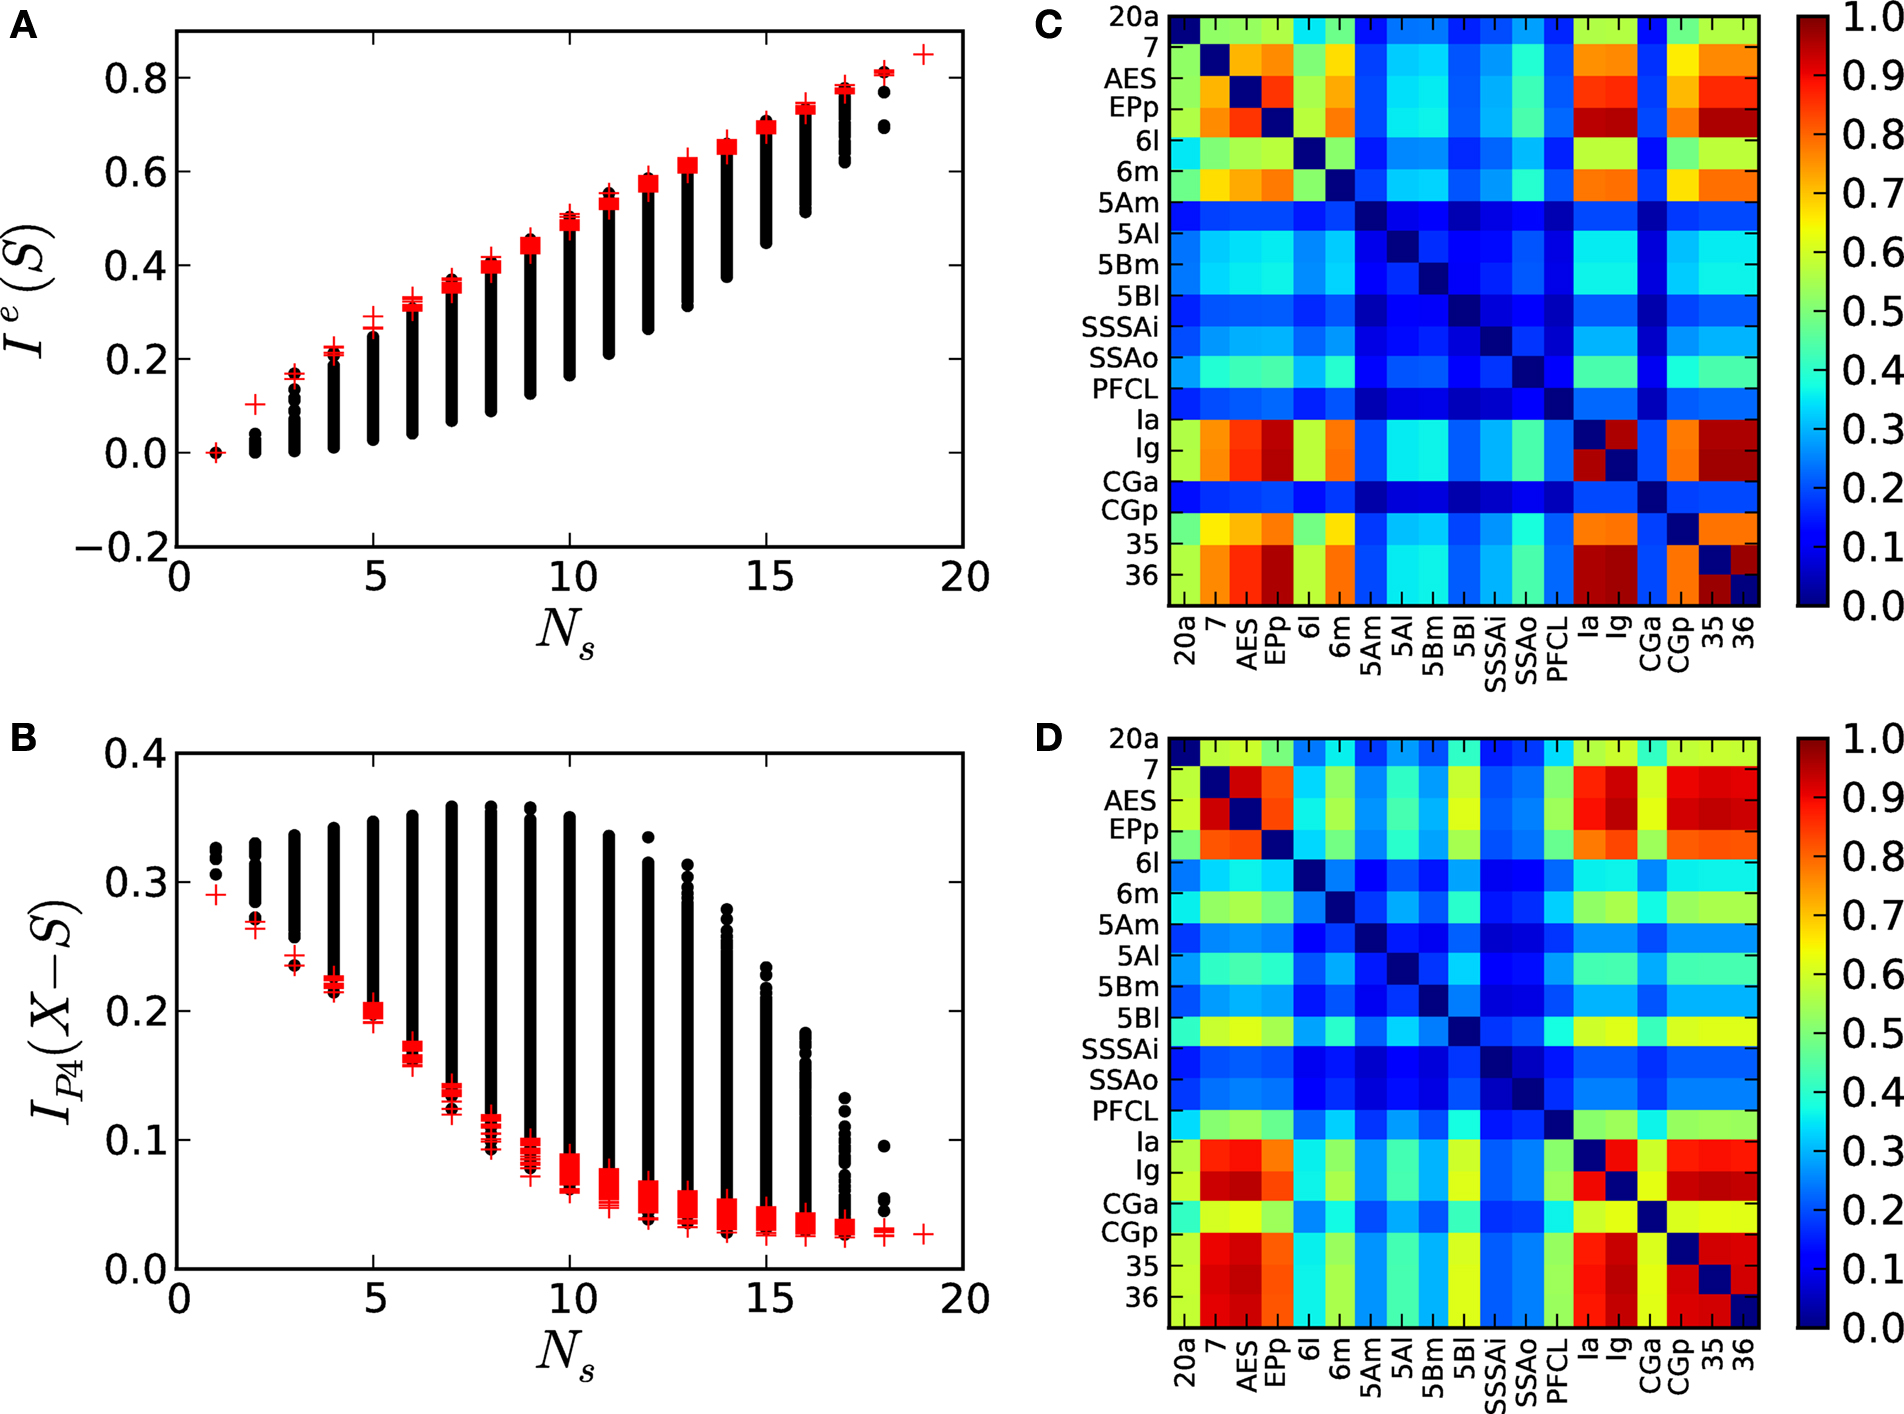
Figure 9. Functional segregation and integration. (A) Local integration I(S) of cortical hubs after stimulation of the primary sensory areas. (B) Co-participation matrix of cortical hubs within the subsets leading to large Ie(S) (red dots). (C) Modular integration  of the sensory modules V, A, SM and FL after simultaneous lesion of cortical hubs. NS is the number of hubs removed. (D) Co-participation matrix of the hubs within the subsets S which lead to a larger decrease in the dynamical dependence
  of the sensory modules (marked by red dots).
of the sensory modules V, A, SM and FL after simultaneous lesion of cortical hubs. NS is the number of hubs removed. (D) Co-participation matrix of the hubs within the subsets S which lead to a larger decrease in the dynamical dependence of the sensory modules (marked by red dots).Dynamical segregation after multiple lesions
Within a networked system the removal of critical nodes should lead to a decrease in its integrative capacities. In the following, we study the impact of targeted lesions of the corticocortical network of the cat, 𝒢cat. For all the possible subsets S composed of hubs in Shubs, we perform a lesion to the network by simultaneously removing the nodes xi ∈ S and characterise the consequent functional segregation of the network 𝒢S = 𝒢cat − S as the change in statistical dependence between the four modules (V, A, SM and FL). Lesion of areas critical for the integration capacities of the system should lead to a dynamical segregation of the modules, i.e. a decrease in their statistical dependence.
Recall that integration I(X) as defined in Eq. 7 is an extension of the mutual information for more than two systems. It represents the limit case in which the statistical dependence among all the elements xi in the system X is quantified. To cover different scales of organisation we propose to characterise the statistical dependence between groups of elements. Imagine a partition 𝒫 = {S1,S2,…,Sn} into n groups (modules) of the elements xi such that X = S1 ∪ S2 ∪…∪Sn. Then, we define the modular integration of the partition 𝒫 as:

Note that when n = N, then I𝒫(X) = I(X).
Considering the partition 𝒫4 = {V, A, SM, FL} and the corticocortical network of the cat, then  . The modular integration of each lesioned network 𝒢S is computed for the partition 𝒫4. Notice that (a) the nodes are also removed from the partition and (b) every 𝒢S is adequately normalised by its largest eigenvalue such that the measured observables are comparable across realisations (see Section “Information Theory and Integration”). The results in Figure 9
C permit us again to discriminate between subsets of hubs whose simultaneous removal lead to a large segregation of the network, while removal of other subsets has barely no effect. For example, among all the possible lesions of size NS = 10, some trigger a large segregation of the modules,
. The modular integration of each lesioned network 𝒢S is computed for the partition 𝒫4. Notice that (a) the nodes are also removed from the partition and (b) every 𝒢S is adequately normalised by its largest eigenvalue such that the measured observables are comparable across realisations (see Section “Information Theory and Integration”). The results in Figure 9
C permit us again to discriminate between subsets of hubs whose simultaneous removal lead to a large segregation of the network, while removal of other subsets has barely no effect. For example, among all the possible lesions of size NS = 10, some trigger a large segregation of the modules,  while other lesions do even increase their dynamical dependence:
  .
.
. The modular integration of each lesioned network 𝒢S is computed for the partition 𝒫4. Notice that (a) the nodes are also removed from the partition and (b) every 𝒢S is adequately normalised by its largest eigenvalue such that the measured observables are comparable across realisations (see Section “Information Theory and Integration”). The results in Figure 9
C permit us again to discriminate between subsets of hubs whose simultaneous removal lead to a large segregation of the network, while removal of other subsets has barely no effect. For example, among all the possible lesions of size NS = 10, some trigger a large segregation of the modules, while other lesions do even increase their dynamical dependence: .Selecting only those subsets whose lesion leads to a larger segregation of the modules, i.e.  lies among 10% of the minimal modular integration for each size NS (red dots in Figure 9
A), a co-participation matrix C is constructed, Figure 9
D. The entries Cij are the number of times (given in frequency) that two areas participate together in one of the minimal subsets. A core of cortical areas is found which participate together in over 70% of these cases: {7, AES; EPp; Ia, Ig, CGp, 35, 36}. Somatosensory-motor areas 6m, 5Al and 5Bl join them in over 50% of the cases.
lies among 10% of the minimal modular integration for each size NS (red dots in Figure 9
A), a co-participation matrix C is constructed, Figure 9
D. The entries Cij are the number of times (given in frequency) that two areas participate together in one of the minimal subsets. A core of cortical areas is found which participate together in over 70% of these cases: {7, AES; EPp; Ia, Ig, CGp, 35, 36}. Somatosensory-motor areas 6m, 5Al and 5Bl join them in over 50% of the cases.In summary, both the multiple lesion and the multisensory excitation analysis performed in this section lead to the identification of the same cortical hubs as responsible for the integration of multisensory information in the corticocortical network of the cat. Moreover, this set largely coincides with the top hierarchical level found by the graph analysis in Section “Topological Capacity of Integration”, corroborating the integrative function assigned to the hubs by intuitive interpretation of their topological characteristics.
In this paper we have analysed the modular and hierarchical organisation of the corticocortical network of the cat and its relationship to the intrinsic necessities of the brain to simultaneously segregate and integrate multisensory information. From the topological point of view, we have extended the current understanding of cortical organisation with the finding that the cortical hubs form a central module on top of the cortical hierarchy; which is expressed as the partial overlap of the four anatomical modules (visual, auditory, somatosensory-motor and frontolimbic). By means of dynamical and information theoretical measures, we have corroborated its capacity to integrate multisensory information, i.e. after simultaneous excitation of visual, auditory and somatosensory primary areas, a particular set of hubs becomes statistically dependent forming a dynamical cluster. Additionally, the simultaneous lesion of these hubs leads to a largest decrease in the integrative capacities of the network. Both structural and functional results indicate that visual areas 7 and AES, auditory area EPp and frontolimbic areas Ia, Ig, CGp, 35 and 36 are the most likely candidates to form the top hierarchical module. The participation of somatosensory-motor areas is less clear, although area 6m is the strongest candidate of them. Visual area 20a and somatosensory-motor areas 5Al and 5Bl are also potential candidates.
The modular and hierarchical organisation here detected agrees with the behaviour observed in dynamical simulations of cortical networks. The resting state dynamics are typically governed by the formation of dynamical clusters which closely relate to the anatomical modules, but the influence of the hierarchical organisation is also expressed. In Zemanová et al. (2006) and Zhou et al. (2006
, 2007)
it was shown that the correlation between the dynamical clusters is mediated by the cortical hubs. In Honey et al. (2007)
the centrality of the hubs was found to oscillate in time. Simulation of excitable dynamics on hierarchical networks (Müller-Linow et al., 2008
) has shown that the dynamical behaviour of the cortical network of the cat may be dominated either by the modular structure or by the hubs, depending on the time scales.
Segregation, Integration and Localisation
The separation of modal information paths is a relevant characteristic of organisation in the nervous system that permits simultaneous (parallel) processing of sensory input and detection of its features. Cortical regions containing neurones specialised in similar function, e.g. in processing information of the same sensory modality, lie geographically close to each other (Figure 10
A). However, a coherent perception and the emergence of mental states such as awareness and consciousness require that information is integrated at different levels: the binding of sensory features into entities, the combination of entities with memories (personal experiences) into events, etc. While experimental techniques have led to a deep understanding about the basis of sensory perception, the nature of integration and the localisation of brain regions involved in it, is still under the subject of debate. As stated by Fuster (2003)
, simple extrapolation of the principles of sensory organisation do not lead to the identification of the substrate for cognition.
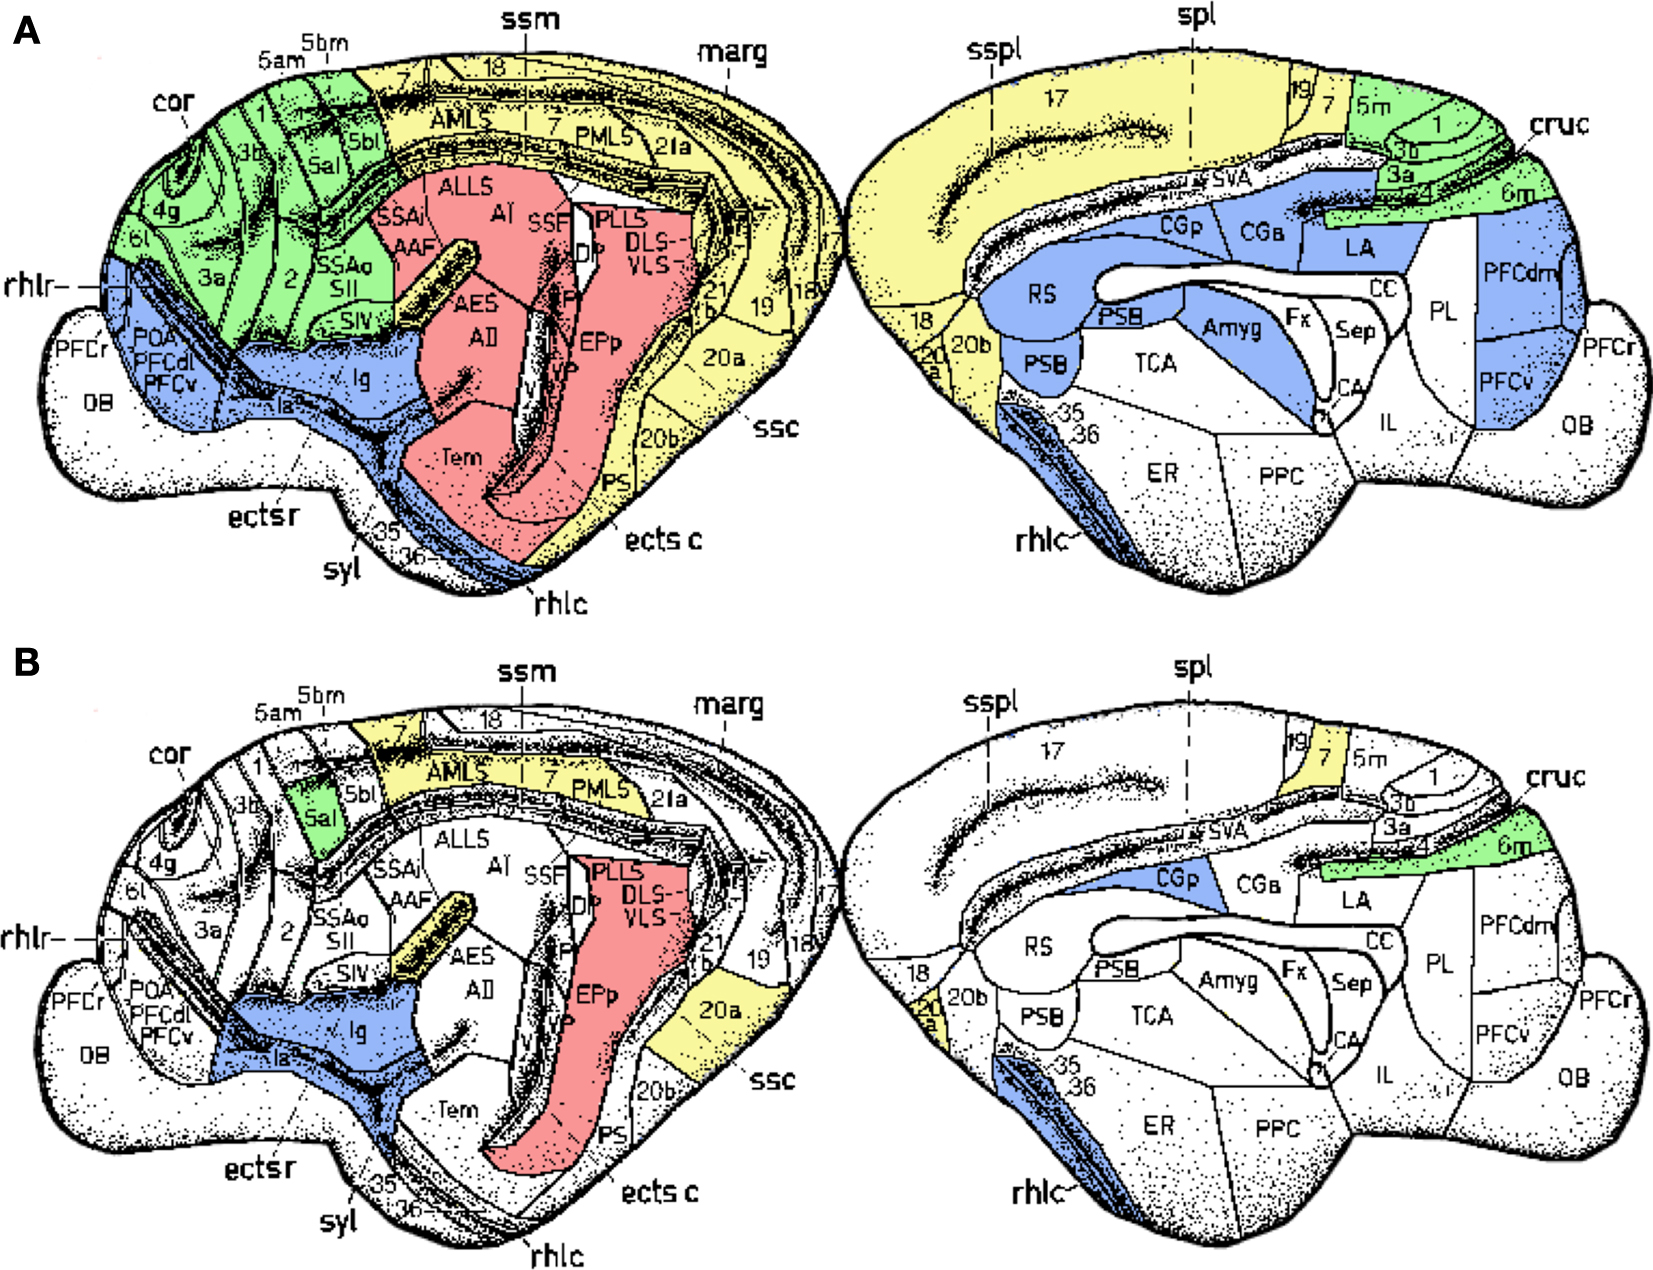
Figure 10. Spatial location of the areas according to their modality: visual (yellow), auditory (red), somatosensory-motor (green) and frontolimbic (blue). While areas of similar modality tend to lie close to each other (A), the hubs form a topological cluster which is spatially delocalised (B).
Several models have proposed that high-level functions are represented by distributed, interactive and overlapping networks of neurones, which transcend any of the traditional subdivisions of the cortex by structural (cytoarchitecture) or functional criteria (Damasio, 1989
; Fuster, 2003
, 2006
; Tononi, 2004
). During the recent years increasing experimental evidence has confirmed this hypothesis and the networked perspective has gained the favour against the assumption of a single brain region fully responsible for integration (Stam and Reijneveld, 2007
; Bullmore and Sporns, 2009
; Knight, 2009
). The anatomical networked connectivity may serve as the basis in which localised and distributed functional networks rapidly emerge and dissolve governed by coordination dynamics according to the sensory stimulation and the ongoing activity (Bressler and Kelso, 2001
).
As a further evidence, our results resolve the anatomical organisation substrate that supports the capacity of the cerebral cortex to simultaneously segregate and integrate information. In the light of this organisation, it could be envisioned that multisensory integration emerges from the collaborative function of the cortical hubs. While early sensory cortical regions perform specialised processing of the sensory input, the hubs of the network may work together to combine the multisensory information. A relevant organisation difference is that the cortical hubs form a module which is densely connected by axonal paths through the white matter, but is geographically delocalised (Figure 10
B).
Limitations and Outlook
The current paper focuses in the corticocortical connectivity of cats because it is, up to date, the most complete and reliable dataset of its kind. Hence, it is the most suitable for a detailed and statistically consistent analysis. The main limitation is that it comprises of interconnection between cortical areas in only one cerebral hemisphere. Because of the known inter-hemisfere differences in many mammals, particularly in humans, it will be very valuable in the future to acquire the connectivity within and between both hemispheres in animal and human models. Based on current literature in which the cortical networks of the macaque and cat models display similar features, we expect that the general organisation principles here exposed to be valid in a wide range of mammals.
An interesting challenge is now to explain the emergence of this modular and hierarchical organisation in terms of evolution and development, in particular how the delocalised cluster of hubs could have evolved if, apparently, areas of similar function tend to be grouped close to each other. Very likely, the balancing between short wiring requirements (leading to minimisation of energy costs) and short processing paths allowing for robustness and fast responses (Kaiser and Hilgetag, 2006
) plays a major role. It would also be of relevance to find out whether similar hierarchical patterns are repeated across smaller scales within the cortex, i.e. the interconnections between cortical columns and micro-columns. This would imply an underlying fractal-like complex architecture which can emerge from simple rules of assembly during development.
Finally, we should remind that current non-invasive techniques such as EEG, MEG and fMRI reveal only the presence of brain activity. They permit to identify which brain regions are associated with certain experimental condition. However, at the current stage it is very difficult, if not impossible, to understand what is exactly an activated region doing. Is it filtering a signal? Is it integrating information? Is an activation detected only because that particular region contains memories which are being retrieved and passed to other regions for processing? In our opinion, it would be highly interesting to further develop concepts of information theory as the modular and local capacity of integration here presented which applied to the time series of regional activity might help understand the particular function of individual brain regions within a given experimental task.
The authors declare that the research was conducted in the absence of any commercial or financial relationships that could be construed as a potential conflict of interest.
We thank Lucia Zemanová, Claus-C. Hilgetag and Werner Sommer for valuable discussions. Gorka Zamora-López and Jürgen Kurths are supported by the Deutsche Forschungsgemeinschaft, research group FOR 868 (contract No. KU 837/23-1) and by the BioSim network of excellence (contract No. LSHB-CT-2004-005137 and No. 65533).