A low-cost multielectrode system for data acquisition enabling real-time closed-loop processing with rapid recovery from stimulation artifacts
1
Department of Neurological Surgery, Emory University School of Medicine, Atlanta, GA, USA
2
Laboratory for Neuroengineering, Coulter Department of Biomedical Engineering, Georgia Institute of Technology and Emory University School of Medicine, Atlanta, GA, USA
Commercially available data acquisition systems for multielectrode recording from freely moving animals are expensive, often rely on proprietary software, and do not provide detailed, modifiable circuit schematics. When used in conjunction with electrical stimulation, they are prone to prolonged, saturating stimulation artifacts that prevent the recording of short-latency evoked responses. Yet electrical stimulation is integral to many experimental designs, and critical for emerging brain-computer interfacing and neuroprosthetic applications. To address these issues, we developed an easy-to-use, modifiable, and inexpensive system for multielectrode neural recording and stimulation. Setup costs are less than US$10,000 for 64 channels, an order of magnitude lower than comparable commercial systems. Unlike commercial equipment, the system recovers rapidly from stimulation and allows short-latency action potentials (<1 ms post-stimulus) to be detected, facilitating closed-loop applications and exposing neural activity that would otherwise remain hidden. To illustrate this capability, evoked activity from microstimulation of the rodent hippocampus is presented. System noise levels are similar to existing platforms, and extracellular action potentials and local field potentials can be recorded simultaneously. The system is modular, in banks of 16 channels, and flexible in usage: while primarily designed for in vivo use, it can be combined with commercial preamplifiers to record from in vitro multielectrode arrays. The system’s open-source control software, NeuroRighter, is implemented in C#, with an easy-to-use graphical interface. As C# functions in a managed code environment, which may impact performance, analysis was conducted to ensure comparable speed to C++ for this application. Hardware schematics, layout files, and software are freely available. Since maintaining wired headstage connections with freely moving animals is difficult, we describe a new method of electrode-headstage coupling using neodymium magnets.
Perhaps the most widely used method for studying electrical population activity in neuronal networks is the multielectrode array (MEA), either as a microwire array in vivo (Buzsaki, 2004
) or a substrate-integrated array in vitro (Taketani and Baudry, 2006
). While such passive recordings provide useful data, recent advances in basic science and therapeutic applications require active manipulation of tissue with electrical stimulation (Arsiero et al., 2007
; Berger and Glanzman, 2005
; Kipke et al., 2008
; Novellino et al., 2007
; Potter et al., 2006
). Furthermore, nuanced, spatially precise stimulation will likely be critical for novel neural prostheses, for example, the hippocampal-cortical prosthesis proposed by Berger et al. (2005)
.
Interrogating and interacting with neural tissue at such a precise scale will benefit from systems that both stimulate and record from the same array of electrodes. Using the same electrodes for stimulation and recording permits greater spatial coupling for input and output mappings, and also reduces the total number of necessary electrodes. However, commercially available systems for conducting multielectrode recordings in freely moving animals (e.g., Plexon, Blackrock, Neuralynx) are neither designed nor tested for concurrent stimulation. Since some responses to electrical stimulation occur within 1 ms of stimulus offset (Olsson et al., 2005
), the ability to recover rapidly from stimulation artifacts is essential for observing evoked activity without bias. Therefore, the ability to record neural activity – including single unit, multiunit, and local field potential (LFP) activity – within milliseconds of a stimulus pulse is crucial for driving the field of recurrent (closed-loop) brain computer interfaces forward (Kipke et al., 2008
; Potter et al., 2006
).
With this goal in mind, we developed a multiple-microelectrode recording system for use in freely moving animals that recovers rapidly (<1 ms) from stimulation artifacts. As a benefit of developing the hardware and software in-house, we are able to reduce the cost of this system to less than US$10,000 for 64 channels, and also release the hardware and software designs publicly with open-source licensing. Such licensing allows for easy adoption of our system by other laboratories, and encourages community modification and improvement. This current effort advances our previous work on creating low-cost, closed-loop technology for in vitro applications (the open-source MeaBench software (Wagenaar et al., 2005
), the RACS stimulation system (Wagenaar and Potter, 2004
), and the artifact suppression algorithm SALPA (Wagenaar and Potter, 2002
)), with the primary goal of supporting research in freely moving animals, but also modernizing and simplifying user interfaces and providing more hardware modularity.
For our current system, we minimized artifact duration and reduced system cost by reducing the number of amplification stages and the system gain. Most contemporary systems for multielectrode recording have two stages of amplification: a headstage amplifier, close to the animal or preparation, and a larger amplifier later in the signal chain (sometimes mislabeled as a “preamp”). This traditional two-stage acquisition model is unnecessary, however, given advances in amplifier miniaturization and A/D resolution. For instance, data acquisition cards with 16-bit resolution and a range of ±100 mV, like the M-Series cards from National Instruments, have theoretical resolutions of 3 μV. This resolution, combined with the M-Series’ high input impedance (>10 GΩ;), would be adequate in itself to record neural signals without amplification. Though this is not to suggest that headstages are unnecessary. Modern headstages with gains of 100 or 1000 increase the signal amplitude to levels in excess of what is necessary to record high resolution data, relaxing the requirements of A/D performance. Further, the signal buffering provided by a headstage reduces artifact induced by cable movement (the size of commercial A/D cards does not allow them to be connected directly to an intact animal without a cable). Together, the two advances of increased A/D resolution and headstage gain obviate the need for a second stage of amplification, which represents an unnecessary cost, as well as a potential source of artifact during experiments with electrical stimulation. Indeed, many experimental recording systems already rely on single, integrated amplifiers (Blum et al., 2007
; Brown et al., 2008
; Imfeld et al., 2008
; Mavoori et al., 2005
; Santhanam et al., 2007
; Ye et al., 2008
).
Below, we first describe our system and its components, based on the advances of high resolution A/D cards and high gain headstages. This is followed by a detailed characterization of system and software performance, including an analysis of stimulation artifacts, compared to those observed on a benchmark system (a commercially available Plexon system). These artifacts are further examined in vivo, illustrating field potential and action potential responses to microstimulation in the anesthetized and unanesthetized rodent hippocampus, along with data from a microstimulated epileptic animal. This data confirms the performance of the system (i.e., <1 ms recovery from artifact), speaks to the nature of population spikes (Andersen et al., 1971
), and shows that high frequency oscillations (∼300 Hz), an important phenomenon in epilepsy (Rampp and Stefan, 2006
), can be triggered by microstimulation. Finally, we comment on the novelty of the design, compared to other systems described in the literature, and note an alternative configuration of the system which supports recording from substrate-integrated MEAs in vitro. Circuit designs, schematics, and software are all freely available online at http://www.johnrolston.com/
.
System Overview
The chief design criteria were (1) to obtain rapid recovery (<1 ms) from stimulation artifact, (2) produce a modular system which costs <$10,000 for 64-channels, and (3) create open-source software that can run on a standard desktop computer. The resulting system for microelectrode recording from freely moving animals (Figure 1
, case ❶) is composed of (1) a head-mounting amplifier (i.e., headstage), (2) stacked interface PCBs providing power to the headstage and analog filtering of the recorded signals, (3) a data acquisition card, (4) a standard desktop computer, and (5) control software. These components are described in detail below. Variants of the system are possible by replacing different components (e.g., Figure 1
, case ❷ creates a hybrid Plexon system, and Figure 1
, case ❸ shows an in vitro arrangement, using a MultiChannel Systems (Reutlingen, Germany) preamplifier).
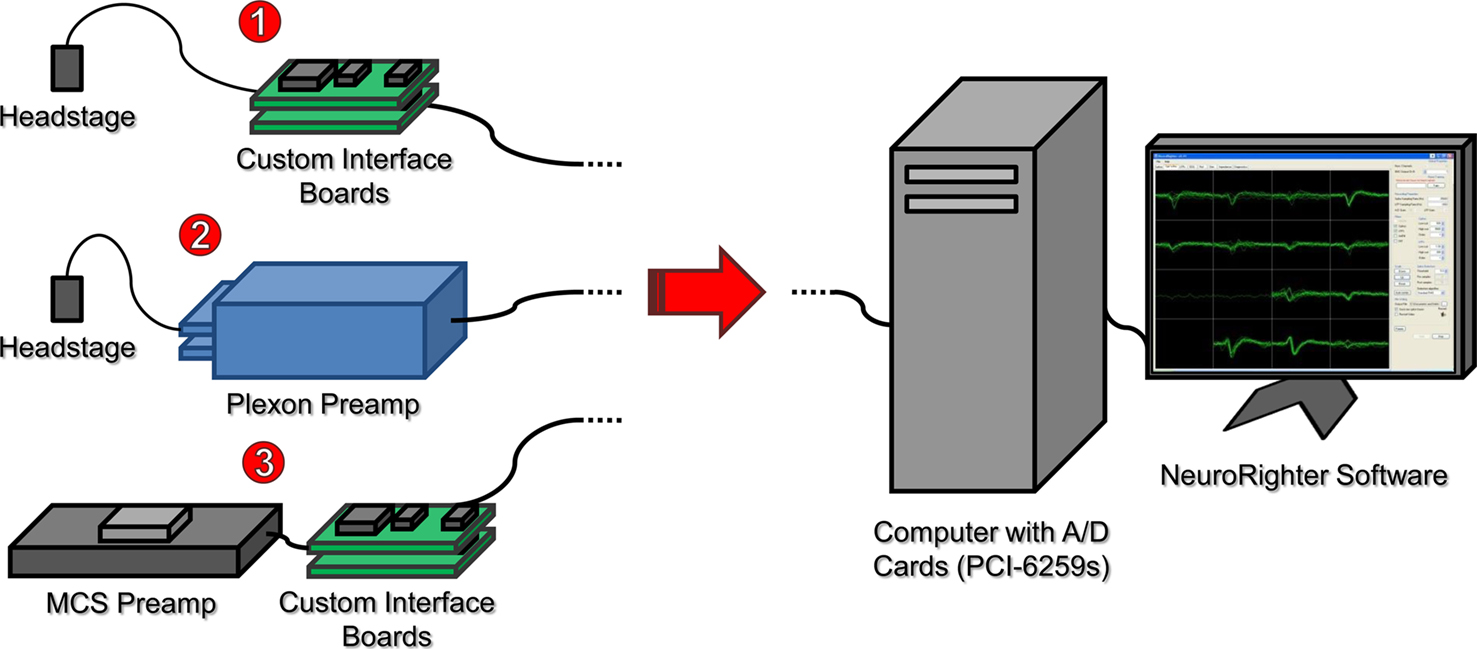
Figure 1. System overview illustrating multiple use cases. ❶ A head-mounting amplifier (headstage) buffers multielectrode signals and sends them to custom interface PCBs. These boards provide filtered power to the recording headstage and an analog band-pass filter for the acquired neural signals. ❷ A Plexon headstage sends amplified neural signals to a Plexon preamplifier, which provides further amplification and band-pass filtering for the acquired signals. ❸ A MultiChannel Systems (MCS) preamplifier amplifies and filters neural signals from substrate integrated MEAs. Power is supplied by custom interface boards, as in ❶. In all cases, signals are digitized with a National Instruments PCI-6259 data acquisition card, hosted by a standard desktop computer. Acquisition, visualization, and recording are controlled through our open-source NeuroRighter software.
Recording Headstage
Neural signals are amplified by one or more 16-channel head-mounting amplifiers with 100× gain [Triangle Biosystems, Inc. (TBSI); Durham, NC, USA], suitable for recording from awake, behaving animals. The headstage weighs <0.75 g and utilizes an 18-pin Omnetics Nano connector with six guide posts to interface with microwire arrays (Omnetics Connector Corporation; Minneapolis, MN, USA). This is a standard connector, whose mate is used by probe manufacturers such as TDT (Tucker-David Technologies; Alachua, FL, USA), NBLabs (Denison, TX, USA), MicroProbe Incorporated (Gaithersburg, MD, USA), and Neurolinc Corporation (New York, NY, USA). Via an adaptor (available, for example, from Plexon Inc.; Dallas, TX, USA), this connector can also interface with silicon probes from NeuroNexus Technologies (colloquially “Michigan probes”; Ann Arbor, MI, USA), which do not use Omnetics connectors. The recording headstage has 17 amplified inputs (16 signal channels and one reference channel) and a ground connection. The ground connection is ultimately connected to earth (i.e., “chassis” ground) further in the signal chain. The headstage provides 18 output channels: the 17 amplified inputs (16 signal channels and one reference) and one channel of “buffered ground” (which provides a buffered representation of the ground potential at the headstage). Either the buffered ground or reference channel can be used for subsequent differential amplification, recording, or data acquisition. The headstage has built-in filtering, with −3 dB points at 0.8 Hz and 22 kHz. Also, the headstage is DC-coupled, with a gain of 1× at 0 Hz.
Headstage Stability: Magnetic Anchoring
Wired headstages, regardless of manufacturer, tend to unplug from the rat’s microwire array connector during long recordings. Various methods exist for dealing with this (metal clips, locking headstages, plastic connector shrouds, etc.). We have employed high-strength magnets. Grade N45 neodymium magnets measuring 0.25 × 0.125 × 0.125 inches (CMS Magnetics; Plano, TX, USA) were attached to the microwire array’s connector and the recording headstage’s connector, so that the magnets would attract when the recording headstage and array were apposed (Figure 2
). The magnets were fixed to their respective components with cyanoacrylate glue. This had no detectable effect on RMS noise levels (P = 0.44, paired t-test). This is to be expected, since the magnet is stationary in respect to the electrodes and recording headstage. The only movement relative to the magnetic field will come from the tethering wires, which make small-angle movements in relation to the field, originate ∼20 mm distal to the magnets, and are oriented largely parallel to the magnetic field lines.

Figure 2. Neodymium magnets to secure headstage. Strong, “rare earth” magnets are glued to both the implanted microwire array, and the recording headstage. These magnets ensure a firm connection during normal animal movement, while nevertheless allowing the connection to break with sufficiently high forces (e.g., the experimenter’s desire to end a recording, or an animal’s particularly violent motions). A breakable connection helps to prevent loss of the acrylic headcap.
Interface Boards
Design
The interface printed circuit boards (PCBs) are a collection of stacked boards with two or more levels (Figures 3
A,B). The top board provides power supply filtering and voltage regulation to the remaining boards. The lower boards, of which there can be an arbitrary number, provide analog filtering for the acquired neural signals and provide further power supply filtering and voltage regulation for a recording headstage. Each of these lower boards is linked to one 16-channel headstage. The boards communicate and send power via “stackthrough” connectors (Samtec; New Albany, IN, USA), making them readily modular for systems with higher channel count.
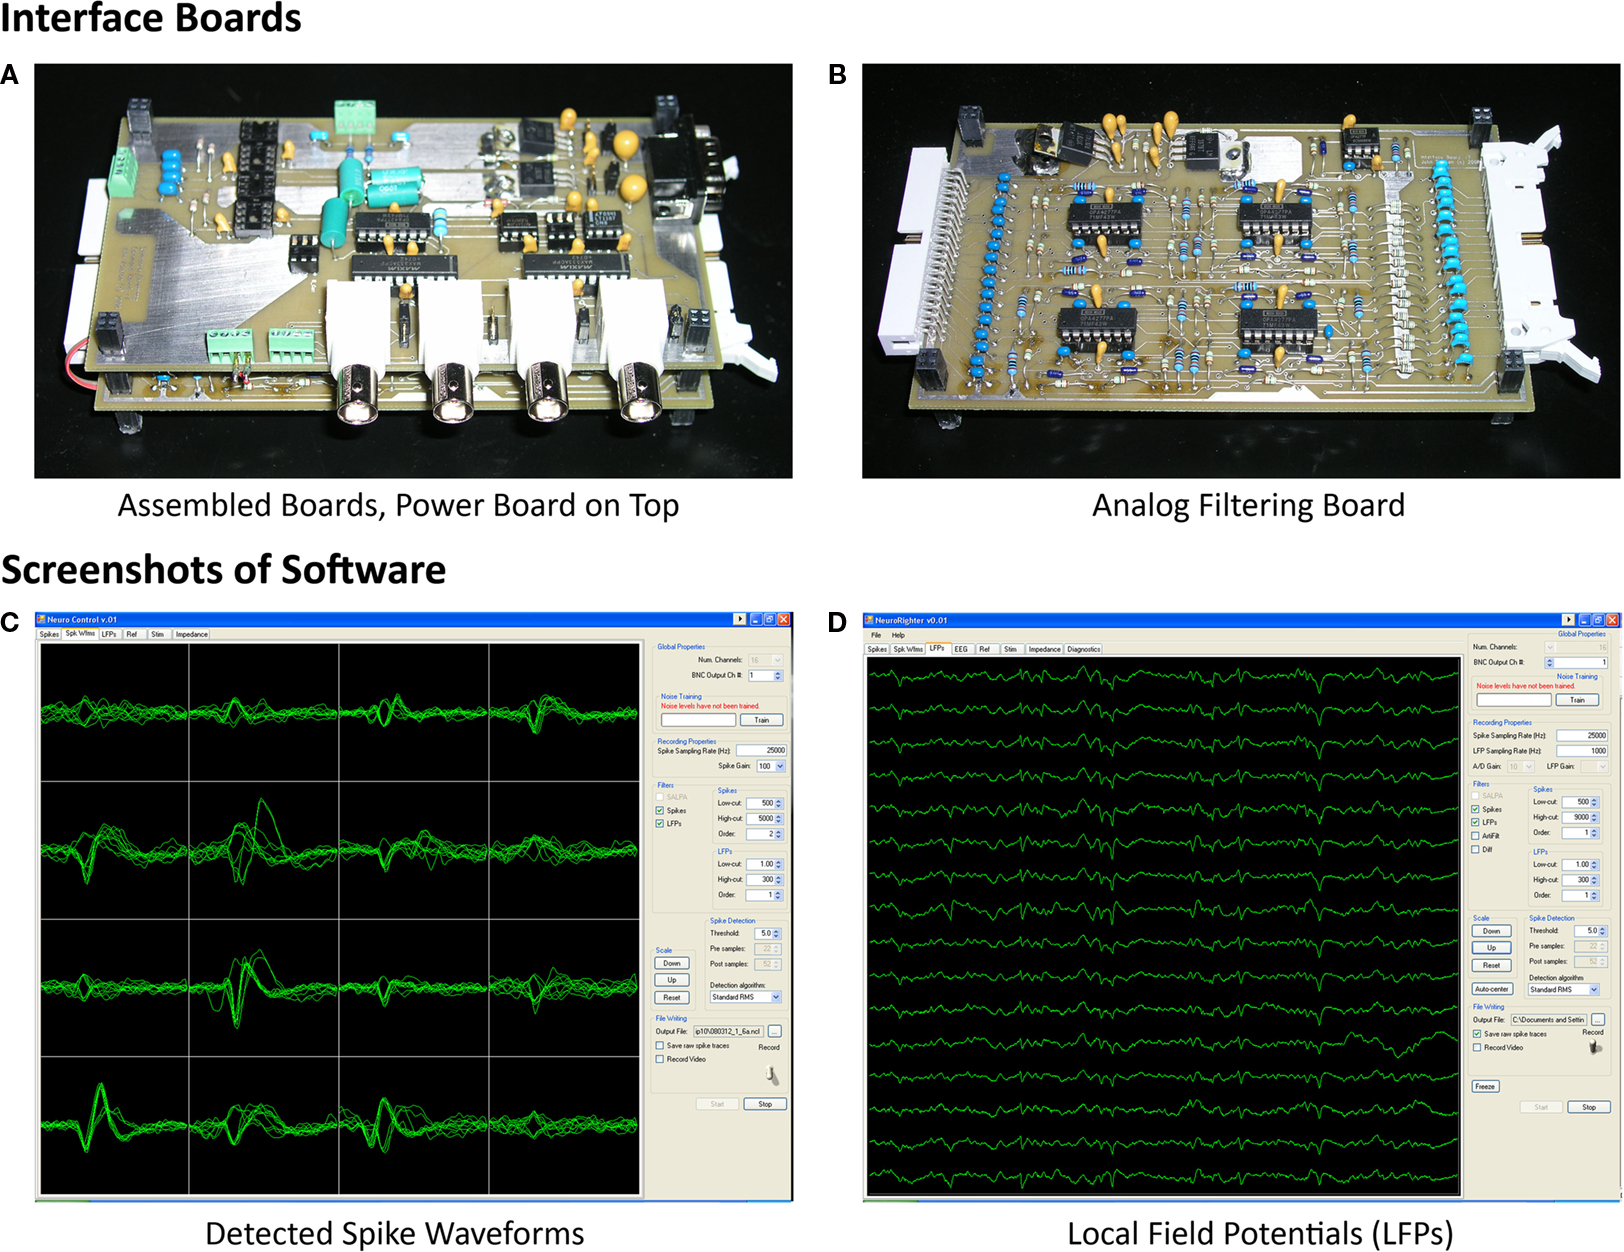
Figure 3. Photographs of interface PCBs and screenshots of NeuroRighter Software. (A) The stacking of one power board and an analog filter board is shown. Components on the power board handle power filtering and voltage regulation (upper right of board). Additional components are for future stimulation and EEG-recording applications (Rolston et al., 2007
, 2008
), not described in this article. The power board and filtering board beneath are connected with stackthrough connectors. (B) Analog filtering boards provide a regulated power supply to each recording headstage and filter acquired data from each channel (including the reference channel) through a two-pole active high-pass filter (ICs, resistors, and capacitors on the board’s left and middle) and a passive one-pole low-pass filter (resistors and capacitors on right of board). (C) The open-source NeuroRighter software provides visualization of detected action potential (“spike”) waveforms across all recording channels (16, shown in a 4 × 4 grid). Multiple methods for action potential detection are available. (D) LFPs are recorded from each channel by digitally band-pass filtering the raw data and downsampling. Five seconds of data are drawn for each of 16 channels. Recordings are from the hippocampus of an awake and behaving rat (see Experimental Methods).
PCB schematics and layouts were designed using version 2.1 of the free PCB123 software package (http://www.pcb123.com
). The board layouts and schematics are available under the Creative Commons Attribution-Share Alike 3.0
1
license, which permits free modification and replication of the work.
The 4-layered PCBs measure 6 by 3.5 inches (15.2 × 8.9 cm) and use standard dual inline package (DIP) ICs and through-hole components, allowing users to easily assemble the boards by hand. The PCBs do not require solder masks or silkscreens, which would increase the boards’ cost. The boards contain solely analog components, so division of grounds between analog and digital domains is unnecessary.
The interface boards are connected to the A/D cards by flat, 34-conductor, shielded cables (3M; St. Paul, MN, USA). The 34 conductors alternate between ground and signal, with the ground minimizing cross-talk between channels. The 17 signal-carrying lines are used for the 16 recording channels and one reference channel. The shielding around the entire cable is grounded, reducing unwanted electromagnetic interference (EMI).
Analog filtering
To prevent aliasing and reduce noise, acquired neural signals (and the reference channel) are band-pass filtered within the interface board. The band-pass filter is composed of a two-pole active high-pass filter, followed by a passive low-pass filter (Figure 4
). The active high-pass filter uses a voltage-controlled voltage-source (VCVS) topology (Horowitz and Hill, 1989
), which requires one operational amplifier (op-amp) per channel. We selected the OPA4277 quad op-amp (Texas Instruments; Dallas, TX, USA) for its low noise (1.1 μV RMS noise from 1 to 10 kHz), high precision (±10 μV typical), and wide power supply range (±2 to ±18 V). However, the pinouts of quad op-amp packages are standardized, so users may switch to compatible ICs if needed. High precision op-amps are used to ensure that signals are recorded with high fidelity.
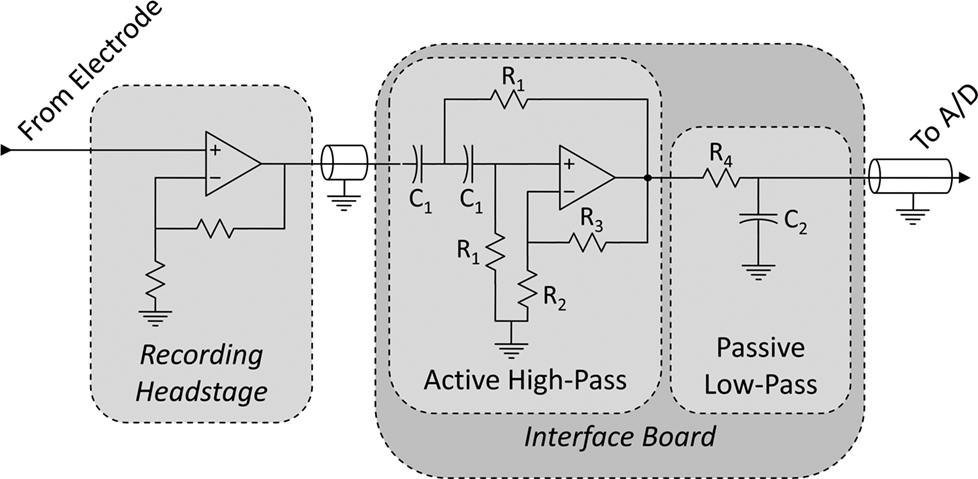
Figure 4. Signal chain from electrode to A/D card. Signals originate from a microwire electrode and are amplified within the recording headstage in reference to a common ground. These signals propagate to the interface PCB, where they are band-pass filtered, and then to the A/D card. The band-pass filter is composed of a two-pole active high-pass filter (voltage-controlled voltage-source topology, as in (Horowitz and Hill, 1989
) and a one-pole passive low-pass filter. Resistors labeled R1 and capacitors labeled C1 determine the −3 dB point of the high-pass filter, and R4 and C2 determine the −3dB point of the low-pass filter. R2 and R3 determine the nature of the high-pass filter (e.g., Butterworth, Bessel, etc.).
Filter poles are set by changing the circuit’s capacitors and resistors (R1, C1, R4 and C2 in Figure 4
). The −3 dB point is determined by the equation fC = 1/(2πRC) for both the low- and high-pass filters, provided the active filter is a Butterworth filter (Horowitz and Hill, 1989
). The class of high-pass filter (Butterworth, Bessel, Chebyshev) can be changed by manipulating R2 and R3 (taking care to revise fC, if creating a Bessel or Chebyshev filter, since doing so modifies the above equation by a constant depending on the filter’s order) (Horowitz and Hill, 1989
). For our purposes of recording action potentials and LFPs simultaneously, we prefer a band-pass filter from 1 to 8840 Hz, with a Butterworth high-pass filter (Butterworth filters have the flattest possible passband (Horowitz and Hill, 1989
). For our setup, this corresponds to R1 = 150 kΩ, R2 = 100 kΩ, R3 = 58.6 kΩ, R4 = 180 Ω, C1 = 1 μF, and C2 = 100 nF.
Recalling the 0.8 Hz −3 dB point of the recording headstage, the −3 dB point of the entire system (recording headstage, interface boards, A/D card) can be calculated from the product of each stage’s transfer function. For the one-pole filter of the recording headstage, the transfer function is
where G(f) is the gain at frequency f (in Hz) and RC = 0.2 for a filter with a −3 dB point at 0.8 Hz. The constant 100 accounts for the headstage passband gain. For the two-pole active filter, the transfer function is

where fc = 1/(2πR1C1) = 1 for a −3 dB point at 1 Hz. The product of the transfer functions, when computed, yields a combined, system-wide −3 dB point of 1.4 Hz (the A/D card has negligible influence on the high-pass pole).
The system’s VCVS filters provide a small gain. The gain depends on R2 and R3 in Figure 4 and is equivalent to 1 + (R3/R2). For our parameters, the gain is 1.6, leading to a system gain of 160.
It is important to ensure that the impedances of sources to the filter are low and the impedances of sinks are high to avoid loading the filter. The output impedance of the TBSI recording headstage is 158 Ω at 1 kHz (manufacturer’s specifications) – much lower than the impedance of the high-pass filter. Similarly, the input impedance to the A/D card, the PCI-6259 (National Instruments; Austin, TX, USA), is >10 GΩ in parallel with 100 pF, much higher than the passive low-pass filter’s impedance. These conclusions were verified in a PSPICE simulation which included the headstage and A/D card impedances. The simulation was conducted in OrCAD Capture CIS version 16 (Cadence Design Systems, Inc.; San Jose, CA, USA). The −3 dB points were as expected and a gain of 1.6 was realized.
Power supply
The interface boards have a wide supply range, ±2 to ±18 V, determined by the OPA4277 op-amps. The recording headstage, however, is constrained to a supply of ±2.25 to ±2.75 V. A supply voltage of ±2.5 V, therefore, would be adequate for the entire system. However, one of our design constraints is to minimize stimulation artifacts. While the TBSI headstage recovers from voltage transients outside its supply range within μs (see Results section), it is possible that the OPA4277 op-amps, when configured as filters, might experience more lengthy saturation when input signals approach the power supply rails, leading to longer artifacts. To guard against this possibility, we utilize two separate bipolar supply voltages for the interface boards: one at ±2.5 V for the headstages and one at ±6 V for the remaining ICs (i.e., the components controlling power supply and analog signal filtering). The additional headroom for the ICs helps minimize the chance of op-amp saturation.
The headstage power supply is regulated to ±2.5 V by one LM317 adjustable positive voltage regulator and one LM337 negative voltage regulator (ON Semiconductor; Phoenix, AZ, USA) per headstage. The regulators and their associated passive components further reduce power supply noise (0.025% line regulation; manufacturer’s specifications). An additional pair of LM317 and LM337s is present on the power supply board (the top board) to regulate the power to the interface board ICs (i.e., the op-amps for analog filtering). This initial pair of regulators (but not those for the headstages on each analog filtering board) can be bypassed with jumpers, if desired. This might happen if, for instance, the only available power supply is <9 V, in which case the regulators would not have the required voltage overhead to properly generate a ±6 V supply for the ICs.
In our setup, the system’s ±6 V power supply is generated by two rechargeable 6 V, 20 amp-hour lead-acid batteries (Power-Sonic Corp.; San Diego, CA, USA). The ground of the system is tied to the common terminal of the two batteries, which is then tied to the chassis ground of the data acquisition computer (and hence, the A/D cards). Using batteries minimizes ground loops and line noise.
Data Acquisition Cards
One 32-channel PCI- or PCIe-6259 data acquisition card (National Instruments; Austin, TX, USA) is used for every set of two 16-channel recording headstages and corresponding interface boards. The 16-bit A/D cards have programmable ranges from ±100 mV to 10 V, and a maximum sampling rate of 1 MHz (for the aggregate of channels; 31,250 Hz per channel). With the 160× gain of the headstage and interface boards, these specifications correspond to a worst-case voltage resolution of 38 nV. The A/D cards take measurements either in reference to system ground (“referenced single-ended,” in the National Instruments literature) or to a common reference for each bank of 16 channels (“non-referenced single-ended”). We prefer the latter arrangement, using the low-impedance, deinsulated 17th electrode of each microwire array as a reference electrode. Subtracting this common signal reduces movement artifact, stimulation artifact, and other common-mode interference. However, using an active reference increases RMS noise compared to a grounded reference (Figure 7
; see Results).
Software
To visualize, record, and process acquired neural signals, we created the NeuroRighter software application (Figures 3
C,D). We had three goals for this software. First, it had to be easy to use and install, for neurobiologists with no programming experience and little time to debug a new application. Second, it had to be easily extensible, so that new features could be added both by us and other users. Lastly, it had to be fast and robust enough to run on conventional desktop computers.
To address the first goal, ease-of-use, we developed the application for the Windows XP and Vista operating systems, since these platforms combined account for roughly 90–95% of installed operating systems
2
. Also, the application is graphical and hosted as a single process, rather than separate client and server applications, again to streamline usage. To make the software extensible, it has been developed under the GNU Public License
3
(GPL), version 3, making it and its derivatives free for noncommercial use. Because the software is open source, users can freely extend the code to suit their needs, and validate the code to protect against software errors, or “bugs” (Raymond, 2001
). Lastly, the software was written in C#, a modern, type-safe, object-oriented language (Liberty and Xie, 2008
), with aspects making it potentially easier to learn and program than the more widely used C/C++ (Chandra and Chandra, 2005
; Wilkens, 2003
).
Performance of C# compared to C/C++
Some features of managed languages like C# incur a performance penalty (e.g., garbage collection). If this penalty is too high, it would conflict with our third goal of acceptable performance on a standard desktop computer. To ensure that C# performs acceptably for data acquisition software, we created test programs to evaluate the running time of a simple algorithm. The algorithm mimics a type of operation done on a large buffer of acquired data. In this case, random data is copied to a new array with an arithmetic operation. This is similar, for instance, to a filtering operation, though filtering will have more arithmetic operations. The pseudo-code follows:
The runtime of the above algorithm in C++ was 9.34 ms, and in C# 9.25 ms, suggesting C# is as fast (actually, faster in this example) as C++ for typical operations in our domain.
Programming environment and libraries
Software development was carried out with Visual Studio 2008 (Microsoft Corp.; Redmond, WA, USA) and the Measurement Studio 8.6 component libraries (National Instruments). Programming was conducted on an Intel Xeon 3.2 GHz computer with 2 GB of RAM and the XP, Vista 32-bit, and Vista 64-bit operating systems (to ensure compatibility with all three).
Real-time signal processing
An overview of the signal processing sequence is given in Figure 5
. Briefly, raw data, acquired at 25 kHz, are band-pass filtered into two separate streams: one for detecting action potentials and multi-unit activity, and another for following LFPs. Action potentials (“spikes”) are best detected in a high frequency band, such as 500–9000 Hz. LFPs are band-passed typically from 1–500 Hz, and downsampled (the sampling rate is user-selectable; we prefer 2000 Hz). We generally record LFPs with a wide band (up to 500 Hz) to capture high frequency events, such as ripples and fast ripples (Rampp and Stefan, 2006
). Frequency cut-offs for the digital filters are user-selectable for arbitrary frequencies, as are the number of poles for each filter.
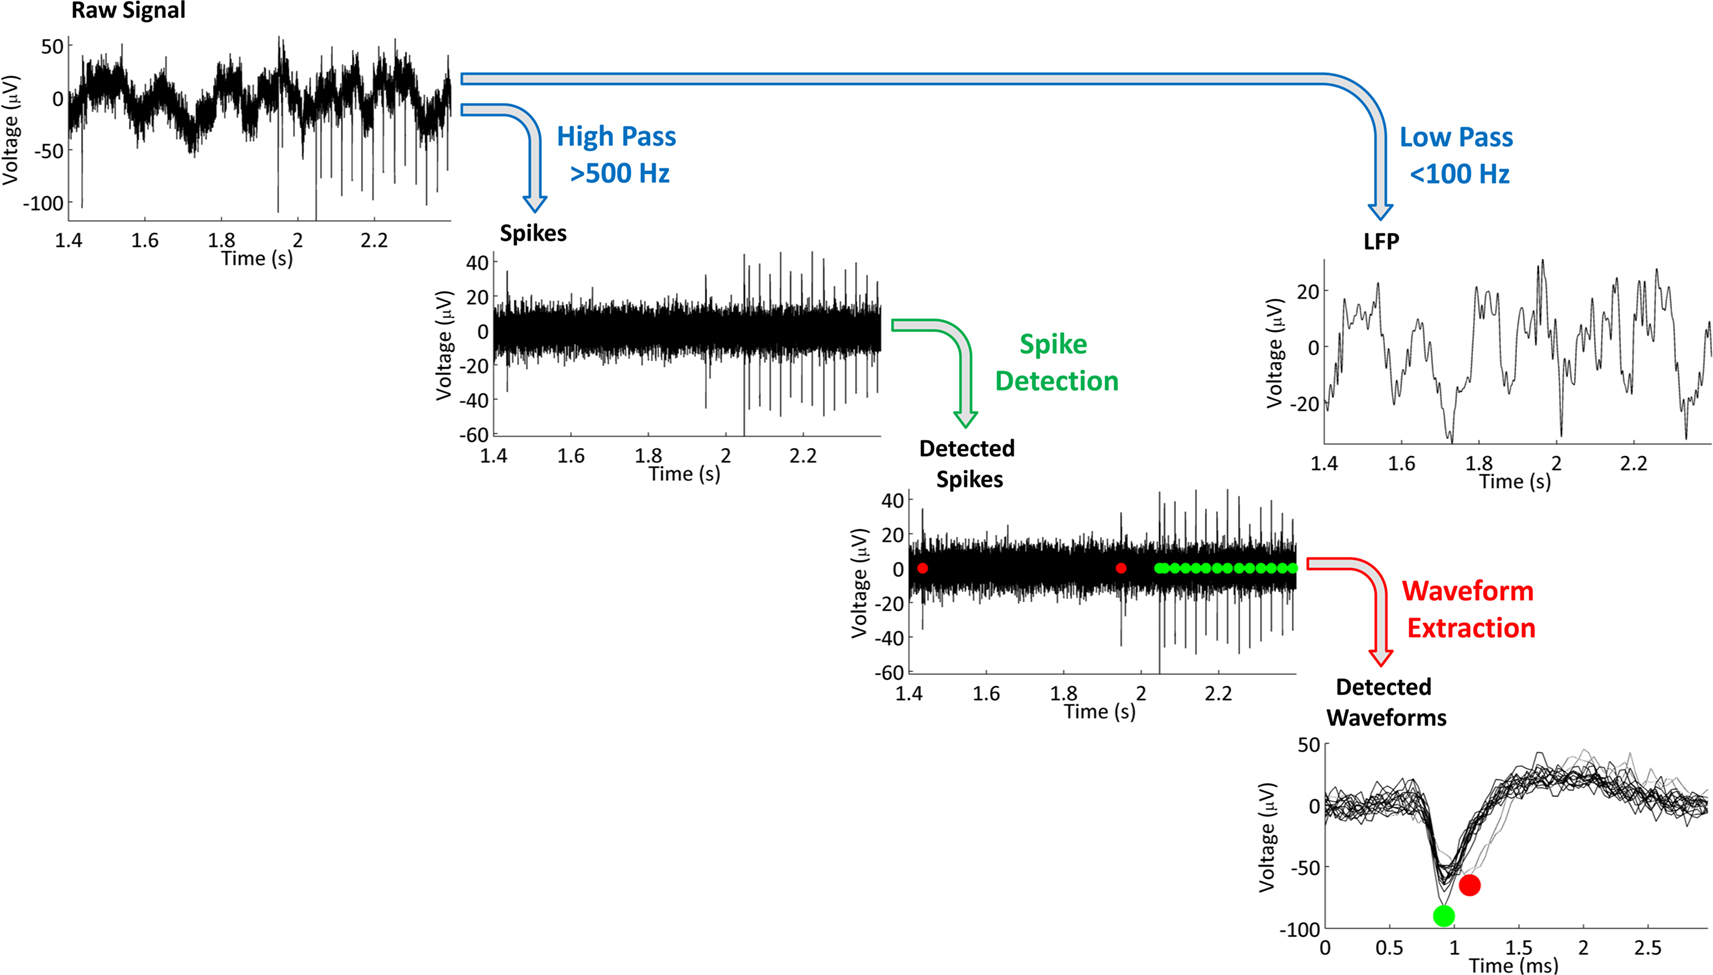
Figure 5. Signal processing steps. A raw signal is acquired, then split into two signals by digital filtering (blue arrows at top of figure). Low frequency data is downsampled and referred to as the local field potential (LFP). High frequency data is used to detect action potentials, or “spikes.” A user-defined threshold is used to detect candidate spike waveforms (green arrow in middle of diagram). Detected action potentials are indicated with red and green circles. Multiple 3-ms waveforms are extracted (red arrow, lower right). The two colors, red and green, indicate that the spikes likely arise from different cells, given their different waveforms. Data were recorded with our system from the dorsal hippocampus (CA3) of an awake, behaving rat.
Action potentials are detected by locating points at which the filtered signal crossed a user-defined threshold. There are multiple methods available in the NeuroRighter software for calculating this threshold in real-time: fixed RMS, adaptive RMS, adaptive median (Quiroga et al., 2004
), and Daniel Wagenaar’s “LimAda” method (Wagenaar et al., 2005
). Spikes are detected when they cross ±(K × Th), where K is a user-selected constant (typically 5.0), and Th is the threshold calculated by the selected method (e.g., fixed RMS). A user-determined number of sampling points, typically 75 (3 ms at a 25 kHz sampling rate), surrounding the threshold crossing are saved to file (for offline spike sorting; Lewicki, 1998) and visualized (to assay the quality of recordings).
Two sets of experiments were conducted: (1) artifacts were evaluated with either banks of resistors or MEAs submerged in artificial cerebrospinal fluid, using a Plexon system as a benchmark, and (2) artifacts were evaluated in vivo in anesthetized and unanesthetized animals.
Stimulation Artifact Testing
Tests for stimulation artifact were conducted with a custom-built stimulator, that can interface with conventional recording headstages, interposed between the headstage and electrodes (Rolston et al., 2007
). With this arrangement, we could monitor stimulation artifacts on the stimulating channel and neighboring channels. We used two systems for comparison: (1) a conventional system, consisting of a Plexon headstage (gain 1×) and preamplifier (gain 1000×) (Figure 1
, scenario ❷) and (2) the system described in the Section “System Design” (Figure 1
, scenario ❶). For each setup, we ran two experiments. First, ±10 and ±50 μA biphasic stimulation pulses (negative, cathodic phase first) were delivered when all inputs were connected through 560 kΩ resistors to ground (Plexon headstage tester unit; Plexon Inc.). Since the stimulator is interposed between the recording headstage and electrodes, the stimulation was delivered through the resistor to ground as well. Second, ±10 μA biphasic stimulation pulses (cathodic, negative phase first) were delivered through a microwire array (see “Animal Surgeries and Recordings,” below) submerged in artificial cerebrospinal fluid (ACSF; formulation as in Hammack et al., 2007
). This third arrangement approximates conditions in vivo. All pulses were 800 μs in length, with 400 μs per phase, a length determined by empirical measurements of stimulus efficacy (Wagenaar et al., 2004
). Ten presentations of each pulse were recorded and pulses were delivered at 0.25 Hz. Responses from non-stimulating electrodes were recorded by an adjacent electrode (175 μm distant).
Hereafter, we define an artifact as any non-physiological change in recorded signals induced by a stimulation pulse. With this definition, artifacts can last for appreciably long times, while still permitting useful information to be recovered before the artifact’s end. For instance, by digitally filtering artifacts, action potentials can be detected before the influence of the stimulation pulse on the electrode has ceased (Wagenaar and Potter, 2002
) (i.e., before the artifact has ended by our definition). On the other hand, there are components of an artifact that will never yield useful data, such as when the artifact induces amplifier saturation (or “railing”). To reconcile these ideas, we measured induced artifacts with two metrics, desaturation and recovery, covering the above described best and worst case scenarios. Desaturation refers to the point at which the amplifier output is no longer at the power supply rail, and when action potentials or other useful data could in principle be detected. Recovery refers to when the signals return and remain within 100 μV of baseline, which we see as a time when useful data is almost surely accessible if present, though perhaps requiring some form of filtering. The actual time at which action potentials could be recovered following a stimulation pulse falls somewhere between these two metrics, depending on the recording system and the filtering methods used.
Animal Surgeries and Recordings
To prove the system’s functionality in awake, behaving animals, microwire array recordings were taken from the dorsal hippocampi of adult male Sprague-Dawley rats weighing >350 g (Charles River Laboratories; Wilmington, MA, USA). Animal work was conducted in accordance with the National Institutes of Health Guide for the Care and Use of Laboratory Animals and approved by the Emory University Institutional Animal Care and Use Committee. Rats were anesthetized with 1.5–3.0% inhaled isoflurane and given a subcutaneous injection of buprenorphine (0.05 mg/kg) to minimize pain. A craniectomy was made over the right dorsal hippocampus, centered at 3.5 mm posterior and 2.8 mm lateral to bregma. The dura was incised with a sterile syringe needle and a microwire array (Tucker Davis Technologies) was implanted. The array had sixteen 33 μm diameter tungsten electrodes with polyimide insulation arranged in two rows of eight electrodes, with 175 μm between electrodes within a row and 1 mm between rows. The two rows had different lengths, 4.0 and 2.7 mm, with the former directed at the CA3 region of the hippocampus, and the latter at the more dorsal CA1 region. The microwire arrays had integrated reference and ground wires, 2 mm longer and with the final 2 mm de-insulated, which were positioned collinear with the longer row of the array. The array was positioned at a 50° angle to midline (counter-clockwise rotation, with the posterior end swung laterally) to match the contours of the hippocampus. Electrodes were lowered while recording activity in order to attain correct positioning, usually ending when the longer electrodes were ∼3 mm ventral to pia.
When the recordings stabilized, the craniectomy was sealed with cyanoacrylate glue (Loctite; Rocky Hill, CT, USA), skull screws were implanted (Plastics One; Roanoke, VA, USA), and dental acrylic (OrthoJet; Lang Dental; Wheeling, IL, USA) was applied to secure the array’s connector. The rats returned to their normal housing, and rested and recovered post-operatively for 5–8 days before recordings began.
Epileptic animals
Epileptic animals were prepared as above, but with a single injection of 25 ng of tetanus toxin (Sigma Aldrich, St. Louis, MO, USA) in 0.5 μl phosphate buffered saline with 0.2% bovine serum albumin (Jefferys and Walker, 2005
). The injection, using a pulled glass pipette and a stereotactically mounted injector (Nanoject; Drummond Scientific Co., Broomall, PA, USA), was located in the dorsal hippocampus (3.3 mm posterior and 3.2 mm lateral to bregma, and 3.1 mm ventral to pia) and occurred immediately prior to the MEA implant. The needle was allowed to equilibrate for 1 min prior to injection, the injection was delivered over 3 min, and the needle was left in place for 5 min following injection to prevent reflux. Animals exhibited spontaneous seizures within 3–9 days. No mortality or morbidity from the injections was observed, as previously reported (Jefferys and Walker, 2005
).
We successfully created a low-cost system for multielectrode recording from awake, behaving animals (Figure 1
, scenario ❶, and Figure 3
). Sample data from a behaving rat’s hippocampus is shown in Figure 5
. Below, we characterize the system in detail, first analyzing noise levels, gain, cross-talk, then examining stimulation artifacts and how they compare to a benchmark commercial system. Finally, we illustrate the utility of the system by providing examples of the effects of microstimulation on single cell and LFP activity in the rodent hippocampus.
Noise
Electrode-referred noise spectra, with all inputs grounded, are shown in Figure 6
. Root-mean-square (RMS) noise values are 6.1 ± 0.2 μV (mean ± standard error across channels) when using a grounded reference, and 8.4 ± 0.2 μV when using a true reference (i.e., an active reference). The increased noise when using a true reference arises from the superposition of the reference channel’s RMS noise and that of the signal channel (i.e., the combined noise should be a factor of  larger). The headstage manufacturer, Triangle Biosystems, specifies the broadband RMS noise as 6.2 μV, so our system is not introducing additional noise through the interface boards, cables, or A/D conversion process. When restricted to bands containing action potential data (>300 Hz; Figure 6
B), the RMS noise levels are 3.9 ± 0.1 μV for grounded reference, 5.5 ± 0.1 μV for true reference, and 3.4 ± 0.02 μV when using a Plexon preamplifier and headstage (directly connected to our A/D cards; scenario ❷ in Figure 1
).
larger). The headstage manufacturer, Triangle Biosystems, specifies the broadband RMS noise as 6.2 μV, so our system is not introducing additional noise through the interface boards, cables, or A/D conversion process. When restricted to bands containing action potential data (>300 Hz; Figure 6
B), the RMS noise levels are 3.9 ± 0.1 μV for grounded reference, 5.5 ± 0.1 μV for true reference, and 3.4 ± 0.02 μV when using a Plexon preamplifier and headstage (directly connected to our A/D cards; scenario ❷ in Figure 1
).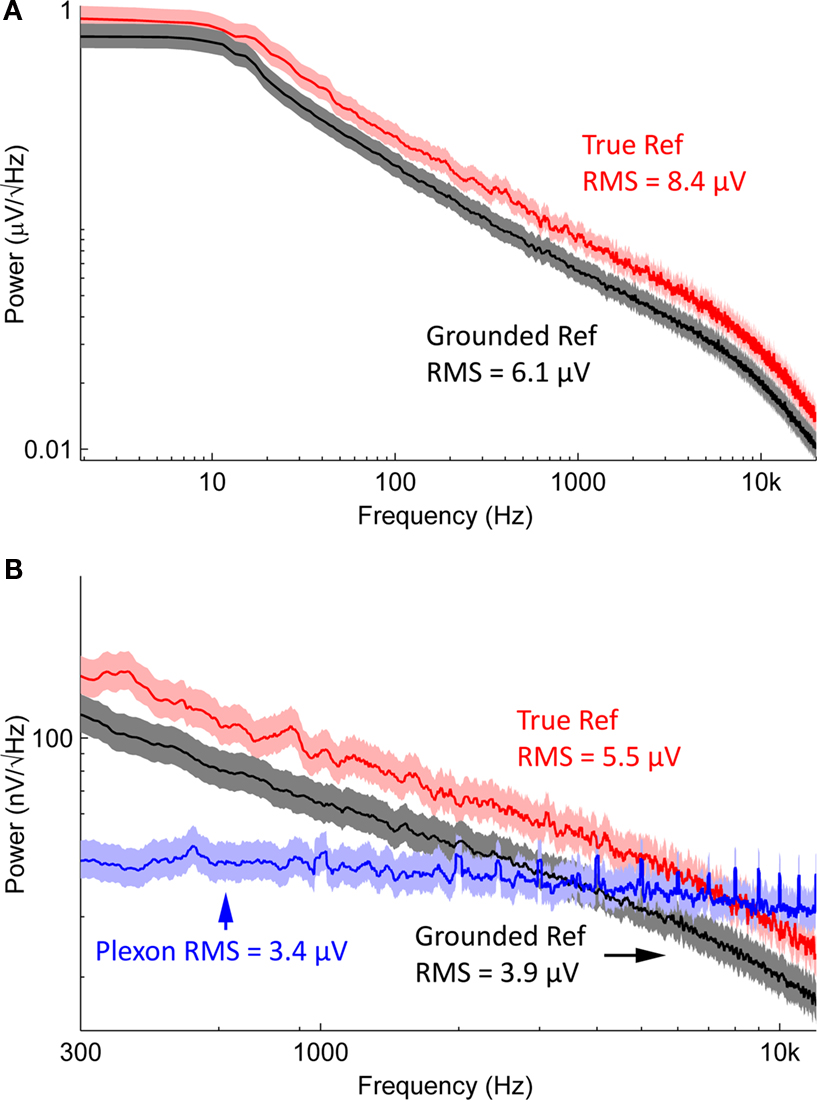
Figure 6. Noise spectra. (A) Averaged, electrode-referred broadband spectra for a 16 channel system. Shading represents 95% confidence interval. The black curve depicts the noise spectrum with a grounded reference; the red curve shows data acquired with a true reference. (B) Noise spectra in the action potential frequency band, compared to noise spectrum from a Plexon preamplifier (blue), which has a 1-pole analog band-pass filter set to 300–8800 Hz. Red, black, and shading are as in (A). Note the harmonics present in the Plexon amplifier’s spectrum. This is likely due to ground loops within the system, since the Plexon system is not battery-powered and has multiple paths to ground.
Gain and Cross-Talk
With manufacturer specifications and theoretical calculations, we computed a passband gain of 160× for our system, and confirmed this with a PSPICE simulation. We set the passband’s −3 dB points (1.4 and 8840 Hz) by choosing appropriate resistors and capacitors for the filters (see System Design). To verify the system’s gain and −3 dB points, we used a custom-built stimulator (Rolston et al., 2007
) to deliver 100 μV amplitude sine waves in the range of 0.1 Hz to 12.5 kHz, and measured the waves’ amplitudes when recorded by the system. The passband gain was 156× (43.9 dB), and the −3 dB points were located at 1.4 and 8700 Hz, in agreement with our system design calculations.
We also wished to verify that the system’s gain was constant across a range of input amplitudes. We tested this with a 1 kHz sine wave (the frequency range of action potentials) of varying amplitude, from 100 μV to 10 mV (the latter being far above what we expect to encounter in typical recordings). We observed an attenuation of 1 dB over this range (that is, the gain of a 10-mV input signal was measured to be ∼140×, vs. the 100 μV signal’s gain of 156×). This implies that recorded signal amplitudes will be reflected linearly over a wide range of physiological inputs.
Cross-talk was measured by sending a 1 mV 1 kHz voltage-controlled sine wave to one channel, and recording from neighboring channels. For directly adjacent channels, the observed cross-talk was −66 dB. For non-adjacent channels, the cross-talk was slightly lower, −69 dB. This is in agreement with the headstage manufacturer’s reported cross-talk (−63 dB for adjacent channels; personal communication with TBSI). Since the A/D card’s specified cross-talk is −75 dB for adjacent channels, our measurements imply that the headstage is the dominant source of cross-talk, rather than other elements of the signal chain.
Stimulation Artifacts
Many conventional recording systems experience severe saturating transients when exposed to stimulation, making recording evoked neural responses difficult (Wagenaar and Potter, 2002
). These artifacts stem from two sources: the electronics of the recording system and the electrode-tissue interface. The electronics can be pushed into unstable regimes when exposed to the large amplitude stimulation signals, and the stimulation electrode (since it is capacitively coupled to the extracellular medium) will require time to discharge following application of stimulus pulses (Blum et al., 2004
).
To evaluate our system’s artifacts, we compared the observed artifacts to those obtained using a benchmark Plexon system. To isolate the electronic component of the artifact, we used a custom-built stimulator (Rolston et al., 2007
), and delivered ±10 μA biphasic current-controlled pulses through 560 kΩ resistors connected to ground (see Experimental Methods). Stimulating through a pure resistive load removes the capacitive effect of the electrode-tissue interface, leaving only the electronic component of the artifact. To gauge the combined effect of capacitive discharge and electronic components, we repeated these experiments (±10 μA biphasic current-controlled pulses) using a high-impedance (∼200 kΩ) microwire array in ACSF. Artifact durations (in terms of recovery and desaturation; see Experimental Methods) are shown in Tables 1 and 2
. Table 1
shows artifacts on neighboring, non-stimulated electrodes, while Table 2
shows artifacts recorded on the stimulating electrode. Average artifact waveforms for stimulation through a resistor are depicted in Figure 7
, and waveforms for stimulation through a microwire array in ACSF are shown in Figure 8
.
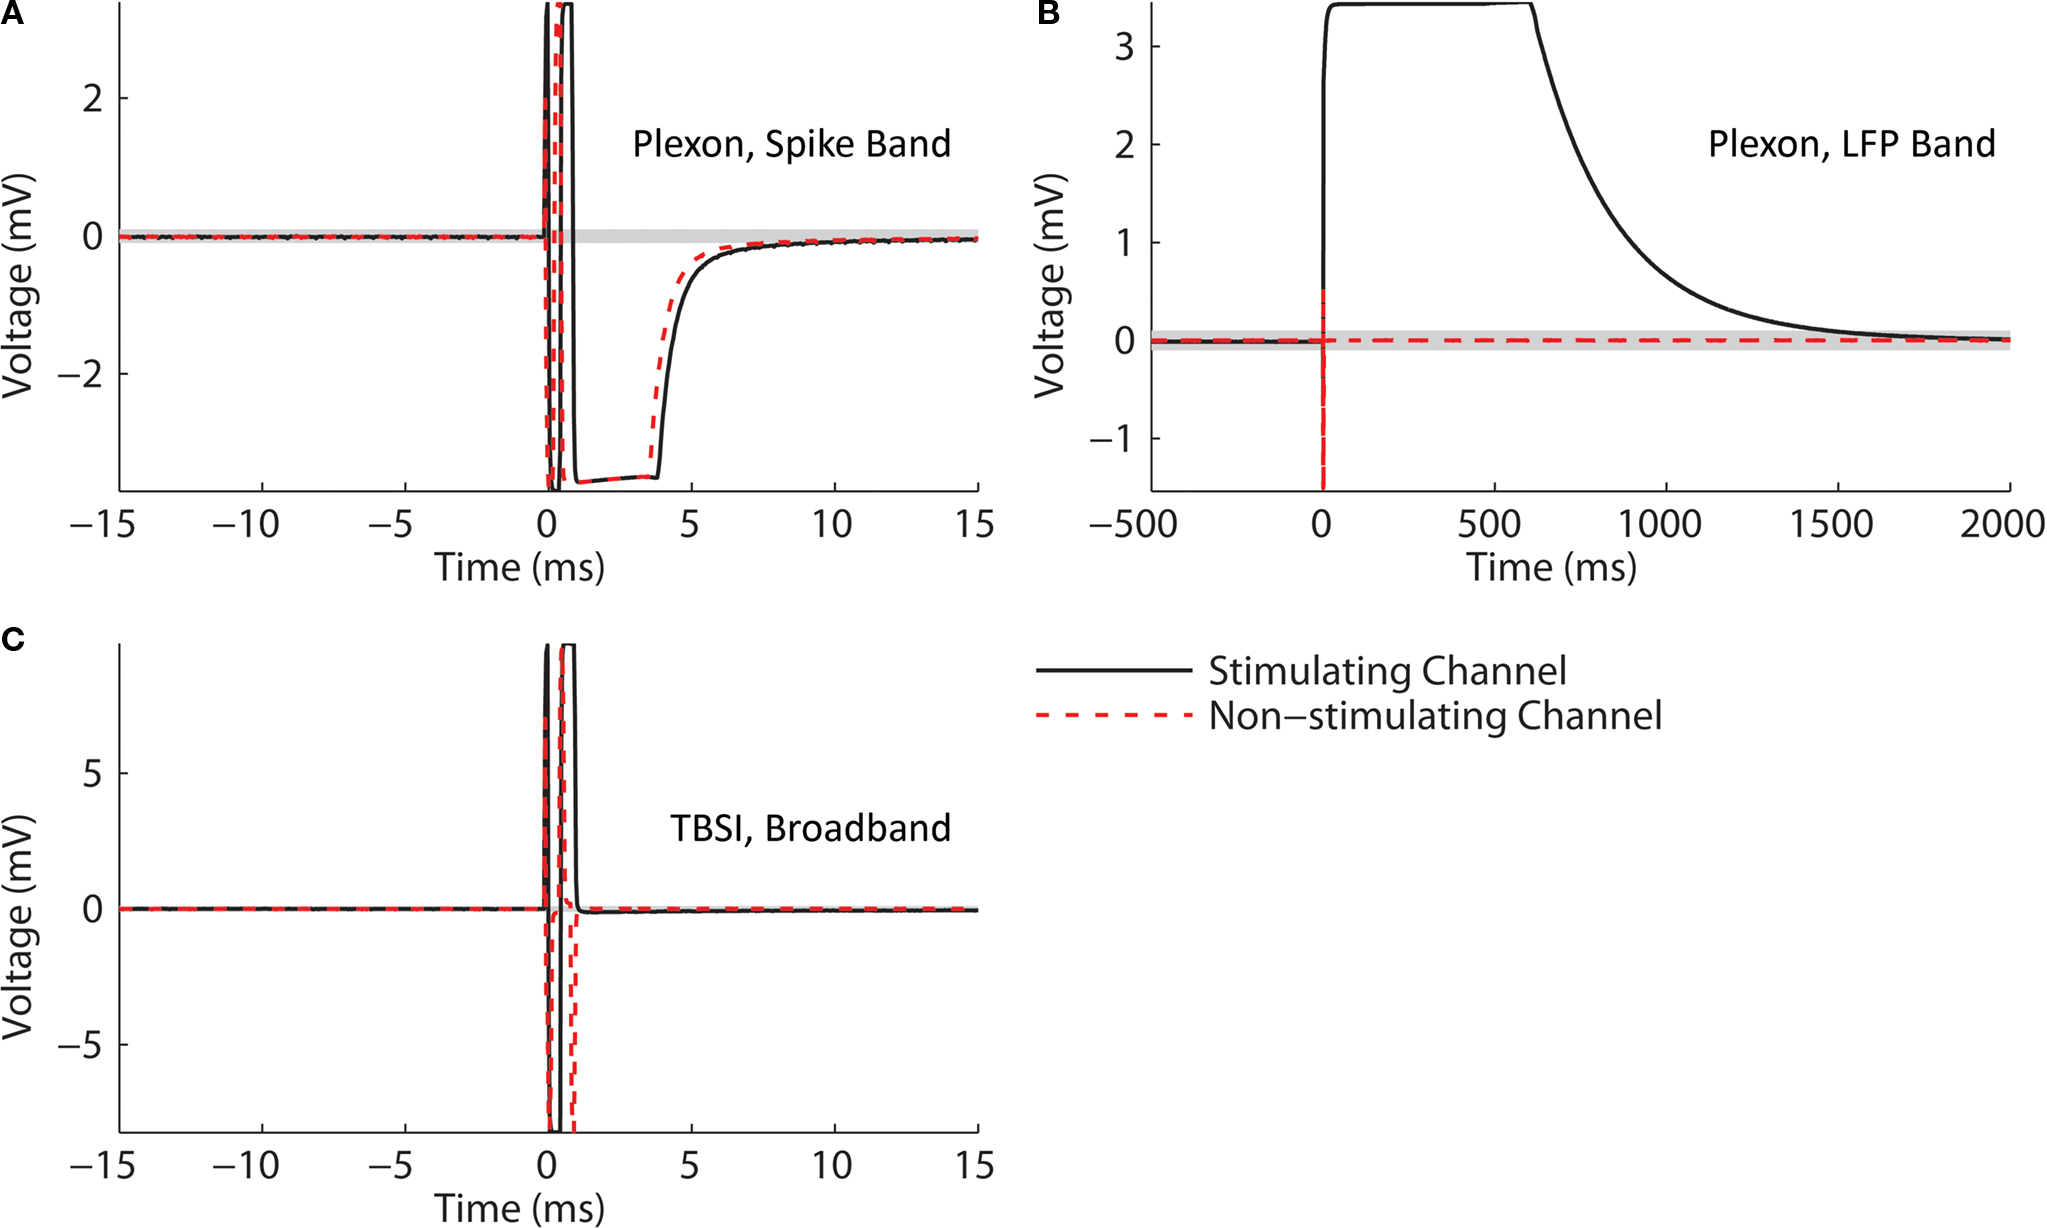
Figure 7. Stimulation through a 560 kΩ resistor. A custom stimulator, interposed between the recording headstage and electrodes (which, in this case, were simulated by 560 kΩ resistors connected to ground), was used to evaluate stimulation artifacts on the stimulating electrode and neighboring electrodes. Stimuli lasting 800 μs were delivered at 0 ms. The average of 10 trials of ±10 μA biphasic stimuli (negative, cathodic phase first) are shown in each panel. 95% error bars are too small to be resolvable at this magnification, and are therefore not displayed. Gray bands represent the ±100 μV recovery window – see text for definition of recovery and desaturation. Artifact durations are provided in Table 1 for non-stimulated electrodes and Table 2 for stimulated electrodes. The analog band-pass filter of the Plexon spike band (A) is 300–8800 Hz. The Plexon LFP bandwidth is 1–500 Hz (B). No digital filtering is used for the TBSI-based NeuroRighter system (C).
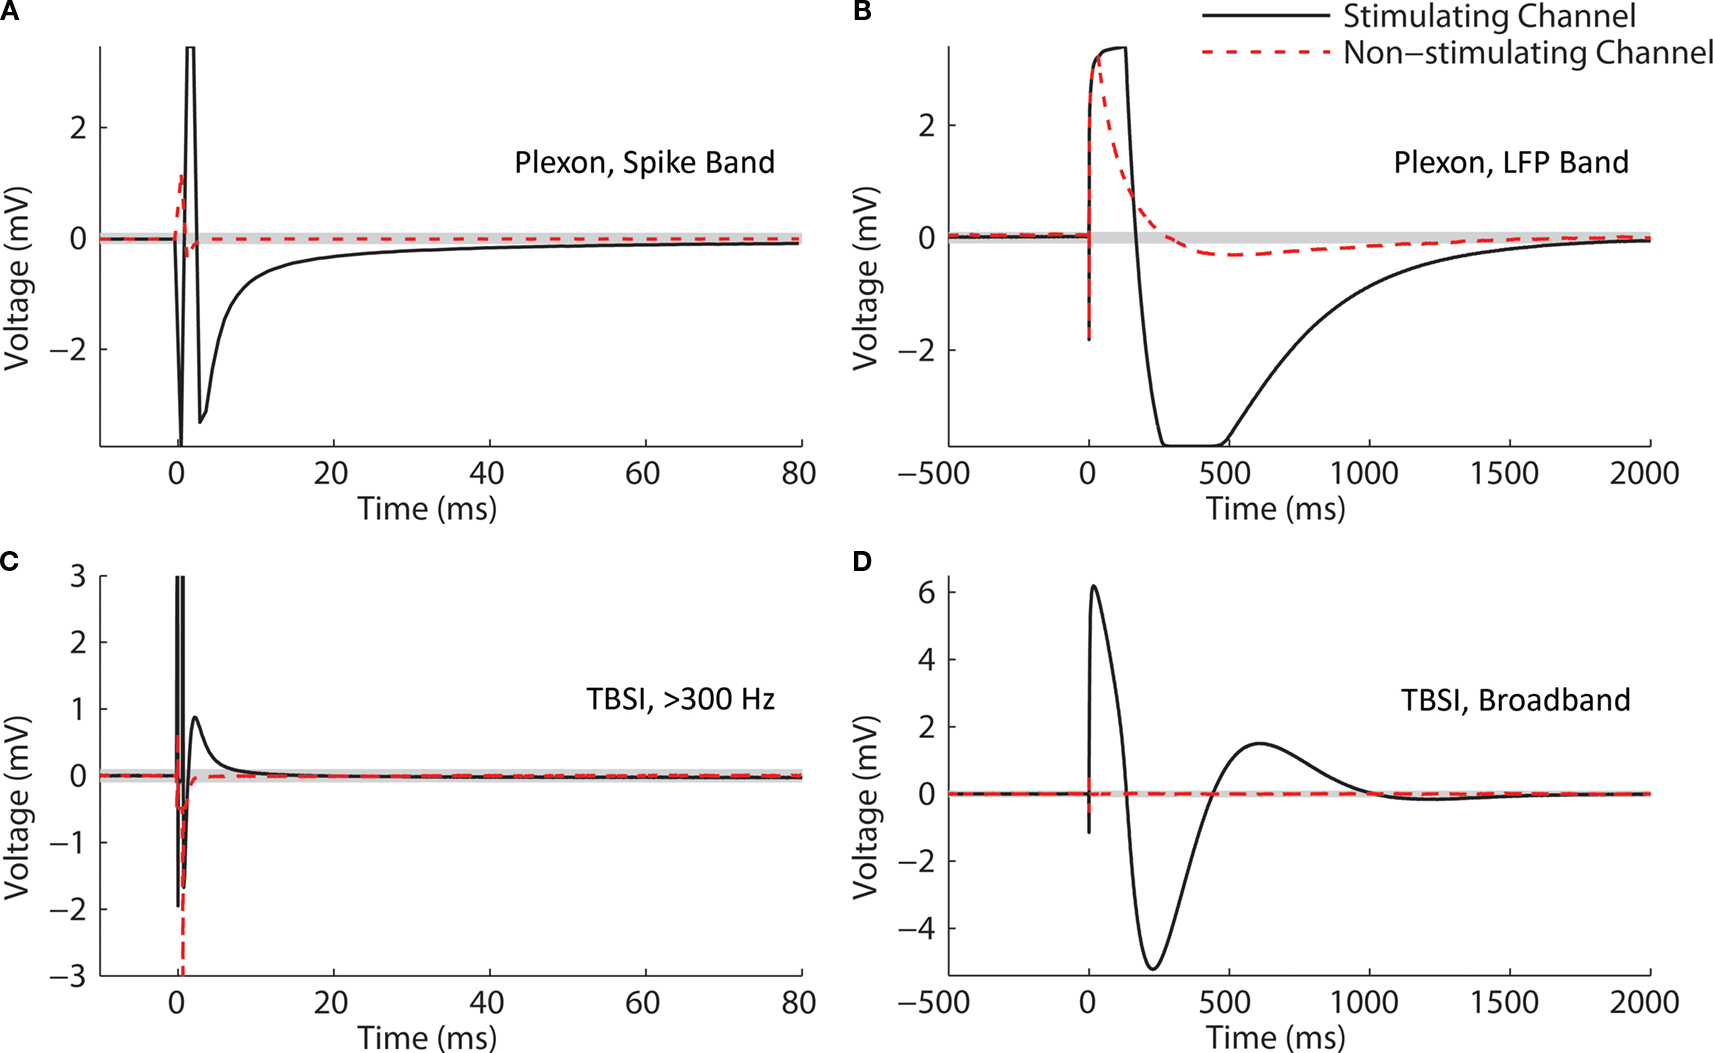
Figure 8. 10 μA Stimulation through a microwire array immersed in ACSF. Biphasic (negative, cathodic phase first) pulses were delivered to each channel. The average of 10 trials is shown in each panel. 95% error bars are too small to be resolvable at this magnification, and are therefore not displayed. Gray bands represent the ±100 μV recovery window. Artifact durations for the non-stimulating electrodes are provided in Table 1, while durations for the stimulated electrode are shown in Table 2. (A) The Plexon system’s spike band is 300–8800 Hz. (B) The LFP band is 1–500 Hz. (C) The TBSI headstage (NeuroRighter system) was digitally filtered >300 Hz to compare with the Plexon system’s spike band. (D) No digital filtering was used for TBSI broadband recordings.
In all cases, the NeuroRighter system performed better than the benchmark Plexon system. Additionally, the minimal artifact when stimulating through a pure resistive load suggests that artifacts observed when stimulating through electrodes in ACSF are purely due to capacitive discharge. Artifacts in ACSF on the Plexon system, however, are due to combined system electronics and capacitive discharge effects.
Responses to Stimulation In Vivo
The substantial reductions in stimulation artifacts under the well-controlled conditions above were encouraging, but it was important to demonstrate system performance under actual experimental conditions. We stimulated the CA1 hippocampal field of both awake and anesthetized rats at a range of current amplitudes (2, 4, 6, 8, 10, 15, 20, and 50 μA). Ten trials of each amplitude were presented in random order, to minimize neural adaptation. Responses were recovered on a non-stimulating electrode within 1 ms of stimulus offset, at stimulus amplitudes ≥4 μA (Figure 9
A). More action potentials are recruited with higher stimulus amplitudes, culminating in a complex waveform at the highest intensity (50 μA), in which individual action potentials are hard to discern. This complex waveform is likely the result of multiple action potentials superimposed, leading to the observed multimodal response that varies across trials (Figure 9
A, top traces). Importantly, these short latency responses would be missed if using the Plexon system, since artifacts in that system exceed 1 ms.
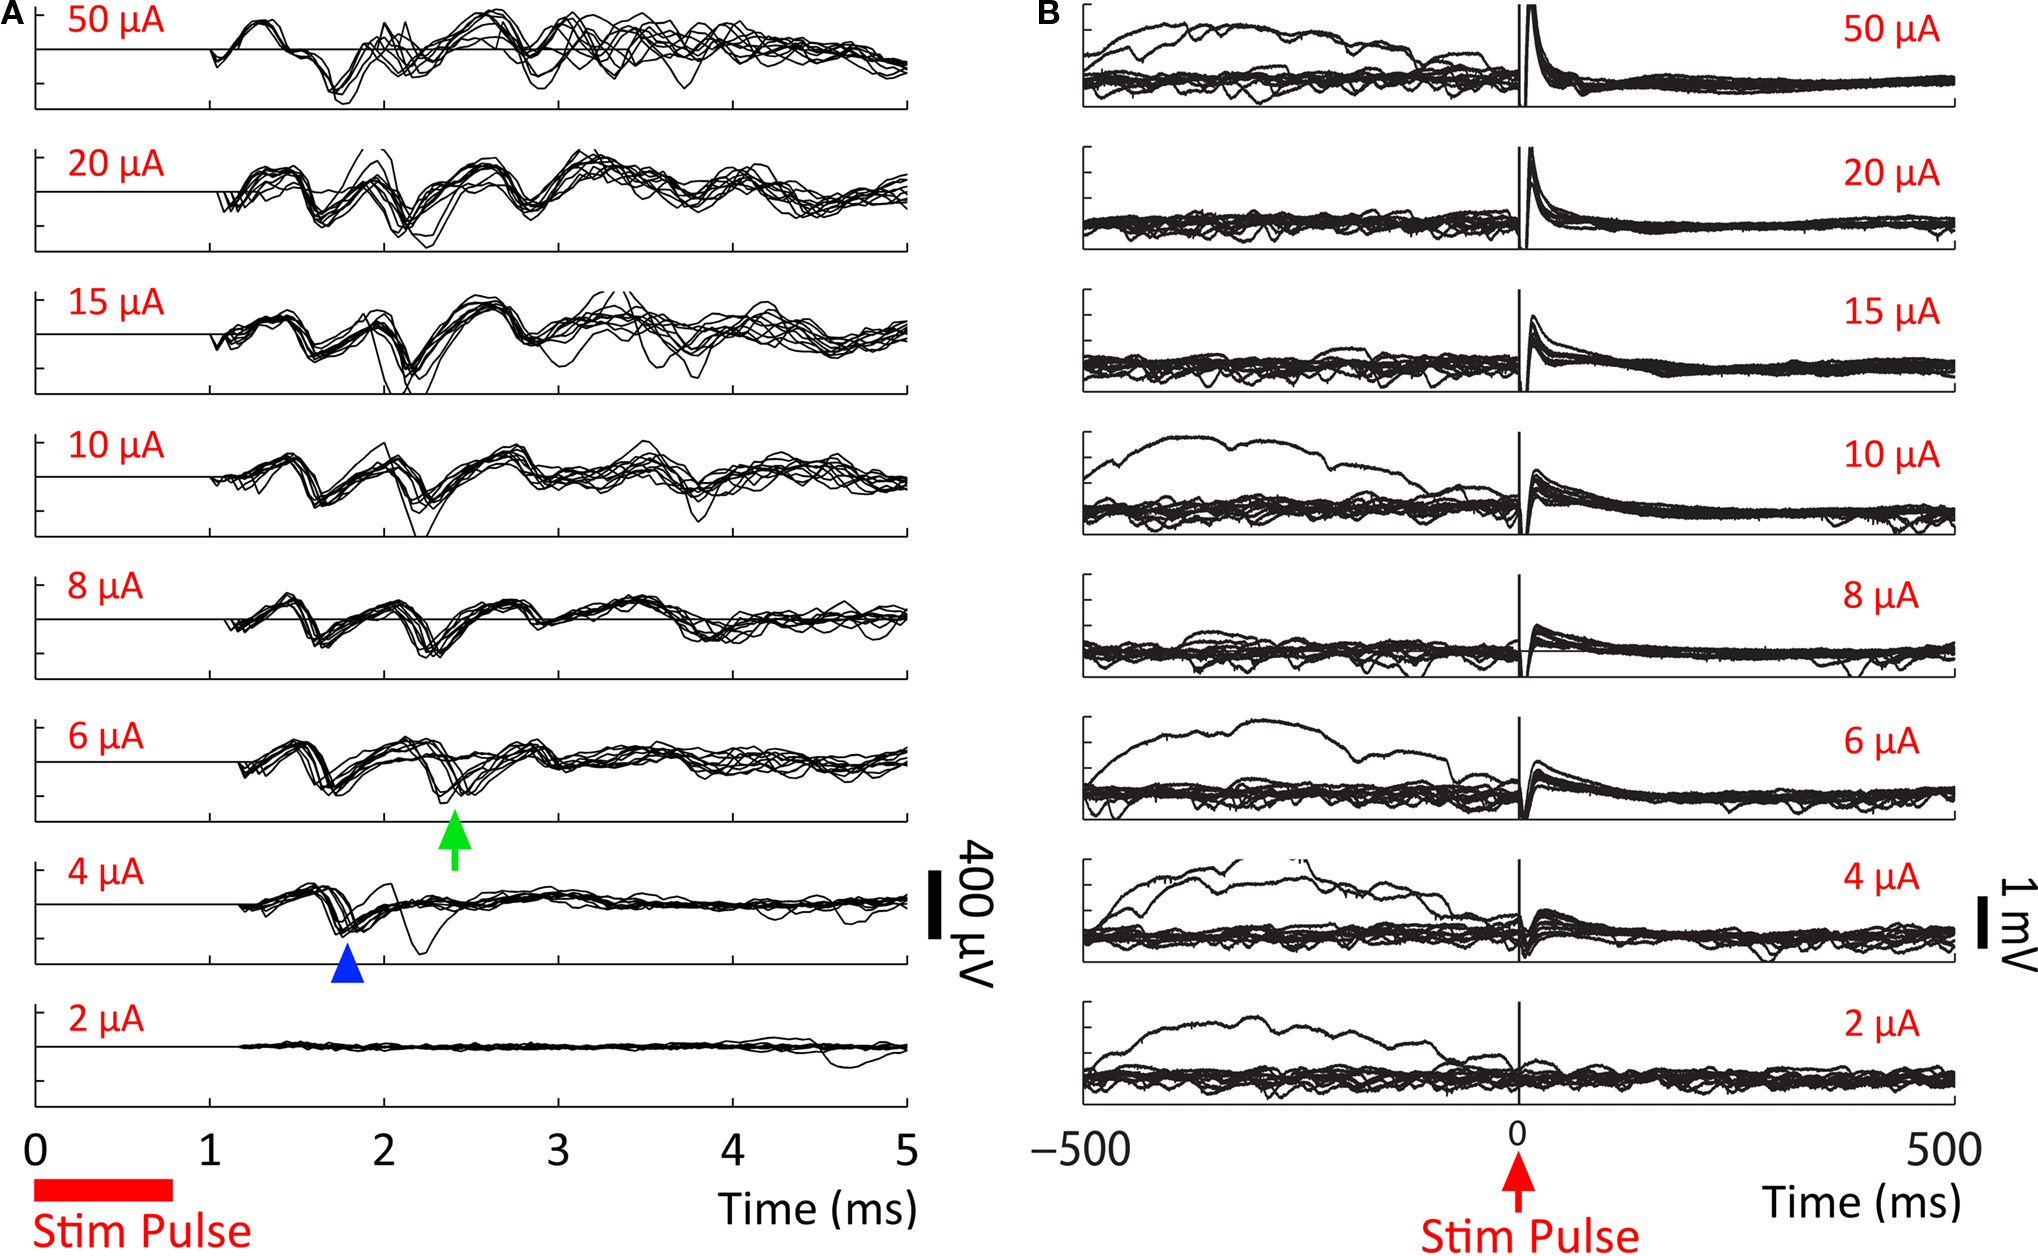
Figure 9. Directly evoked neural responses to stimulation in vivo. Responses to current-controlled microstimulation of increasing amplitude (amplitude shown in red) recorded from a non-stimulating electrode in an anesthetized rat’s hippocampus (CA1). All pulses are cathodic, negative-phase first. Ten trials are overlaid in each panel. Trial amplitude was randomized during presentation. (A) The first evoked action potentials appear at ≥4 μA, within 1 ms of stimulus offset (blue arrowhead), followed by an additional response at ≥6 μA (green arrow). Artifacts are suppressed digitally using the SALPA algorithm (Wagenaar and Potter, 2002
). (B) LFP responses show increasing durations of attenuation (flattening) in LFP activity with increasing stimulation currents, corresponding to inhibition of neuronal firing. Viewing these LFP responses would not be possible with the Plexon system, due to its long stimulation artifact.
Responses are recovered from the stimulating electrode within milliseconds, as well (Figure 10
). Because the artifact is longer on the stimulating channel, directly evoked, low-jitter APs (Bakkum et al., 2008
; Wagenaar et al., 2004
) are not recorded as they are on non-stimulating channels (cf. Figure 9
). However, well-isolated APs are observed within 10 ms of the stimulation pulse at amplitudes ≤8 μA, and between 10–20 ms at amplitudes between 10–25 μA.
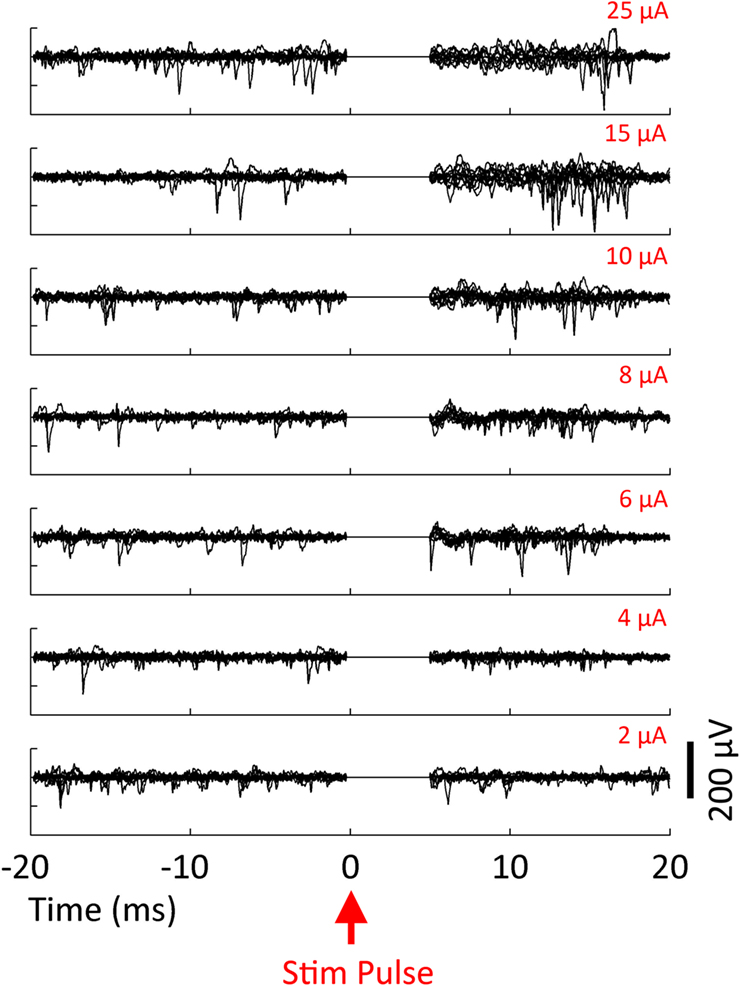
Figure 10. Evoked response recorded on the stimulating electrode. Biphasic current-controlled stimuli were delivered at time 0 ms to the hippocampus of an awake, behaving rat. Ten trials of each intensity are overlaid. Spontaneous APs are clearly visible before stimulation and evoked APs after blanking. The SALPA artifact suppression algorithm is used to digitally remove residual stimulation artifact, and to blank the channel for 5 ms.
We also successfully recorded LFPs during the same experiment (Figure 9
B). In this case, a marked attenuation is induced in the recorded LFP responses, which increases in duration at higher stimulus amplitudes. There is also a sharp negative peak post-stimulation, followed by a broader positive deflection. These likely represent an initial depolarization of nearby tissue, followed by hyperpolarization (Andersen et al., 1971
; Nunez and Srinivasan, 2006
). These depolarizing peaks, likely “population spikes” (Andersen et al., 1971
), appear at ≥4 μA, the same amplitudes that evoke action potentials (Figure 9
A). Furthermore, the noted attenuation in the LFP band appears only when the hyperpolarizing deflections are present, at ≥4 μA. Again, because other systems experience prolonged stimulation artifacts in the LFP band (Figures 7 and 8
), these results would be obscured if a different recording system were used.
As a final test of our system, we conducted microstimulation and recording in freely moving animals made epileptic with focal injections of tetanus toxin (Figure 11
; see Experimental Methods). Stimulation in CA3 of these animals evoked population spikes, created by the superposition of single cell activity, analogous to those observed previously in anesthetized rabbits and cats (Andersen et al., 1971
). Interestingly, we also observed an increase in multiunit activity not associated with typical population spikes. Lastly, in 80% of the trials, microstimulation evoked high frequency oscillations at ∼300 Hz, the fast ripple range (Rampp and Stefan, 2006
). High frequency oscillations have been shown to occur in most models of epilepsy, as well as in human patients with epilepsy, but their mechanisms are still being investigated.
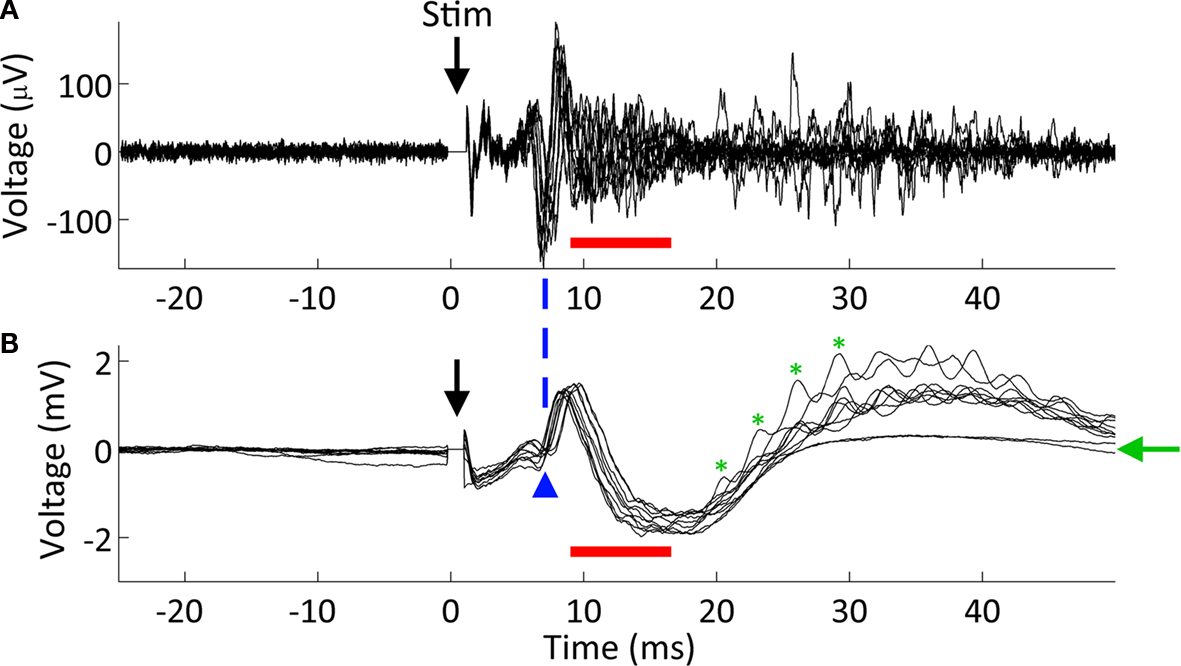
Figure 11. Microstimulation responses in CA3 of an epileptic animal. Simultaneously recorded (A) action potential traces (using the SALPA filter) and (B) LFP responses. Ten responses to a 20 μA biphasic pulse (negative phase first) are overlaid in both (A) and (B). The stimulating electrode was located 175 μm distant in the same cell layer, CA3. As shown previously (Andersen et al., 1971
), single cell activity underlies population spikes (blue arrowhead). However, we noted a high amount of multiunit activity following the population spike that is not clearly associated with any additional spike (red bars). Lastly, we observed evoked high frequency oscillations at ∼300 Hz (in the fast ripple range) in 80% of trials (green asterisks mark four periods of one such oscillation). The green arrow denotes the two traces where no fast ripples were evoked.
Software Features and Metrics
The NeuroRighter software was created for real-time data processing, visualization, and experimental control. Features include:
• Broadband multichannel recording
• Modular in 16-channel banks
• Arbitrary sampling rates, which can be different for LFPs and spikes
• Multiple adaptive spike detectors, with thresholds updated as often as every sample
• Stimulus artifact removal in real-time using SALPA (Wagenaar and Potter, 2002
)
• Digital filtering with arbitrary frequency cut-offs and number of poles
• Data storage of raw broadband signals, detected spike waveforms, and/or LFPs
• Open source architecture
• Multi-threaded for scalability
• Digital re-referencing in real-time
• Ability to control peripherals (e.g., we have implemented control for the Cineplex video recording system and Plexon preamplifier programmable referencing)
• User-friendly, Windows-based graphical interface
Performance data for the software was obtained with the Reliability and Performance Monitor software, Version 6.0 (Microsoft Corporation). The software was tested when recording broadband data from 64 channels at 25 kHz per channel, with settings that resemble an intensive data processing experiment. Specifically, LFPs were obtained by band-pass filtering the raw data with a digital 1-pole filter and downsampling to 2 kHz. The spike band was band-passed from the raw data with a 3-pole Butterworth filter (300–9000 Hz). Spikes were detected with an adaptive RMS threshold, recalculated every 50 ms for each channel. Surrogate spikes were generated by lowering the spike detection threshold, so that transient events would be labeled as spikes, leading to 2400 spikes per second or 40 spikes per second per channel.
When file output was turned on, the data was saved to disk simultaneously in three formats: (1) raw data, which is every unprocessed sample from every channel, (2) spike data, which includes the time of each detected spike, the channel on which it occurred, and 3 ms of the spike’s waveform, and (3) LFP data, which was sampled at 2 kHz for each channel. Results of these tests are reported in Table 3
.
System Cost
The system as described has a cost of less than US$10,000 (Table 4
), including a desktop computer with monitor (which many labs already own). The minimum requirements for the computer will remain constant, so that the entry price for the computer will continue to fall as technology improves.
We have constructed a fully featured data acquisition system for multiple microelectrode recordings. Our system meets its three design objectives: (1) artifacts <1 ms, (2) modular, customizable construction for <$10,000, and (3) open-source software capable of running on a standard desktop computer.
Recovery from Stimulation
As shown in Figures 7
A,B, the electronics of some commercially available data acquisition systems saturate during stimulation. Since artifacts prevent the recording of evoked neural signals, we wish to minimize them to collect the highest quality data possible. Artifacts outlasting the stimulation pulse are expected with traditional metal electrodes, which are capacitively coupled to the extracellular medium. However, the observed saturations in the Plexon hardware (Figures 7
A,B) occur even when the impedance of the recorded source is purely resistive. This implies that the amplifiers and filters of the Plexon hardware are being driven into a saturated regime. Our system, which has only a single stage of amplification (compared to the Plexon system’s two stages), recovers within μs from the same stimulation pulses (Figure 7
C). We believe this is due to the lower gain of our system and the single stage of amplification.
As noted above, a metal electrode stimulated in saline or tissue will suffer a prolonged baseline shift as the electrode’s capacitance discharges following the stimulus. This will induce an artifact independent of the recording electronics. We would therefore expect our system, which showed negligible electronic artifact, to perform better when stimulated than the Plexon system, since an artifact on our system will be almost entirely due to electrode discharge, rather than hardware recovery (the Plexon system will have longer artifacts composed of both hardware recovery and electrode discharge). Indeed, this was the case when stimuli were delivered through a conventional microwire array immersed in artificial cerebrospinal fluid (ACSF; Figure 8
).
What is the source of the additional artifact in the Plexon system? With an oscilloscope, we observed rapid recovery from stimulation pulses at the input of the Plexon preamplifier’s differential instrumentation amps (LT1167; Linear Technology; Milpitas, CA, USA), but saturated signals at the preamplifier’s output (as shown in Figures 7
A,B). This implies that the Plexon recording headstage is not saturating, but the preamplifier is. In support of this, it has been shown that interposing a blanking circuit between the recording headstage and preamplifier greatly minimizes stimulation artifacts (Venkatraman et al., 2009
). We have independently verified this with our own blanking circuitry for Plexon amplifiers.
In Vivo Microstimulation
Our ability to record LFPs and directly evoked action potentials within 1 ms of stimulation was verified in vivo, in both awake and anesthetized rats (Figures 9
–11
). Directly evoked action potentials were recorded over a wide range of stimulus intensities (4–50 μA), and corresponding changes were observed in the LFP band, including a marked attenuation which increased in duration for increasing stimulus amplitudes (Figure 9
). Importantly, the recorded short latency (<1 ms) neural responses would be obscured by artifacts in other systems (cf. Figure 8
, which shows spike band artifacts lasting for 1.5 ms and LFP band artifacts lasting 1.3 s following stimulus offset). Additionally, we were able to recover responses within 10–20 ms from the stimulating electrode itself (Figure 10
).
The system was further validated in a freely moving animal, made epileptic with a focal injection of tetanus toxin. Microstimulation evoked population spikes, analogous to those reported in Andersen et al. (1971)
. Differences between our experimental setup and that used by Andersen et al. (1971)
exist, however: (1) our population spikes were evoked by stimulation in a cell layer (CA3) rather than a fiber bundle, such as the perforant path or mossy fiber pathway, (2) we studied freely moving rats, whereas Andersen et al. (1971)
used anesthetized rabbits and cats, and (3) Andersen et al. (1971)
exposed the hippocampus by removing the overlying cortex, whereas our procedure leaves the overlying motor and sensory cortex intact. Nevertheless, the recorded single cell activity in CA3 closely matched the LFP population spike, as reported by Andersen et al. (1971).
Interestingly, however, we also observed evoked multiunit activity that was not associated with a population spike in the LFP (red bars in Figure 11
). Andersen et al. (1971)
report some cases where unit activity precedes or follows the population spike, but not to this degree. The nature of this activity remains to be studied.
Another finding from our experiments with epileptic animals is that microstimulation can induce high frequency oscillations. Such oscillations have been repeatedly associated with epileptiform activity in both humans and animal models (Rampp and Stefan, 2006
), though their origin is still unclear. The potential to control these oscillations with microstimulation potentially provides a new experimental platform for further understanding such aberrant activity.
Customizability
Our system has a rich potential for customization for three reasons: (1) open source software, (2) open layouts and schematics, and (3) modular design. First, since the NeuroRighter software is open source, users can modify it to suit their needs, or to provide additional functionality. Second, our open circuit schematics and layouts were developed with free software (PCB123), allowing users to easily modify them. ICs can be changed to alternate models, different filters can be created, or the layout can be manipulated to improve recording characteristics. Lastly, the system is constructed in four largely independent layers: headstage, interface boards, A/D cards, and software. Any of these can be exchanged or modified to improve the system or add functionality. For example, we used the A/D cards and software to create a hybrid Plexon system with additional digital and analog control capabilities (Figure 1
; see Cost section).
Hybrid Plexon system
Because our system is modular, it is possible to combine portions of our equipment with that of different vendors. As an example of this, we have successfully interfaced our system with both Plexon hardware for in vivo recordings and MultiChannel Systems (MCS) hardware for in vitro recordings (Figure 1
). The advantages of our hybrid Plexon setup (Figure 1
, case ❷) over the complete Plexon Multichannel Acquisition Processor (MAP) are cost and customizability. The NI A/D cards and our NeuroRighter program preclude the need for the large MAP box and the closed-source Plexon software, both of which are costly. Additionally, since we record all data broadband, users have potentially greater access to the data’s underlying structure. For instance, new action potential detection and sorting methods can be implemented in software and changed in real-time. The noise of this Plexon hybrid arrangement is comparable to that of our system (Figure 5
), and we have added to the NeuroRighter software the ability to control a Cineplex video recording system and the Plexon preamplifier’s programmable referencing. The primary drawback of this arrangement is the loss of online spike sorting, which is handled by the Plexon software. However, real-time sorting could be added as a module to the NeuroRighter software, using any number of published algorithms.
Hybrid MCS in vitro system
For in vitro recordings we developed an interface board for use with MultiChannel Systems (MCS) 64-channel preamplifiers (Figure 1
, scenario ❸). The MCS amplifiers record from substrate-integrated multielectrode arrays, for use with neural or cardiac cell cultures. The interface board, in this case, is the same dimensions as the in vivo interface board and features the same stackthrough connectors, allowing it to be stacked beneath the power board (as in the in vivo setup). Our MCS interface board receives the MCS preamplifier’s SCSI cable output, and passively relays the signal to standard header connectors. These connectors are identical to those used for the in vivo setup, permitting compatibility between the two systems. From this point, the signal chain is identical to the in vivo case described above. The electrode-referred noise (inputs grounded) of this hybrid system is 3.2 μV, broadband. In a conventional MCS system, our custom interface board, National Instruments A/D cards, and software would be replaced with an MCS A/D card (MC_Card) and MCS software (MC_Rack). The A/D cards we use are less expensive and have a greater resolution (16-bit vs. 14-bit), and our software is free and open source. These two changes reduce the overall cost and permit greater customizability for an in vitro system.
Cost
The cost to construct a 64-channel version of our system was less than US$ 10,000 (a 32-channel system will cost less than US$ 6,000; Table 4
). This compares favorably to the price of commercial systems: quotes we have received range from 4× to 10× the cost of our system. A savings of US$ 30,000 to US$ 90,000, or the ability to acquire multiple systems, will likely be of great use to many laboratories.
Software Performance
We chose to implement our software in the C# programming language (Liberty and Xie, 2008
), a modern and easy-to-use language similar to Java (Chandra and Chandra, 2005
; Wilkens, 2003
). Because C# is an open standard, the language has compilers for both Windows and Unix-based systems (via the Mono
4
and DotGNU
5
projects). Therefore, nothing prevents this software from being ported to Linux or the Unix-based Mac OS X. In fact, through the Mono project, C# programs can be ported to Mac OS X, Sun Solaris, BSD, and even the Nintendo Wii and iPhone OS. The only components that will require significant changes in NeuroRighter are the Measurement Studio libraries, created by National Instruments. The software currently uses these libraries to communicate with the National Instruments A/D hardware. However, since open source National Instruments drivers exist (e.g., the COMEDI drivers
6
), the Measurement Studio components can be replaced in future versions of the software.
A potential concern for writing numerically intensive applications in C# or other modern languages is speed. C#, like Java, is compiled to an intermediate language and not to native machine code. When a section of this code is executed, the Common Language Runtime (CLR) environment compiles the intermediate code to native code, which is then run normally. This just-in-time (JIT) compilation will be slower than native compilation (such as that used by C/C++). However, JIT compilation only occurs when the code is first executed. For a data acquisition program, where most code is executed repeatedly, essentially in an infinite loop terminated by the user, this performance penalty only occurs during the first reading of an A/D buffer. Consequently, the JIT penalty will be negligible in the context of a normal recording session. If the JIT penalty ever appears too costly, the intermediate language code can be compiled to native code with Microsoft’s NGen.exe tool. Modern languages like C# and Java are believed to decrease the time required to develop and maintain applications. In the future, we hope these simplifications will provide more rapid implementation of new processing capabilities for data acquisition systems.
Comparison to other Systems
There are a large number of recording systems described in the literature for conducting multielectrode recordings from behaving animals. Some of the most interesting designs, of late, involve telemetric devices capable of installation within the calvaria of active primates. The HermesB system (Santhanam et al., 2007
) and the system described by Sodagar et al. (2007)
both offer good performance with streaming data, but are limited to low channel counts. The HermesB system can only record from two channels, while the Sodagar system can record spikes from more, but only LFPs from two channels. Moreover, the resolution of the spikes recorded by the Sodagar system is only 5 bits. Our system has 16-bit resolution, and has been used in practice for 64 channels of simultaneous spike and LFP acquisition. With software modifications, higher channel counts could easily be reached. Lastly, neither of these systems has been characterized to determine their responses to stimulation. The trade-off, as it stands, is in the convenience of wireless telemetry, which our system currently does not support.
The system developed by Mavoori et al. (2005)
, another implantable system, was designed for closed-loop stimulation and recording in primates. While stimulation artifacts were not completely characterized, the artifact on non-stimulating channels was cited as 2.5 ms. The NeuroRighter system outperforms this artifact length, and has twice the A/D resolution (16-bit vs. 8-bit). Additionally, the Mavoori system is currently too bulky to work with rodents, as it is enclosed in a 5.5 × 5 × 3 cm container.
Perhaps the most comparable system is that described by Venkatraman et al. (2009)
. This innovative setup uses a Plexon system equipped with custom-built blanking circuitry. This circuit disconnects the recording headstage output from the “preamplifier” input for 1 ms during and after stimulation. Because it acts at the preamplifier input (rather than the headstage), the device can be large without affecting recording from small, active rodents. The authors report the ability to record within 2 ms post-stimulation from non-stimulating electrodes, but do not report recordings from stimulating electrodes (Venkatraman et al., 2009
). The NeuroRighter system, in contrast, recovers more quickly (<1 ms) on non-stimulating channels, can record from the stimulating channel within milliseconds, and costs significantly less, since no Plexon equipment needs be purchased.
Another comparable system is the CMOS-based stimulation/recording hardware described by Olsson et al. (2005)
. This system uses CMOS circuitry coupled to a silicon probe, and recovers from stimulation artifacts within 1 ms, like our system. This rapid recovery comes at the cost of bandwidth – the widest range reported by Olsson is 10 Hz to 10 kHz, significantly attenuating low frequency LFPs. Other disadvantages of the system are its relatively high noise (9.2 μV RMS across 100 Hz–10 kHz), its fixed reliance on silicon probes (whereas the NeuroRighter system can use a large variety of available probes, including silicon), and its CMOS design (making it difficult to replicate by other labs).
Several designs for artifact recovery that exist in the in vitro domain hold promise for in vivo work. For example, the active discharge circuitry illustrated by Brown et al. (2008)
permits rapid artifact recovery, even on the stimulating electrode. This system, however, uses a patented CMOS design, making it non-replicable by different labs, and is not currently packaged for use with freely moving animals. Similar circuitry, based on sample and hold amplifiers, was proposed several years ago by Jimbo et al. (2003)
. This system by Jimbo, though, is based on larger, easy-to-solder DIP technology, leaving it unavailable in a miniaturized form suitable for freely moving animals. The NeuroRighter system performs as well as these systems, in terms of artifact length, on non-stimulating channels, but does not recover on the stimulating channel as quickly. However, the ability to use the NeuroRighter system in freely moving animals, and its open design, are both significant advantages.
Overall, we have found no system that is capable of use with small freely moving animals and that matches ours in terms of features that are important for increasingly popular closed-loop multi-electrode electrophysiology: rapid recovery from stimulation artifact, number of channels, and cost.
We believe that closed-loop systems, able to both stimulate and record from multiple electrodes, are essential for complete characterizations of neural activity. Since no commercially available system exists with this capability, we have designed our own, and are freely providing the means for its reproduction online (http://www.johnrolston.com
). While the present article focuses on the system’s recording characteristics, we have already integrated a head-mounted closed-loop stimulator. In the future, we hope to use the NeuroRighter system to fully document the effects of closed-loop microelectrode stimulation in awake, behaving animals. We also hope to continually improve the software and hardware, with the help of the neuroscience community, to offer features such as online spike sorting, novel digital filters, compression routines (Brinkmann et al., 2009
), and other means of ensuring high-quality, easily analyzed data.
Multielectrode recording continues to be a useful means for interrogating the nervous system. But commercially available systems are expensive, and may prohibit some researchers from utilizing this powerful technique. Furthermore, closed-source software and proprietary circuit layouts and schematics prevent the research community from truly understanding their tools, and from making necessary improvements. We hope that the system we have described above and its superior recovery from stimulation artifact will not only be useful to a number of research labs, but also spur further innovations in real-time recording and stimulation technology. The neuroscience community is inventive and capable, and we will all benefit from the proliferation of inexpensive, easy-to-use, and powerful tools.
John Rolston received consulting fees from Axion Biosystems, which represent a competitor of the described system. We therefore do not see this as a conflict of interest. The other authors declare that the research was conducted in the absence of any commercial or financial relationships that could be construed as a potential conflict of interest.
We gratefully acknowledge the advice of E. Brown on circuit design, assistance with surgeries from C. A. Gutekunst, R. Hampson, and A. Goonawardena, assembly of the MCS interface board by C. Hales, construction of the rat enclosure by D. Rainnie, laboratory support from L. Jackson, and helpful discussions within the Gross and Potter labs. This work was funded by the Wallace H. Coulter Foundation, the Epilepsy Research Foundation, a Neurology/Biomedical Engineering seed grant from Emory University and Georgia Tech, a University Research Council grant from Emory University, and, from the National Institute of Neurological Disorders and Stroke, a Ruth L. Kirschstein National Research Service Award to JDR (NS060392), a translational research fellowship to JDR (NS007480), a career development award to REG (NS046322), and a research grant to SMP and REG (NS054809).
- ^ http://creativecommons.org/licenses/by-sa/3.0/us/
- ^ All sites accessed October 2008: http://www.xitimonitor.com/ ; http://onestat.com/html/aboutus_pressbox58-microsoft-windows-vista-global-usage-share.html ; http://www.w3schools.com/browsers/browsers_os.asp ; http://w3counter.com/globalstats.php ; http://marketshare.hitslink.com/
- ^ http://www.gnu.org/copyleft/gpl.html
- ^ http://mono-project.com/Main_Page
- ^ http://www.gnu.org/software/dotgnu/
- ^ http://www.comedi.org/
Berger, T. W., Ahuja, A., Courellis, S. H., Deadwyler, S. A., Erinjippurath, G., Gerhardt, G. A., Gholmieh, G., Granacki, J. J., Hampson, R., Hsaio, M. C., LaCoss, J., Marmarelis, V. Z., Nasiatka, P., Srinivasan, V., Song, D., Tanguay, A. R., and Wills, J. (2005). Restoring lost cognitive function. IEEE Eng. Med. Biol. Mag. 24, 30–44.