Interpreting oxygenation-based neuroimaging signals: the importance and the challenge of understanding brain oxygen metabolism
- Center for Functional Magnetic Resonance Imaging, Department of Radiology, University of California, San Diego, La Jolla, CA, USA
Functional magnetic resonance imaging is widely used to map patterns of brain activation based on blood oxygenation level dependent (BOLD) signal changes associated with changes in neural activity. However, because oxygenation changes depend on the relative changes in cerebral blood flow (CBF) and cerebral metabolic rate of oxygen (CMRO2), a quantitative interpretation of BOLD signals, and also other functional neuroimaging signals related to blood or tissue oxygenation, is fundamentally limited until we better understand brain oxygen metabolism and how it is related to blood flow. However, the positive side of the complexity of oxygenation signals is that when combined with dynamic CBF measurements they potentially provide the best tool currently available for investigating the dynamics of CMRO2. This review focuses on the problem of interpreting oxygenation-based signals, the challenges involved in measuring CMRO2 in general, and what is needed to put oxygenation-based estimates of CMRO2 on a firm foundation. The importance of developing a solid theoretical framework is emphasized, both as an essential tool for analyzing oxygenation-based multimodal measurements, and also potentially as a way to better understand the physiological phenomena themselves. The existing data, integrated within a simple theoretical framework of O2 transport, suggests the hypothesis that an important functional role of the mismatch of CBF and CMRO2 changes with neural activation is to prevent a fall of tissue pO2. Future directions for better understanding brain oxygen metabolism are discussed.
Introduction
A brief neural stimulus produces a rapid and robust increase of cerebral blood flow (CBF), as illustrated in Figure 1 A. Although this phenomenon is the basis for most current functional neuroimaging methods, it is still not clear what physiological function this serves. The CBF response is quite strong, with the fractional CBF change typically ∼2–4 times larger than the associated fractional change in the cerebral metabolic rate of oxygen (CMRO2). A useful way of describing this effect is that the oxygen extraction fraction (OEF) – the fraction of delivered oxygen that is extracted from the blood and metabolized – decreases with increased neural activity. This counterintuitive result, first reported by Fox and Raichle (1986) , is surprising because at rest CBF and CMRO2 appear to be tightly coupled, with a relatively uniform OEF across the brain despite a wide regional variation of blood flow (Gusnard and Raichle, 2001 ). Fortunately for the field of functional neuroimaging, the increase of local blood oxygenation with activation produces a small increase of the signal measured with functional magnetic resonance imaging (fMRI) because of the magnetic properties of deoxyhemoglobin, with higher deoxyhemoglobin levels tending to reduce the MR signal. Decreased deoxyhemoglobin due to the drop in OEF with activation then leads to an increase of the MR signal, the blood oxygenation level dependent (BOLD) response (Kwong et al., 1992 ; Ogawa et al., 1992 ; Buxton, 2009 ) (Figure 1 B). Other techniques, including optical methods (Dunn et al., 2005 ; Grant et al., 2009 ; Roche-Labarbe et al., 2010 ) and tissue oxygenation measurements in animal studies (Caesar et al., 2008 ; Piilgaard and Lauritzen, 2009 ; Thomsen et al., 2009 ), also exploit the change in blood or tissue oxygenation due to the mismatch of CBF and CMRO2 changes as a biomarker of altered neural activity.
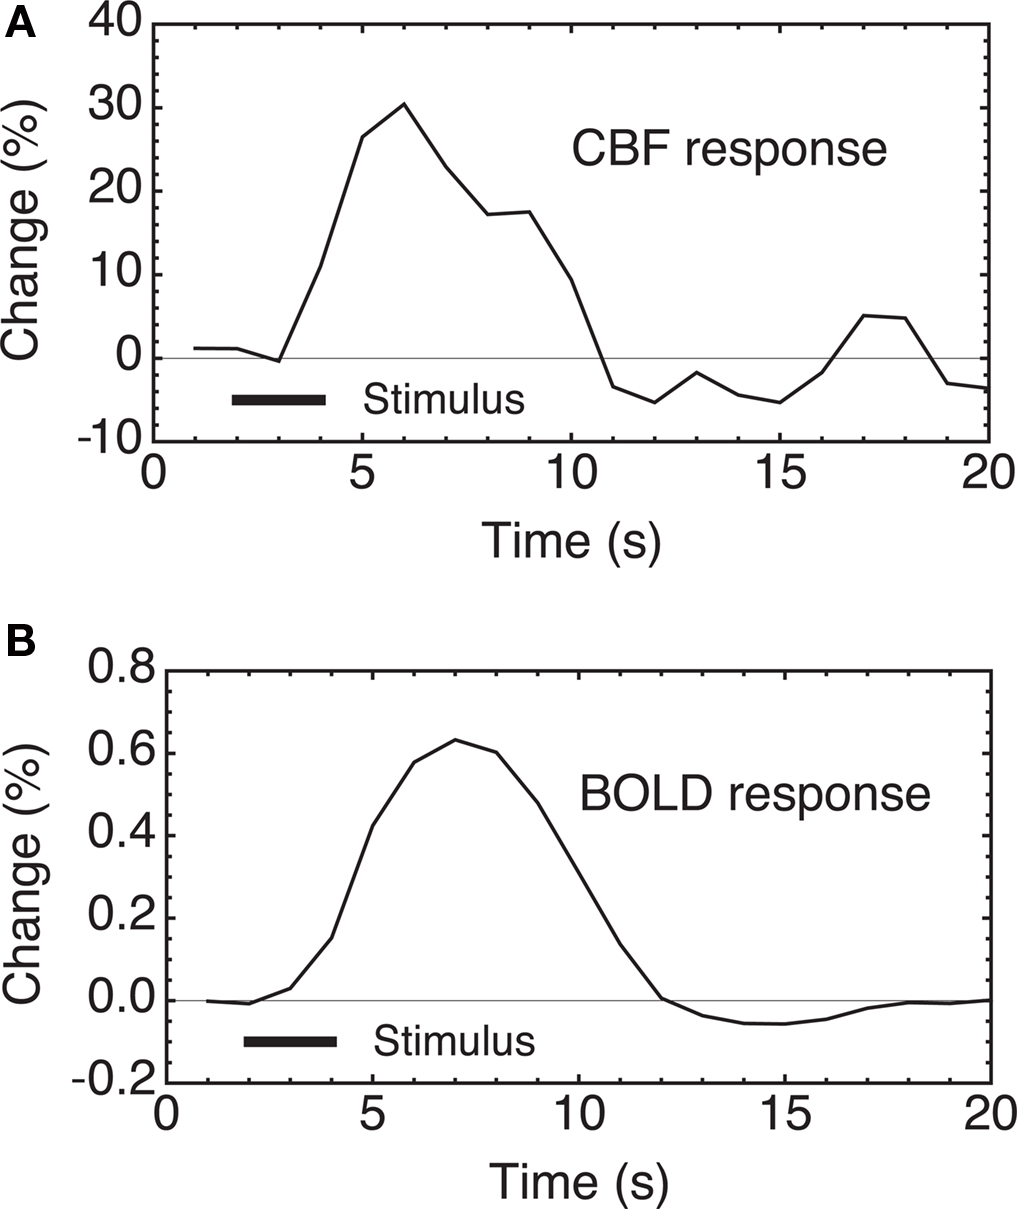
Figure 1. CBF and BOLD responses to a brief stimulus in human subjects. (A) Two seconds of finger tapping evoke a strong CBF change in primary motor cortex, measured here with an arterial spin labeling (ASL) MRI method. (B) The CBF change is accompanied by a local increase in blood oxygenation, giving rise to the BOLD response measured with fMRI. Because of the nature of the measurements, BOLD-fMRI has intrinsically higher sensitivity than ASL, despite the small magnitude of the signal changes. Data from Miller et al. (2001) .
Because oxygenation changes depend on the relative changes in CBF and CMRO2, a quantitative interpretation of BOLD signals, and also other functional neuroimaging signals related to blood or tissue oxygenation, is fundamentally limited until we better understand brain oxygen metabolism and how it is related to blood flow. While there has been a large research effort focused on the links between neural activity and blood flow, our understanding of oxygen metabolism changes is limited by the intrinsic difficulty of measuring CMRO2. However, the complexity of oxygenation signals also has a positive side: the fact that oxygenation signals are sensitive to both CBF and CMRO2 changes offers the possibility of estimating CMRO2 changes when these measurements are combined with additional measurements of CBF. In fact, a quantitative interpretation of oxygenation-based signals offers the best hope we have for measuring dynamic changes in CMRO2 (Herman et al., 2009 ). This is intrinsically a multimodal imaging approach, and a key required element to make it work is a theoretical framework that accurately relates our measured signals to the underlying physiology.
This review focuses on the problem of interpreting oxygenation-based signals, the challenges involved in measuring CMRO2 in general, and what is needed to put oxygenation-based estimates of CMRO2 on a firm foundation. The importance of developing a solid theoretical framework is emphasized, both as an essential tool for analyzing oxygenation-based multimodal measurements, and also potentially as a way to better understand the physiological phenomenon that lies at the heart of BOLD-fMRI: the mismatch of CBF and CMRO2 changes with activation.
The Problem: Can We Interpret Oxygenation-Based Signals as a Quantitative Reflection of Physiological Activity?
Functional MRI based on mapping the BOLD response has developed into a widely used and sensitive tool for mapping patterns of activation in the human brain. Sophisticated statistical methods have been developed to identify significant signal changes associated with a stimulus, and these detected changes are taken as evidence for a change in neural activity at that location (with the caveat that the changes in deoxyhemoglobin may be dominated by downstream venous vessels that could be displaced from the precise site of neural activity change). This robust mapping approach addresses the basic question: where does activity occur? However, an important challenge facing functional neuroimaging is to move beyond mapping to meaningfully address the question of quantifying the activity change. This is a distinctly different, and much harder, problem than simply identifying where a change has occurred.
The key question is: does the magnitude of the BOLD response quantitatively reflect the magnitude of the underlying physiological changes? There are two primary effects that could alter the BOLD signal even for the same underlying change in neural activity: the baseline CBF state, and the coupling of CBF and CMRO2 changes. The BOLD response has a ceiling, corresponding to complete removal of deoxyhemoglobin, and so the amount of deoxyhemoglobin present in the baseline state sets the possible dynamic range for the BOLD response (Brown et al., 2003 ). This baseline effect could be an important confounding factor when studying disease populations, where the baseline CBF and CMRO2 may be altered by medications or by chronic aspects of the disease process itself (Fleisher et al., 2009 ). The second effect, that has received less attention to date, is that the BOLD response is sensitive to the exact coupling of CBF and CMRO2 (Ances et al., 2008 ; Herman et al., 2009 ). That is, methods sensitive to blood or tissue oxygenation depend on the relative balance of the changes in CBF and CMRO2. Increased neural activity drives increases in both blood flow and oxygen metabolism, but these physiological changes drive blood oxygenation in opposite directions.
The magnitude of the BOLD response thus depends on the CBF/CMRO2 coupling ratio n, defined as the ratio of the fractional change in CBF to the fractional change in CMRO2 for a given stimulus. This would not be a problem for interpreting the BOLD response if n is fixed. For example, a simple picture would be that increased neural activity requires increased energy metabolism, and the increased CMRO2 then drives an increase in CBF in a fixed ratio. However, a large body of evidence supports an alternative view that aspects of neural signaling, such as neurotransmitter release, nitric oxide (NO) generation, extracellular potassium changes, and activation of arachidonic acid pathways, can either dilate or constrict the blood vessels (Attwell and Iadecola, 2002 ; Hamel, 2006 ). In particular, the astrocytes, with processes projecting to both neuronal synapses and blood vessels, are thought to play a key role in detecting synaptic activity and modulating blood flow (Iadecola and Nedergaard, 2007 ; Koehler et al., 2009 ). In short, it is likely that the rapid control of CBF is driven by fast feed-forward mechanisms related to the neural activity itself, rather than feedback mechanisms related to energy metabolism. In other words, it appears that CBF and CMRO2 changes are driven in parallel by neural activity.
This raises the critical question: which aspects of neural activity drive CMRO2, which drive CBF, and are they always in the same ratio? The energy cost of neural activity is primarily in restoring ionic gradients following neural signaling, fueled by increased ATP consumption, and the ATP is replenished by the oxidative metabolism of glucose (Attwell and Laughlin, 2001 ). The focus here is on O2 metabolism, because CMRO2 is the relevant metabolic rate that combines with CBF to alter blood and tissue oxygenation. Clearly, though, CMRO2 requires glucose metabolism, because glucose is the substrate that is oxidized. Positron emission tomography (PET) studies typically find that the fractional change of the cerebral metabolic rate of glucose (CMRGlc) more closely follows the fractional CBF change and is larger than the fractional CMRO2 change (Fox et al., 1988 ). However, the link between CBF and CMRGlc is not tight, in that CMRGlc changes occur even when the CBF response is blocked (Cholet et al., 1997 ), and a recent study found an uncoupling of CBF and CMRGlc related to inhibition (Devor et al., 2008 ). A larger fractional change in CMRGlc compared to CMRO2 suggests that there is some degree of aerobic glycolysis and a corresponding generation of lactate despite an abundance of available oxygen (Prichard et al., 1991 ). The term aerobic glycolysis emphasizes the distinction to anaerobic glycolysis, in which reduced O2 availability prevents oxidative metabolism of the pyruvate created by glycolysis, and the pyruvate is subsequently converted to lactate. When oxygen is not available, glycolysis can provide a source of ATP. However, glycolysis alone generates less than 1/15 of the ATP generated by full oxidative metabolism, so the additional ATP generated by the aerobic glycolysis in the well-oxygenated healthy brain is a small fraction of the increased ATP generated by the smaller increase of oxidative metabolism. It is still unclear how aerobic glycolysis fits into the metabolic side of neural activation (Paulson et al., 2010 ), particularly because the contribution to energy metabolism is small. The rest of this review focuses on CMRO2, with the assumption that it is not limited by the availability of glucose.
It is likely that CMRO2 simply responds as needed to match ATP production to ATP consumption, so that the increase of CMRO2 reflects the overall energy cost of the evoked neural activity. In contrast, if the CBF response is driven by feed-forward mechanisms related to the neural signaling itself, this opens the possibility that the coupling index n is not fixed. As discussed below, a number of studies suggest that n varies regionally and even within the same region as the stimulus changes. Typical values are in the range n ∼ 2–4, and unfortunately this is a range in which the BOLD response magnitude is expected to be sensitive to the exact value of n. For example, theoretical calculations indicate that for the same CMRO2 change (and by assumption the same overall evoked neural activity), the BOLD response magnitude differs by 100% for n = 2 compared with n = 3 (Ances et al., 2008 ).
The Challenging Task of Measuring CMRO2
Measuring CMRO2 with Labeled Oxygen
In contrast to CMRO2, there are relatively direct and robust ways to measure CBF and CMRGlc. For these measurements, techniques have been developed in which a single agent is injected, allowed to distribute through the brain, and a single measurement of the concentration of the agent then provides a direct measure of the appropriate physiological quantity (CBF or CMRGlc). The accepted standard for CBF measurements is a microsphere experiment, in which labeled microspheres are injected arterially. Because the microspheres are too large to pass through the capillaries, they stick in the tissue, and the local concentration of microspheres then directly reflects the local CBF. With an appropriate measurement of the injected arterial bolus, the local CBF can be quantified in absolute units of ml blood/ml tissue/min. While microspheres are not used in human subjects, microsphere techniques provide the classic “gold standard” for validating other methods for measuring CBF. For human studies with MRI, pulsed arterial spin labeling (ASL) methods approach the ideal microsphere experiment because the delivery of magnetically labeled blood is measured only ∼1.5 s after creation of the labeled blood in the arteries, so there is little time for the labeled blood to pass through the capillary bed and clear from tissue (Buxton, 2005 ).
For measuring CMRGlc there is also an accepted standard based on injection of radioactively labeled deoxyglucose, a chemically modified form of glucose (Sokoloff et al., 1977 ; Phelps et al., 1981 ). Deoxyglucose is taken up from the blood like glucose and binds to the enzyme hexokinase, the first step in the glycolysis pathway. However, because of the structural difference between glucose and deoxyglucose, the latter cannot proceed to the later stages of glycolysis, and essentially sticks in the tissue. By waiting sufficiently long for unmetabolized deoxyglucose to diffuse back into blood and clear from the tissue, the remaining radioactive label in tissue directly reflects the local rate of metabolism of deoxyglucose, and can be quantified by also measuring the arterial concentration curve of the agent during delivery. This approach is applied in humans with PET using deoxyglucose labeled with 18F, a positron emitting radionuclide. As with microspheres for CBF measurement, the reason this technique works so well is that a single measurement of the tissue concentration of the agent directly reflects the metabolic rate.
Oxygen dynamics in the tissue can be measured by injecting labeled O2, either with 15O for PET detection (Mintun et al., 1984 ) or 17O for NMR detection (Arai et al., 1990 , 1991 ; Fiat and Kang, 1992 , 1993 ). However, deriving CMRO2 from such measurements is surprisingly difficult. The essential problem is that one cannot tell whether the detected oxygen nucleus is in O2, and thus not metabolized, or in water, and thus metabolized. Imagine measuring tissue concentration as a function of time during and following an injection of labeled O2. Initially, the labeled oxygen nucleus detected in the tissue will be in the form O2. Because the solubility of O2 in extravascular tissue is very low compared to blood due to hemoglobin binding, most of the labeled oxygen is in the blood compartment of the tissue, so that cerebral blood volume (CBV) strongly affects the measured concentration of labeled oxygen. Over time some of the initially delivered O2 will diffuse back to the blood without being metabolized and clear from the tissue. Another component will enter the mitochondria and be converted to water by oxygen metabolism. The labeled water will eventually diffuse to the blood and clear from the tissue. However, as blood continues to circulate the labeled water will be delivered back to the tissue, at a rate that depends on CBF, so that now the labeled oxygen enters as water as well as O2. In short, the kinetics of the labeled oxygen nucleus depends strongly on CBF and blood volume in addition to CMRO2, and there is no point in time when the tissue concentration cleanly reflects CMRO2 alone.
For this reason, the current standard method for measuring CMRO2 with PET requires three separate measurements following injection of 15O labeled O2, water, and carbon monoxide (for blood volume measurement), and analysis of the dynamic tissue concentration curves within a theoretical framework that accounts for the combined effects of CMRO2, CBF and CBV on the observed tracer kinetics (Mintun et al., 1984 ). In addition, temporal sampling of arterial blood is needed to measure the arterial time course of labeled O2 and labeled water. Even with these combined measurements it is still necessary to assume that there is no back flux of unmetabolized O2 from tissue to blood, specifically that all the O2 that leaves the capillary is metabolized. For both PET and NMR studies a number of ideas have been proposed for simplifying these measurements, but each of these is sensitive to particular assumptions of the model (Ohta et al., 1992 ; Zhu et al., 2002 , 2005 , 2006 ; Ibaraki et al., 2004 ; Zhang et al., 2004 ; Kudomi et al., 2007 , 2009 ). In short, the complexity of these studies reflects the intrinsic difficulty of measuring local O2 metabolism, and emphasizes the need for an accurate theoretical framework to integrate the different measurements. Furthermore, as with all studies using injected tracers, the assumption is that the physiology is in a steady-state throughout the measurement so that the observed dynamics of the agent reflect the dynamics of the injected bolus and its transport to tissue. For this reason the measurements of CMRO2 are necessarily steady-state rather than dynamic. Despite the complexities of the technique, PET measurement of CMRO2 is now being done at a number of institutions, although usually as a baseline measurement in different clinical conditions. Applications looking at brain activation in healthy subjects are less common (Mintun et al., 2002 ).
Another NMR approach for measuring CMRO2 exploits a particular magnetic property of 17O: when incorporated into a water molecule, it acts as a relaxation agent, altering the relaxation times of hydrogen nuclei. Furthermore, this effect can be modulated by applying a radiofrequency pulse at the 17O resonance frequency (Ronen and Navon, 1994 ; Ronen et al., 1997 , 1998 ). In this way the presence of 17O labeled water can be detected with standard proton MRI as a change in relaxation rate. However, when the 17O is incorporated into an O2 molecule it does not have this relaxation property. This creates the interesting scenario in which 17O inhaled as O2 is not visible with standard proton MRI until the 17O has been incorporated into water by O2 metabolism in the mitochondria. The rate of appearance of labeled water is then proportional to local CMRO2. To quantify this, however, requires additional measurement of the arterial input function (concentration of the label in arterial blood), and accounting for recirculation of the labeled water. Despite early interest in this approach, it has not been widely used to date due to the complexity involved in addressing these issues (similar to issues in the PET studies described earlier), combined with the high cost of 17O, although a recent study has extended the method to larger animals (Mellon et al., 2009 ).
Measuring CMRO2 from Blood or Tissue Oxygenation
The alternative to the more classical tracer kinetics approaches described above is to use blood or tissue oxygenation in combination with a measurement of CBF to estimate a change in CMRO2. This section focuses on the calibrated-BOLD approach, the primary method used in human studies, and tissue pO2 measurements used in animal studies. These two approaches are primarily sensitive to changes in CMRO2. Although these methods are not as sensitive to the baseline CMRO2 value, they provide the best opportunity available to measure the dynamics of CMRO2.
Before discussing these methods, though, it is important to note briefly that two recent alternative MRI approaches have been proposed that potentially could provide estimates of baseline absolute CMRO2. Both focus on the question of estimating the venous oxygenation through its effect on the transverse relaxation rate R2. With TRUST, the signal in a draining vein such as the sagittal sinus is isolated with an approach similar to ASL, and the transverse relaxation rate R2 is measured (Lu and Ge, 2008 ; Xu et al., 2009 ). From calibration studies in blood samples, R2 varies with O2 saturation. Combining this estimate of venous O2 concentration with a separate measurement of CBF then provides an estimate of baseline CMRO2. When this measurement is done in the sagittal sinus the result is a whole-brain CMRO2 estimate, but if this technique can be adapted for regional measurements it will provide important information on the distribution of baseline CMRO2. Even as a whole-brain measurement, baseline venous oxygenation can account for a significant amount of the variance of the BOLD response between subjects (Lu et al., 2010 ). The second method exploits a detailed model of how R2 changes with time as the MR signal decays, with the essential assumption that the additional signal decay in a gradient echo measurement compared with a spin echo measurement is entirely due to the effects of deoxyhemoglobin (Yablonskiy and Haacke, 1994 ; He and Yablonskiy, 2007 ; He et al., 2008 ). With additional assumptions about properties of the tissue compartments, this approach gave estimates of baseline O2 extraction fraction that are in good agreement with PET measurements. As these methods mature they may provide an important complement to the dynamic methods discussed below by providing the link between fractional and absolute changes in CMRO2.
An essential component of BOLD and tissue pO2 methods is a theoretical framework that accurately relates CBF and CMRO2 changes to the measured oxygenation signal. Modeling these physiological variables, in terms of how they relate to each other and in terms of how they relate to the imaging signals, is an active area of research (Valabregue et al., 2003 ; Buxton et al., 2004 ; Gjedde, 2005a ,b ; Huppert et al., 2007 , 2009 ; Uludag et al., 2009 ; Zheng et al., 2010 ). To clarify how such a theoretical framework can be used to estimate CMRO2 changes, we focus here on the simple theoretical framework defined in Table 1 , which relates, CBF, CMRO2, the BOLD signal, and tissue pO2. In this framework, changes in CBF and CMRO2 are related to the BOLD response by Eqs 1,2, and to the tissue pO2 response by Eqs 1, 3, and 4. In this framework, Eq. 1 is the most solid, essentially just reflecting mass balance. The product of flow and arterial O2 concentration is the rate of delivery of O2 to the capillary bed, and multiplying by the fraction of delivered O2 that is metabolized gives CMRO2. The remaining equations, however, represent specific models.
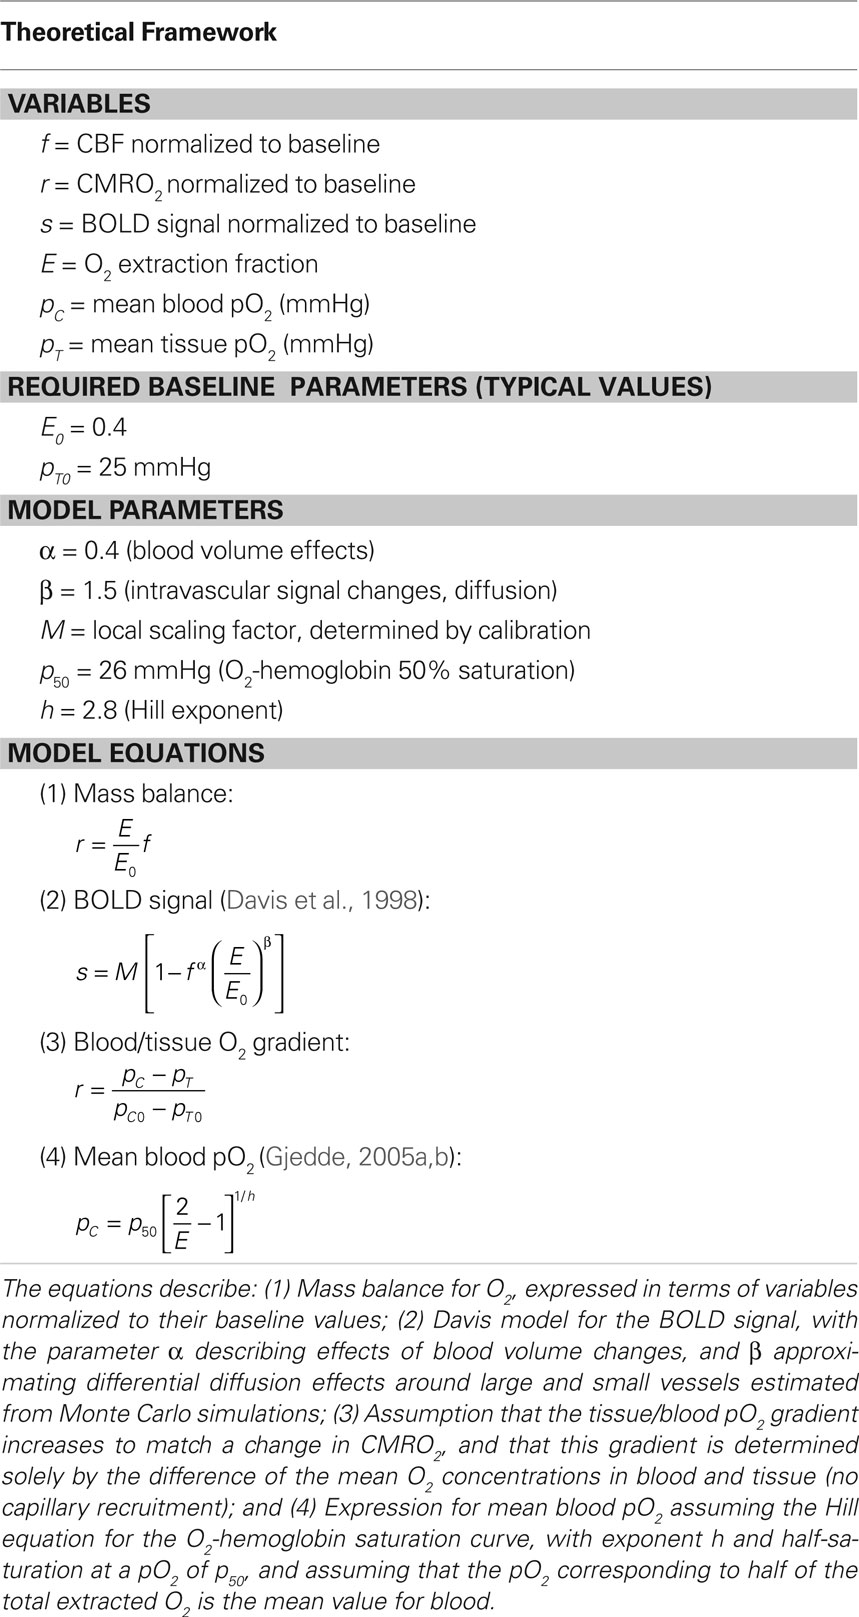
Table 1. Simple theoretical framework for estimating CMRO2 from multimodal measurements.
Modeling the BOLD response
Equation 2 is a model for the BOLD response proposed by Davis et al. (1998) , based on physical reasoning and Monte Carlo simulations. This is a simple model of a complex phenomenon, and yet this model has proven to be more robust than one might have thought given the restrictive assumptions that went into its derivation. Although originally derived just from consideration of extravascular signal changes, it captures the basic behavior of more detailed models that include additional effects (discussed below). The model reflects the primary dependence of the BOLD signal on changes in the O2 extraction fraction, but also includes an additional term in f that is intended to model the effect of blood volume changes on the BOLD signal as a power law relation with CBF, with an empirical exponent α = 0.4 (Grubb et al., 1974 ). The role of blood volume changes in modulating the observed BOLD response is somewhat subtle, and we still do not have a satisfactory understanding. In principle, blood volume changes could influence the BOLD response by changing the local total deoxyhemoglobin in tissue independently of a change in blood oxygenation. That is, blood oxygenation determines the deoxyhemoglobin concentration in blood, but total deoxyhemoglobin also depends on the volume of the blood compartments that contain partially deoxygenated blood. This is usually thought of as “venous” blood, but really also includes capillary and to some extent arteriolar blood, because it is thought that arteriolar blood is already slightly deoxygenated. Blood volume changes also can affect the measured BOLD response by a pure exchange of volumes, an effect that is not related to blood oxygenation. For example, a blood volume increase on the arterial side should have little effect on total deoxyhemoglobin, but if the increased blood volume occurs at the expense of a reduced extravascular volume, then the measured signal could change due to an intrinsic signal difference between the blood and the extravascular material that is displaced. This basic effect of a signal difference due to an exchange of one volume for another carrying a different signal is amplified in the VASO technique for measuring blood volume changes, by nulling the magnetization of blood to increase the intrinsic signal difference between the intravascular and extravascular spaces (Lu et al., 2003 ), although the full mechanisms of signal change with VASO are likely more complicated (Donahue et al., 2006 , 2009 ). Although this effect is much weaker in the BOLD response, it is good to remember that the BOLD response is not purely oxygenation-dependent.
The BOLD signal model in Eq. 2 contains two additional parameters, β and M. The exponent β was derived from Monte Carlo simulations of spins diffusing around magnetized cylinders (Boxerman et al., 1995b ), and essentially captures the idea that the same amount of deoxyhemoglobin has less of an effect on the BOLD signal change when it is in capillaries compared to when it is in larger veins (Ogawa et al., 1993 ). The source of this effect is the random movement of water molecules due to diffusion. It happens that the magnitude of motion of a water molecule during an experiment is comparable to the diameter of a capillary, so near the smallest vessels each molecule will sample a range of field offsets. Because all the water molecules are essentially sampling the same range of field offsets, the net phase dispersion when the net signal is measured is not as great as it would be if the molecules had not moved around. The net phase dispersion translates directly into the measured signal change, so the signal change is larger around larger vessels, where diffusion is less important because of the larger spatial scale of the field offsets. From numerical simulations, β = 1.5 approximately captures these effects for 1.5 T, decreasing to a value near 1 at high fields. Although this simple model ignores several effects, such as intravascular signal changes (Boxerman et al., 1995a ) and volume exchange effects, it agrees reasonably well with models that explicitly include these effects (Buxton et al., 1998 , 2004 ; Obata et al., 2004 ; Leontiev et al., 2007 ).
The parameter M is an overall scaling factor that essentially depends on the amount of deoxyhemoglobin present in the baseline state, as well as details of the image acquisition method such as the field strength and echo time (Davis et al., 1998 ; Buxton et al., 2004 ). This parameter sets the maximum possible BOLD signal amplitude for that region of brain, corresponding to complete removal of deoxyhemoglobin. That is, it is important to remember that the BOLD response has a ceiling, and that ceiling is reflected in M. Unlike the parameters α and β, which are usually assumed to be constant, the parameter M must be measured for each brain location for the particular experimental acquisition. This is done in the calibrated-BOLD approach introduced by Davis et al. (1998) by also measuring the BOLD and CBF responses to breathing CO2. The CBF response is measured with an ASL technique (Detre et al., 1992 ; Wong et al., 1997 ) and the essential idea is to exploit the fact that the ASL signal depends just on CBF changes, while the BOLD signal depends on CBF and CMRO2 changes. Mild hypercapnia is thought to produce a large change in CBF without changing CMRO2 (Sicard and Duong, 2005 ) (although there is still some controversy about this assumption; Zappe et al., 2008 ), and Eq. 2 is used to calculate M for a particular brain region with the assumption that r = 1. With M estimated, the measured CBF and BOLD responses to stimulus activation are used with Eq. 2 to derive an estimate of r, the fractional change in CMRO2.
A useful way to look at the role played by the BOLD model is that it allows us to draw contours of equal BOLD response in a plane defined by the fractional CMRO2 change on the x-axis and the fractional CBF change on the y-axis. Figure 2 A shows an example for M = 0.08 (i.e., an 8% ceiling on the BOLD response magnitude). If the value of M is not known, these contours would reflect equal but unknown increments of the BOLD response. Note that the non-linearity of the BOLD signal model primarily affects the spacing of the contour lines, while each contour is reasonably linear. If we are willing to assume that Eq. 2 holds for dynamic as well as steady-state changes (more on this question below), a hypothetical trajectory of CBF and CMRO2 responses to a brief stimulus can be plotted in this plane along with the resulting BOLD response. An example is shown in Figure 2 . Both CBF and CMRO2 are assumed to exhibit a smoothed response, with two features added to illustrate how transients of the BOLD response could occur. The first feature is that the CMRO2 response has a slightly faster rise time than the CBF response, producing an initial dip of the BOLD response. The second feature is a slight undershoot of the CBF response after the stimulus before it returns to baseline, producing a more pronounced undershoot of the BOLD response. This is just a simulated example, but it illustrates that the modeling framework predicts that relatively subtle differences in the CBF and CMRO2 responses can produce transient features of the BOLD response that are similar to those that often have been reported (Perthen et al., 2008 ).
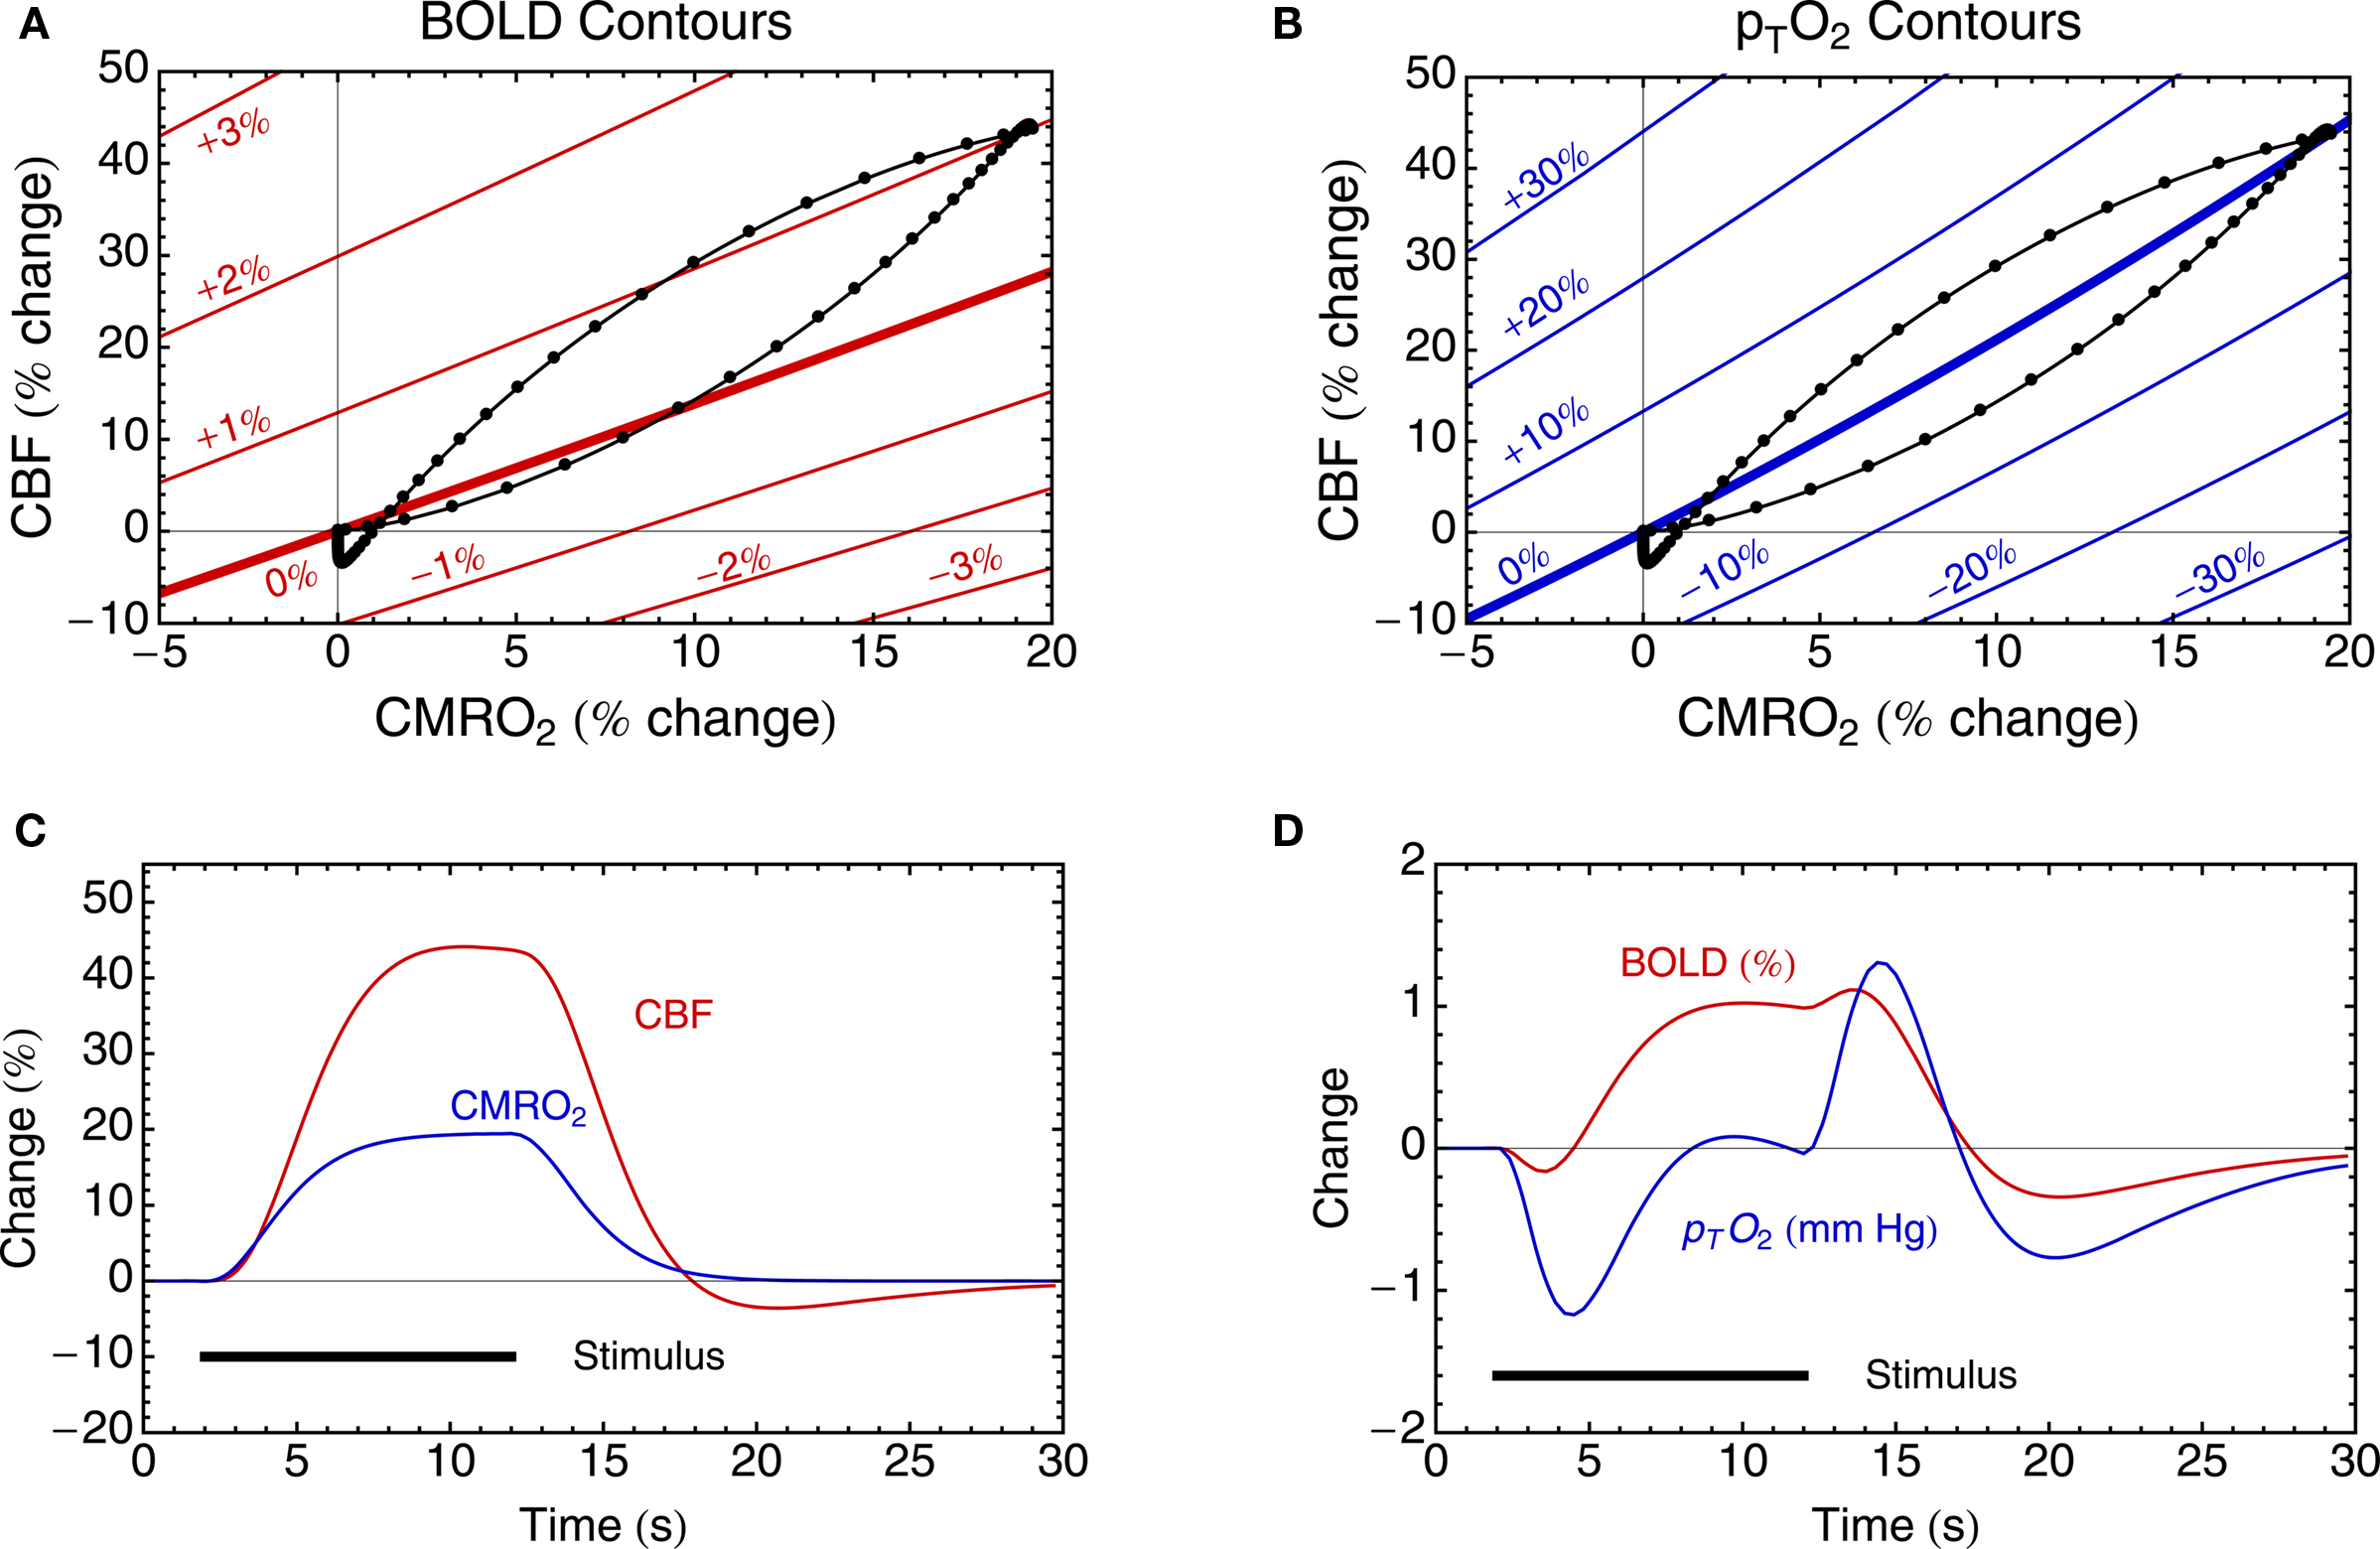
Figure 2. Theoretical curves derived from the theoretical framework in Table 1 . (A) Equations 1 and 2 define contours (in red) of equal BOLD signal change in the CBF/CMRO2 plane, here illustrated for M = 8%. The contour of zero BOLD response has a slope slightly greater than 1 because of the way blood volume effects are included. (B) Equations 1, 3, and 4 define contours (in blue) of equal tissue pO2 change, calculated with the assumption that at baseline pTO2 = 25 mmHg. (C) Hypothetical CBF and CMRO2 responses to a simple stimulus are shown. These two responses define a trajectory in the CBF/CMRO2 plane, shown in (A,B) as the black curve. The points on the curve represent equal time increments in the evolving CBF and CMRO2 curves in (C). (D) The resulting BOLD and tissue pO2 responses are shown for the CBF and CMRO2 responses in (C). Note that in this example the CBF and CMRO2 responses are approximately in the ratio 2:1 (i.e., n ∼ 2), and this causes the trajectory to pass over and under the zero change contour of pTO2, leading to the complex dynamics in (D). In addition, the CBF response was constructed with a weak post-stimulus undershoot to illustrate that this can create a more pronounced undershoot in the BOLD signal. In this example the ratio of the undershoot to the peak response is only ∼8% for CBF, but ∼30% for the BOLD response.
Modeling tissue pO2 changes
In addition to signals related to blood oxygenation there is growing interest in using signals related to tissue oxygenation in animal models, including traditional microelectrode methods as well as newer methods (Ndubuizu and LaManna, 2007 ). Interestingly, though, blood and tissue oxygenation signals are not equivalent, and the theoretical framework helps to clarify the differences. The simple theoretical framework for interpreting tissue pO2 shown in Table 1 is adapted from the work of Gjedde (2005a) , although framed in a slightly different way (discussed below). The model is based on three key assumptions: (1) With increased activity there is no capillary recruitment, so the vascular geometry stays the same. Increased CMRO2 requires an increased gradient of O2 concentration between blood and tissue, and if the vessel geometry is fixed this increased gradient must be due to an increased difference between blood and tissue pO2 values, leading to Eq. 3. (2) The O2 saturation Y of hemoglobin as a function of pO2 is described by the Hill equation with exponent h and half-saturation value p50, the pO2 at which hemoglobin is 50% saturated: Y = 1/[1 + (p50/pO2)h]. The values for h and p50 for human blood in Table 1 are taken from Mintun et al. (2001) , but Gjedde (2005a) has suggested using higher values of p50 = 35 mmHg and h = 3.5 to approximate the Bohr effect. (3) The mean blood pO2 driving diffusion into the tissue is the value derived from the Hill equation when the total O2 concentration is halfway to the full extraction fraction from the blood given by E. Equations 1, 3, and 4 effectively provide two relationships between the four physiological variables CBF, CMRO2, E and tissue pO2. In this way measuring any two of these variables allows one to calculate the remaining two from the equations. Specifically, measuring tissue pO2 and CBF allows calculation of CMRO2 and E.
At first glance the formulation in Table 1 may seem surprising, because it does not include any of the microscopic parameters that are usually introduced in analyzing O2 diffusion into tissue (Gjedde, 2005a ; Caesar et al., 2008 ). For example, the classic Krogh cylinder model is framed in terms of parameters such as the O2 diffusion constant, capillary radius and capillary spacing (Mintun et al., 2001 ). Instead, the goal here was to define the framework in terms of macroscopic variables, with introduction of as few microscopic variables as possible, because the microscopic parameters may not be well known. For example, the exact value of the O2 diffusivity does not enter the equations because it is assumed to be constant and effectively cancels out from Eq. 3. Instead of referencing the model parameters to microscopic parameters, the model is anchored by specifying baseline values of the macroscopic variables. In this case, one must specify E and tissue pO2 in the baseline state, and combined with Eq. 3 this gives the baseline mean blood pO2. The key difference between the current formulation, and the previous formulation used to interpret pO2 measurements (Caesar et al., 2008 ; Piilgaard and Lauritzen, 2009 ; Thomsen et al., 2009 ), is that this approach allows one to relate fractional changes in CMRO2 to pO2 without assuming values for microscopic variables, while the previous formulation focused on relating pO2 to absolute CMRO2, which requires accurate knowledge of microscopic O2 diffusivity.
In short, the formulation in Table 1 exploits the general phenomenon of levels of description: not all of the variables that need to be specified in a microscopic modeling framework will carry through to affect macroscopic parameters. By anchoring the model to assumptions about the baseline values of the macroscopic parameters we essentially fine-tune the relevant microscopic parameters to produce that baseline state, without ever introducing those microscopic parameters explicitly. Importantly, this approach also effectively allows the model to be adjusted to the human brain without having to assume that microscopic parameters measured in animal models carry through precisely to humans. In this case, there are a number of PET measurements of E in human subjects that suggest a baseline value of 0.4 is reasonable. For baseline tissue pO2 there is considerable variability in the tissue (discussed further below), and the “typical” value given in Table 1 is consistent with recent measurements in animal models (Ances et al., 2001 ; Thompson et al., 2005 ).
The tissue pO2 model allows us to draw contours of equal tissue pO2 in the plane defined by the fractional changes in CMRO2 and CBF (Figure 2 B). One clear feature of these contour lines is that they are distinctly different from the contours of the BOLD response. Specifically, the line of constant BOLD signal and the line of constant tissue pO2 have different slopes. This means that there is a range of possible CBF and CMRO2 responses, lying between the two zero change contour lines, where the BOLD response and the tissue pO2 response will have opposite signs (a negative tissue pO2 response occurring with a positive BOLD response). Again assuming that this model accurately describes dynamic changes as well as steady-state changes, the predicted variation of tissue pO2 for the hypothetical CBF and CMRO2 responses is shown in Figure 2 D. Note that this response is quite complicated, with a more pronounced initial dip compared with the BOLD response, and a positive response that only begins after the end of the stimulus. This complex response shows features similar to the interesting variety of tissue pO2 responses that have recently been reported for different stimuli in animal models, including relatively simple positive responses to a strong stimulus (Ances et al., 2001 ), a pronounced initial dip (Offenhauser et al., 2005 ) and complex wiggles and slow post-stimulus undershoots (Thompson et al., 2003 , 2004 ). The source of the complexity of the pO2 response is that the simulated CBF and CMRO2 responses have a ratio of about 2:1, and this means that the trajectory of the response passes back and forth across the zero contour of the tissue pO2 response. This is consistent with the pO2 measurements of Thompson and colleagues, in which all of the pO2 fluctuations they reported were less than ∼5% of the baseline pO2. The potentially important implications of this are discussed further below.
Improving and Validating the Theoretical Framework
Validating the accuracy of the models
The discussion above illustrates that an appropriate modeling framework can play two important roles. First, it provides a way to combine multimodal measurements (in this case CBF and BOLD responses, or CBF and tissue pO2 responses) to make a quantitative estimate of the CMRO2 response. Second, it provides a framework for exploring how different responses (e.g., BOLD and tissue pO2) will co-vary or diverge under different conditions. In particular, the theoretical framework brings out significant quantitative differences in the BOLD and tissue pO2 responses that are not intuitively obvious. Examples are the predictions that: (1) a slight post- stimulus undershoot of CBF can produce a much more pronounced undershoot of the BOLD response; (2) there are possible changes in which the BOLD and tissue pO2 responses will have opposite sign; and (3) the tissue pO2 response can be significantly more complicated than the underlying CBF and CMRO2 responses or the accompanying BOLD response. However, the theoretical framework outlined here is really just the starting point, and a number of possible limitations have to be tested, and the theoretical framework revised accordingly.
The BOLD signal model has several potentially important limitations. Although it was argued above that the current model is more robust than one might conclude from the restrictive assumptions involved in its derivation, this needs to be further tested. In particular, the most important aspect to nail down is the role played by blood volume changes (at all levels of the vascular tree) on the observed BOLD response. In applying the Davis model the exponent α = 0.4 is almost always used, with the assumption that this captures the volume change of blood compartments containing deoxyhemoglobin (primarily venous). However, this value originally came from whole-brain measurements of total blood volume changes in an animal model. A more recent study using PET methods in human subjects found larger values (as high as α = 0.64) (Rostrup et al., 2005 ), and a recent study in humans with the VASO technique also found values as high as α ∼ 0.6 (Lin et al., 2008 , 2009 ). It should be noted, though, that the VASO technique measures an absolute total blood volume change with activation, and a baseline value for blood volume must be assumed to estimate α. However, these methods measure total blood volume changes, and the primary quantity we need for interpreting the BOLD response is the venous volume change. A recent study using a novel method specifically sensitive to the venous blood found α ∼ 0.2 (Chen and Pike, 2009a ), smaller than the previously reported values for total blood volume but still greater than 0.
A number of investigators are attacking the question of determining the volume changes in different vascular compartments with a variety of techniques in animal models. Two photon microscopy studies, which allow direct visualization of the vessels and accurate measurement of vessel diameters in the upper 0.5 mm of cortex in rats and mice, have found that the volume changes are primarily on the arterial side, with relatively small changes in venous blood volume (Hillman et al., 2007 ). In addition, a number of MRI techniques have been developed to estimate volume changes in different vascular compartments, but it remains a challenging task to clearly isolate specific compartments from each other and from confounding flow effects. Several of these studies in animal models also found that most of the blood volume change is on the arterial side (Kim and Kim, 2006 ; Kim et al., 2007 ). More studies are clearly needed to clarify how blood volume changes with activation, but a working model based on these results is that most of the change is arterial, with smaller fractional changes in the venous and possibly the capillary compartments.
As noted above, the parameter β was initially introduced to approximate the net effect of smaller and larger vessels in describing the extravascular BOLD effect. It turns out fortuitously that this form also gives a reasonable description of the BOLD response when intravascular signal changes and volume exchange effects are included (Buxton et al., 2004 ; Leontiev et al., 2007 ). For this reason it may be better to look at β as a parameter that captures multiple effects, and no longer think of it in terms of the original derivation. A more detailed model of the BOLD response including multiple vascular compartments and effects could be used to estimate the value of β that maximizes the accuracy of the Davis model.
Although the concerns about which values of α and β should be used need to be addressed, it turns out that estimates of fractional CMRO2 change in a calibrated-BOLD experiment are relatively robust to uncertainties in α and β. The primary reason for this is that if the same model is used to analyze both the hypercapnia experiment and the activation experiment, the calculation is partially self-correcting (Davis et al., 1998 ; Ances et al., 2008 ). However, this robustness is based on the assumption that the relationship between volume changes and flow just depends on the magnitude of the flow change, and not on the details of how the flow change is evoked. A key question that needs to be addressed is whether this relationship is the same for CBF changes induced by hypercapnia and neural activity.
In contrast to α and β, the value of M is critical. In general, the Davis model is robust because many of the physiological variables that could have a strong effect on the BOLD response magnitude are essentially lumped into the parameter M. This includes physiological parameters, such as baseline venous blood volume and hematocrit, but also aspects of the image acquisition, such as echo time and field strength, and even the way that a region of interest is selected for averaging. For this reason, the value of M must be measured in each experiment, and a dangerous pitfall is to assume a value of M reported in the literature and apply it to data collected in a different way (Chiarelli et al., 2007b ; Leontiev et al., 2007 ; Lin et al., 2008 ).
The tissue pO2 model also has a number of simplifying assumptions that need to be tested. Clearly this model ignores many of the complexities of O2 transport in blood, such as a shift of p50 as CO2 diffuses into the blood, although these may be approximated by an appropriate choice of p50 and h (Gjedde, 2005a ). Perhaps the most important question, though, is: Can the macroscopic effects be described in terms of the average pO2 values in blood and tissue? That is, even for the simplest microscopic model, the Krogh cylinder, blood and tissue pO2 values have a large spatial variability (Mintun et al., 2001 ), and experimental measurements show a wide range of pO2 values, raising the question of whether it is even meaningful to talk about a mean tissue pO2 (Ndubuizu and LaManna, 2007 ). Note, though, that the relevant question is not whether pO2 is uniform in tissue, which would be a possible assumption that could be used to derive Eq. 3. Instead, the question is whether a much more detailed microscopic description leads to predictions for the macroscopic variables that differ significantly from the predictions of the simpler macroscopic models. A promising avenue for addressing questions like these is to construct detailed models of the vascular tree from animal imaging data and use such realistic geometries to calculate oxygen transport (Fang et al., 2008 ). These simulations also should include known effects of blood transport, such as the shift of p50, and so need to model CO2 production and clearance simultaneously with O2 transport and consumption. In addition, such simulations could also test assumptions of the PET models used for estimation of CMRO2, particularly the significance of the assumption of zero back flux of unmetabolized O2 from the tissue. While such modeling is computationally demanding, it is not out of reach, and recent studies are encouraging.
Dynamic responses
One of the exciting aspects of oxygenation-based methods, compared with tracer methods, is the possibility of measuring dynamic CMRO2 changes. However, the theoretical framework described in Table 1 is based on steady-state relationships, and it is an open question whether these equations are accurate for dynamic studies. For example, Eq. 1 is intrinsically a steady-state equation because the net extraction fraction is the result of the full passage of the blood through the vascular bed, which requires a finite time. To deal with this issue, more detailed models are required that carefully take into account the dynamics of different compartments, or explicitly consider an extended vascular network (Boas et al., 2008 ). While such models may be too complex for routine use, they would provide a valuable test-bed for validating simpler models, such as the framework described here, and guide the development of more accurate macroscopic models that capture the dynamics. For these reasons, the dynamic curves in Figure 2 should be considered as suggestive of what the dynamics might look like, because they were calculated by assuming that the steady-state relationships apply at each time point, and this needs to be tested with the more detailed models.
In addition to these basic questions regarding the modeling, it is still an open question whether there are transient physiological changes that are not captured by the simple theoretical framework. There is a reasonable consensus that the initial dip of the BOLD response reflects a faster rise of CMRO2 compared to CBF (Malonek and Grinvald, 1996 ; Devor et al., 2003 ), and the current framework captures that possibility (see Figure 2 ). However, there is no consensus on whether the post-stimulus BOLD undershoot is a neural, vascular or metabolic effect. Intriguing recent evidence suggests a neuronal modulation of the undershoot (Sadaghiani et al., 2009 ), but it has more commonly been hypothesized to be a biomechanical (Buxton et al., 1998 ; Mandeville et al., 1999 ; Chen and Pike, 2009b ) or metabolic effect (Frahm et al., 1996 , 2008 ; Lu et al., 2004 . If the undershoot is due to a mismatch of CBF and CMRO2, then the current framework will capture the effect. For example, the undershoot could be due to a slow recovery of CMRO2 combined with a fast recovery of CBF, or a fast recovery of CMRO2 combined with an undershoot of CBF (the latter possibility is illustrated in Figure 2 ). However, another possibility is that transients of blood volume and blood flow are different, so that blood volume recovers slowly even though CBF and CMRO2, and thus intrinsic blood oxygenation, have returned to baseline. This effect is not captured by the current theoretical framework, because Eq. 2 assumes a fixed relationship between blood flow and blood volume given by a power law. For this reason, it is important to determine empirically whether this effect occurs.
Early MRI studies using MION, a magnetic agent that labels the blood plasma, found a slow recovery of blood volume with a duration that matched the BOLD post-stimulus undershoot and was longer than the recovery time of CBF (Mandeville et al., 1998 ). This observation prompted two similar models – the balloon model (Buxton et al., 1998 ) and the delayed compliance model (Mandeville et al., 1999 ) – hypothesizing that a slow recovery of venous blood volume, elevating total dexoyhemoglobin even though blood oxygenation had returned to baseline, could account for the BOLD post-stimulus undershoot. Later studies with MION and higher spatial resolution found that the slow recovery of blood volume was primarily in the middle layers of cortex (Yacoub et al., 2006 ; Zhao et al., 2007 ). Interestingly, though, the BOLD undershoot was present in the upper layers as well as the middle layers. This suggests that while a slow venous volume recovery could be a contributing factor, particularly in the middle layers, it cannot be a general explanation. The presence of a BOLD undershoot in the upper layers without a slow blood volume recovery suggests that there is also an alteration of blood oxygenation, presumably due to a mismatch of CBF and CMRO2 in the post-stimulus period (Yacoub et al., 2006 ). In contrast to the MION studies, though, other studies using different techniques have not found evidence for a slow recovery of blood volume (Lu et al., 2004 ; Hillman et al., 2007 ; Frahm et al., 2008 ). The BOLD post-stimulus undershoot in the absence of a slow venous recovery could be due a slow recovery of CMRO2 as noted above, although there is no direct evidence for this. Instead, this explanation remains when the possibilities of a slow blood volume recovery or a CBF undershoot are excluded. However, Figure 2 suggests that a weak undershoot of CBF would be sufficient to explain a more substantial BOLD undershoot, and in practice it may be difficult to exclude such a possibility because of the noise in the measurements. In short, an important physiological question that needs to be resolved in establishing a theoretical framework is whether blood volume changes are being accurately modeled.
Current Experimental Measurements of the Coupling of CBF and CMRO2
In addition to PET studies of the coupling of CBF and CMRO2 (Fox and Raichle, 1986 ; Fox et al., 1988 ; Marrett and Gjedde, 1997 ; Ito et al., 2005 ), several groups have adopted the calibrated-BOLD approach and reported values of the CBF/CMRO2 coupling index n in the range of about 2–4 (Davis et al., 1998 ; Hoge et al., 1999 ; Kim et al., 1999 ; Kastrup et al., 2002 ; St Lawrence et al., 2003 ; Stefanovic et al., 2004 , 2005 ; Uludag and Buxton, 2004 ; Fujita et al., 2006 ; Chiarelli et al., 2007a ; Leontiev and Buxton, 2007 ; Leontiev et al., 2007 ; Ances et al., 2008 , 2009 ; Perthen et al., 2008 ; Restom et al., 2008 ; Lin et al., 2009 ). Other studies have used the framework of the calibrated-BOLD approach to argue that CBF and CMRO2 are coupled in a similar way in deactivations and activations (Shmuel et al., 2002 ; Stefanovic et al., 2004 , 2005 ; Uludag et al., 2004 ; Pasley et al., 2007 ).
Figure 3 shows a sampling of current data in human subjects using either PET or calibrated-BOLD techniques. The plotted points are representative values from the studies, and the symbols used reflect the brain area and the technique. Also plotted are lines of constant values of n, the ratio of the CBF and CMRO2 changes. Note that the word “coupling” is used here simply to describe the empirical ratio n, and does not necessarily imply a direct mechanistic link between CBF and CMRO2. Instead, current ideas point to CBF and CMRO2 being driven in parallel by neural activity. For reference to Figure 2 , the contour predicted for constant tissue pO2 also is plotted.
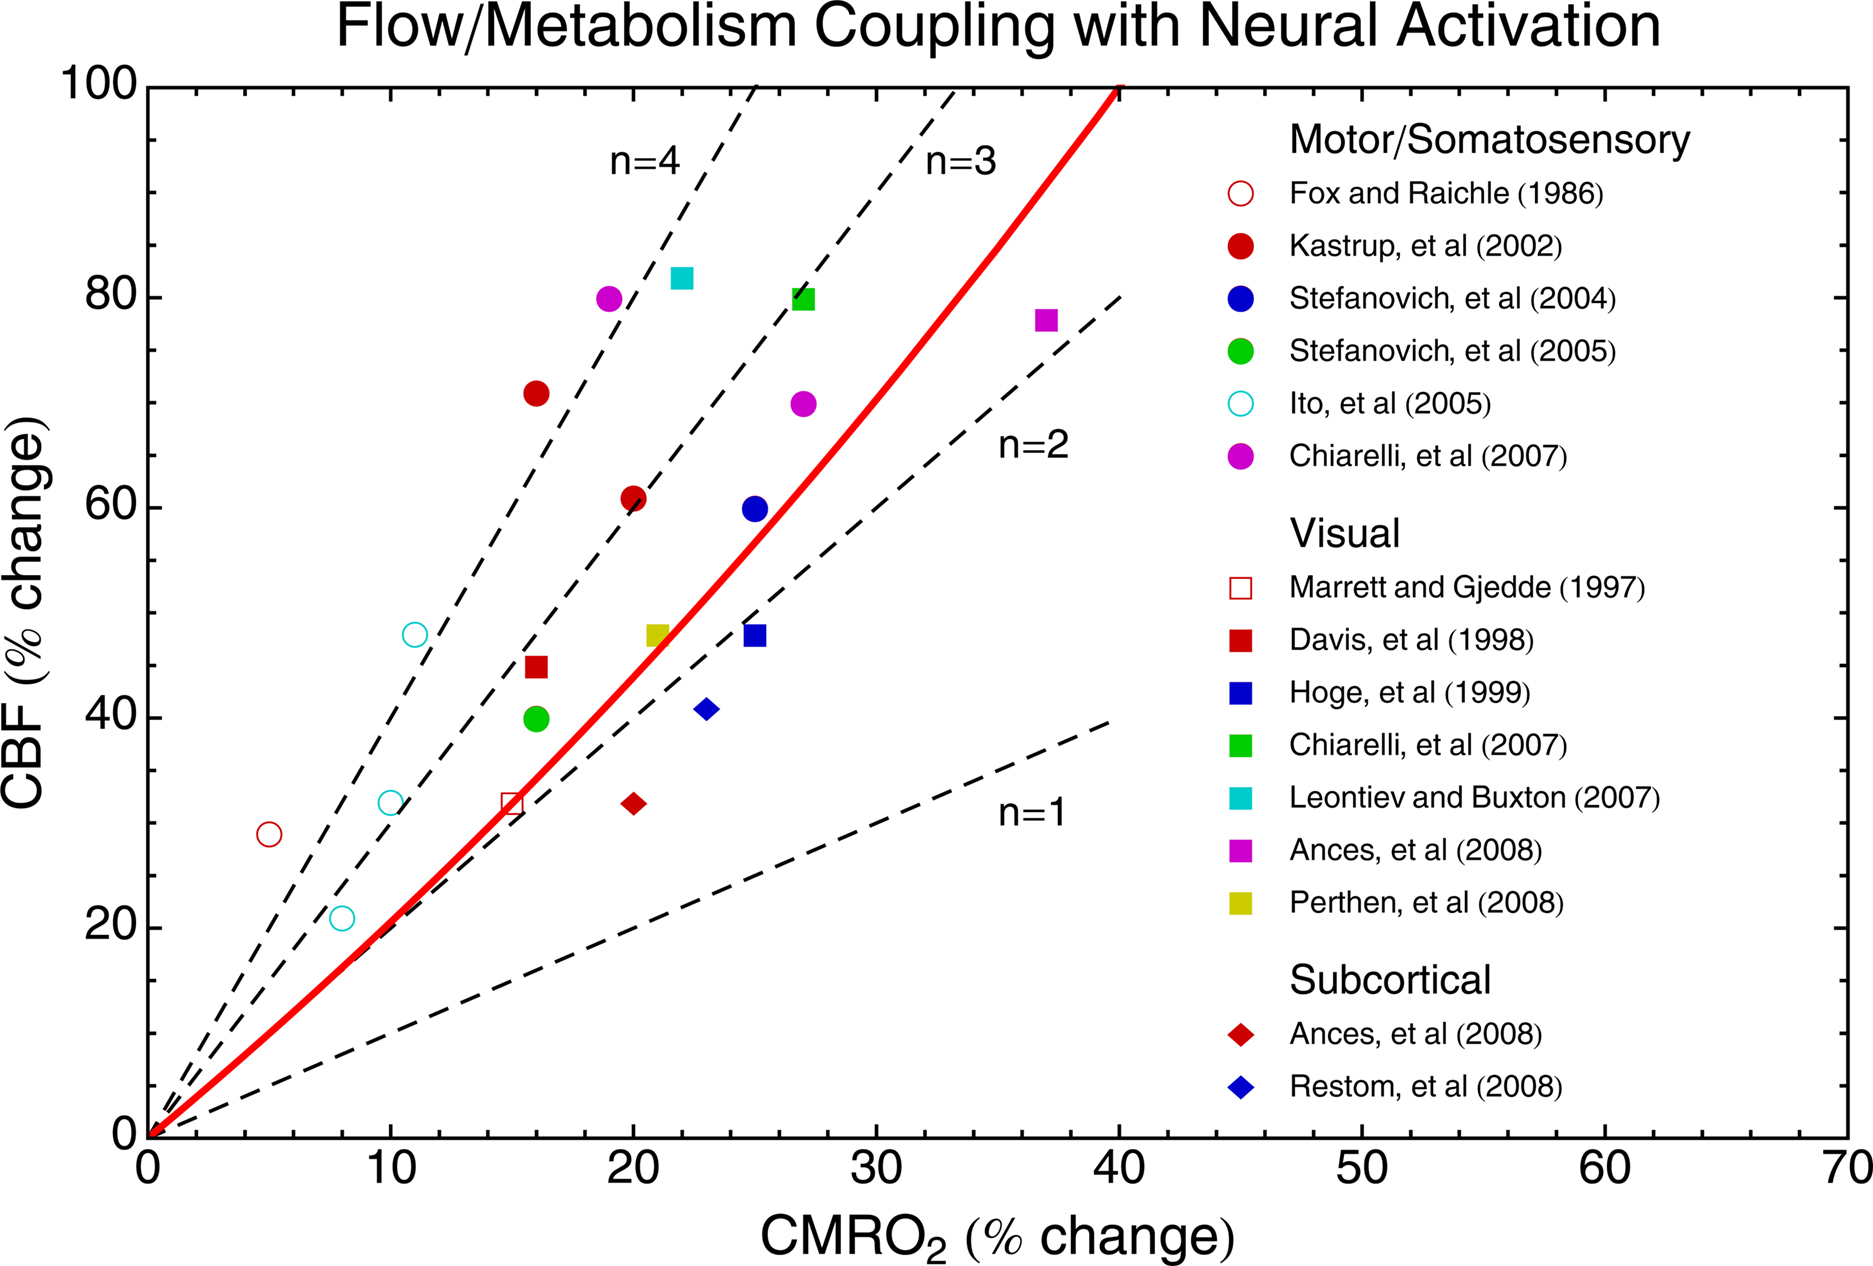
Figure 3. Experimental measurements of CBF/CMRO2 coupling in human brain. PET measurements are indicated by open symbols, and calibrated-BOLD measurements are indicated by filled symbols. Different symbol shapes are used for different brain areas, as indicated. Lines of constant n are shown as dashed lines, and the solid red curve is the contour of constant tissue pO2 calculated from the theoretical framework and shown in Figure 2 B. The fact that the points are all well above the line n = 1 produces the BOLD effect with activation. A speculation discussed in the text is that the function served by a large value of n is to prevent a fall in tissue pO2 as CMRO2 increases.
There is a considerable spread of the coupling ratios, with most measurements lying in the range n ∼ 2–4. The calibrated-BOLD measurements show the highest changes in CBF and CMRO2, and this could be due to reduced partial volume averaging of gray matter signals with the improved spatial resolution of MRI compared with PET. Overall, though, there does not appear to be a strong difference in the coupling ratio n between calibrated-BOLD and PET measurements. The original observation of the CBF/CMRO2 mismatch by Fox and Raichle is one of the largest values of n found (∼6), but later PET studies found n ∼ 2 in other brain regions. Undoubtedly, some (perhaps most) of the variance in these data is due to the different methods used. However, there is a trend in this data for motor/somatosensory data to have the highest values of n, basal ganglia to have the lowest values, and visual areas to lie in the middle.
In a study specifically comparing simultaneous activation of basal ganglia areas with a motor task and visual areas with a visual stimulus, Ances et al. (2008) found a significantly higher value of n in visual cortex (n ∼ 2.3) compared to basal ganglia (n ∼ 1.7). At first glance this degree of difference does not sound like it should be too important, but the effect on the BOLD response was striking. The ratio of the BOLD responses for these two tasks was ∼7, even though the ratio of the CMRO2 responses was only ∼2. Interestingly, this failure of the BOLD response to accurately reflect the underlying CMRO2 change was not due to a difference in the value of the scaling parameter M between the two regions, but rather due to the difference in n. The CBF response to hypercapnia was also larger in the visual area compared to basal ganglia, in parallel with the larger value of n associated with neural activation, suggesting a generally greater responsiveness of the blood vessels in the visual areas. This data, in addition to the other data in Figure 3 , suggests that the coupling ratio n may vary between brain regions within the same subject. In addition, recent experiments suggest that n varies within visual cortex with the frequency of a visual stimulus (Lin et al., 2008 ) and with time for a sustained stimulus (Lin et al., 2009 ).
Positron emission tomography studies have been reported with a wide variation in the coupling of CBF and CMRO2, including extreme cases of no change in CMRO2 with an activation CBF (Kuwabara et al., 1992 ), as well as variability with the duration (Mintun et al., 2002 ) or frequency (Vafaee et al., 1999 ; Vafaee and Gjedde, 2000 ) of a visual stimulus. Taken together, the available data suggest that n may vary between regions, and even within a region it may vary with stimulus amplitude or other characteristics.
In short, the variability of n poses a significant problem for the interpretation of BOLD signals. Specifically, the relative value of BOLD responses cannot be taken as a quantitative reflection of the relative values of the underlying physiological changes. Variability of n is consistent with the current idea that neural activity drives CBF and CMRO2 in parallel, and emphasizes the critical importance of understanding exactly which aspects of neural activity drive CBF and which create a demand for higher CMRO2.
Open Questions
The phenomenon that a brief neural stimulus produces a robust, but delayed, increase of CBF (Figure 1 ) lies at the heart of many functional neuroimaging techniques, and yet we still do not have a clear picture of the mechanisms involved, or even of the physiological function served by this response: why is it so large, why is it so fast, and does it have anything to do with oxygen metabolism? The experimental data, integrated within the theoretical framework, may provide a possible explanation. These questions are considered in this section, emphasizing the idea that tissue pO2 may be the key to understanding CBF/CMRO2 coupling.
Why is the CBF Change so Large?
As noted above, recent studies of the tissue pO2 response with neural activation have found interestingly complex wiggles. However, stepping back from these detailed fluctuations, a remarkable finding is that the fluctuations are relatively small. For example, with a visual stimulus in a cat model Thompson et al. (2003 , 2004) found pO2 fluctuations that were all less than about 5% of the baseline pO2. Other studies with electrical stimulation in rats have found larger variations of ∼20% (Ances et al., 2001 ; Offenhauser et al., 2005 ), but conceivably the stimuli used were exceptionally strong compared to normal physiological stimuli. In parallel to these animal studies, the PET and calibrated-BOLD studies shown in Figure 3 indicate that the CBF/CMRO2 coupling ratio n is ∼2–4. The theoretical framework in Table 1 shows that these different experimental results are consistent with a simple picture: the observed CBF/CMRO2 coupling ratio is approximately what is required to maintain a constant tissue pO2 (the contour of constant pO2 is plotted in Figure 3 ). Furthermore, the theoretical pO2 curve in Figure 2 illustrates that complex fluctuations of tissue pO2, but of small magnitude, can occur as the dynamic curves of CBF and CMRO2 response pass over and under the contour of constant pO2 in the CBF/CMRO2 plane.
This observation suggests the hypothesis that the existence of the BOLD effect – the apparent mismatch of CBF and CMRO2 changes – could be the result of a homeostatic mechanism acting to prevent a fall of tissue pO2 despite changes in the metabolic rate. Based on the theoretical framework in Table 1 , a CMRO2 increase of 20% with no change in CBF would lead to a 30% drop of tissue pO2, while a CBF change ∼2.5 times larger than the CMRO2 change would preserve tissue pO2 ∼25 mmHg. An earlier idea for why n is large was that O2 delivery is limited at baseline (Gjedde et al., 1991 ; Buxton and Frank, 1997 ), motivated by the previous assumption of the PET methods that the pO2 in tissue is near 0 so that back flux of O2 from tissue to blood is negligible (Mintun et al., 1984 ). In that case, because tissue pO2 cannot drop, and because there is no capillary recruitment, the only way to increase the O2 gradient from blood to tissue is to increase the blood pO2 by decreasing E. Valabregue et al. (2003) pointed out that relaxing the assumption of zero tissue pO2 gave more flexibility for CBF and CMRO2 to vary, and the pO2 measurements cited above support the idea that tissue pO2 is reasonably high. The current argument is in a sense an extension of the original oxygen limitation hypothesis, but now in terms of a non-zero tissue pO2 that is prevented from dropping lower, rather than a zero tissue pO2 that cannot drop. The required value of n needed to maintain tissue pO2 decreases for higher values of baseline tissue pO2.
Why is the CBF Change so Fast?
The argument above addresses the question of why n is large, but does not necessarily address why the CBF response is so fast. The dynamic example in Figure 2 essentially assumes that the time constants for adjustments of blood and tissue oxygenation are on the order of 1 s, and this needs to be tested with more detailed models, as discussed above. As a start in this direction, it is useful to estimate the time constants for different aspects of energy metabolism as a guide to whether these components would require a fast CBF response, and whether they could potentially provide a rapid signal to drive the CBF response. It’s important to note that these time scales do not describe how quickly the glucose or O2 metabolic rates could change. Both metabolic rates are likely to be able to change on a very short time scale with no changes in the concentrations of glucose or oxygen, through changes in the activity of rate-limiting enzymes. Instead, these time constants reflect the speed with which an abrupt change in metabolic rate would translate into a change in concentration of the metabolic substrates or products.
One clear function of blood flow is to deliver the substrates of energy metabolism, glucose and oxygen, and clear the waste products, carbon dioxide and heat. Metabolic rates are usually expressed as moles per minute per gram of tissue, but it is useful to consider these rates referenced to a unit volume of tissue, rather than a unit mass, and the metabolic rate is then a concentration divided by time (mM/min). In the adult human brain, a typical glucose metabolic rate is about 0.3 mM/min (Chugani et al., 1987 ), and a typical concentration of glucose in brain is about 2 mM at normal plasma glucose levels (Gruetter et al., 1998 ). The time constant for depleting the glucose is thus on the order of several minutes, suggesting that the regulation of blood flow on a time scale of seconds is not required to support glucose metabolism. Furthermore, if the O2 supply was somehow abruptly stopped but CMRGlc continued at the normal rate, lactate would accumulate at a rate of about 0.6 mM/min, so a change of lactate concentration of only 1 mM would take on the order of 90 s to grow.
The CMRO2 is higher, about 1.6 mM/min (Ito et al., 2004 ), and the tissue concentration of O2 is lower. If the tissue pO2 is ∼25 mmHg, a solubility of 0.0013 mM/mmHg gives an extravascular O2 concentration of only ∼0.03 mM. Arterial blood has an O2 concentration of about 9 mM, so for a typical tissue blood volume fraction of 5% and a roughly 70% average hemoglobin saturation the intravascular O2 content in tissue is about 0.26 mM. The total O2 concentration in an element of tissue then is about 0.3 mM, with most of that in the blood compartment. The time constant for depleting the available O2 is then on the order of 10 s, much shorter than the equivalent time for depletion of glucose. Excluding the O2 in blood within a tissue element, the O2 concentration associated with baseline tissue pO2 would be depleted in ∼1 s at the baseline metabolic rate, providing some support for applying the steady-state theoretical framework to dynamic changes.
Blood flow also carries away CO2 and heat. Because CO2 rapidly equilibrates with bicarbonate ions, the total pool of CO2 in the brain is quite large, ∼25 mM. The CO2 production rate is close to the O2 consumption rate, ∼1.6 mM/min, so the time constant for changing total CO2 is on the order of 10 min. Conceivably, though, pH changes could begin to become important on a shorter time scale, and a possible role for CO2 in the post-stimulus undershoot has recently been proposed (Yucel et al., 2009 ). If the heat produced by the metabolic reactions is not dissipated, the temperature of the brain could rise to a level that could impair brain function. About 440 kJ of heat is released per mole of O2 metabolized, and the heat capacity of water is ∼4.2 J/g/°C (Yablonskiy et al., 2000 ). If the heat of metabolism was not cleared, the temperature would rise only ∼0.1°C in 40 s. Thus, while clearance of heat is an important function, it does not appear that this requires the fast CBF response observed with neural stimulation.
In short, if energy metabolism increased without a change in CBF, the time scales for significant changes in the concentrations of glucose, lactate, and CO2, as well as the temperature rise due to added heat, appear to be too long to require a fast CBF response, or to provide the signal for increasing CBF. On the other hand, the time scale for changes in pO2 is comparable, although perhaps a bit longer, than the observed CBF response, suggesting that a fast CBF response is necessary to prevent a drop of tissue pO2.
What Drives the CBF Change?
The arguments above raise two key questions: why does the brain need to preserve tissue pO2, and what mechanisms could be involved in maintaining it? At first glance, it appears that the normal pO2 level (∼25 mmHg) is much higher than it needs to be, given that the effective Km for cytochrome oxidase, the O2 concentration where O2 availability limits CMRO2, is below 1 mmHg (Gnaiger et al., 1998 ). That is, it appears that CMRO2 should not be affected by transient dips in tissue pO2. However, there are two potential reasons why a higher pO2 may be important for healthy brain function. The first is that there are many other reactions for which O2 is a substrate, and these have much larger Km values than cytochrome oxidase (Vanderkooi et al., 1991 ; Erecinska and Silver, 2001 ). For these reactions, fluctuations of tissue pO2 could affect the reaction rate. A second possible reason why maintaining a high tissue pO2 may be important is related to the thermodynamics of energy metabolism. The Gibbs free energy (ΔG) available from oxidative metabolism of glucose depends on the O2 concentration. This ΔG must be sufficiently negative to offset the strong positive ΔG required to produce ATP from ADP and Pi. If the ΔG of oxidative metabolism is reduced because of low tissue pO2, there will be a point where CMRO2 cannot proceed unless the ΔG related to producing ATP also is reduced. This would be a reduction of the phosphorylation potential, the ratio [ATP]/[ADP][Pi]. This phenomenon was observed in cell cultures, where even though the rate of O2 metabolism could be maintained down to very low levels of pO2, the phosphorylation potential began to decrease at much higher levels (Wilson et al., 1979 ).
In the last decade there has been a surge of research on the mechanisms by which cells sense their oxygen level and respond with a wide range of physiological changes, particularly the cascade of events that follows stabilization of hypoxia-inducible factor-1 (HIF-1, Semenza, 2009 ). While often considered in the context of responses to hypoxia, it is interesting to note that some of the intermediate reactions are sensitive to the pO2 at higher levels (Ward, 2008 ), and recent work suggests that these mechanisms may play a role in normoxia as well as hypoxia (Semenza, 2009 ). While it is conceivable that a pO2 feedback system may be involved in driving the acute CBF changes with activation, it is not clear that these mechanisms could operate effectively on the time scale of a few seconds. Such mechanisms, like other metabolic influences, may operate on a longer time scale to match CBF with energy demands. For this reason, the immediate trigger for the CBF increase most likely operates in a feed-forward fashion, with aspects of neural activity triggering an initial response that is then modulated by slower feedback responses. A great deal of experimental evidence has supported a role for astrocytes in modulating CBF, acting as both an integrator of local synaptic activity and an effector of blood flow change (Iadecola and Nedergaard, 2007 ). However, it is still not clear whether astrocyte responses are fast enough to drive CBF changes on a time scale of seconds, as the time scale observed for vascular responses in slice preparations is much longer than what is observed in awake humans (Koehler et al., 2009 ).
One mechanism that has been observed to respond quickly enough to drive the CBF response is the production of NO (Buerk et al., 2003 ). While NO is produced by vascular and endothelial mechanisms, it also is produced by neurons. Interestingly, though, the neurons that produce NO have been isolated to a class of inhibitory GABA-ergic interneurons (Estrada and DeFelipe, 1998 ). This is an example of a mechanism that has an inhibitory effect on the neuronal population, and yet also increases blood flow. Adenosine is another prime example, reducing neuronal excitability while also acting as a vasodilator (Dirnagl et al., 1994 ; Haydon and Carmignoto, 2006 ). At first glance, this counterintuitive behavior is puzzling if the goal is to match blood flow to the level of neural activity. However, this combined effect makes sense as a protection against a potentially dangerous drop in tissue pO2, by both increasing delivery and decreasing demand for O2. Both effects would serve to raise tissue pO2. This is consistent with the idea of oxygen conformance, that a primary defense of an organism when faced with hypoxia is to reduce the ATP consumption and O2 metabolic rate (Hochachka et al., 1996 ).
The existence of mechanisms that drive neural activity down while increasing CBF suggests the possibility that a greater involvement of inhibitory activity could be associated with larger values of n. However, we should be cautious in interpreting these studies: the identification of a particular mechanism in simple preparations does not necessarily mean these mechanisms are dominant or even invoked in vivo. For example, interneurons also release neuropeptide Y (Abounader and Hamel, 1997 ), a vasoconstrictor, and astrocytes can trigger both vessel dilation and constriction (Zonta et al., 2003 ; Mulligan and MacVicar, 2004 ; Blanco et al., 2008 ), and we have no clear picture of how these different potential mechanisms are integrated into a responsive system in vivo. Nevertheless, the possibility of significant variations in CBF/CMRO2 coupling related to inhibition is a potentially fruitful direction for future research.
In summary, the data and the theoretical modeling suggest the hypothesis that the underlying function served by n ∼ 2–3 is to approximately maintain tissue pO2 at a constant level. However, feed-forward mechanisms driven by the neural activity itself, such as NO production, are likely required to achieve the fast CBF response necessary to prevent a fall in pO2. Furthermore, the specific interplay of different aspects of the evoked activity, such as the degree of evoked inhibitory activity, could alter the CBF/CMRO2 coupling ratio. This speculative scenario needs to be tested with detailed studies in animal models of the specific aspects of neural activity that drive CBF changes, and how these relate to the overall energy demands of the full evoked activity. Finally, it is interesting to note that the hypothesis that tissue pO2 is approximately conserved during neural activation is consistent with a broader evolutionary hypothesis. Baseline pO2 levels in tissue are similar to what is thought to have been the atmospheric level of O2 two billion years ago, when the machinery of oxidative metabolism evolved. It has been hypothesized that organisms try to preserve this level of O2 in tissues as a balance between too little, limiting O2 metabolism, and too much leading to increased generation of reactive oxygen species and potential cellular damage (Massabuau, 2003 ).
Conclusions
The basic picture of blood flow and oxygen metabolism being driven in parallel by neural activity – rather than a serial connection with neural activity driving energy metabolism which then drives blood flow changes – creates a significant challenge for interpreting many brain imaging signals in a quantitative way. The central problem is that methods sensitive to blood or tissue oxygenation depend on the relative balance of the changes in blood flow and oxygen metabolism. For this reason, any quantitative interpretation of oxygenation signals such as the BOLD response in terms of the underlying physiological changes is problematic without a better understanding of O2 metabolism. Because blood flow and glucose metabolism are easier to measure, there has been much more work done relating neural activity to CBF and CMRGlc. However, the positive side of the complexity of oxygenation signals is that they potentially provide the best methods we have for studying the dynamics of CMRO2 when combined with separate CBF measurements. To make this a reality, though, requires a validated theoretical framework that accurately describes how our oxygenation signals (such as BOLD or tissue pO2 responses) depend on the changes in CBF and CMRO2. The current framework may be sufficient, but this needs to be tested with experimental measurements and more detailed modeling. This goal is within reach, but will require a focused research effort.
In addition, an accurate theoretical framework allows us to explore the physiological consequences of different hypotheses. For example, the existing data integrated within the simple theoretical framework described here suggests the hypothesis that an important functional role of the mismatch of CBF and CMRO2 changes with neural activation is to prevent a fall of tissue pO2. This hypothesis would explain why the CBF response is as fast and as large as it is, and accounts for the complexity of the observed dynamics of pO2 when dynamic CBF and CMRO2 responses are not perfectly balanced. However, many basic questions remain unresolved, particularly the mechanisms that control CBF changes in the healthy, awake human brain and, most importantly, how these mechanisms may be altered in disease. Progress in answering these questions will lay a foundation for using oxygenation-dependent neuroimaging signals as a quantitative probe of brain function, rather than simply a mapping tool.
Conflict of Interest Statement
The author declares that the research was conducted in the absence of any commercial or financial relationships that could be construed as a potential conflict of interest.
Acknowledgments
The author would like to thank the following individuals for stimulating discussions on this topic: Beau Ances, Nic Blockley, David Boas, Anders Dale, Anna Devor, David Dubowitz, Valerie Griffeth, Edith Hamel, Thomas Liu, Farshad Moradi, Scott Small, Roger Springett, and Kamil Uludag. This work was supported by NIH grant NS-036722.
References
Abounader, R., and Hamel, E. (1997). Associations between neuropeptide Y nerve terminals and intraparenchymal microvessels in rat and human cerebral cortex. J. Comp. Neurol. 388, 444–453.
Ances, B. M., Buerk, D. G., Greenberg, J. H., and Detre, J. A. (2001). Temporal dynamics of the partial pressure of brain tissue oxygen during functional forepaw stimulation in rats. Neurosci. Lett. 306, 106–110.
Ances, B. M., Leontiev, O., Perthen, J. E., Liang, C., Lansing, A. E., and Buxton, R. B. (2008). Regional differences in the coupling of cerebral blood flow and oxygen metabolism changes in response to activation: implications for BOLD-fMRI. Neuroimage 39, 1510–1521.
Ances, B. M., Liang, C. L., Leontiev, O., Perthen, J. E., Fleisher, A. S., Lansing, A. E., and Buxton, R. B. (2009). Effects of aging on cerebral blood flow, oxygen metabolism, and blood oxygenation level dependent responses to visual stimulation. Hum. Brain Mapp. 30, 1120–1132.
Arai, T., Mori, K., Nakao, S., Watanabe, K., Kito, K., Aoki, M., Mori, H., Morikawa, S., and Inubushi, T. (1991). In vivo oxygen-17 nuclear magnetic resonance for the estimation of cerebral blood flow and oxygen consumption. Biochem. Biophys. Res. Commun. 179, 954–961.
Arai, T., Nakao, S., Mori, K., Ishimori, K., Morishima, I., Miyazawa, T., and Fritz-Zieroth, B. (1990). Cerebral oxygen utilization analyzed by the use of oxygen-17 and its nuclear magnetic resonance. Biochem. Biophys. Res. Commun. 169, 153–158.
Attwell, D., and Iadecola, C. (2002). The neural basis of functional brain imaging signals. Trends Neurosci. 25, 621–625.
Attwell, D., and Laughlin, S. B. (2001). An energy budget for signaling in the grey matter of the brain. J. Cereb. Blood Flow Metab. 21, 1133–1145.
Blanco, V. M., Stern, J. E., and Filosa, J. A. (2008). Tone-dependent vascular responses to astrocyte-derived signals. Am. J. Physiol. Heart Circ. Physiol. 294, H2855–H2863.
Boas, D. A., Jones, S. R., Devor, A., Huppert, T. J., and Dale, A. M. (2008). A vascular anatomical network model of the spatio-temporal response to brain activation. Neuroimage 40, 1116–1129.
Boxerman, J. L., Bandettini, P. A., Kwong, K. K., Baker, J. R., Davis, T. L., Rosen, B. R., and Weisskoff, R. M. (1995a). The intravascular contribution to fMRI signal change: Monte Carlo modeling and diffusion-weighted studies in vivo. Magn. Reson. Med. 34, 4–10.
Boxerman, J. L., Hamberg, L. M., Rosen, B. R., and Weisskoff, R. M. (1995b). MR contrast due to intravascular magnetic susceptibility perturbations. Magn. Reson. Med. 34, 555–566.
Brown, G. G., Eyler Zorrilla, L. T., Georgy, B., Kindermann, S. S., Wong, E. C., and Buxton, R. B. (2003). BOLD and perfusion response to finger-thumb apposition after acetazolamide administration: differential relationship to global perfusion. J. Cereb. Blood Flow Metab. 23, 829–837.
Buerk, D. G., Ances, B. M., Greenberg, J. H., and Detre, J. A. (2003). Temporal dynamics of brain tissue nitric oxide during functional forepaw stimulation in rats. Neuroimage 18, 1–9.
Buxton, R. B. (2005). Quantifying CBF with arterial spin labeling. J. Magn. Reson. Imaging 22, 723–726.
Buxton, R. B. (2009). Introduction to Functional Magnetic Resonance Imaging: Principles and Techniques. Cambridge: Cambridge University Press.
Buxton, R. B., and Frank, L. R. (1997). A model for the coupling between cerebral blood flow and oxygen metabolism during neural stimulation. J. Cereb. Blood Flow Metab. 17, 64–72.
Buxton, R. B., Uludag, K., Dubowitz, D. J., and Liu, T. T. (2004). Modeling the hemodynamic response to brain activation. Neuroimage 23(Suppl. 1), S220–S233.
Buxton, R. B., Wong, E. C., and Frank, L. R. (1998). Dynamics of blood flow and oxygenation changes during brain activation: the balloon model. Magn. Reson. Med. 39, 855–864.
Caesar, K., Offenhauser, N., and Lauritzen, M. (2008). Gamma-aminobutyric acid modulates local brain oxygen consumption and blood flow in rat cerebellar cortex. J. Cereb. Blood Flow Metab. 28, 906–915.
Chen, J. J., and Pike, G. B. (2009a). BOLD-specific cerebral blood volume and blood flow changes during neuronal activation in humans. NMR Biomed. 22, 1054–1062.
Chen, J. J., and Pike, G. B. (2009b). Origins of the BOLD post-stimulus undershoot. Neuroimage 46, 559–568.
Chiarelli, P. A., Bulte, D. P., Gallichan, D., Piechnik, S. K., Wise, R., and Jezzard, P. (2007a). Flow-metabolism coupling in human visual, motor, and supplementary motor areas assessed by magnetic resonance imaging. Magn. Reson. Med. 57, 538–547.
Chiarelli, P. A., Bulte, D. P., Piechnik, S., and Jezzard, P. (2007b). Sources of systematic bias in hypercapnia-calibrated functional MRI estimation of oxygen metabolism. Neuroimage 34, 35–43.
Cholet, N., Seylaz, J., Lacombe, P., and Bonvento, G. (1997). Local uncoupling of the cerebrovascular and metabolic responses to somatosensory stimulation after neuronal nitric oxide synthase inhibition. J. Cereb. Blood Flow Metab. 17, 1191–1201.
Chugani, H. T., Phelps, M. E., and Mazziotta, J. C. (1987). Positron emission tomography study of human brain functional development. Ann. Neurol. 22, 487–497.
Davis, T. L., Kwong, K. K., Weisskoff, R. M., and Rosen, B. R. (1998). Calibrated functional MRI: mapping the dynamics of oxidative metabolism. Proc. Natl. Acad. Sci. U.S.A. 95, 1834–1839.
Detre, J. A., Leigh, J. S., WIlliams, D. S., and Koretsky, A. P. (1992). Perfusion imaging. Magn. Reson. Med. 23, 37–45.
Devor, A., Dunn, A. K., Andermann, M. L., Ulbert, I., Boas, D. A., and Dale, A. M. (2003). Coupling of total hemoglobin concentration, oxygenation, and neural activity in rat somatosensory cortex. Neuron 39, 353–359.
Devor, A., Hillman, E. M., Tian, P., Waeber, C., Teng, I. C., Ruvinskaya, L., Shalinsky, M. H., Zhu, H., Haslinger, R. H., Narayanan, S. N., Ulbert, I., Dunn, A. K., Lo, E. H., Rosen, B. R., Dale, A. M., Kleinfeld, D., and Boas, D. A. (2008). Stimulus-induced changes in blood flow and 2-deoxyglucose uptake dissociate in ipsilateral somatosensory cortex. J. Neurosci. 28, 14347–14357.
Dirnagl, U., Niwa, K., Lindauer, U., and Villringer, A. (1994). Coupling of cerebral blood flow to neuronal activation: role of adenosine and nitric oxide. Am. J. Physiol. 267, H296–H301.
Donahue, M. J., Hua, J., Pekar, J. J., and van Zijl, P. C. (2009). Effect of inflow of fresh blood on vascular-space- occupancy (VASO) contrast. Magn. Reson. Med. 61, 473–480.
Donahue, M. J., Lu, H., Jones, C. K., Edden, R. A., Pekar, J. J., and van Zijl, P. C. (2006). Theoretical and experimental investigation of the VASO contrast mechanism. Magn. Reson. Med. 56, 1261–1273.
Dunn, A. K., Devor, A., Dale, A. M., and Boas, D. A. (2005). Spatial extent of oxygen metabolism and hemodynamic changes during functional activation of the rat somatosensory cortex. Neuroimage 27, 279–290.
Erecinska, M., and Silver, I. A. (2001). Tissue oxygen tension and brain sensitivity to hypoxia. Respir. Physiol. 128, 263–276.
Estrada, C., and DeFelipe, J. (1998). Nitric oxide-producing neurons in the neocortex: morphological and functional relationship with intraparenchymal microvasculature. Cereb. Cortex 8, 193–203.
Fang, Q., Sakadzic, S., Ruvinskaya, L., Devor, A., Dale, A. M., and Boas, D. A. (2008). Oxygen advection and diffusion in a three-dimensional vascular anatomical network. Opt. Express 16, 17530–17541.
Fiat, D., and Kang, S. (1992). Determination of the rate of cerebral oxygen consumption and regional cerebral blood flow by non-invasive 17O in vivo NMR spectroscopy and magnetic resonance imaging: Part 1. Theory and data analysis methods. Neurol. Res. 14, 303–311.
Fiat, D., and Kang, S. (1993). Determination of the rate of cerebral oxygen consumption and regional cerebral blood flow by non-invasive 17O in vivo NMR spectroscopy and magnetic resonance imaging. Part 2. Determination of CMRO2 for the rat by 17O NMR, and CMRO2, rCBF and the partition coefficient for the cat by 17O MRI. Neurol. Res. 15, 7–22.
Fleisher, A. S., Podraza, K. M., Bangen, K. J., Taylor, C., Sherzai, A., Sidhar, K., Liu, T. T., Dale, A. M., and Buxton, R. B. (2009). Cerebral perfusion and oxygenation differences in Alzheimer’s disease risk. Neurobiol. Aging 30, 1737–1748.
Fox, P. T., and Raichle, M. E. (1986). Focal physiological uncoupling of cerebral blood flow and oxidative metabolism during somatosensory stimulation in human subjects. Proc. Natl. Acad. Sci. U.S.A. 83, 1140–1144.
Fox, P. T., Raichle, M. E., Mintun, M. A., and Dence, C. (1988). Nonoxidative glucose consumption during focal physiologic neural activity. Science 241, 462–464.
Frahm, J., Baudewig, J., Kallenberg, K., Kastrup, A., Merboldt, K. D., and Dechent, P. (2008). The post- stimulation undershoot in BOLD fMRI of human brain is not caused by elevated cerebral blood volume. Neuroimage 40, 473–481.
Frahm, J., Krüger, G., Merboldt, K.-D., and Kleinschmidt, A. (1996). Dynamic uncoupling and recoupling of perfusion and oxidative metabolism during focal activation in man. Magn. Reson. Med. 35, 143–148.
Fujita, N., Matsumoto, K., Tanaka, H., Watanabe, Y., and Murase, K. (2006). Quantitative study of changes in oxidative metabolism during visual stimulation using absolute relaxation rates. NMR. Biomed. 19, 60–68.
Gjedde, A. (2005a). The pathways of oxygen in brain. I. Delivery and metabolism of oxygen. Adv. Exp. Med. Biol. 566, 269–275.
Gjedde, A. (2005b). The pathways of oxygen in brain. II. Competitions for cytochrome c oxidase and NOS are keys to flow-metabolism coupling. Adv. Exp. Med. Biol. 566, 277–283.
Gjedde, A., Ohta, S., Kuwabara, H., and Meyer, E. (1991). “Is oxygen diffusion limiting for blood-brain transfer of oxygen?,” in Brain Work and Mental Activity, eds N. A. Lassen, D. H. Ingvar, M. E. Raichle, and L. Friberg (Copenhagen: Munksgaard), 177–184.
Gnaiger, E., Lassnig, B., Kuznetsov, A., Rieger, G., and Margreiter, R. (1998). Mitochondrial oxygen affinity, respiratory flux control and excess capacity of cytochrome c oxidase. J. Exp. Biol. 201, 1129–1139.
Grant, P. E., Roche-Labarbe, N., Surova, A., Themelis, G., Selb, J., Warren, E. K., Krishnamoorthy, K. S., Boas, D. A., and Franceschini, M. A. (2009). Increased cerebral blood volume and oxygen consumption in neonatal brain injury. J. Cereb. Blood Flow Metab. 29, 1704–1713.
Grubb, R. L. Jr., Raichle, M. E., Eichling, J. O., and Ter-Pogossian, M. M. (1974). The effects of changes in PaCO2 on cerebral blood volume, blood flow, and vascular mean transit time. Stroke 5, 630–639.
Gruetter, R., Ugurbil, K., and Seaquist, E. R. (1998). Steady-state cerebral glucose concentrations and transport in the human brain. J. Neurochem. 70, 397–408.
Gusnard, D. A., and Raichle, M. E. (2001). Searching for a baseline: functional imaging and the resting human brain. Nat. Rev. Neurosci. 2, 685–694.
Hamel, E. (2006). Perivascular nerves and the regulation of cerebrovascular tone. J. Appl. Physiol. 100, 1059–1064.
Haydon, P. G., and Carmignoto, G. (2006). Astrocyte control of synaptic transmission and neurovascular coupling. Physiol. Rev. 86, 1009–1031.
He, X., and Yablonskiy, D. A. (2007). Quantitative BOLD: mapping of human cerebral deoxygenated blood volume and oxygen extraction fraction: default state. Magn. Reson. Med. 57, 115–126.
He, X., Zhu, M., and Yablonskiy, D. A. (2008). Validation of oxygen extraction fraction measurement by qBOLD technique. Magn. Reson. Med. 60, 882–888.
Herman, P., Sanganahalli, B. G., Blumenfeld, H., and Hyder, F. (2009). Cerebral oxygen demand for short-lived and steady-state events. J. Neurochem. 109(Suppl. 1), 73–79.
Hillman, E. M., Devor, A., Bouchard, M. B., Dunn, A. K., Krauss, G. W., Skoch, J., Bacskai, B. J., Dale, A. M., and Boas, D. A. (2007). Depth-resolved optical imaging and microscopy of vascular compartment dynamics during somatosensory stimulation. Neuroimage 35, 89–104.
Hochachka, P. W., Buck, L. T., Doll, C. J., and Land, S. C. (1996). Unifying theory of hypoxia tolerance: molecular/metabolic defense and rescue mechanisms for surviving oxygen lack. Proc. Natl. Acad. Sci. U.S.A. 93, 9493–9498.
Hoge, R. D., Atkinson, J., Gill, B., Crelier, G. R., Marrett, S., and Pike, G. B. (1999). Linear coupling between cerebral blood flow and oxygen consumption in activated human cortex. Proc. Natl. Acad. Sci. U.S.A. 96, 9403–9408.
Huppert, T. J., Allen, M. S., Benav, H., Jones, P. B., and Boas, D. A. (2007). A multicompartment vascular model for inferring baseline and functional changes in cerebral oxygen metabolism and arterial dilation. J. Cereb. Blood Flow Metab. 27, 1262–1279.
Huppert, T. J., Allen, M. S., Diamond, S. G., and Boas, D. A. (2009). Estimating cerebral oxygen metabolism from fMRI with a dynamic multicompartment Windkessel model. Hum. Brain Mapp. 30, 1548–1567.
Iadecola, C., and Nedergaard, M. (2007). Glial regulation of the cerebral microvasculature. Nat. Neurosci. 10, 1369–1376.
Ibaraki, M., Shimosegawa, E., Miura, S., Takahashi, K., Ito, H., Kanno, I., and Hatazawa, J. (2004). PET measurements of CBF, OEF, and CMRO2 without arterial sampling in hyperacute ischemic stroke: method and error analysis. Ann. Nucl. Med. 18, 35–44.
Ito, H., Ibaraki, M., Kanno, I., Fukuda, H., and Miura, S. (2005). Changes in cerebral blood flow and cerebral oxygen metabolism during neural activation measured by positron emission tomography: comparison with blood oxygenation level-dependent contrast measured by functional magnetic resonance imaging. J. Cereb. Blood Flow Metab. 25, 371–377.
Ito, H., Kanno, I., Kato, C., Sasaki, T., Ishii, K., Ouchi, Y., Iida, A., Okazawa, H., Hayashida, K., Tsuyuguchi, N., Ishii, K., Kuwabara, Y., and Senda, M. (2004). Database of normal human cerebral blood flow, cerebral blood volume, cerebral oxygen extraction fraction and cerebral metabolic rate of oxygen measured by positron emission tomography with 15O-labelled carbon dioxide or water, carbon monoxide and oxygen: a multicentre study in Japan. Eur. J. Nucl. Med. Mol. Imaging 31, 635–643.
Kastrup, A., Kruger, G., Neumann-Haefelin, T., Glover, G. H., and Moseley, M. E. (2002). Changes of cerebral blood flow, oxygenation, and oxidative metabolism during graded motor activation. Neuroimage 15, 74–82.
Kim, S. G., Rostrup, E., Larsson, H. B. W., Ogawa, S., and Paulson, O. B. (1999). Determination of relative CMRO2 from CBF and BOLD changes: significant increase of oxygen consumption rate during visual stimulation. Magn. Reson. Med. 41, 1152–1161.
Kim, T., Hendrich, K. S., Masamoto, K., and Kim, S. G. (2007). Arterial versus total blood volume changes during neural activity-induced cerebral blood flow change: implication for BOLD fMRI. J. Cereb. Blood Flow Metab. 27, 1235–1247.
Kim, T., and Kim, S. G. (2006). Quantification of cerebral arterial blood volume using arterial spin labeling with intravoxel incoherent motion-sensitive gradients. Magn. Reson. Med. 55, 1047–1057.
Koehler, R. C., Roman, R. J., and Harder, D. R. (2009). Astrocytes and the regulation of cerebral blood flow. Trends Neurosci. 32, 160–169.
Kudomi, N., Hayashi, T., Watabe, H., Teramoto, N., Piao, R., Ose, T., Koshino, K., Ohta, Y., and Iida, H. (2009). A physiologic model for recirculation water correction in CMRO2 assessment with 15O2 inhalation PET. J. Cereb. Blood Flow Metab. 29, 355–364.
Kudomi, N., Watabe, H., Hayashi, T., and Iida, H. (2007). Separation of input function for rapid measurement of quantitative CMRO2 and CBF in a single PET scan with a dual tracer administration method. Phys. Med. Biol. 52, 1893–1908.
Kuwabara, H., Ohta, S., Brust, P., Meyer, E., and Gjedde, A. (1992). Density of perfused capillaries in living human brain during functional activation. Prog. Brain Res. 91, 209–215.
Kwong, K. K., Belliveau, J. W., Chesler, D.A., Goldberg, I. E., Weisskoff, R.M.,Poncelet, B. P., Kennedy, D. N., Hoppel, B. E., Cohen, M. S., Turner, R., Cheng, H. -M., Brady, T. J., and Rosen, B. R. (1992). Dynamic magnetic resonance imaging of human brain activity during primary sensory stimulation. Proc. Natl. Acad. Sci. U.S.A. 89, 5675–5679.
Leontiev, O., and Buxton, R. B. (2007). Reproducibility of BOLD, perfusion, and CMRO(2) measurements with calibrated-BOLD fMRI. Neuroimage 35, 175–184.
Leontiev, O., Dubowitz, D. J., and Buxton, R. B. (2007). CBF/CMRO2 coupling measured with calibrated BOLD fMRI: sources of bias. Neuroimage 36, 1110–1122.
Lin, A. L., Fox, P. T., Yang, Y., Lu, H., Tan, L. H., and Gao, J. H. (2008). Evaluation of MRI models in the measurement of CMRO2 and its relationship with CBF. Magn. Reson. Med. 60, 380–389.
Lin, A. L., Fox, P. T., Yang, Y., Lu, H., Tan, L. H., and Gao, J. H. (2009). Time-dependent correlation of cerebral blood flow with oxygen metabolism in activated human visual cortex as measured by fMRI. Neuroimage 44, 16–22.
Lu, H., and Ge, Y. (2008). Quantitative evaluation of oxygenation in venous vessels using T2-Relaxation-Under-Spin-Tagging MRI. Magn. Reson. Med. 60, 357–363.
Lu, H., Golay, X., Pekar, J. J., and Van Zijl, P. C. (2003). Functional magnetic resonance imaging based on changes in vascular space occupancy. Magn. Reson. Med. 50, 263–274.
Lu, H., Golay, X., Pekar, J. J., and Van Zijl, P. C. (2004). Sustained poststimulus elevation in cerebral oxygen utilization after vascular recovery. J. Cereb. Blood Flow Metab. 24, 764–770.
Lu, H., Yezhuvath, U. S., and Xiao, G. (2010). Improving fMRI sensitivity by normalization of basal physiologic state. Hum. Brain Mapp. 31, 80–87.
Malonek, D., and Grinvald, A. (1996). Interactions between electrical activity and cortical microcirculation revealed by imaging spectroscopy: implications for functional brain mapping. Science 272, 551–554.
Mandeville, J. B., Marota, J. J. A., Ayata, C., Zaharchuk, G., Moskowitz, M. A., Rosen, B. R., and Weisskoff, R. M. (1999). Evidence of a cerebrovascular post-arteriole Windkessel with delayed compliance. J. Cereb. Blood Flow Metab. 19, 679–689.
Mandeville, J. B., Marota, J. J. A., Kosofsky, B. E., Keltner, J. R., Weissleder, R., Rosen, B. R., and Weisskoff, R. M. (1998). Dynamic functional imaging of relative cerebral blood volume during rat forepaw stimulation. Magn. Reson. Med. 39, 615–624.
Marrett, S., and Gjedde, A. (1997). Changes of blood flow and oxygen consumption in visual cortex of living humans. Adv. Exp. Med. Biol. 413, 205–208.
Massabuau, J. C. (2003). Primitive, and protective, our cellular oxygenation status? Mech. Ageing Dev. 124, 857–863.
Mellon, E. A., Beesam, R. S., Baumgardner, J. E., Borthakur, A., Witschey, W. R. II, and Reddy, R. (2009). Estimation of the regional cerebral metabolic rate of oxygen consumption with proton detected 17O MRI during precision 17O2 inhalation in swine. J. Neurosci. Methods 179, 29–39.
Miller, K. L., Luh, W. M., Liu, T. T., Martinez, A., Obata, T., Wong, E. C., Frank, L. R., and Buxton, R. B. (2001). Nonlinear temporal dynamics of the cerebral blood flow response. Hum. Brain Mapp. 13, 1–12.
Mintun, M. A., Lundstrom, B. N., Snyder, A. Z., Vlassenko, A. G., Shulman, G. L., and Raichle, M. E. (2001). Blood flow and oxygen delivery to human brain during functional activity: theoretical modeling and experimental data. Proc. Natl. Acad. Sci. U.S.A. 98, 6859–6864.
Mintun, M. A., Raichle, M. E., Martin, W. R. W., and Herscovitch, P. (1984). Brain oxygen utilization measured with O-15 radiotracers and positron emission tomography. J. Nucl. Med. 25, 177–187.
Mintun, M. A., Vlassenko, A. G., Shulman, G. L., and Snyder, A. Z. (2002). Time-related increase of oxygen utilization in continuously activated human visual cortex. Neuroimage 16, 531–537.
Mulligan, S. J., and MacVicar, B. A. (2004). Calcium transients in astrocyte endfeet cause cerebrovascular constrictions. Nature 431, 195–199.
Ndubuizu, O., and LaManna, J. C. (2007). Brain tissue oxygen concentration measurements. Antioxid. Redox Signal. 9, 1207–1219.
Obata, T., Liu, T. T., Miller, K. L., Luh, W. M., Wong, E. C., Frank, L. R., and Buxton, R. B. (2004). Discrepancies between BOLD and flow dynamics in primary and supplementary motor areas: application of the balloon model to the interpretation of BOLD transients. Neuroimage 21, 144–153.
Offenhauser, N., Thomsen, K., Caesar, K., and Lauritzen, M. (2005). Activity-induced tissue oxygenation changes in rat cerebellar cortex: interplay of postsynaptic activation and blood flow. J. Physiol. 565, 279–294.
Ogawa, S., Menon, R. S., Tank, D. W., Kim, S.-G., Merkle, H., Ellerman, J. M., and Ugurbil, K. (1993). Functional brain mapping by blood oxygenation level-dependent contrast magnetic resonance imaging: a comparison of signal characteristics with a biophysical model. Biophys. J. 64, 803–812.
Ogawa, S., Tank, D. W., Menon, R., Ellermann, J. M., Kim, S.-G., Merkle, H., and Ugurbil, K. (1992). Intrinsic signal changes accompanying sensory stimulation: functional brain mapping with magnetic resonance imaging. Proc. Natl. Acad. Sci. U.S.A. 89, 5951–5955.
Ohta, S., Meyer, E., Thompson, C. J., and Gjedde, A. (1992). Oxygen consumption of the living human brain measured after a single inhalation of positron emitting oxygen. J. Cereb. Blood Flow Metab. 12, 179–192.
Pasley, B. N., Inglis, B. A., and Freeman, R. D. (2007). Analysis of oxygen metabolism implies a neural origin for the negative BOLD response in human visual cortex. Neuroimage 36, 269–276.
Paulson, O. B., Hasselbalch, S. G., Rostrup, E., Knudsen, G. M., and Pelligrino, D. (2010). Cerebral blood flow response to functional activation. J. Cereb. Blood Flow Metab. 30, 2–14.
Perthen, J. E., Lansing, A. E., Liau, J., Liu, T. T., and Buxton, R. B. (2008). Caffeine-induced uncoupling of cerebral blood flow and oxygen metabolism: a calibrated BOLD fMRI study. Neuroimage 40, 237–247.
Phelps, M. E., Kuhl, D. E., and Mazziotta, J. C. (1981). Metabolic mapping of the brain’s response to visual stimulation: studies in humans. Science 211, 1445–1448.
Piilgaard, H., and Lauritzen, M. (2009). Persistent increase in oxygen consumption and impaired neurovascular coupling after spreading depression in rat neocortex. J. Cereb. Blood Flow Metab. 29, 1517–1527.
Prichard, J., Rothman, D., Novotny, E., Petroff, O., Kuwabara, T., Avison, M., Howseman, A., Hanstock, C., and Shulman, R. (1991). Lactate rise detected by 1H NMR in human visual cortex during physiologic stimulation. Proc. Natl. Acad. Sci. U.S.A. 88, 5829–5831.
Restom, K., Perthen, J. E., and Liu, T. T. (2008). Calibrated fMRI in the medial temporal lobe during a memory-encoding task. Neuroimage 40, 1495–1502.
Roche-Labarbe, N., Carp, S. A., Surova, A., Patel, M., Boas, D. A., Grant, P. E., and Franceschini, M. A. (2010). Noninvasive optical measures of CBV, StO(2), CBF index, and rCMRO(2) in human premature neonates’ brains in the first six weeks of life. Hum. Brain Mapp. 31, 341–352.
Ronen, I., Lee, J. H., Merkle, H., Ugurbil, K., and Navon, G. (1997). Imaging H2(17)O distribution in a phantom and measurement of metabolically produced H2(17)O in live mice by proton NMR. NMR Biomed. 10, 333–340.
Ronen, I., Merkle, H., Ugurbil, K., and Navon, G. (1998). Imaging of H217O distribution in the brain of a live rat by using proton-detected 17O MRI. Proc. Natl. Acad. Sci. U.S.A. 95, 12934–12939.
Ronen, I., and Navon, G. (1994). A new method for proton detection of H2(17)O with potential applications for functional MRI. Magn. Reson. Med. 32, 789–793.
Rostrup, E., Knudsen, G. M., Law, I., Holm, S., Larsson, H. B., and Paulson, O. B. (2005). The relationship between cerebral blood flow and volume in humans. Neuroimage 24, 1–11.
Sadaghiani, S., Ugurbil, K., and Uludag, K. (2009). Neural activity-induced modulation of BOLD poststimulus undershoot independent of the positive signal. Magn. Reson. Imaging 27, 1030–1038.
Semenza, G. L. (2009). Regulation of oxygen homeostasis by hypoxia-inducible factor 1. Physiology (Bethesda) 24, 97–106.
Shmuel, A., Yacoub, E., Pfeuffer, J., Van de Moortele, P. F., Adriany, G., Hu, X., and Ugurbil, K. (2002). Sustained negative BOLD, blood flow and oxygen consumption response and its coupling to the positive response in the human brain. Neuron 36, 1195–1210.
Sicard, K. M., and Duong, T. Q. (2005). Effects of hypoxia, hyperoxia, and hypercapnia on baseline and stimulus-evoked BOLD, CBF, and CMRO2 in spontaneously breathing animals. Neuroimage 25, 850–858.
Sokoloff, L., Reivich, M., Kennedy, C., Rosiers, M. H. D., Patlak, C. S., Pettigrew, K. D., Sakurada, O., and Shinohara, M. (1977). The [14-C]deoxyglucose method for the measurement of local cerebral glucose utilization: theory, procedure, and normal values in the conscious and anesthetized albino rat. J. Neurochem. 28, 897–916.
Stefanovic, B., Warnking, J. M., Kobayashi, E., Bagshaw, A. P., Hawco, C., Dubeau, F., Gotman, J., and Pike, G. B. (2005). Hemodynamic and metabolic responses to activation, deactivation and epileptic discharges. Neuroimage 28, 205–215.
Stefanovic, B., Warnking, J. M., and Pike, G. B. (2004). Hemodynamic and metabolic responses to neuronal inhibition. Neuroimage 22, 771–778.
St Lawrence, K. S., Ye, F. Q., Lewis, B. K., Frank, J. A., and McLaughlin, A. C. (2003). Measuring the effects of indomethacin on changes in cerebral oxidative metabolism and cerebral blood flow during sensorimotor activation. Magn. Reson. Med. 50, 99–106.
Thompson, J. K., Peterson, M. R., and Freeman, R. D. (2003). Single-neuron activity and tissue oxygenation in the cerebral cortex. Science 299, 1070–1072.
Thompson, J. K., Peterson, M. R., and Freeman, R. D. (2004). High-resolution neurometabolic coupling revealed by focal activation of visual neurons. Nat. Neurosci. 7, 919–920.
Thompson, J. K., Peterson, M. R., and Freeman, R. D. (2005). Separate spatial scales determine neural activity-dependent changes in tissue oxygen within central visual pathways. J. Neurosci. 25, 9046–9058.
Thomsen, K., Piilgaard, H., Gjedde, A., Bonvento, G., and Lauritzen, M. (2009). Principal cell spiking, postsynaptic excitation, and oxygen consumption in the rat cerebellar cortex. J. Neurophysiol. 102, 1503–1512.
Uludag, K., and Buxton, R. B. (2004). Measuring the effects of indomethacin on changes in cerebral oxidative metabolism and cerebral blood flow during sensorimotor activation. Magn. Reson. Med. 51, 1088–1089; author reply 1090.
Uludag, K., Dubowitz, D. J., Yoder, E. J., Restom, K., Liu, T. T., and Buxton, R. B. (2004). Coupling of cerebral blood flow and oxygen consumption during physiological activation and deactivation measured with fMRI. Neuroimage 23, 148–155.
Uludag, K., Muller-Bierl, B., and Ugurbil, K. (2009). An integrative model for neuronal activity-induced signal changes for gradient and spin echo functional imaging. Neuroimage 48, 150–165.
Vafaee, M. S., and Gjedde, A. (2000). Model of blood-brain transfer of oxygen explains nonlinear flow-metabolism coupling during stimulation of visual cortex. J. Cereb. Blood Flow Metab. 20, 747–754.
Vafaee, M. S., Meyer, E., Marrett, S., Paus, T., Evans, A. C., and Gjedde, A. (1999). Frequency-dependent changes in cerebral metabolic rate of oxygen during activation of human visual cortex. J. Cereb. Blood Flow Metab. 19, 272–277.
Valabregue, R., Aubert, A., Burger, J., Bittoun, J., and Costalat, R. (2003). Relation between cerebral blood flow and metabolism explained by a model of oxygen exchange. J. Cereb. Blood Flow Metab. 23, 536–545.
Vanderkooi, J. M., Erecinska, M., and Silver, I. A. (1991). Oxygen in mammalian tissue: methods of measurement and affinities of various reactions. Am. J. Physiol. 260, C1131–C1150.
Wilson, D. F., Erecinska, M., Drown, C., and Silver, I. A. (1979). The oxygen dependence of cellular energy metabolism. Arch. Biochem. Biophys. 195, 485–493.
Wong, E. C., Buxton, R. B., and Frank, L. R. (1997). Implementation of quantitative perfusion imaging techniques for functional brain mapping using pulsed arterial spin labeling. NMR Biomed. 10, 237–249.
Xu, F., Ge, Y., and Lu, H. (2009). Noninvasive quantification of whole-brain cerebral metabolic rate of oxygen (CMRO(2)) by MRI. Magn. Reson. Med. 62, 141–148.
Yablonskiy, D. A., Ackerman, J. J., and Raichle, M. E. (2000). Coupling between changes in human brain temperature and oxidative metabolism during prolonged visual stimulation. Proc. Natl. Acad. Sci. U.S.A. 97, 7603–7608.
Yablonskiy, D. A., and Haacke, E. M. (1994). Theory of NMR signal behavior in magnetically inhomogeneous tissues: the static dephasing regime. Magn. Reson. Med. 32, 749–763.
Yacoub, E., Ugurbil, K., and Harel, N. (2006). The spatial dependence of the poststimulus undershoot as revealed by high-resolution BOLD- and CBV-weighted fMRI. J. Cereb. Blood Flow Metab. 26, 634–644.
Yucel, M. A., Devor, A., Akin, A., and Boas, D. A. (2009). The possible role of CO2 in producing a post- stimulus CBF and BOLD undershoot. Front Neuroenerg. 1:7. doi: 10.3389/neuro.14.007.2009.
Zappe, A. C., Uludag, K., Oeltermann, A., Ugurbil, K., and Logothetis, N. K. (2008). The influence of moderate hypercapnia on neural activity in the anesthetized nonhuman primate. Cereb. Cortex 18, 2666–2673.
Zhang, N., Zhu, X. H., Lei, H., Ugurbil, K., and Chen, W. (2004). Simplified methods for calculating cerebral metabolic rate of oxygen based on 17O magnetic resonance spectroscopic imaging measurement during a short 17O2 inhalation. J. Cereb. Blood Flow Metab. 24, 840–848.
Zhao, F., Jin, T., Wang, P., and Kim, S. G. (2007). Improved spatial localization of post-stimulus BOLD undershoot relative to positive BOLD. Neuroimage 34, 1084–1092.
Zheng, Y., Pan, Y., Harris, S., Billings, S., Coca, D., Berwick, J., Jones, M., Kennerley, A., Johnston, D., Martin, C., Devonshire, I. M., and Mayhew, J. (2010). A dynamic model of neurovascular coupling: Implications for blood vessel dilation and constriction. Neuroimage. (in press).
Zhu, X. H., Zhang, N., Zhang, Y., Zhang, X., Ugurbil, K., and Chen, W. (2005). In vivo 17O NMR approaches for brain study at high field. NMR Biomed. 18, 83–103.
Zhu, X. H., Zhang, X., Zhang, N., Zhang, Y., Strupp, J., Ugurbil, K., and Chen, W. (2006). “High-field 17O study of 3D CMRO2 imaging in human visual cortex,” in ISMRM 14th Annual Meeting, Seattle, p. 409.
Zhu, X. H., Zhang, Y., Tian, R. X., Lei, H., Zhang, N., Zhang, X., Merkle, H., Ugurbil, K., and Chen, W. (2002). Development of (17)O NMR approach for fast imaging of cerebral metabolic rate of oxygen in rat brain at high field. Proc. Natl. Acad. Sci. U.S.A. 99, 13194–13199.
Keywords: cerebral metabolic rate of oxygen, cerebral blood flow, functional magnetic resonance imaging, blood oxygenation level dependent, tissue oxygenation, positron emission tomography
Citation: Buxton RB (2010) Interpreting oxygenation-based neuroimaging signals: the importance and the challenge of understanding brain oxygen metabolism. Front. Neuroenerg. 2:8. doi: 10.3389/fnene.2010.00008
Received: 16 March 2010;
Paper pending published: 15 April 2010;
Accepted: 21 May 2010;
Published online: 17 June 2010
Edited by:
Anna Devor, University of California, San Diego, USAReviewed by:
Richard Hoge, Université de Montréal, CanadaDaniel Bulte, University of Oxford, UK
Peter Jezzard, University of Oxford, UK
Copyright: © 2010 Buxton. This is an open-access article subject to an exclusive license agreement between the authors and the Frontiers Research Foundation, which permits unrestricted use, distribution, and reproduction in any medium, provided the original authors and source are credited.
*Correspondence: Richard B. Buxton, Center for Functional Magnetic Resonance Imaging, Department of Radiology, University of California, San Diego, W. M. Keck Building, 9500 Gilman Drive, La Jolla, CA 92093-0677, USA. e-mail: rbuxton@ucsd.edu