1
Department of Electrical Engineering and Computer Science, University of California at Berkeley, Berkeley, CA, USA
2
Department of Electrical Engineering and Computer Science, University of Michigan, Ann Arbor, MI, USA
3
School of Life Sciences, Arizona State University, Tempe, AZ, USA
We demonstrated the remote control of insects in free flight via an implantable radio-equipped miniature neural stimulating system. The pronotum mounted system consisted of neural stimulators, muscular stimulators, a radio transceiver-equipped microcontroller and a microbattery. Flight initiation, cessation and elevation control were accomplished through neural stimulus of the brain which elicited, suppressed or modulated wing oscillation. Turns were triggered through the direct muscular stimulus of either of the basalar muscles. We characterized the response times, success rates, and free-flight trajectories elicited by our neural control systems in remotely controlled beetles. We believe this type of technology will open the door to in-flight perturbation and recording of insect flight responses.
Micro and nano air vehicles (MAVs/NAVs) – defined as aircraft with total mass <100 g and wingspans <15 cm (Shyy et al., 1999
; Sane, 2003
; Ansari et al., 2006
; Pines and Bohorquez, 2006
) – are the subject of intense research and development. Despite major advances, MAVs/NAVs still present significant trade-offs between payload mass, flight range, and speed. Currently, the principal limiting factors are the energy and power density of existing fuel sources and the complexity of flight dynamics in very small flyers. Insects have flight performance (as measured by distance and speed vs. payload and maneuverability) unmatched by man-made craft of similar size. Moreover, both the flight dynamics and the neurophysiology of insects are increasingly well understood (Burrows, 1996
; Tu and Dickinson, 1996
; Kloppenburg et al., 1997
; Dudley, 2000
; Josephson et al., 2000a
,b
; Taylor, 2001
; Ando et al., 2002
; Dickinson, 2006
; Budick et al., 2007
; Sane et al., 2007
).
In biology, the ability to control insect flight would be useful for studies of insect communication, mating behavior and flight energetics, and for studying the foraging behavior of insect predators such as birds, as has been done with terrestrial robots (Michelsen et al., 1989
). In engineering, electronically controllable insects could be useful models for insect-mimicking MAVs/NAVs (Wu et al., 2003
; Schenato et al., 2004
; Wood, 2008
). Furthermore, tetherless, electronically controllable insects themselves could be used as MAVs/NAVs and serve as couriers to locations not easily accessible to humans or terrestrial robots.
Flight control of insects ideally requires the triggering of flight initiation and cessation as well as the free-flight adjustment of orientation with three degrees of freedom (Taylor, 2001
). These flight parameters are controlled by insects via modulation of the wing movements using flight muscles. Insects exhibit two major categories of flight muscular control (Dudley, 2000
). Some insects, such as Odonata and Orthoptera, possess synchronous flight muscles which oscillate under direct flight control with one-to-one matches between neuronal stimulus episodes and wing muscle contractions. Other species (e.g., Hymenoptera, Diptera, Coleoptera), possess asynchronous flight muscles which oscillate under indirect control. In these species, motor neurons to the flight muscles fire at much lower frequencies than the wing oscillation frequencies, and neuronal output serves to turn flight on and off, and to modulate power, but not to directly control each flight muscle contraction (Josephson et al., 2000a
,b
; Dickinson, 2006
). We reasoned that the flight of insects with asynchronous flight muscle might therefore be easier and require less controller power than those with synchronous muscle since a control system would not need to directly and continually trigger the muscles required for each wing oscillation. Beetles (Coleoptera) include some of the largest of all insect species and thus have relatively high potential for load carriage; we chose Cotinis texana (ca. 2 cm, 1 g) and Mecynorrhina torquata (ca. 6 cm, 8 g) because they were large enough to carry the microsystem presented here, and could be easily reared in the lab (both species were capable of flying with an additional load of 20–30% body weight).
The specific neuronal pathways which control flight initiation and cessation have not been well-studied in beetles and are not perfectly understood in any insect. However, in both locusts and fruitflies there is evidence that visual, auditory or wind stimulus of receptors can lead to output from the brain that can initiate and modulate flight via giant fiber interneurons (Burrows, 1996
; Budick et al., 2007
). We chose to attempt to start, stop and modulate wing oscillations using direct electrical stimulus of the brain. Turns require asymmetric output from flight muscles (Tu and Dickinson, 1996
). We attempted control of turns by asymmetric electrical stimulus of the basalar muscles, one of the major indirect flight muscles of these beetles (Darwin and Pringle, 1959
; Josephson et al., 2000a
,b
).
Our initial experiments focused on the smaller Cotinis beetle using a system capable of tetherless control of beetles without wireless communication. We pre-programmed flight instructions using a microcontroller (Figure 1
A and Figure 1 in Supplementary Material; Texas Instruments, MSP430F2012IPWR, 63 mg, 5.0 mm × 4.5 mm × 1.0 mm) powered by a rechargeable lithium ion coin battery (Panasonic, ML614, 3.0 V, 160 mg, ∅6.8 mm × 1.4 mm, 3.4 mAh), mounted on the pronotum. We then began applying the stimulation patterns studied in Cotinis to the larger Mecynorrhina using a miniaturized radio frequency (RF) system capable of wireless communication and application of stimulation in free flight. This system used two CC2431 microcontrollers (6 mm × 6 mm, 130 mg, 2.4 GHz); one acting as the beetle-mounted RF receiver (Figure 1
B and Figure 2 in Supplementary Material) and one as computer-driven RF transmitter base station. The RF receiver was powered by a rechargeable lithium ion battery (Micro Avionics, 3.9 V, 350 mg, 8.5 mAh,). Electrical signals generated by either microcontroller drove steel wire electrodes (∅125 μm) implanted into the brain, optic lobes and basalar muscles (implant sites 1, 2 and 4 in Figure 1
, respectively). A common counter-electrode for the brain and basalar muscle stimuli was implanted into the posterior pronotum (implant site 3 in Figure 1
).
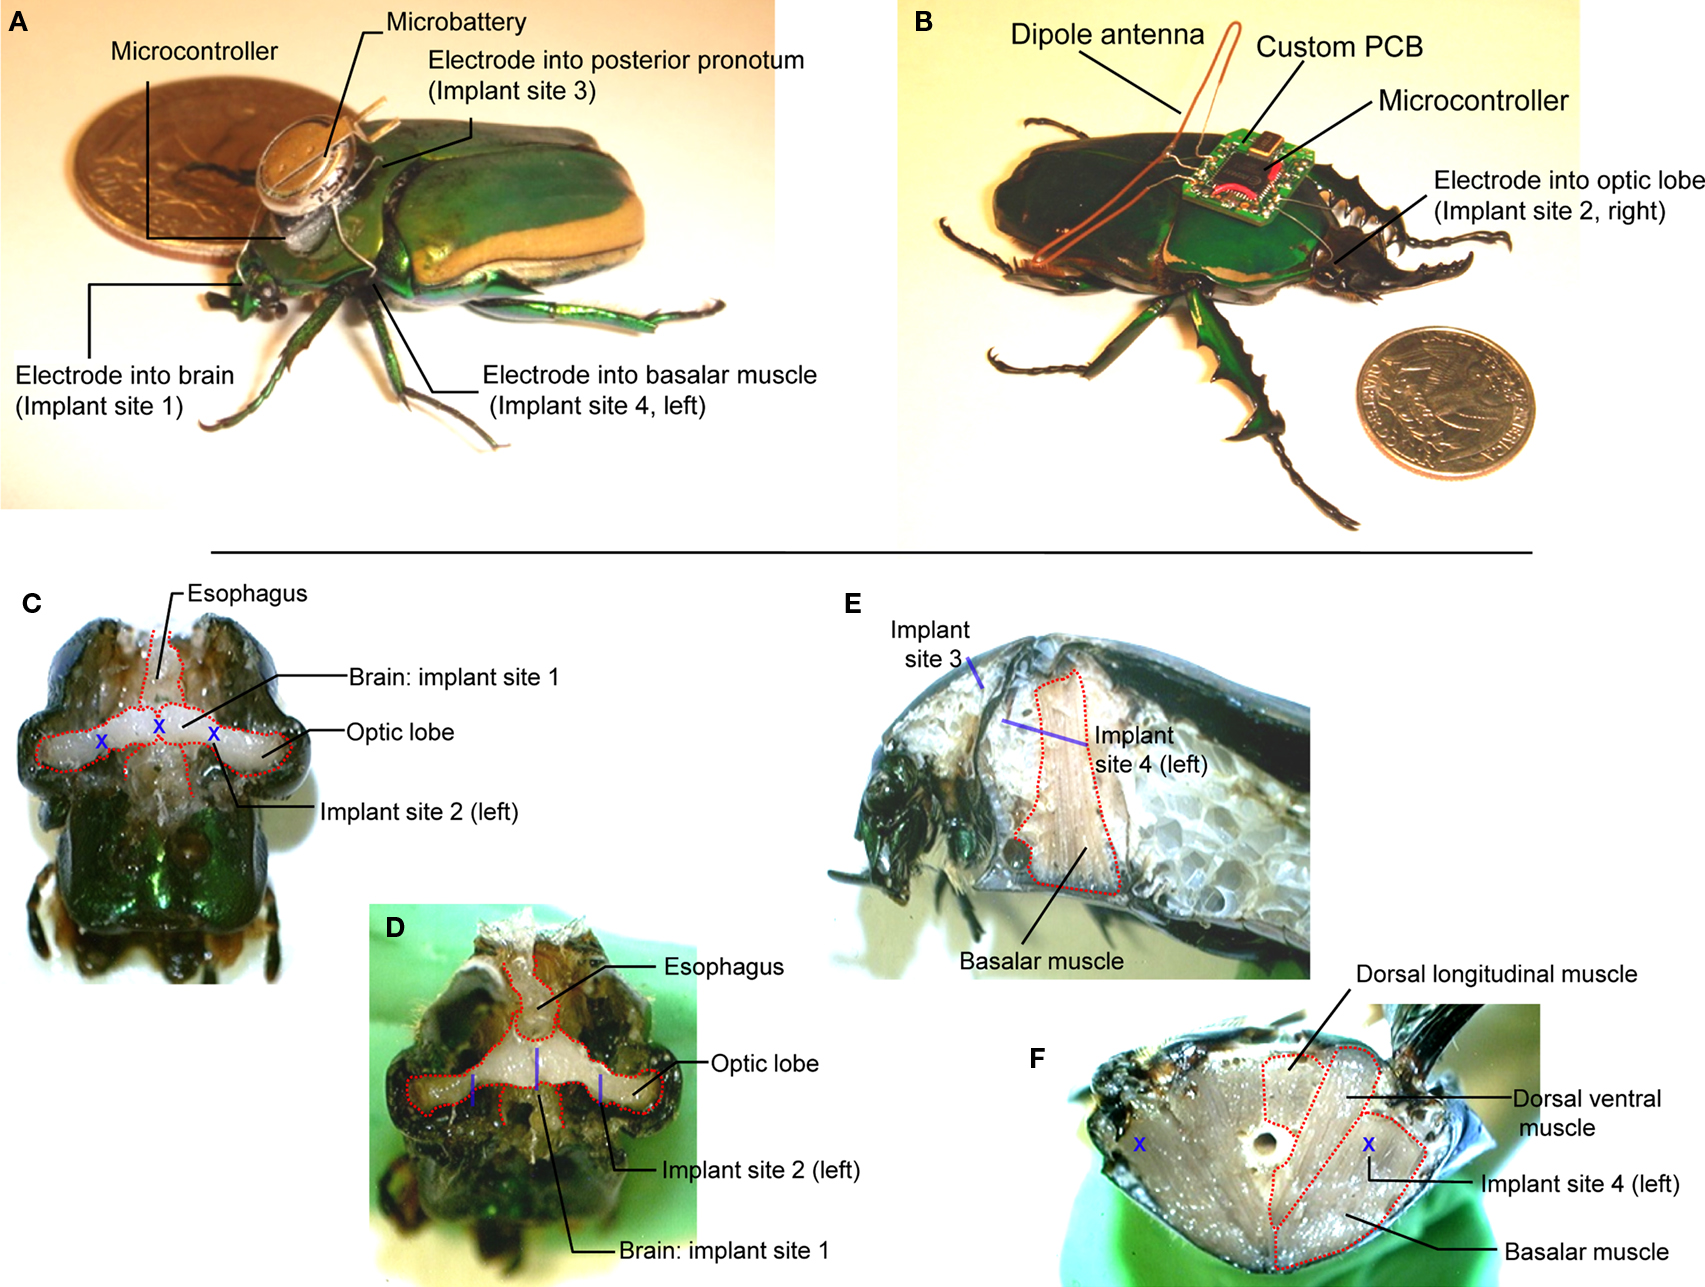
Figure 1. (A) Tetherless flight control system (∼230 mg total) mounted on Cotinis texana (Green June Beetle) using beeswax next to a US$ 0. 25 coin. A microcontroller provided potential pulses to four stimulating wire electrodes (∅125 μm) implanted into the brain, left and right basalar muscles and posterior pronotum (counter electrode). (B) Radio flight control system (∼1.3 g total) mounted on Mecynorrhina torquata using beeswax next to a US$ 0.25 coin. The system consisted of a microcontroller, a custom PCB, a dipole antenna, a microbattery and stimulating wire electrodes (∅125 μm) implanted as in Cotinis. (C) Front and (D) tilted views of dissected Cotinis beetle head showing the brain stimulator at implant site 1, optic lobe stimulator at implant site 2. The brain stimulator was implanted along the rostral–caudal midline of the head, at the center between the left and right compound eyes. Implant site 2 was at the interior edge of each compound eye. (E) Sagittal section of thorax showing the counter electrode at implant site 3 and the basalar muscle stimulator at implant site 4. (F) Cross-section of mesothorax showing the basalar muscle stimulator sites (implant site 4 on left and right sides). The basalar muscle stimulator was implanted midway between sternum and notum of mesothorax to a depth of approximately 1 cm in rostral–caudal direction on either the left or right side of the insect. The blue letters X and bars indicate implant sites and approximate implant lengths, respectively. Mecynorrhina torquata has nearly identical, scaled anatomy to Cotinis texana.
Flight Initiation and Cessation
In C. texana, alternating positive and negative potential pulses between an electrode implanted into the brain and a counter electrode implanted into the posterior pronotum of the adult insect reproducibly generated flight initiation and cessation with success rate of 56% (N = 9) in fully tethered and weakly tethered Cotinis beetles (see Section “Materials and Methods”); Figure 2
, Movie 1 (fully tethered) and Movie 2 (weakly tethered) in Supplementary Material. Flight initiation occurred either during or immediately after the negative potential pulse (following a positive pulse) was applied to the beetle brain (Table 1 in Supplementary Material, columns DN, AN, DP and AP). For each insect there was a voltage threshold for flight initiation (median 3.2 V). Below this voltage, legs stretched or contracted but flight did not start. Legs folded inwards during negative pulses and extended into the correct flight posture during positive pulses (Movie 3 in Supplementary Material, 1000 frames per second (fps) video), which suggests that positive pulses activate at least some of the complex motor patterns of flight initiation, while negative pulses activate an opposite set of muscles. In the weakly tethered and fully untethered conditions, some C. texana collapsed briefly when stimulated [Movie 2 (weakly tethered) Movie 4 (fully untethered) in Supplementary Material], which indicates that the stimulus caused not only muscle movement coordinated with wing oscillation but also uncoordinated muscle movement associated with generalized neural depolarization.
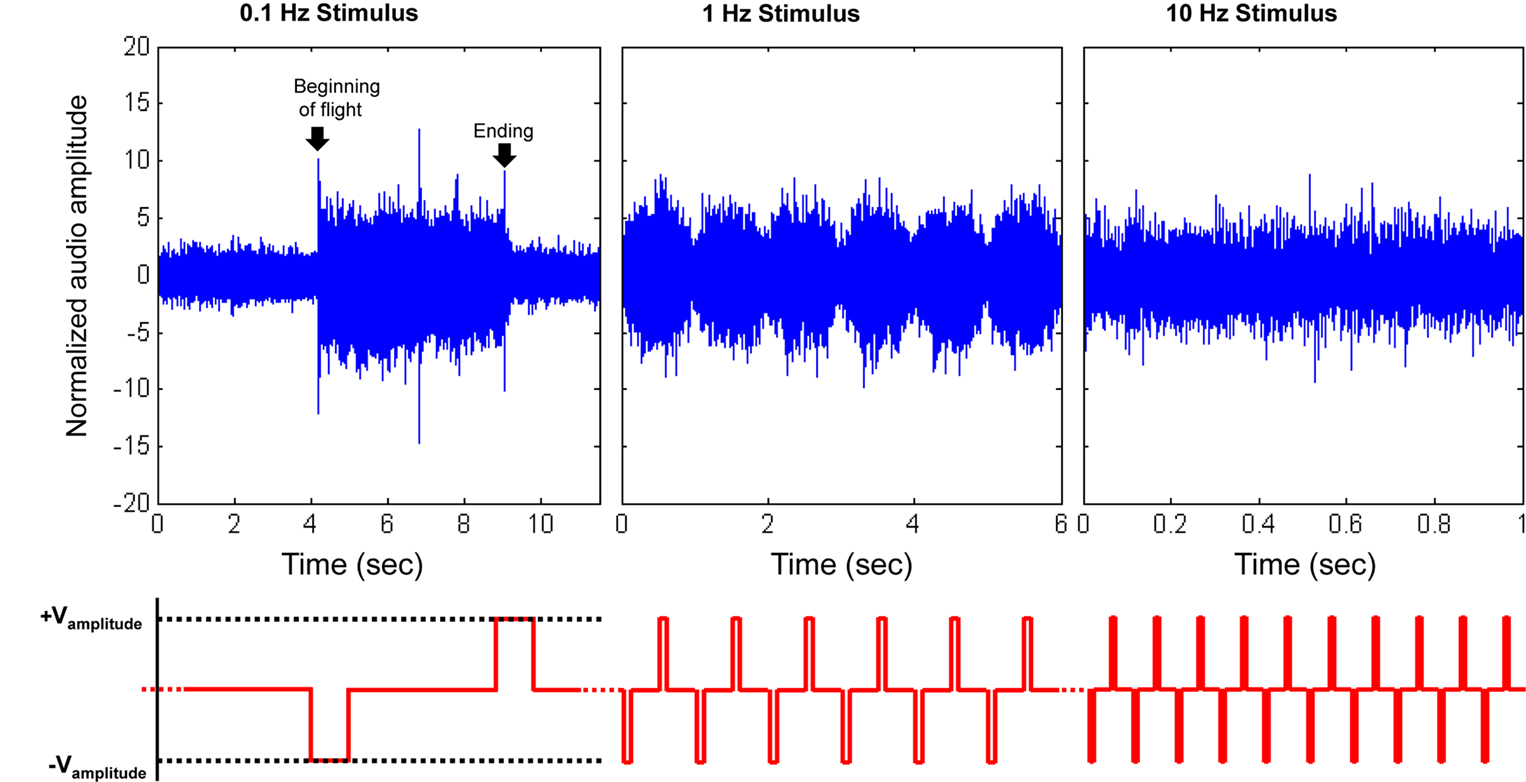
Figure 2. Initiation and cessation control of Cotinis texana beetle during tethered flight; (top) audio recordings of tethered beetle, (bottom) applied potential to the brain (with counter electrode inserted into posterior pronotum). The applied potential waveform is identical to Figure 3
A, but frequency varied. As the period between pulses decreased, the beetle was incapable of fully starting or stopping wing oscillation and audio amplitudes were modulated by the stimulus frequency. Audio amplitudes were normalized using mean absolute value during normal, sustained flight recorded at each individual trial. See Movies 1, 2 and 4 in Supplementary Material for flight initiations of fully tethered, weakly tethered and fully untethered Cotinis texana, respectively.
We then compared three different types of electrical stimuli: alternating negative and positive potential pulses, positive potential pulses and negative potential pulses (Figure 3
). Positive potentials, whether alone or alternating with negative pulses, initiated flight but negative potential pulses alone did not. Positive pulses and alternating positive and negative pulses were equally effective in eliciting flight: five of nine and four of nine insects initiated flight in response to stimulation, respectively. Data on stimulated flight bouts in individual C. texana are summarized in Table 1 in Supplementary Material.
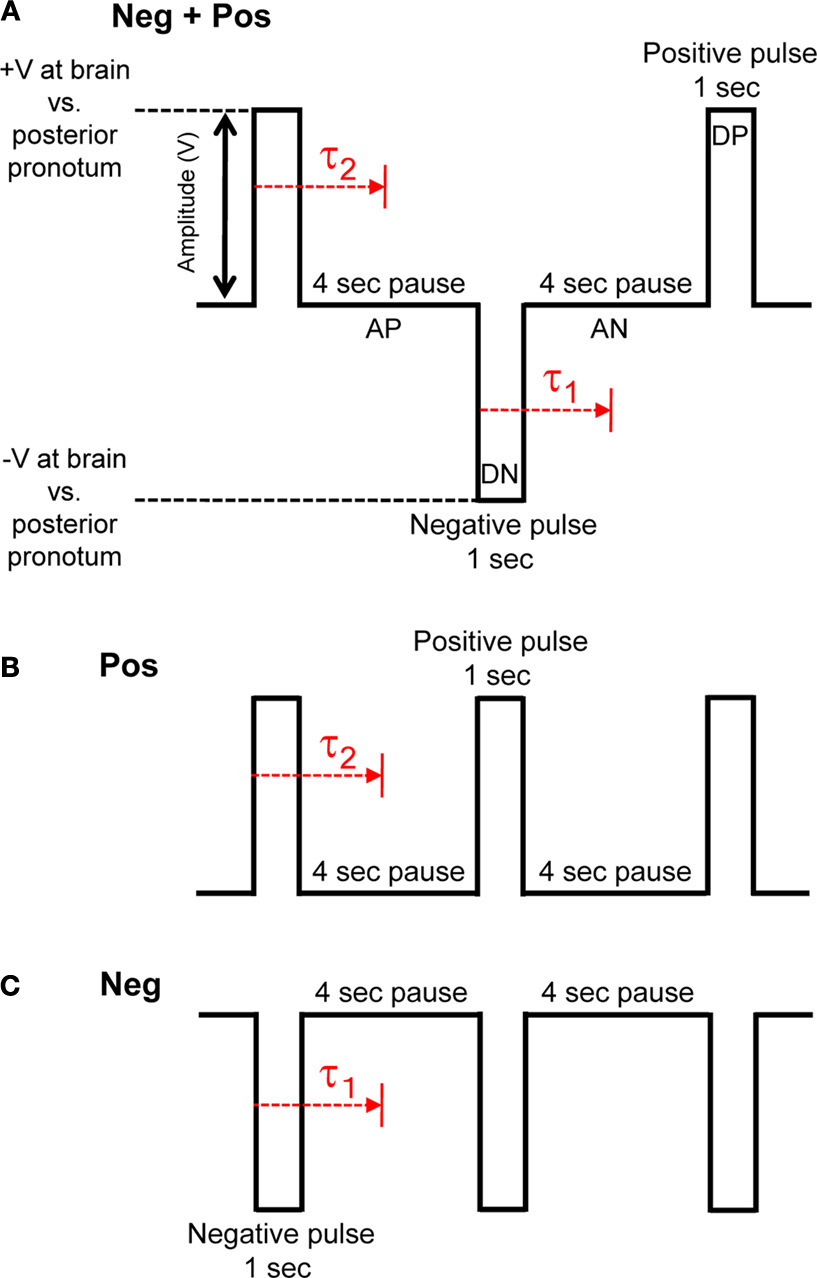
Figure 3. Three types of pulse trains (stimulus protocols) were investigated to elicit flight. (A) Neg + Pos: alternating 1 s duration positive and negative pulses, (B) Pos: 1 s duration positive pulses, (C) Neg: 1 s duration negative pulses. Pulse amplitude was swept from 0.1 to 5.0 V in 100 mV increments when testing for the amplitude threshold. Delay, τ1 or τ2, is response time from beginning of positive or negative potential pulse to beginning of wing oscillation, respectively. See Table 1 in Supplementary Material for data on stimulated flight bouts in all tested Cotinis texana.
Given the initial data from Cotinis, we chose to extend this study to control of beetles in free flight; this required a slightly larger beetle to carry our radio-equipped system (RF receiver + battery = 1331 mg). As with Cotinis, we first determined the optimal stimulation potential amplitude required to start and stop flight in tethered M. torquata. During these experiments we also found that the application of these potential pulses between electrodes implanted at the interior base of the left and right optic lobes (Figure 1
) yielded a much higher success rate as compared to the method used with Cotinis and, unexpectedly, did not affect the beetle’s ability to steer in free flight (see below; Figure 4 and Movies 5–7 in Supplementary Material). All ten insects tested initiated flight in response to stimulation, with the median number of stimuli required to initiate flight being 19 (range 1–59, one stimuli was 10 ms as shown in Figure 4
B), and the median response time from the first stimulation to flight initiation being 0.5 s (range 0.2–1.4 s, τ3 in Figure 4
A). Median flight duration in response to stimulation was 45.5 s (range 0.7–2292.1 s). Stimulation voltage between 2 and 4 V did not affect the number of stimuli required to initiate flight, response time from stimulation to flight, or flight duration in M. torquata (Mann–Whitney U tests, P = 0.13, 0.46, 0.35, respectively). Data on stimulated flight bouts in individual beetles are summarized in Table 2 in Supplementary Material.
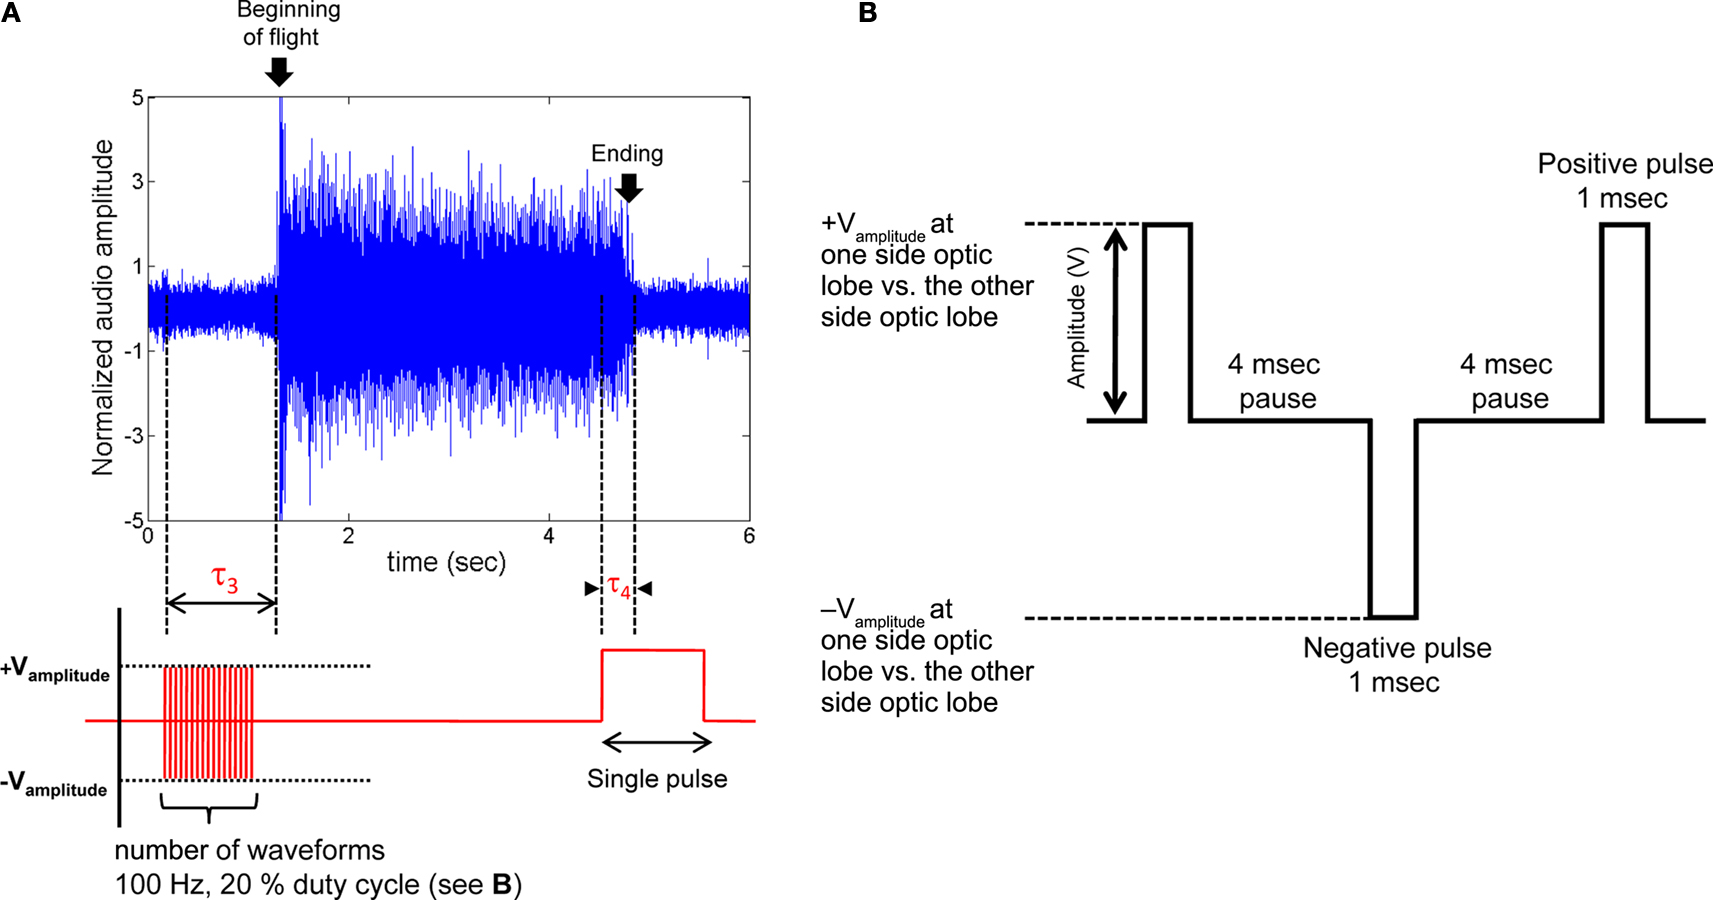
Figure 4. Initiation and cessation control of Mecynorrhina torquata beetle tethered flight. (A) Alternating positive and negative potential pulses (100 Hz, see (B) for the details of the waveform) applied between left and right optic lobes initiated wing oscillations while a single pulse ceased wing oscillations; (top) audio recording of tethered beetle, (bottom) applied potential to the one side optic lobe regarding the other side optic lobe. Delay, τ3, is response time from beginning of the multi pulse trains to beginning of the wing oscillation. Delay, τ4, is response time from beginning of the single pulse to ending of wing oscillation. τ3 and τ4 for all the tested beetles are summarized in Table 2 in Supplementary Material. The sharp rise of audio amplitude at the beginning of oscillation was attributed to friction between elytra and wings when the wings were unfolded from the underneath of elytra. The whole audio amplitudes were normalized using mean absolute value calculated for the middle period of the flight time (2.5–3.7 s). (B) Pulse trains applied between left and right optic lobes. Number of waveforms was swept from 1 to 100 in one waveform increment when testing for the number of waveforms required to trigger flight initiation (Table 2 in Supplementary Material). See Movies 5–7 in Supplementary Material for flight initiation and cessation control of fully tethered (Movie 5) and fully untethered (wireless communication, Movies 6 and 7) Mecynorrhina torquata.
Given these data, we were then able to repeatedly trigger flight initiation and cessation in untethered, free flying insects (Movies 6 and 7 in Supplementary Material). Once flight was initiated, it tended to persist without additional stimulation for both tethered and free-flying beetles. During normal flight, the neurons innervating the basalar muscles produce a pulse train with ∼50 ms period (Josephson et al., 2000a
,b
). Artificially induced flight lasted far longer than 50 ms: median flight durations were 2.5 s (range 0.2–1793.1 s) for C. texana, and 45.5 s (range 0.7–2292.1 s) for M. torquata. These data, and the adoption of a normal flight posture, indicate that the tonic neural signals required for flight maintenance were continued after the artificial stimulus. Between insects, flight bout duration was not correlated with either beetle mass or stimulus amplitude (Tables 1 and 2 in Supplementary Material).
A single pulse applied between the left and right optic lobes stopped flight for M. torquata [Figure 4
, Movie 5 (tethered) and Movie 7 (free flight) in Supplementary Material]. Ten tethered insects were tested each ten times to determine the optimal cessation potential. Data on cessation of flight in individual insects are summarized in Table 3 in Supplementary Material. All the ten insects tested were forced to stop flying by amplitude of 6.0 V or less. The majority (77%) stopped with a 2.0–3.0 V amplitude. The median amplitude was 3.0 V (range 2.0–6.0 V). The majority (87%) showed a short response time, τ4 < 100 ms. Movie 7 in Supplementary Material shows cessation of flight in free-flying beetles in response to given commands via the radio control system by a remote operator. Multiple flight initiation and cessation rounds were possible for most beetles tested and there was no evidence of impaired flight ability after 30–60 min of tests (set by the lifetime of the battery). Moreover, beetles were repeatedly flown on subsequent days, demonstrating that the stimulation resulted in little permanent damage.
Modulation of Wing Oscillation During Flight
During flight, wing oscillation frequency could be manipulated by modulating the wing oscillations with the neural stimulator. For C. texana, we observed that progressively shortening the time between positive and negative pulses led to a “throttling” of flight where the beetle’s normal 76 Hz wing oscillation was strongly modulated by the 0.1–10 Hz applied stimulus (Figure 2
; the second half of Movie 1 in Supplementary Material). A repeating program of 3 s, 10 Hz, 3.0 V pulse trains followed by a 3.3-s pause (no stimulus) resulted in alternating periods of higher and lower pitch flight (Figure 5
, Movie 8 in Supplementary Material for elevation control of C. texana tethered on a custom pitching gimbal). In audio recordings of flight, the audio amplitude was enhanced by ∼10% when the beetle was stimulated (Figure 5
B). High speed (6000 fps) video showed that during stimulation, wing oscillations had a 5.6% greater frequency than during un-stimulated flight (Movie 9 and Table 4 in Supplementary Material). For M. torquata, brain stimulus at 100 Hz in the same manner as C. texana led to depression of flight. Set on a custom pitching gimbal, M. torquata could be repeatedly made to lower its attack angle to the horizon when stimulated (Figure 6
, Movie 10 in Supplementary Material); note how stroke amplitude is visibly reduced. Ten of eleven tested beetles showed this tendency (Table 5 in Supplementary Material shows angle changes in individual insects). Occasionally, stimulation resulted in flight cessation (fourth column in Table 5 in Supplementary Material). In free flight, this corresponded to a controllable drop in altitude when stimulated (Figure 7
, Movie 11 in Supplementary Material). One second of stimulus resulted in a 60-cm median drop in altitude (range 33–129 cm).
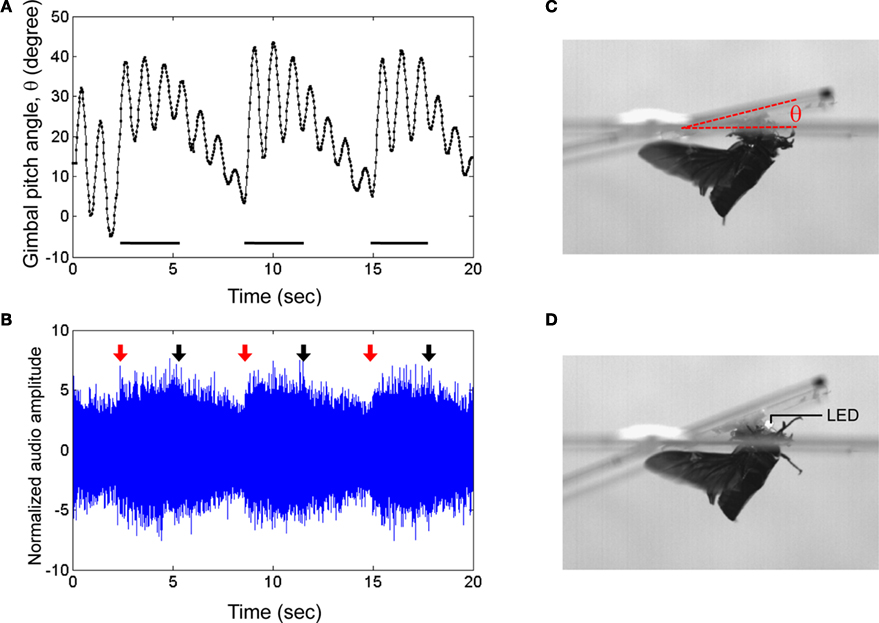
Figure 5. Elevation control of Cotinis texana beetle tethered on a custom pitching gimbal. Brain stimulus altered the gimbal pitch of the beetle. (A) Gimbal pitch angle with the mounted beetle during alternating periods of un-stimulated and stimulated flight. Horizontal bars indicate durations of the stimuli (3 s each); a 10-Hz, 3.0 V pulse train whose waveform is identical to that in Figure 3
A was applied during the indicated periods. (B) Audio recording corresponding to (A). Red and black arrows indicate the beginnings and endings of the stimuli to the brain. The audio amplitudes were normalized using a mean absolute value during un-stimulated periods. Photographs of a gimbal-mounted beetle during (C) un-stimulated and (D) stimulated flight. A light-emitting diode (LED) mounted to the microcontroller acted as an indicator by blinking during stimulation. See Movies 8 and 9 in Supplementary Material for the corresponding normal and high speed video tracks, respectively.
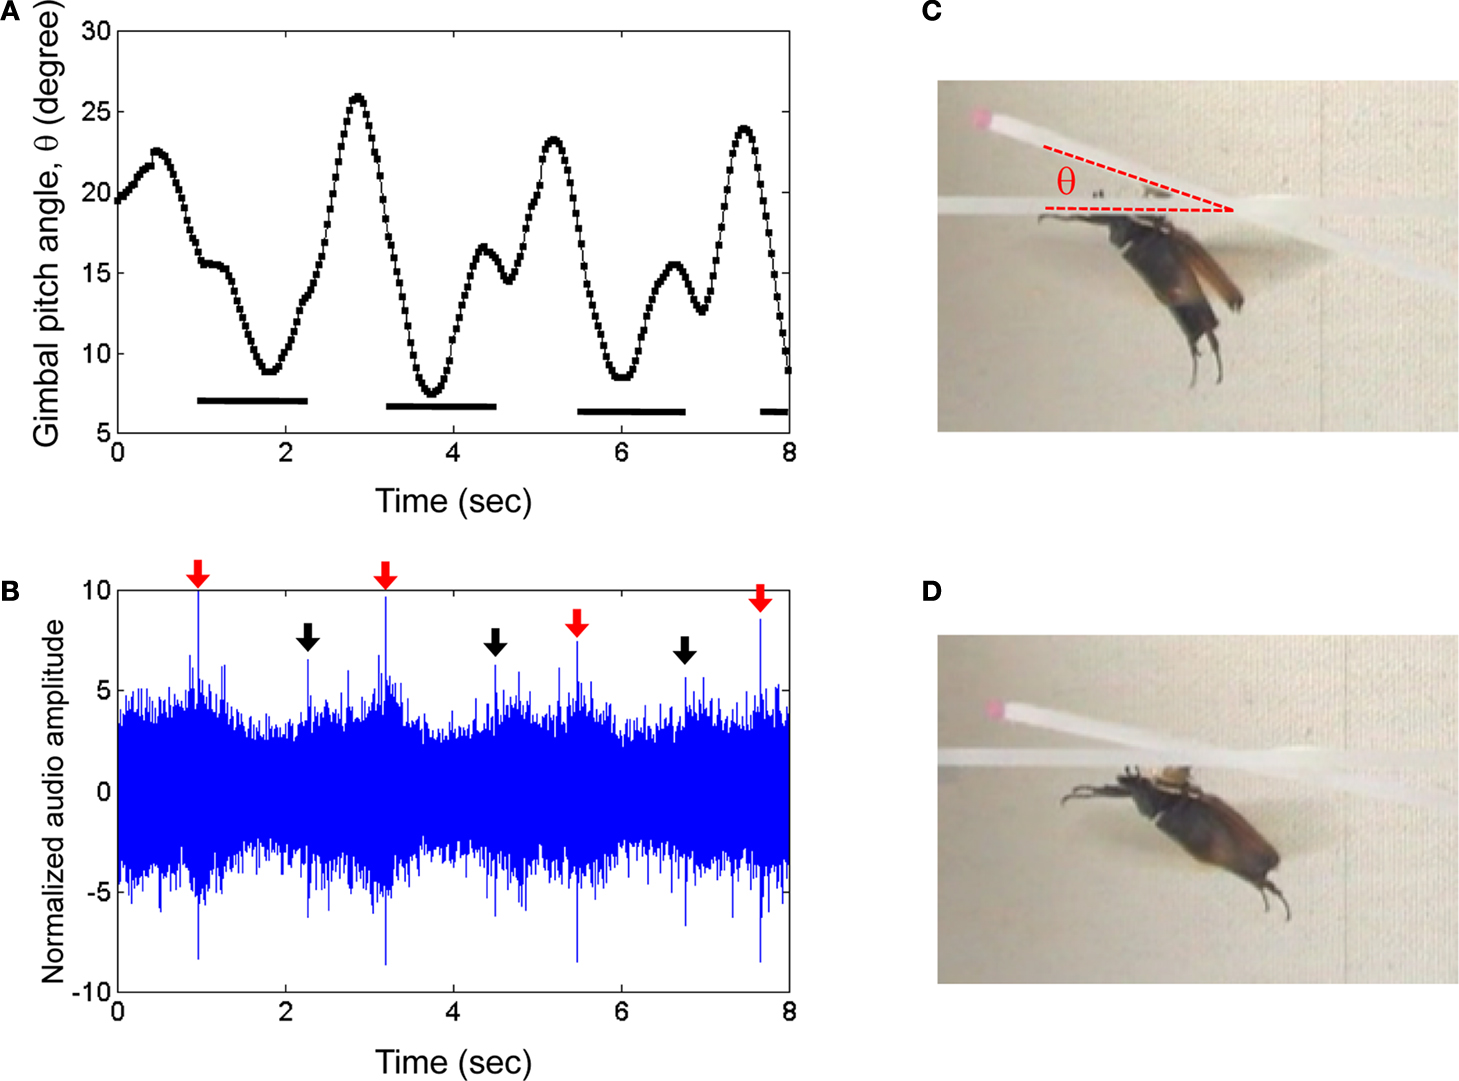
Figure 6. Elevation control of a Mecynorrhina torquata beetle tethered on a custom pitching gimbal. Brain stimulus altered the gimbal pitch of the beetle (100 Hz, 2.0 V amplitude, see Figure 3A for waveform). (A) Gimbal pitch angle with the mounted beetle during alternating periods of un-stimulated and stimulated flight. Horizontal bars indicate durations of the stimuli. (B) Audio recording corresponding to (A). Red and black arrows indicate beginnings and endings of the stimuli to the brain. The sharp peaks at the arrows were attributed to the signal tones coming from function generator to output the stimulus signal to the beetle brain. The audio amplitudes were normalized using a mean absolute value during un-stimulated periods. Photographs of a gimbal-mounted beetle during (C) un-stimulated and (D) stimulated flight. See Movie 10 in Supplementary Material.
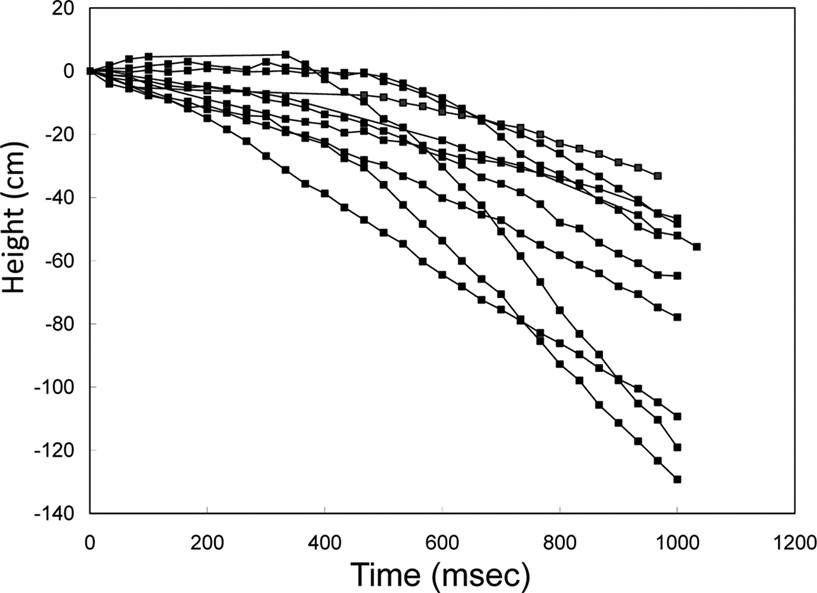
Figure 7. Elevation control of a free-flying Mecynorrhina torquata beetle: temporal height-change of a flying beetle (ten flight paths). Alternating positive and negative potential pulse trains at 100 Hz and 2.0 V amplitude to the brain caused the beetle to fly downward. The applied waveform was identical to that in Figure 3
A, but the frequency was different (100 Hz). The median height change was 60 cm (the range was 33–129 cm). See Movie 11 in Supplementary Material.
Turning
Turns were elicited by stimulus of the left and right basalar muscles with positive potential pulse trains. In C. texana, the basalar muscles normally contract and extend at 76 Hz when they are stimulated by ∼8 Hz neural impulses from the beetle nervous system (Josephson et al., 2000a
,b
). It has been reported that the flight muscles in Cotinis produce maximum power when they are stimulated directly by electrical pulses at 100 Hz (Josephson et al., 2000b
). During flight, a turn was triggered by applying 2.0 V, 100 Hz positive potential pulse trains to the basalar muscle opposite to the intended turn direction (Figure 8
, Movie 12 in Supplementary Material). A right turn, for example, was triggered by stimulating the left basalar muscle. In free-flying M. torquata, turns were elicited in the same manner but at 1.3 V (Figure 9
, Movie 13 in Supplementary Material). The success rates for left and right turns were 74% (N = 38) and 75% (N = 52), respectively. Half second of stimulation to the left and right basalar muscles of free-flying beetles resulted in a 1.7° and −9.0° median inclination angle, respectively, and 20.0° and 32.4° median yaw angle, respectively (Table 6 in Supplementary Material). During flight, beetles tended to adjust their attitude so as to fly parallel to the ground plane (θi in Table 6 in Supplementary Material). This intrinsic characteristic of beetle flight made it possible to elicit turns in a desired direction with just one degree of control.
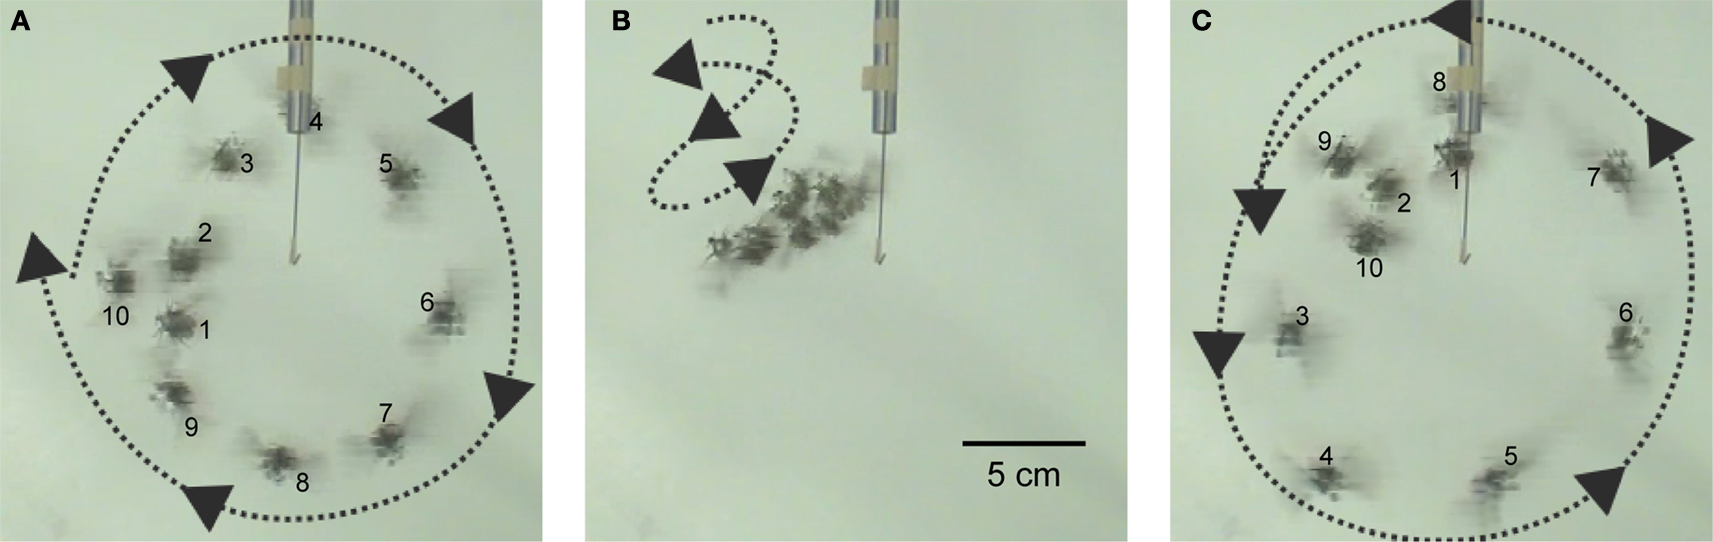
Figure 8. Turn control of Cotinis texana flight. A 100-Hz and 2.0-V positive potential (vs. counter electrode at posterior pronotum) pulse train to the basalar muscle on one side of the beetle triggered a turn. Beetle mounted on a string (10 cm) was programmed with continuous sequences of left, pause, right, pause instructions; each instruction lasted 2 s. (A) Left basalar muscle stimulus generating a right turn, followed by (B) a pause during which the beetle zigged and zagged randomly, followed by (C) right basalar muscle stimulus generating a left turn. Each successive photograph consists of 10 frames; frames were taken every 0.2 s. Numbers in (A) and (C) signify the frame number. See Movie 12 in Supplementary Material.
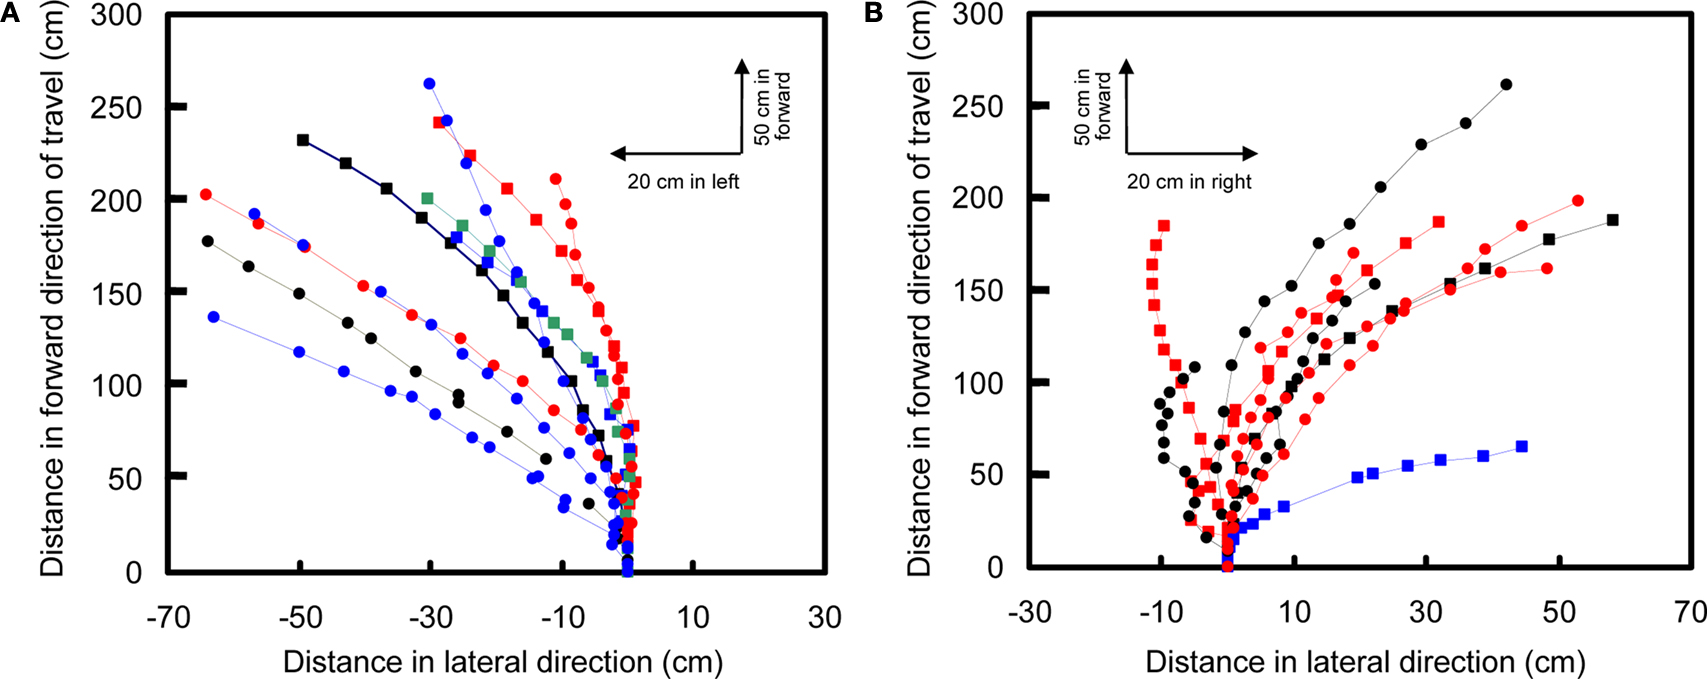
Figure 9. Turn control of free-flying Mecynorrhina torquata beetle. Pulse trains at 100 Hz and 1.3 V positive potential to the left or right basalar muscle triggered turns. Ten flight paths elicited by a 0.5-s continuous stimulus to (A) right or (B) left basalar flight muscle. Each flight path is obtained after the three-dimensional digitized flight path is projected on the XY-plane (see text for detailed method). The first point of each flight path (beginning of the 0.5 s stimulus) is located at the origin of coordinate system while the last point indicates the ending of the stimulus. Different colored and shaped plots show different individual beetles’ flight paths. See Movie 13 in Supplementary Material for representative turn control in free flight.
Our results demonstrated that it was possible to reliably control flight initiation and cessation, modulate flight throttle and direction with a relatively simple interface. However, it is difficult to determine which neural pathway the stimulus signal descended along and which neural action the signal caused at the terminal of the pathway. Elucidation of these mechanisms awaits neuronal recording of beetles during stimulation. However, given the data on stimulated sites, stimulus signal waveforms and beetle behaviors right before flight initiation and cessation, some initial hypotheses can be formulated. One possibility is that our stimulus directly depolarizes large diameter “giant fiber” motor neurons connecting the insect brain to the flight muscles. Alternatively, we might be depolarizing sensory afferents to the brain that lead to alteration of the pattern generator output (Burrows, 1996
; Budick et al., 2007
). The initiation stimulus might generalize sensory neurons that triggered an avoidance response in the beetle, leading to escape behavior. Alternatively, for the case of M. torquata, the multi-pulse trains at 100 Hz might cause resonation of the central pattern generator. The similarly threshold cessation behavior (single pulse stopping flight with quite short response time) could be a generalized depolarization leading to either a decoupling of coordinated flight behavior, or as a response to a strong and relatively long sensory stimulus.
In summary, we demonstrated a miniaturized, pronotum-mounted system consisting of a neural stimulator, muscular stimulators, a radio-equipped microcontroller and a microbattery capable of the continuous flight control of 1 g/2 cm and 8 g/6 cm beetles in free flight. To our knowledge, this is one of the first reports on a reliable, neuro-stimulated flight control mechanism in insects. Although there have been prior reports on the influence of electrical stimulus of the brain on insect flight (Burrows, 1996
), the mechanisms and microsystem presented here offer distinct advantage for the remote control and study of insect flight. One of the major advantages of our method is that the stimulation method is surprisingly simple and robust, and it implicitly makes use of the beetle’s own flight control capabilities – the beetle powers its own flight and levels to the horizon; perturbations are applied whenever a heading or elevation change is required. The implant method described here suffers from variability in stimulus voltage from insect-to-insect; this is likely due to the coarse nature of the stimulator and the use of electrical potential as the controlled variable (as opposed to charge delivered). Smaller footprint microfabricated electrodes should improve the first issue, as well as reduce the overall power consumption of each stimulus. Moreover, newer designs should likely use charge delivery (as opposed to voltage levels) from microcontroller-driven current sources to elicit responses.
Beetles
Cotinis texana (ca. 2 cm, 1 g, Green June Beetle) were collected from fruit gardens in Texas, USA. C. texana beetles were kept in groups of 30–40 in terrariums (40 cm × 27 cm × 32 cm) on organic peat misted with water daily to keep relative humidity near 40–50%. M. torquata (ca. 6 cm, 8 g) were imported from insect suppliers (United States Department of Agriculture, USDA permit, application # P526-080711-016). M. torquata beetles were kept in separate terrariums (20 cm × 15 cm × 15 cm) containing woodchips. The beetles were fed sliced apples every 2–3 days. The temperature in all terrariums was maintained near 28°C. Lamps were used to create artificially day/night cycles (15 h light/9 h dark) and sheet heaters controlled by thermostats were used to control temperature. The beetles used in experiments were distinguished from yet-unemployed ones but treated with the exact same feeding and care.
Flight Initiation Experiments
To ensure identical test conditions, the beetles were individually enclosed in small plastic cases (4 cm × 3 cm square and 3 cm height for C. texana, 10 cm diameter and 5 cm height for M. torquata) for 24 h without feeding prior to flight initiation experiments. The small cases physically prevented the beetles from unfolding and oscillating wings. Each beetle was then placed in a −10°C freezer for 5 min to anesthetize it. We then carefully pierced two small holes using a needle through the beetle cuticle: for C. texana (1) at the center of the head between the compound eyes for brain, and (2) at the center of posterior pronotum; for M. torquata (1) at the interior edge of the left compound eye for left optic lobe and (2) at the interior edge of the right one (see Figure 1
for details of the pierced sites). The beetle was then glued onto the bottom of a wooden stick with beeswax. Two bare steel wires were fixed on the side of wooden stick by superglue. For C. texana, one wire (working electrode) was implanted into the small hole to the brain while the other wire (counter electrode) was implanted into the other small hole at the center of posterior pronotum. For M. torquata, the two electrodes were implanted into the left and right optic lobes.
For tethered experiments, the wires were then connected to a function generator (Agilent, 33220A). The applied signals were monitored by an oscilloscope (Agilent DSO3062A). For C. texana, green and a red light-emitting diodes (LEDs) were also fixed on the side of the wooden stick using superglue as in Movie 3 in Supplementary Material. The LEDs were wired along the current path of the two wires but in different bias directions so that the green one blinked when the working electrode (brain) was positive with respect to the counter electrode while the red one blinked when the working electrode was negative with respect to the counter electrode.
For C. texana, flight initiation experiments started by applying 100 mV amplitude pulse trains as described in the text and Figure 3
. One second stimulus train was applied three times and then the amplitude was increased by 100 mV. This was repeated until the beetle initiated flight. The amplitude at which the flight occurred was defined as amplitude threshold in Table 1 in Supplementary Material. Once the beetle began to fly, any stimulus was turned off to allow the beetle to fly until it stopped naturally. After the beetle naturally stopped flying, the stimulus signal was restarted at the same amplitude at which the previous fight was initiated. We repeated this cycle up to 5.0 V amplitude. We examined nine C. texana beetles per each stimulus protocol (Neg + Pos, Pos or Neg, Figure 3
, Table 1 in Supplementary Material).
For M. torquata, flight initiation experiments started by applying one stimulation at 100 Hz (i.e., 10 ms, see Figure 4
B for stimulus waveform). One additional stimulation was added for the next cycle: two stimulations (20 ms) were applied for the second cycle. This was repeated until the beetle initiated flight or number of stimulations reached one hundred (the latter case was counted as failure). Once flight was initiated, no further stimuli were applied and the beetle was allowed to fly until naturally stopping. We tested ten M. torquata beetles for each applied stimulus amplitude (2.0, 3.0 and 4.0 V) as shown in Table 2 in Supplementary Material.
All the experiments were filmed using a normal speed video camera (Victor, GZ-MG275-S, 30 fps, shutter speed 1/2–1/4000 s, resolution 720 × 480 pixels). The response times defined as τ1, τ2 and τ3 (Figures 3 and 4
) and flight bout durations of all the flights were counted using frame-by-frame analysis.
Flight Cessation Experiment
In the same manner as the flight initiation experiment described above, a M. torquata beetle was glued on a wooden stick and two electrodes were implanted into the left and right optic lobes. The flight initiation signal was applied between the electrodes in order to initiate flight. A 1-s long pulse was then applied to the electrodes. The amplitude was started at 2.0 V, and then it was increased by 1.0 V unless the beetle stopped the flight. We repeated this cycle until the beetle stopped. All the tested beetles ceased flight below 6.0 V. This test was repeated ten times for each beetle and we tested ten beetles in total (i.e., N = 100). The response times (τ4 in Figure 4
) were counted using frame-by-frame analysis.
System Assembly
Circuit diagrams and photographs of the brain and basalar muscle stimulators used for C. texana are shown in Figure 1 in Supplementary Material. Prior to assembly, each microcontroller was preloaded with a flight program using an interface provided with TI MSP430 14 Pin Package Board and USB Programmer (MSP-FET430U14). Once loaded, six steel wires (∅125 μm) were directly soldered onto different pins on the microcontroller: printed circuit board (PCB) was not used. In some cases, as in Figure 5
, a small LED (Lite-On Inc., LTST-C171GKT, <3 mg, 2.0 mm × 1.2 mm × 0.7 mm) was also soldered in parallel to indicate polarity of the applied stimulus. To adjust the applied amplitude to a value other than 3.0 V originally supplied from the microbattery, surface mount resistors (1 kΩ and 2 kΩ, 3 mg each) were soldered to set voltage divider. A microbattery (Panasonic, ML614, 3.0 V, 160 mg, ∅6.8 mm × 1.4 mm, 3.4 mAh) was attached on the microcontroller with a 5 mm × 5 mm piece of double-faced adhesive tape. This assembly was attached to the dorsal pronotum of C. texana with beeswax. The beetle was placed in a −10°C freezer for 5 min to anesthetize it. We carefully pierced four small holes using a needle through the beetle cuticle: (a) at the center of the head between the compound eyes for the brain, (b) toward the posterior end of the pronotum, behind the microcontroller for the counter electrode site, and (c) midway between sternum and notum of mesothorax for the basalar flight muscles (see Figure 1
). Four of the wires were implanted through the holes. The other two wires were connected between the VCC and VSS pins of the microcontroller and the positive and negative terminals of the microbattery, respectively.
The circuit diagram and photographs of the RF receiver used for M. torquata are shown in Figure 2 in Supplementary Material. The RF system used two Chipcon Texas Instruments CC2431 microcontrollers (6 mm × 6 mm, 130 mg, 32 MHz clock, 2.4 GHz IEEE802.15.4 compliant RF transceiver); one acting as the beetle-mounted RF receiver and one as a computer-driven RF transmitter base station. Based on the circuit diagram, we designed and manufactured a custom PCB [16 mm × 13 mm, FR4 (rigid), 500 mg] for the receiver. The microcontroller and the other components including surface mount resistors, an oscillator and a folded dipole antenna were assembled on the PCB as shown in Figure 2 in Supplementary Material. The microcontroller was then loaded with a custom signal-generating software (BeetleBrain v0.99b). The wire electrodes were soldered on the output pads. The circuit diagram in Figure 2 in Supplementary Material shows, for example, the case when two wire electrodes for stimulating left and right optic lobes were soldered on two of the output pads, P1_5 and P1_6, respectively. To power the microcontroller, tow wires were soldered to two pads on the PCB: one was connected to GND and the other one to the DVDD (AVDD was also lined together to this pad). A rechargeable micro lithium ion battery (Micro Avionics, 3.9 V, 350 mg, 8.5 mAh) was then attached to the PCB with a piece of double adhesive tape. The negative and positive terminals of the battery were connected to the two wires coming from the GND and DVDD pads, respectively, when the RF receiver was in use. In the same manner as Cotinis texana, we carefully pierced six small holes on M. torquata: (a) at the center of the head between the compound eyes for the brain, (b) toward the posterior end of the pronotum for the counter electrode site, (c) midway between the sternum and notum of mesothorax for the basalar flight muscles, and (d) at the interior edge of compound eye for the optic lobe (see Figure 1
). The RF receiver was then mounted on the beetle’s posterior pronotum and attached with beeswax. The terminals of wire electrodes coming from the output pads on the PCB were implanted into the brain, posterior pronotum, left and right basalar flight muscles, and the left and right optic lobes. Flight commands were generated by custom control software (BeetleCommander v0.98) running on a personal computer interfaced via a serial port with the transmitter (CC2431 microcontroller mounted on a Chipcon Texas Instruments SmartRF 04EB). BeetleCommander v0.98 allowed for in-flight control of stimulus parameters including frequency, number and duty cycle of adjusted amplitude pulses to stimulated sites. Command signals were transmitted using the CC2431’s built-in 2.4 GHz IEEE 802.15.4 compliant RF transceiver broadcasting on a single channel (1A, 2.480 GHz) using direct sequence spread spectrum RF modulation. The transmitter sent a command to the receiver every 1 ms for 300 ms when instructed to do so. The flight commands were mapped to appropriate amplitude pulse trains at the beetle’s neural stimulators by BeetleBrain v0.99b running on the receiver. To adjust the applied amplitude to a value other than the 3.9 V originally supplied from the lithium ion battery, the surface mount resistors were soldered to create voltage divider.
Recording of Flight Experiments
Beetle flight was filmed in a closed room with normal speed video cameras (Victor, GZ-MG275-S, 30 fps, shutter speed 1/2 to 1/4000 s, resolution 720 × 480 pixels). A high speed camera (Photron, FASTCAM-X 1024PCI, 500–6000 fps, resolution 256 × 256 pixels) was used to obtain images for counting wing beat frequencies. Temperature and relative humidity in the room were maintained between 28 and 30°C and between 40 and 60%, respectively. Beetle flight was recorded in one of the following five conditions:
(a) free flight.
(b) tethered on tip of a small stick.
(c) weakly tethered with two thin metal wires (∅50 μm, ∼2 m). The terminals of these thin wires were implanted into brain (working electrode) and posterior pronotum (counter electrode). The other terminals were connected with a function generator (Agilent, 33220A).
(d) tied to a piece of string.
(e) attached onto a custom flexural gimbal which allowed rotation along a single DOF.
For (a) above, in order to track a flying beetle from different angles, four video cameras were placed at each corner and two at the center of the near or far walls (relative to the initial position of the beetle). Extra RF receivers where LEDs were connected as indicators of stimulus signals were placed near some of the cameras so that the cameras filmed the LED indicators together with the flying beetle in same video frame. Turn control data were obtained using frame-by-frame analysis of randomly selected videos using MATLAB (The Mathworks) running DLTdv3 (Ty Hedrick laboratory, University of North Carolina) and referenced to the LEDs on the receivers next to the cameras (Hedrick, 2008
). θi and θf in Table 6 in Supplementary Material were calculated with custom MATLAB script from the first and the last vectors of digitized flight path, respectively: θi is the first vector’s angle to the ground (XY-plane) and θf is the last vector’s. The digitized flight path in the XYZ-coordinate was transformed so that the first vector of the flight path lay on the Z-axis. The transformed flight path was then rotated around the Z-axis and projected to the XZ-plane. Each flight path shown in Figure 9
was projected when the angle of the last vector to the first vector becomes the maximum on the XZ-plane. The angle of the last vector to the first vector on the XZ-plane is defined as inclination angle during the stimulus, or Δθ in Table 6 in Supplementary Material. As a matter of convenience, the projected flight paths are plotted onto another XY-plane, instead of the original XZ-plane (Figure 9
). After the projection, the angle of the final vector with respect to the first vector expresses yaw angle during the stimulus (ϕ in Table 6 in Supplementary Material).
The gimbal used for (e) is shown in Figure 3 in Supplementary Material. The gimbal consisted of machined acrylic inner and outer rings linked by silicone elastomer flexures (polydimethylsiloxane) with a known torsional stiffness constant (kθ = ∼3.3 × 10⁻⁵ Nm/rad). The edges of outer ring were horizontally supported by lab jacks. A beetle was attached onto the center pole of inner ring (Figure 3D in Supplementary Material) so that the inner ring was at an initial angle to horizon of ∼ −25° for C. texana and ∼0° for M. torquata. A color dot was painted on one corner of the inner ring, and each frame was digitized. The rotation angle of the gimbal was extracted from the movement of the marker relative to the center of rotation (set by user) using custom script in MATLAB to track the change of inner ring angle to horizon.
Power Consumption
Current flowing was measured with an ammeter (Keithley, 6485 Picoammeter) while a function generator (Agilent, 33220A) applied the pulse trains in the same manner as described in Section “Flight Initiation Experiments.” Representative current waveforms are shown in Figure 4 in Supplementary Material. During the brain stimulus for C. texana and the optic lobe stimulus for M. torquata, 80 and 2200 μW were consumed, respectively.
The authors declare that the research was conducted in the absence of any commercial or financial relationships that could be construed as a potential conflict of interest.
The authors thank Professor Jiro Okada (Nagasaki University) and Professor Donn T. Johnson (University of Arkansas) for their helpful advice on biology and entomology, and Rodney S. Lewallen, Joshua G. Lewallen, and Gregory G. Lewallenhis at Insect International and Aaron T. Dossey (University of Florida) for assistance in the collection of beetles. This work was supported by Defense Advanced Research Project Agency (DARPA).
Hirotaka Sato, Jon F. Harrison and Michel M. Maharbiz designed research; Hirotaka Sato, Christopher W. Berry, Yoav Peeri, Emen Baghoomian, Brendan E. Casey, Gabriel Lavella, and Michel M. Maharbiz performed research; Hirotaka Sato, Christopher W. Berry, John M. VandenBrooks, Jon F. Harrison and Michel M. Maharbiz analyzed data; Hirotaka Sato, John M. VandenBrooks, Jon F. Harrison and Michel M. Maharbiz wrote the paper.
The Supplementary Material for this article can be found online at http://www.frontiersin.org/integrativeneuroscience/paper/10.3389/neuro.07/024.2009/