1
Department of Psychology, Stanford University, Stanford, CA, USA
2
Neuroscience Institute, Stanford University, Stanford, CA, USA
The ventral temporal cortex (VTC) in humans includes functionally defined regions that preferentially respond to objects, faces, and places. Recent developmental studies suggest that the face selective region in the fusiform gyrus (‘fusiform face area’, FFA) undergoes a prolonged development involving substantial increases in its volume after 7 years of age. However, the endpoint of this development is not known. Here we used functional magnetic resonance imaging (fMRI) to examine the development of face-, object- and place selective regions in the VTC of adolescents (12–16 year olds) and adults (18–40 year olds). We found that the volume of face selective activations in the right fusiform gyrus was substantially larger in adults than in adolescents, and was positively correlated with age. This development was associated with higher response amplitudes and selectivity for faces in face selective regions of VTC and increased differentiation of the distributed response patterns to faces versus non-face stimuli across the entire VTC. Furthermore, right FFA size was positively correlated with face recognition memory performance, but not with recognition memory of objects or places. In contrast, the volume of object- and place selective cortical regions or their response amplitudes did not change across these age groups. Thus, we found a striking and prolonged development of face selectivity across the VTC during adolescence that was specifically associated with proficiency in face recognition memory. These findings have important implications for theories of development and functional specialization in VTC.
Functional magnetic resonance imaging (fMRI) studies of the ventral temporal cortex (VTC) have revealed a consistent functional organization in adult humans. One aspect of this organization is characterized by regions that respond more strongly to some types of visual stimuli than to others. These include face selective regions which respond more to faces than to other objects or scenes, including a region in the fusiform gyrus referred to as the fusiform face area (FFA, Kanwisher et al., 1997
) which is implicated in face recognition (Tong et al., 1998
; Golby et al., 2001
; Grill-Spector et al., 2004
; Ranganath et al., 2004
; Nichols et al., 2006
). Other regions respond more strongly to objects than to scrambled images of objects (Malach et al., 1995
), including an object selective region along the posterior fusiform gyrus and occipito-temporal sulcus (pFus/OTS, Vinberg and Grill-Spector, 2008
). Place selective regions respond more strongly to scenes and buildings than objects and faces, including a region along collateral sulcus and the parahippocampal gyrus known as the parahippocampal place area (PPA, Epstein and Kanwisher, 1998
). Category-selectivity also manifests as distinctly distributed responses to specific categories across the entire VTC (Haxby et al., 2001
), including voxels with weak or no selectivity. Indeed, faces, objects and places each evoke reproducible and distinct patterns of distributed responses across the VTC (Haxby et al., 2001
; Cox and Savoy, 2003
; Grill-Spector et al., 2006
). These observations in adults have generated much interest in the development of the functional organization of VTC and the role of experience in shaping it (Kanwisher, 2000
; Tarr and Gauthier, 2000
).
Recent studies indicate that some category selective regions in the VTC undergo a prolonged development that continues at least through the first decade of life (Gathers et al., 2004
; Aylward et al., 2005
; Golarai et al., 2007
; Scherf et al., 2007
; Peelen et al., 2009
). Accumulating evidence suggests that the volume of the right FFA (rFFA) is substantially larger in adults compared to children, but not the overlapping object selective (lateral occipital complex) region (Golarai et al., 2007
; Scherf et al., 2007
) or the body-part selective extra-striate region (Peelen et al., 2009
; Pelphrey et al., 2009
)]. rFFA volume also correlates with behavioral improvements in recognition memory for faces (Golarai et al., 2007
). However, the endpoint of this development is not known, as previous fMRI studies report inconclusive results. For example, one study reported no difference between adolescents’ (ages 11–14 years) and adults’ FFA volume based on group analyses (Scherf et al., 2007
). Another study reported larger FFA size in adults compared to the combined data from both children and adolescents (Peelen et al., 2009
). A third study found that adolescents’ FFA size was at an intermediate level between children and adults, but these between group differences did not reach statistical significance (Golarai et al., 2007
). Nevertheless, behavioral studies suggest a prolonged development of face recognition memory proficiency, consistently reporting substantial improvements in face recognition memory during adolescence (Diamond and Carey, 1977
, 1986
; Carey et al., 1980
; Golarai et al., 2007
). Thus, one hypothesis is that VTC’s activation to faces undergoes a particularly prolonged development that continues into adolescence, which may have been previously undetected, perhaps due to methodological limitations. Alternatively, the entire VTC may undergo a prolonged development during adolescence, involving developmental changes in activations to faces, objects and places. A third hypothesis is that the VTC reaches an adult-like state before adolescence, and the face selective improvements in face recognition memory performance are due to general mnemonic and/or other cognitive developments that occur outside the VTC. To test these alternative hypotheses, we used fMRI in 14 adolescents (ages 12–16 years) and 11 adults (18–40 years) and examined each subject’s VTC responses to faces, places and object stimuli, as well as their recognition memory for images from these categories.
We first asked how developmental changes during adolescence might manifest in the fMRI measurements. We considered three possibilities that are not mutually exclusive. First, adolescent development may involve age-related increases in the volume of face selective activations in the VTC, analogous to previous findings of larger FFA in adults compared to children (Aylward et al., 2005
; Golarai et al., 2007
; Scherf et al., 2007
; Peelen et al., 2009
). Second, development might manifest as age-related changes in the magnitude or selectivity of responses to specific stimuli in functionally defined regions, as previously reported in the developing FFA (Scherf et al., 2007
; Peelen et al., 2009
). Third, development may change the distributed response patterns to stimulus categories across the entire VTC, affecting the within-category reproducibility of distributed responses and/or the between-category distinctness. To our knowledge no previous study has examined the development of these distributed response patterns in the VTC of children or adolescents. Finding any one or a combination of these changes only in the response profile to faces would support the first hypothesis, positing a particularly prolonged development of the neural mechanisms of face processing in the VTC. In contrast, finding uniform developmental changes across the entire VTC to faces, places and objects would be consistent with the alternative hypothesis of a general development of the VTC during adolescence. Finally, finding no age-related changes in VTC would support the third hypothesis that the face selective behavioral improvements in face recognition memory in adolescence are mediated by the development of brain regions outside the VTC.
We also asked if developmental changes in VTC responses to faces depend on the age of face stimuli. Some behavioral studies suggest better face recognition memory performance when observers view faces of their own- versus other-age groups (Anastasi and Rhodes, 2005
; Perfect and Moon, 2005
), leading to the possibility that a similar own-age advantage may be evident in brain responses. Thus, VTC responses to faces may be stronger in adults when viewing adult faces than when viewing faces of children and adolescents, while the opposite may be found in adolescents. Such findings would also suggest that previous reports of smaller FFA volume during development may be explained by the presentation of adult faces to subjects in those studies, predicting relatively similar face responses in the VTC of adolescents and adults if the age of observer and face stimuli were similar.
Finally, we asked if developmental changes in face selective responses during adolescence specifically relate to improvements in face recognition memory performance or instead reflect general improvements in recognition memory for non-face stimuli or other cognitive abilities. Therefore, in the same subjects, we measured visual recognition memory performance for faces, places and objects and used a battery of behavioral tests to evaluate each participant’s performance on several perceptual and cognitive tasks.
To address these questions, we performed fMRI while adolescents and adults viewed blocks of images of children’s faces, adults’ faces, abstract sculptures, cars, indoor and outdoor scenes and scrambled images that appeared in pseudo-random order. Subjects were instructed to fixate on a central crosshair and indicate if two consecutive images were identical (1-back task). Outside the scanner, each subject also participated in a battery of behavioral tests including (i) a recognition memory test for faces, objects and scenes; (ii) a perceptual discrimination test for face identity (Benton et al., 1978
); (iii) a facial affect recognition test (NEPSY-II); and (iv) an abbreviated IQ test (WASI). For each participant, we functionally defined their face-, object- and place selective regions in the VTC to examine the spatial extent of these regions, and determined the amplitude and selectivity of their responses to visual stimuli from an independent data set. We also measured the distributed multivoxel patterns (MVP) of responses across the entire VTC to face and non-face stimuli. We quantified the within-category reproducibility and across-category distinctness of MVPs to determine if there are between age group differences that extend beyond functionally defined ROIs. We related these measures to the age of subject and age of face stimuli. Importantly, we controlled for non-specific face selective confounds that may affect fMRI measurements (Grill-Spector et al., 2008
), such as greater motion, lower performance during scan, or less variance explained by the general linear model in adolescents versus adults. Finally, we related our fMRI results to behavioral measures in the same subjects.
Subjects
Fourteen adolescents ages 12–16 years (7 females), and 11 adults ages 18–40 years (6 females) participated in these experiments. Subjects had normal or corrected vision with no past or current neurological or psychiatric conditions. Adolescents were recruited from the Palo Alto school districts through advertisements in school newspapers. Adult subjects were university affiliates. Informed consent was obtained according to the requirements of the Panel on Human Subjects in Medical Research at Stanford University.
Adolescents were invited to a practice session to exercise motion control in a simulated scanner environment. All subjects were acclimated to the scanning environment for fMRI by participating on a previous day in an anatomical scanning session.
Scanning
Brain imaging was performed on a 3 Tesla whole-body General Electric Signa MRI scanner (General Electric, Milwaukee, WI, USA) at the Lucas Imaging Center at Stanford University.
Structural MRI
We acquired four whole brain anatomical scans (total scan time ∼15 min; high-resolution 3D Fast SPGR: 166 sagittal slices, 0.938 mm × 0.938 mm, 1.5 mm slice thickness, 256 × 256 image matrix) using a birdcage headcoil.
Functional MRI
We acquired functional images using a surface coil and a T2*-sensitive gradient echo spiral pulse across 32 slices oriented perpendicular to the calcarine sulcus and extending from the occipital pole to the anterior temporal lobe (TR = 2000 ms, TE = 30 ms, flip angle = 76°, field of view = 200 mm, 3.125 mm × 3.125 mm in-plane resolution). Applying the same slice prescription, we acquired anatomical T1-weighted images used to co-register each subject’s functional data to the subject’s whole brain anatomy.
Stimuli
Images were projected onto a mirror mounted on the MRI coil (visual angle ∼ 15°). Images were presented and responses were recorded via a Macintosh MacBook Pro computer using Matlab (Mathworks, Natick, MA, USA) and Psychtoolbox extensions
1
.
Experiment 1: fMRI
During fMRI, subjects viewed gray-scale images of the following types: faces of male children and adolescents (ages 6–16 years), faces of male adults (ages 18–40 years), abstract sculptures, cars, indoor scenes, outdoor scenes, and scrambled images (created by randomly scrambling pictures into 225, 8 × 8 pixel squares). We exclusively used male faces in order to reduce potential gender effects, as some behavioral studies suggest that females’ advantage in face recognition memory performance over male subjects is mostly explained by their better recognition memory for female faces than male faces (Lewin and Herlitz, 2002
). The exclusive use of male faces also enabled us to relate present results to our previous findings (Golarai et al., 2007
). We used a range of ages for each type of face stimulus (as opposed to matching the age stimuli across subjects, which would introduce between-subject stimulus effects, and potentially increase between-subject variability in fMRI results). Furthermore, we reasoned that if face responses reflect years of prior experience with faces, this prior experience might be best reflected in adolescents’ responses to faces of younger children. Thus, boy faces consisted of both children and adolescents, while man faces consisted of adult faces only [albeit ranging across 22 years (18–40)] and matched the age range of the adult participants. Faces of boys and men were presented in separate blocks in order to test for interactions between age of stimuli and age of subjects. All face images were collected from advertising web sites for models, and were matched for distinctiveness and attractiveness by four adult observers.
Cars were of various modern makes, mostly in 3/4 frontal views. We use cars as common objects, with which both children and adult subjects had extensive experience, and have nameable parts that share a typical first order configuration. We used abstract objects as they are relatively novel stimuli with which neither age group has extensive prior experience, and enable us to relate the present study to our previous report (Golarai et al., 2007
).
Indoor scenes of buildings were mostly of empty rooms and corridors, devoid of furniture. Outdoor scenes were of natural settings that were (with a few exceptions) devoid of buildings. All scenes were devoid of people, animals or salient objects.
Stimuli were presented in 12 s blocks followed by 12 s of a blank screen with a fixation at a rate of 1 Hz. Subjects participated in two 396-s runs with different images. Images were presented once, except for image pairs that were randomly repeated within a block (∼17% of images). Subjects were instructed to fixate and press a button using their right thumb, whenever they detected identical images appearing successively (referred to as a 1-back task), which occurred on ∼17% of the images per block. We report subjects’ accuracy during performance of the 1-back task (corrected for guessing) using the following formula:
Behavioral response during scans
There were no significant between age group differences across categories in performance accuracy for the 1-back task (F1,20 = 0.05, P = 0.82). There were significant effects of category between age groups (F6,120 = 4.3, P = 0.001), but there was no significant interaction between age group and category (F6,120 = 1.7, P = 0.13, Figure 1
A). Adolescents’ response times on hit trials were significantly slower than adults’ (F1,20 = 3.2, P = 0.05, one-tailed), but there was no age group by category interaction (F6,120 = 0.31, P = 0.93, Figure 1
B).
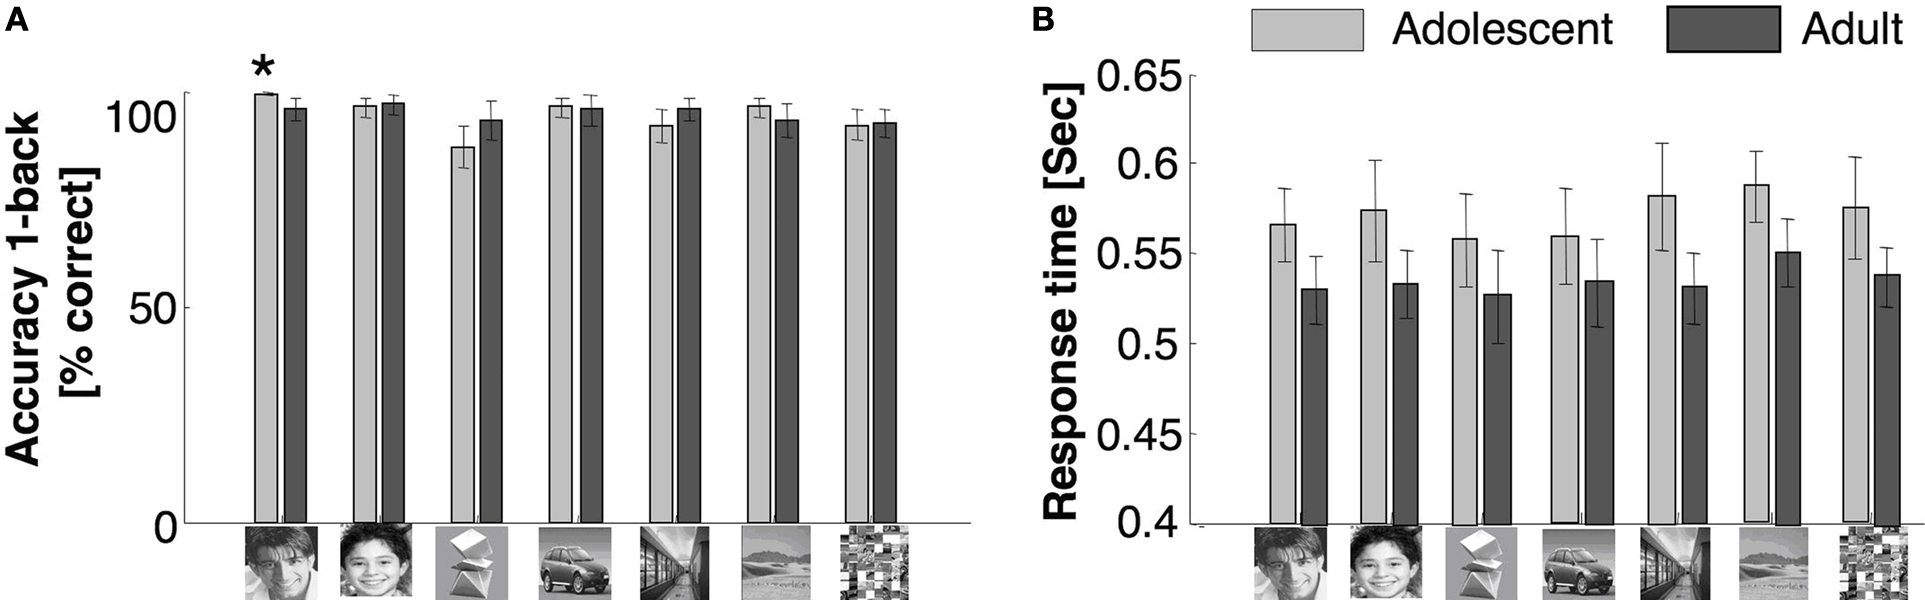
Figure 1. Behavioral data during scan. (A) Accuracy and (B) response times in a 1-back task during the scan. Light gray: adolescents ages 12–16 years; Black: adults ages 18–40 years. Error bars show standard error of mean (SEM) for each age group. Asterisk indicates significantly higher accuracy in adolescents than adults (P < 0.05, t-test).
Data analysis
All imaging data were analyzed using MATLAB and our in-house software, mrVista2.
Structural MRI
High-resolution anatomical whole brain images from each subject from four scans were averaged into one volume. Using an in-house version of ITK-SNAP
2
, white and gray matter were segmented. For each subject, the cortical surface was grown to include 4 mm of gray matter, creating a uniform whole brain gray matter thickness in all subjects. The total volume of this gray matter in the right hemisphere was significantly higher among adolescents than in adults (Figure 2
E, right: t23 = 2.16, P = 0.04, left: t23 = 1.62, P = 0.13), suggesting a higher surface area in adolescents, which is consistent with several reports of gray matter decrease during this period of development (Sowell et al., 2002
), especially in the prefrontal cortex. In contrast, the gray matter volume in an anatomical ROI of the VTC was similar among age groups (Ps > 0.6, Figure 2
D, see below).
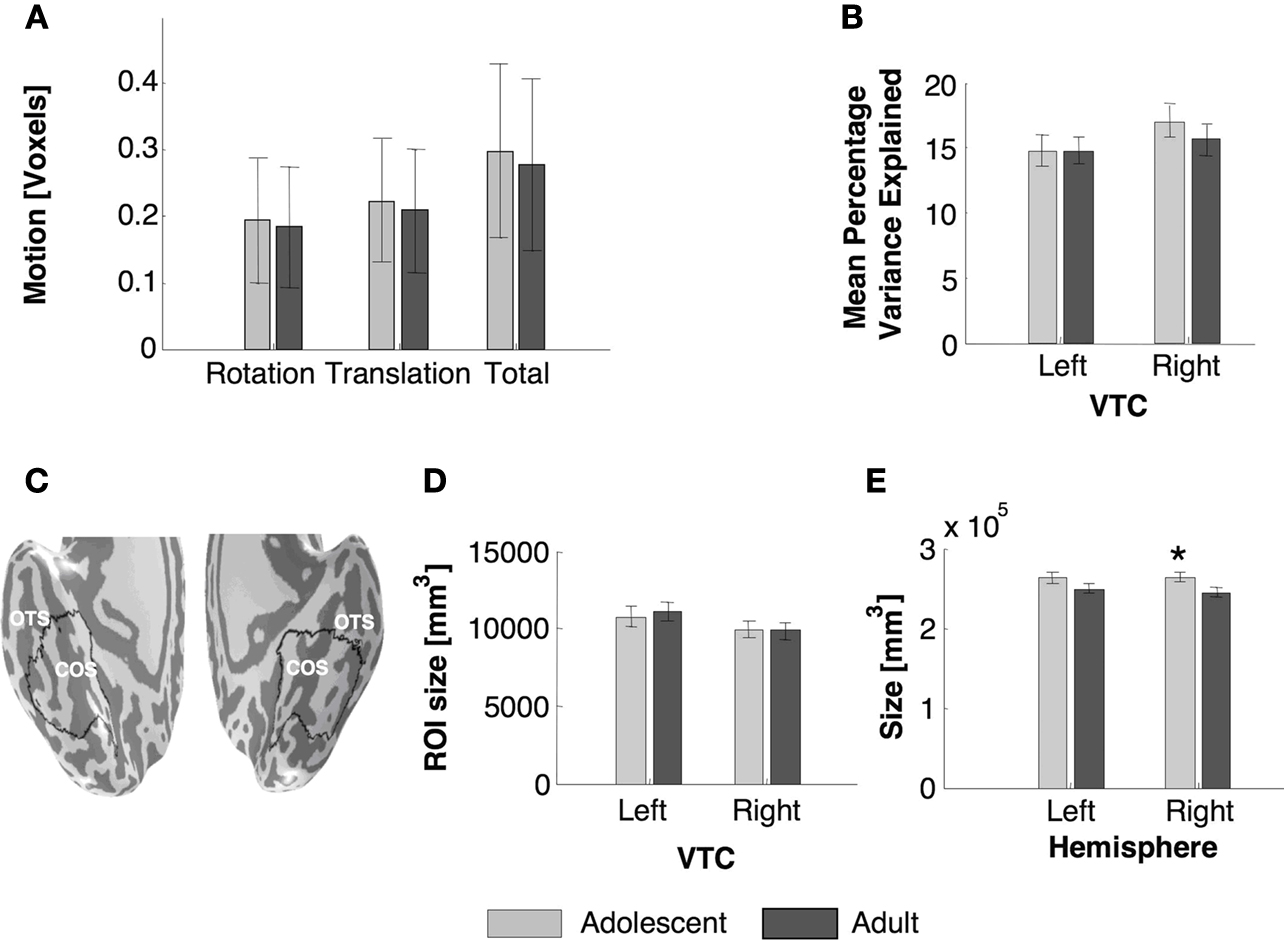
Figure 2. Measurements of BOLD-related confounds and anatomical size of VTC and total hemispheric gray matter across age groups. (A) Motion during scan for each age group. (B) Average variance explained by the GLM model in the anatomical ROI of ventral temporal cortex (VTC) as shown in (C). The variance explained was measured for each voxel and then averaged across the ROI and across subjects. (C) Representative VTC ROI in an adolescent, OTS: occipito-temporal sulcus; CoS: collateral sulcus. (D) Average volume of the VTC in each age group. (E) Average volume of the total gray matter in each hemisphere for each age group. All bars represent the average across each age group (11 adults and 14 adolescents), error bars show standard error of the mean (SEM) for each age group. Asterisk indicates significantly higher volume in adolescents than adults (P < 0.05, t-test).
Preprocessing
In-plane anatomical images were aligned to the high-resolution 3D whole brain images using a rigid body transformation, and the same transformation was applied to the functional images. Functional images were motion corrected and motion parameters were estimated for each participant. The participants’ motion was typically less than a voxel and there was no significant difference in total within-scan motion across adults and adolescents (t23 = 0.28, P = 0.8, Figure 2
A). Data were then detrended using a temporal high-pass filter with a 1/20 Hz cutoff. The time course of each voxel was converted to percent signal change by dividing the response amplitude at each TR by the mean amplitude of blanks. Data were not spatially smoothed.
General linear model
Standard general linear model (GLM) analyses were used to create voxel-by-voxel activation maps (Figures 3
, 6
A and 7
A). Predictors were the stimulus conditions convolved with the hemodynamic impulse response function (HRF) used in SPM2
3
. We estimated the BOLD response amplitudes for each stimulus category by computing the beta coefficients from a GLM applied to the preprocessed time course. We calculated three separate GLMs: (i) GLM of data concatenated from both runs (ii) GLM of run 1 alone and (iii) GLM of run 2 alone.
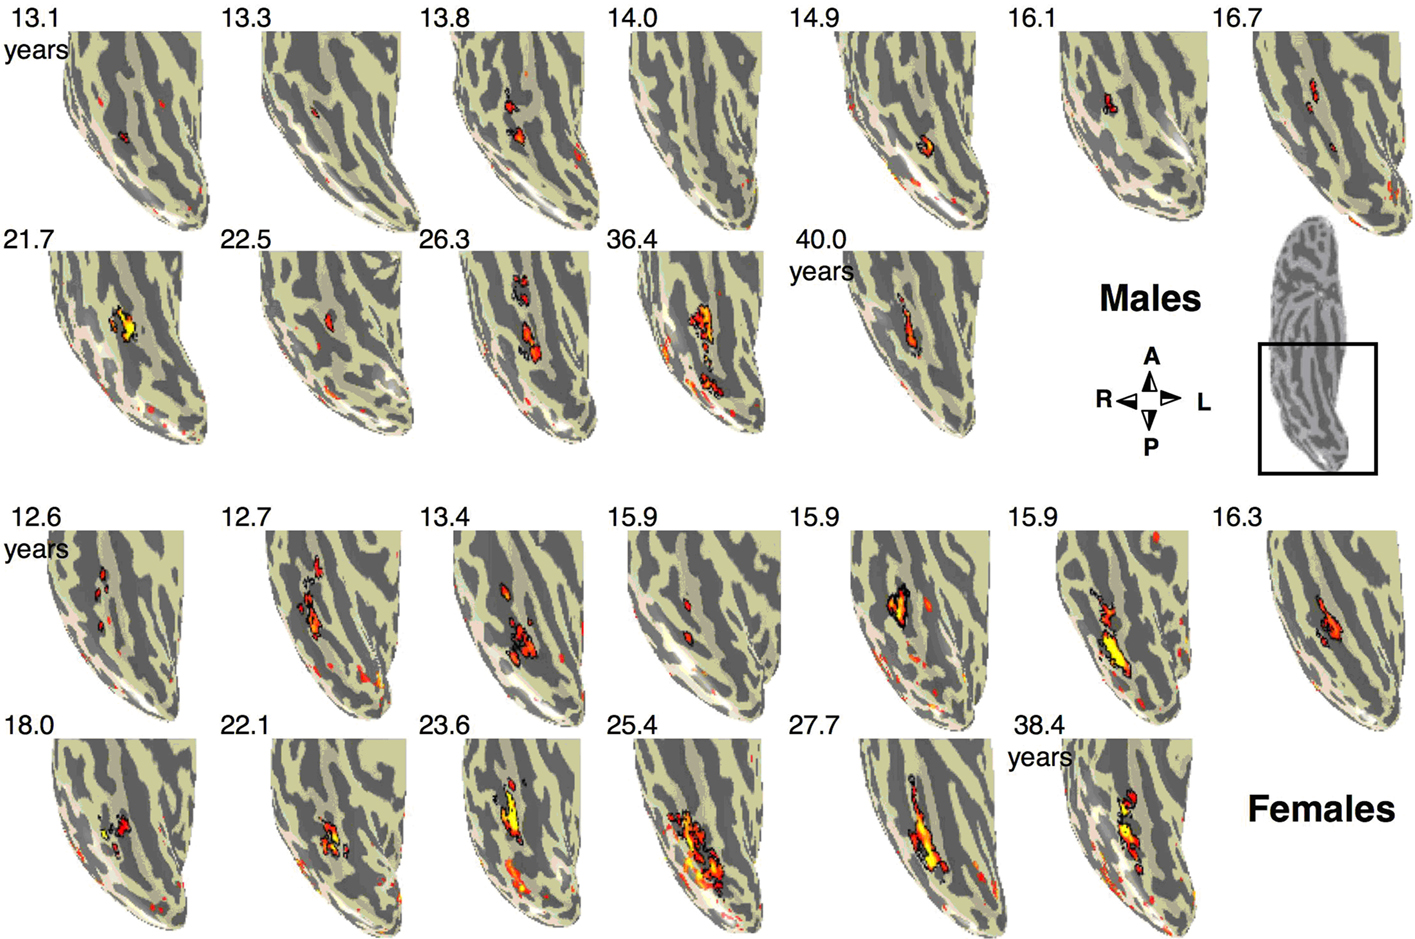
Figure 3. Face selective activations in the right fusiform gyrus for each of the 25 subjects. Face selective activations for the contrast man and boy > cars and abstract objects, P < 10–3, uncorrected, are projected on the inflated cortical surface of each individual from the right hemisphere for all subjects in the study. Brain images show the posterior aspect of the ventral surface of the right hemisphere as indicated by the inset in a sample brain on the right. Numbers indicate subjects’ age in years. The boundaries of the FFA are shown in black. Compass orients to anterior (A), posterior (P), right (R) or left (L). Top two rows show males’ and bottom rows show females’ brains.
ROI creation
Three types of ROIs: anatomical, functional-cluster, functional-non-cluster were created for each subject. (1) Anatomical ROIs of the right and left VTC were defined as a region between the lateral border of the occipito-temporal sulcus (OTS), the medial border of the parahippocampal gyrus and the anterior edge of the retinotopic regions V1 to V4. Measuring from this caudal border, the ROI extended in the anterior direction to include approximately 2/3 of the remaining extent of the temporal lobe’s ventral surface. This ROI was restricted to include only regions with substantial mean BOLD signals (raw scanner values > 1000) in order to exclude regions of signal drop off due to susceptibility artifacts behind the ear canal (Figure 2
C). Anatomical ROIs were created by GG and evaluated by two other observers (KGS, AL). There were no between age group differences in the volume of the right or left VTC (Ps > 0.7, Figure 2
D). The size of the left VTC was larger among males than females (left VTC: F1,21 = 4.12, P < 0.03 one-tailed), but there were no interactions between factors of age and gender (P = 0.99). (2) Functional Cluster ROIs were based on a GLM applied to data from run 1 and run 2 and were defined in each subject as one or more contiguous supra-threshold voxels as follows: (a) Face selective ROIs were defined along the fusiform gyrus, often overlapping with the OTS. Three separate face selective ROIs were defined using each of the following contrasts: (i) FFA: man and boy > cars and abstract objects, P < 10–3; (ii) Man faces > cars and abstract objects, P < 10–3; (iii) Boy faces > cars and abstract objects, P < 10–3. Two additional ROIs were created to determine the non-overlapping regions of the latter two ROIs. (b) pFus/OTS: An object selective region overlapping the posterior fusiform gyrus and OTS was defined as cars and abstract objects > scrambled, P < 10–3. (c) PPA: A place selective ROI overlapping the collateral sulcus and the parahippocampal gyrus was defined as indoor and outdoor scenes > cars and abstract objects, P < 10–3. (3) Functional Non-cluster ROIs were based on a GLM applied to data from run 1 and included all supra-threshold voxels (regardless of clustering) within the VTC for the contrast of interest at five statistical thresholds (10–2 < P < 10–6).
Measure of BOLD-related noise and goodness of fit
We estimated the percentage variance of the time course explained by the GLM (from concatenated runs 1 and 2) in each voxel as:

We then calculated the mean variance explained across the anatomical ROI of VTC (Figure 2
B) in each subject. There were no between group differences in the variance explained by the GLM across age groups (Figure 2
B) indicating that our hemodynamic model is adequate for both adult and adolescent data.
Mean response across ROIs
To provide an unbiased estimate of response amplitudes we used data from run 1 to define the ROI and data from run 2 to estimate response amplitudes. Using run 1 data, we defined functional non-cluster ROIs within the VTC as all the voxels in the VTC that passed the threshold of P < 10–3 for each of the following contrasts: (1) Man and boy > cars and abstract objects (Figure 5
). (2) Cars and abstract objects > scrambled (Figure 8
). (3) Indoor and outdoor > cars and abstract objects (Figure 9
). Using run 2 data, we calculated the percent signal change based on the beta estimates from the GLM for each condition relative to the blank baseline from the supra-threshold voxels.
Mean category selectivity across ROIs
To provide an unbiased estimate of category selectivity, we used data from run 1 to define face-, object- and place selective functional ROIs (see above), and data from run 2 to estimate the mean t-value for the relevant GLM contrast across the supra-threshold voxels (Figure 5
B).
Multivoxel pattern (MVP) analyses
We determined the multivoxel distributed pattern (MVP) of response to each stimulus type in the anatomical ROI of VTC by calculating at each voxel the relative response amplitude to the stimulus type (i) as  where βi is the beta coefficient from the GLM for the i-th stimulus, E(β) is the mean of all βs, σ is the square-root of the residual variance of the GLM and df is the degrees of freedom. No thresholding or spatial smoothing was applied. Using Z-scores minimizes between-voxel effects. That is, the MVP reflects differences in category selectivity in each voxel, rather than amplitude differences across voxels. For each stimulus type, MVPs were generated across the anatomical ROI of VTC, separately for data from run 1 and run 2 (Figure 10
A). Each MVP was represented as a vector of length n, where n is the number of voxels in each subject’s VTC. For each subject we calculated the Pearson correlation (r) between these vectors from run1 vs. run 2 for each pairing of categories. Within-stimulus type correlations represent the reproducibility of the MVPs between run 1 and run 2 (which used different stimuli): rw(i) = correlation [MVPi(run1), MVPi(run2)], where MVPi is the vector representing the Z-scores across VTC voxels in response to stimulus type i. Between-stimulus correlations were calculated in a similar manner: rb(i,j) = correlation [MVPi(run1), MVPj(run2)], and reflect the degree of similarity between MVP of different categories. Positive values (rb > 0) indicate similar MVPs, and negative values (rb < 0) indicate distinct activations for different stimuli. Within- and between-stimulus type correlations were calculated for all combinations of stimuli in each subject, and averaged across subjects from each age group (Figures 10
B–D).
where βi is the beta coefficient from the GLM for the i-th stimulus, E(β) is the mean of all βs, σ is the square-root of the residual variance of the GLM and df is the degrees of freedom. No thresholding or spatial smoothing was applied. Using Z-scores minimizes between-voxel effects. That is, the MVP reflects differences in category selectivity in each voxel, rather than amplitude differences across voxels. For each stimulus type, MVPs were generated across the anatomical ROI of VTC, separately for data from run 1 and run 2 (Figure 10
A). Each MVP was represented as a vector of length n, where n is the number of voxels in each subject’s VTC. For each subject we calculated the Pearson correlation (r) between these vectors from run1 vs. run 2 for each pairing of categories. Within-stimulus type correlations represent the reproducibility of the MVPs between run 1 and run 2 (which used different stimuli): rw(i) = correlation [MVPi(run1), MVPi(run2)], where MVPi is the vector representing the Z-scores across VTC voxels in response to stimulus type i. Between-stimulus correlations were calculated in a similar manner: rb(i,j) = correlation [MVPi(run1), MVPj(run2)], and reflect the degree of similarity between MVP of different categories. Positive values (rb > 0) indicate similar MVPs, and negative values (rb < 0) indicate distinct activations for different stimuli. Within- and between-stimulus type correlations were calculated for all combinations of stimuli in each subject, and averaged across subjects from each age group (Figures 10
B–D).Analysis of inter-subject similarity of correlation matrices
Each subject’s MVP correlation matrix showing the correlations between MVPs in run 1 and 2 (as in Figure 10
B, but for each subject) was transformed to a vector of length 36 (number of elements in the MVP correlation matrix). We then calculated the correlation between each pair of subjects’ vectors. This inter-subject correlation reflects the degree of similarity between the MVP correlation matrices across subjects.
Experiment 2
Subjects participated in several behavioral tasks outside the scanner, usually on a different day from the fMRI session. The memory recognition task was most often administered within ∼2 weeks of fMRI (often prior to fMRI and during the scanner simulator session). The other behavioral tests were administered after fMRI (on average 96 days later).
Recognition memory task
During encoding, subjects viewed eight images (never seen before) of the same types used in the fMRI experiment: faces of men and boys, cars and abstract sculptures, and scenes. All stimuli were gray-scale images similarly prepared as in Experiment 1 and presented in random order. Subjects were instructed to perform a one-back task while viewing the images. Subjects performed an unrelated visual task for approximately 5 min by viewing a black and white rotating wedge, while fixating on a central point and responding when the fixation point changed color. Next, during a surprise self-paced subsequent recognition memory test, subjects were presented with all the images from the encoding session plus an equal number (eight) of new images per category. Image categories and old and new pictures were randomly presented. Subjects were instructed to indicate whether or not they had seen the image before by pressing one of two buttons, as accurately and quickly as possible. In the few cases where the recognition memory task was administrated after fMRI, subjects were informed that none of the images were from the previous fMRI session. Accuracy for the subsequent recognition memory task was calculated separately per image category and subject:

Benton facial recognition task (Psychological Assessment Resources, Inc.)
This test measured subjects’ proficiency in perceptual recognition of facial identity and had no memory component. Subjects were presented with one target photo and six comparison photos simultaneously. We asked subjects to make a perceptual judgment based on the identity of the individual in the target photo. All stimuli were black and white photographs of adults of both genders. The task became progressively harder as the viewing angle or lighting was manipulated in the six comparison photographs. Subjects received one point for each correct match (54 total possible points). We report the percentage of total correct trials for each subject. No age or education correction was used. Adults performed significantly better than adolescents on this task (P < 0.001, t-test, Table 1
).
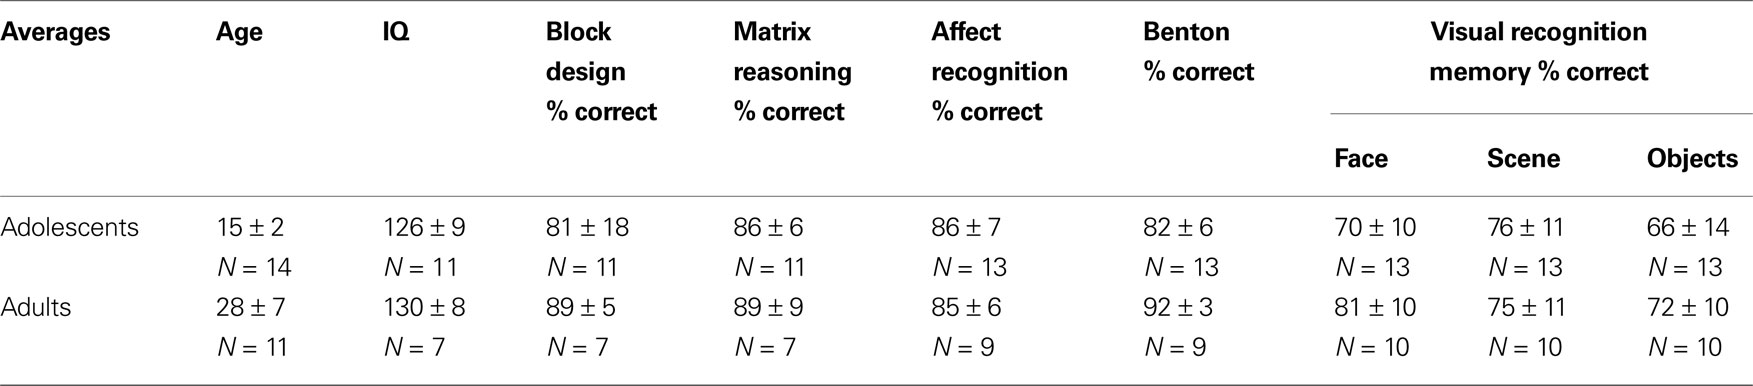
Table 1. Subject demographic information and behavioral task performance: Data are split by age group. Sample size (N) is indicated for each measure (mean ± standard deviation).
NEPSY-II affect recognition task (Harcourt Assessment, Inc.)
This test is designed to measure proficiency in perceptual recognition of facial affect using children’s faces. Subjects were shown color photographs of child faces and asked to make a judgment based on the emotional expression of the individual in the target photo, ignoring identity. Photographs included both genders and several races. This task included both perceptual and memory components, in which subjects were asked either to match photographs based on emotion, or to remember an emotion and subsequently (∼5 s later) match test images to the remembered emotion. Subjects received a point if they correctly matched all affect photos per trial (35 total possible points). The total percentage of correct trials was reported for each subject. There were no differences in performance between adults and adolescents (P > 0.97, Table 1
).
Wechsler abbreviated scale of intelligence (WASI, Harcourt Assessment, Inc.)
This test was used to measure IQ and compare groups. Subjects received three IQ scores (Full Scale IQ, Performance IQ, and Verbal IQ) based on four subtests: Vocabulary, Block Design, Similarities, and Matrix Reasoning. Each of the four subtests tested a different component of intelligence (i.e. verbal knowledge, spatial reasoning, etc.) and was normalized by age. Performance IQ was calculated using the Performance Scale, which was composed of Block Design and Matrix Reasoning scores. Verbal IQ was calculated using the Verbal Scale, which was composed of Vocabulary and Similarities scores. There were no differences in Full-Scale IQ (P > 0.36), Performance IQ (P > 0.11), or Verbal IQ (P > 0.96) between adults and adolescents.
Statistical methods for between age group comparisons
Subjects’ data were averaged for each of the age groups. Between group differences were evaluated by a two-tailed ANOVA, repeated measures ANOVA and t-tests, unless otherwise noted.
For between group comparisons of the size of the functional or anatomically defined ROIs, we used one- or two-way ANOVAs with the factors of age and (in some cases) gender. For between group comparisons of the size of the functional ROIs, subjects who showed no activations fulfilling the definition of the particular functional ROI were assigned zero for the size of the ROI and included in the analysis. When there was a significant between group difference in the estimates of variance, we report the adjusted T and P values and indicate “non-equal”. For between group comparisons of BOLD responses to the various image categories within ROIs, we used a GLM, with responses across categories as the within-participant repeated measure and report the relevant F and P values (Figures 5
A, 8
B and 9
B). Where we found a significant interaction between the factors of group and stimulus type, we used subsequent t-tests to determine which stimulus types were significantly different between groups.
The Volume and Response Amplitudes of the Fusiform Face Area (FFA) in Adolescents and Adults
To examine the hypothesis that the FFA continues to develop during adolescence, we measured the volume of the FFA across adults and adolescents (see Materials and Methods). We defined the FFA in each subject as clusters of voxels within the fusiform gyrus (sometimes overlapping the OTS) that responded more to faces than to objects (man and boy > cars and abstract objects, P < 10−3, uncorrected). We found the FFA in 11/11 adults and 14/15 adolescents (see Figure 3
). The right FFA’s volume was significantly larger in adults than in adolescents by about 1.7 fold (t15 = 2.47, P = 0.028, non-equal variance; Figure 4
A) and was correlated with subjects’ age (r = 0.55, P = 0.004, Figure 4
B). There was a similar trend in the left FFA (lFFA), but between age group differences were not significant (t23 = 1.28, P = 0.21, Figure 4
A). Nevertheless, there was a significant correlation between lFFA’s volume and age (r = 0.41, P = 0.04, Figure 4
B).
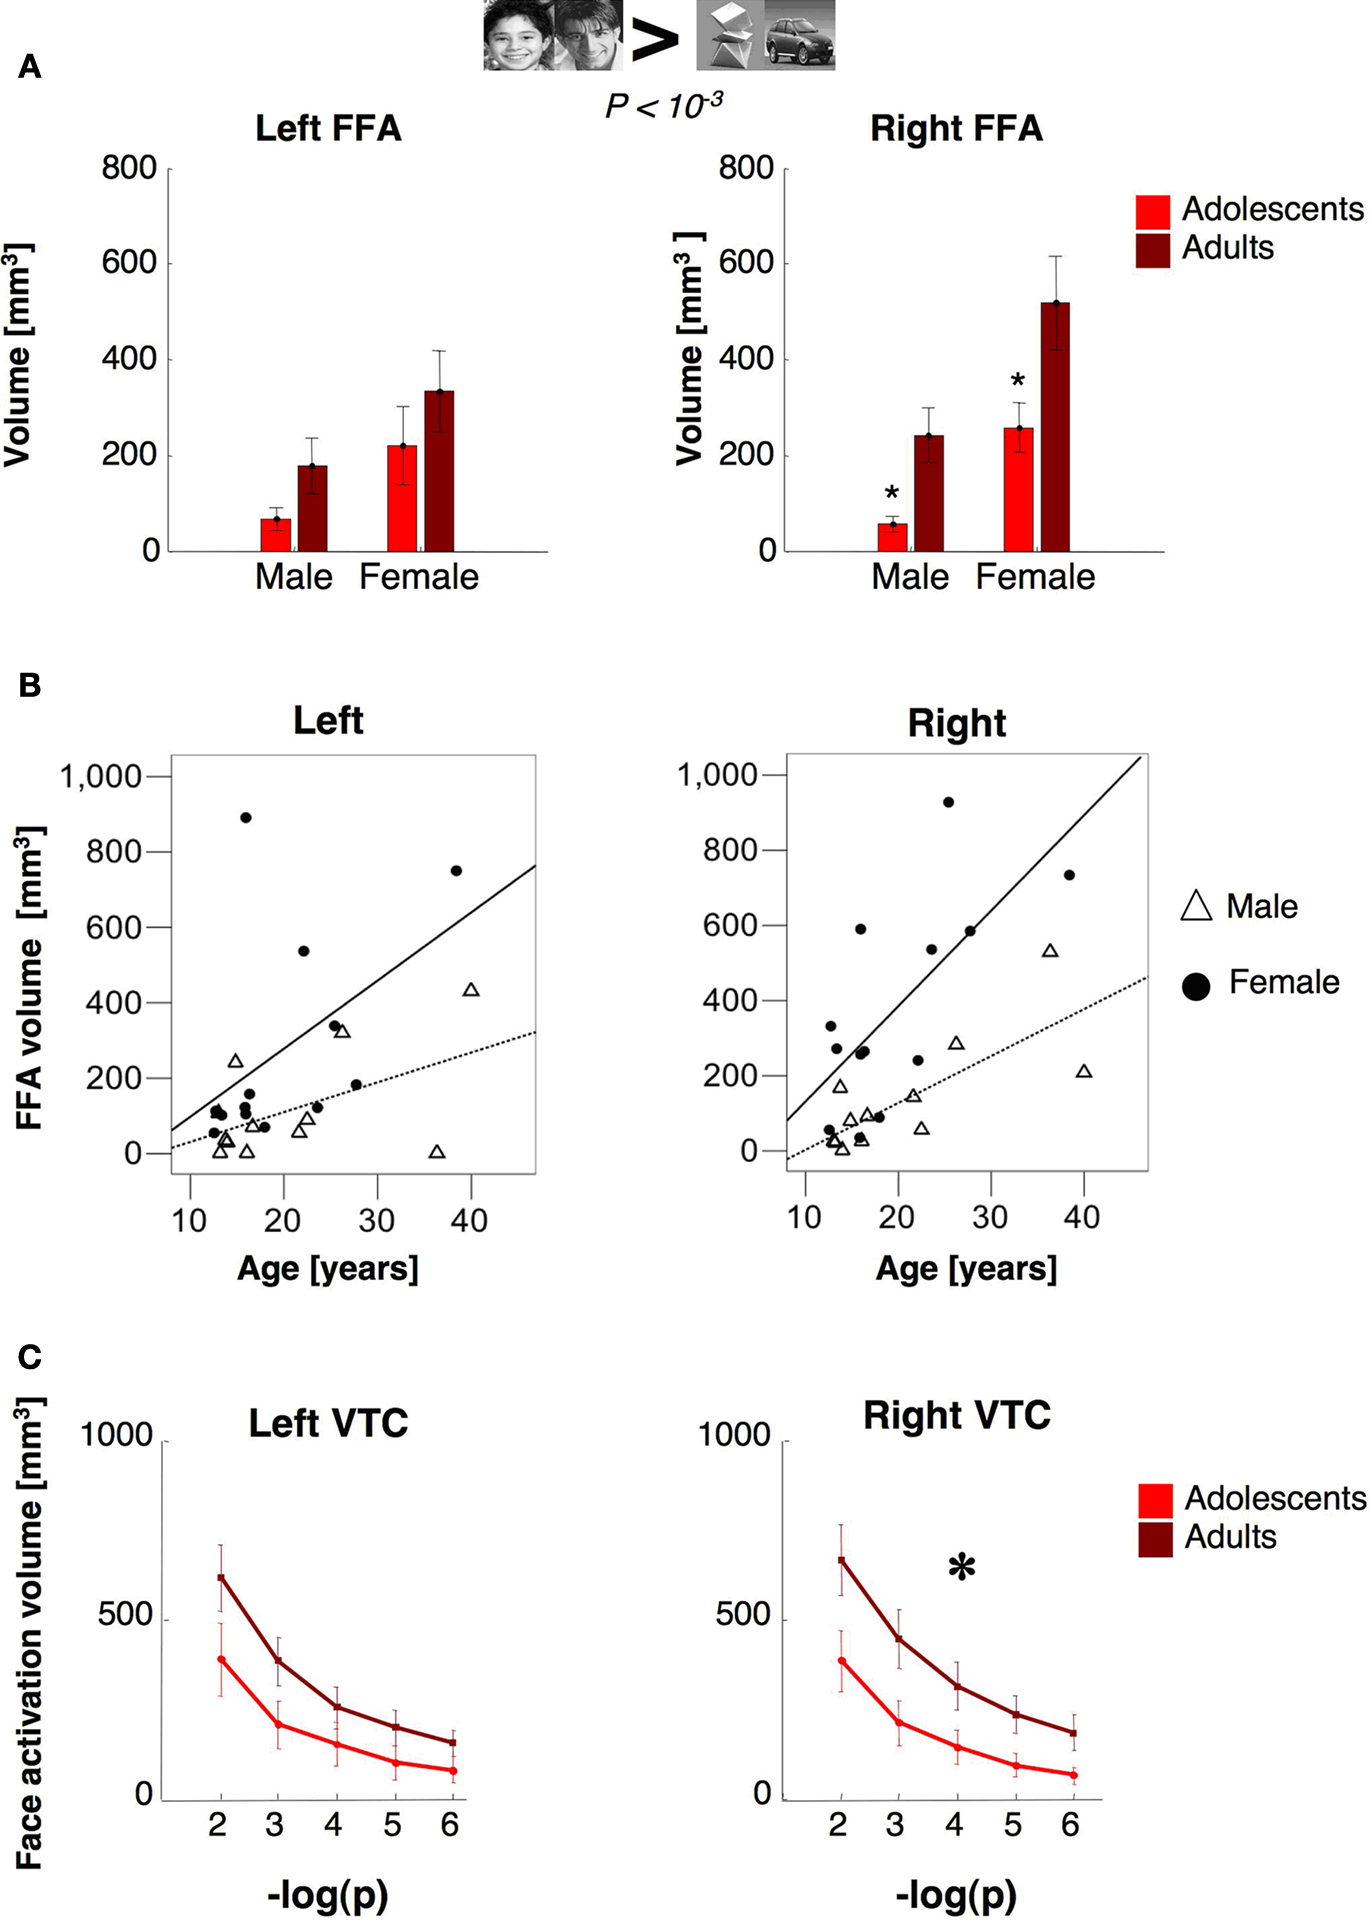
Figure 4. FFA volume as a function of age and gender. (A) The volume of the FFA (man and boy > cars and abstract objects, P < 10–3, uncorrected) as a function of age and gender. Bars show the volume of the FFA, as defined in Figure 3
, averaged across 14 adolescents (ages 12–16 years, light red) and 11 adults (18–40 years, dark red). Error bars show group SEM. Asterisks indicate significantly smaller volume than adults (P < 0.05, t-test across age groups). (B) The correlation between age and FFA volume among males and females in each hemisphere (rFFA vs. age in females: r = 0.69, P = 0.009; in males: r = 0.76, P = 0.004; lFFA vs. age in females: r = 0.48, P = 0.09; in males: r = 0.52, P = 0.08). Open triangles: males, n = 12; Filled circles: females n = 13. (C) The total volume of face selective voxels in VTC, defined as man and boy > cars and abstract objects at five different statistical thresholds (minus logarithm base 10). Volumes are measured irrespective of voxel contiguity. Light red: adolescents (ages 12–16, n = 14); dark red: adults (ages 18–40, n = 11). Error bars show group SEM (11 adults and 14 adolescents). Large asterisk indicates significantly larger volume in adults, P < 0.02, repeated measures ANOVA).
We asked if age-related changes in FFA volume varied with subjects’ gender. The rFFA volume was significantly larger in females than males in both age groups (rFFA: t19 = 2.78, P = 0.01, unequal variance). Thus, rFFA volume was determined by each of the factors of gender (F1,24 = 8.74, P = 0.008) and age (rFFA: F1,24 = 7.65, P = 0.012), but there was no significant age by gender interaction (P = 0.65). Furthermore, rFFA volume was significantly correlated with age within each of the gender groups (in females: r = 0.69, P = 0.009; in males: r = 0.76, P = 0.004, Figure 4
B). The lFFA was also larger among females than males (lFFA: t18 = 1.78, P = 0.04, one-tailed t-test, unequal variance). However, there were no significant effects of age (P = 0.23) or interaction between age and gender (P = 0.9). Although the correlation between lFFA volume and age was significant when all subjects were included, this correlation did not reach significance in either gender when examined separately (Ps > 0.08, Figure 4
B). Thus, the spatial extent of the rFFA increased with age from adolescence to adulthood in both genders.
Next, we tested if adolescents’ smaller rFFA reflected less clustering of face selective voxels, or depended on threshold. We measured the total volume of face selective activations regardless of voxel contiguity at five different thresholds (10–6 < P < 10–2, uncorrected) in an anatomical ROI of the ventral temporal cortex (VTC, see Materials and Methods). In the right VTC, the total volume of face selective activation was significantly higher in adults than in adolescents (F1,23 = 5.8, P = 0.02; repeated measures ANOVA Figure 4
C), and at every threshold tested (P < 0.033, t-test). In the left VTC, however, between age group differences in the overall volume of face selective activations did not reach statistical significance (F1,23 = 2.60, P = 0.12; Figure 4
C). Thus, the total volume of face selective activations was significantly higher in the right VTC of adults than in adolescents, regardless of clustering or statistical threshold.
Response Amplitudes of Face Selective Activations in VTC
We asked if in the face selective regions of VTC, response amplitudes to visual stimuli varied with age group. For each subject, we defined the face selective voxels (man and boy > cars and abstract objects, P < 10−3) in the VTC using data from run 1 and measured response amplitudes from run 2 data (Figure 5
A, see Materials and Methods). Face selective voxels were found in run 1 in the right and left hemisphere of all subjects except the left hemisphere of one adolescent. In both age groups, response amplitudes revealed face selectivity, namely higher responses to faces than other stimuli (Figure 5
A). The overall response amplitudes in face selective voxels of the right VTC were not significantly different between age groups (F1,21 = 1.4, P = 0.24) or genders (F1,21 = 1.8, P = 0.2). However, there was a significant interaction between age and condition (F1,23 = 9.37, P = 0.006), as responses to faces were higher in adults than in adolescents (t23 = 1.7, P = 0.05, one-tailed). There were no interactions between age-of-subject and age-of-face stimuli (F1,21 = 1.29, P = 0.27). Importantly, there were no significant differences between age groups in response amplitudes to non-face stimuli (Ps > 0.13), indicating that between age group differences were specific to responses to faces.
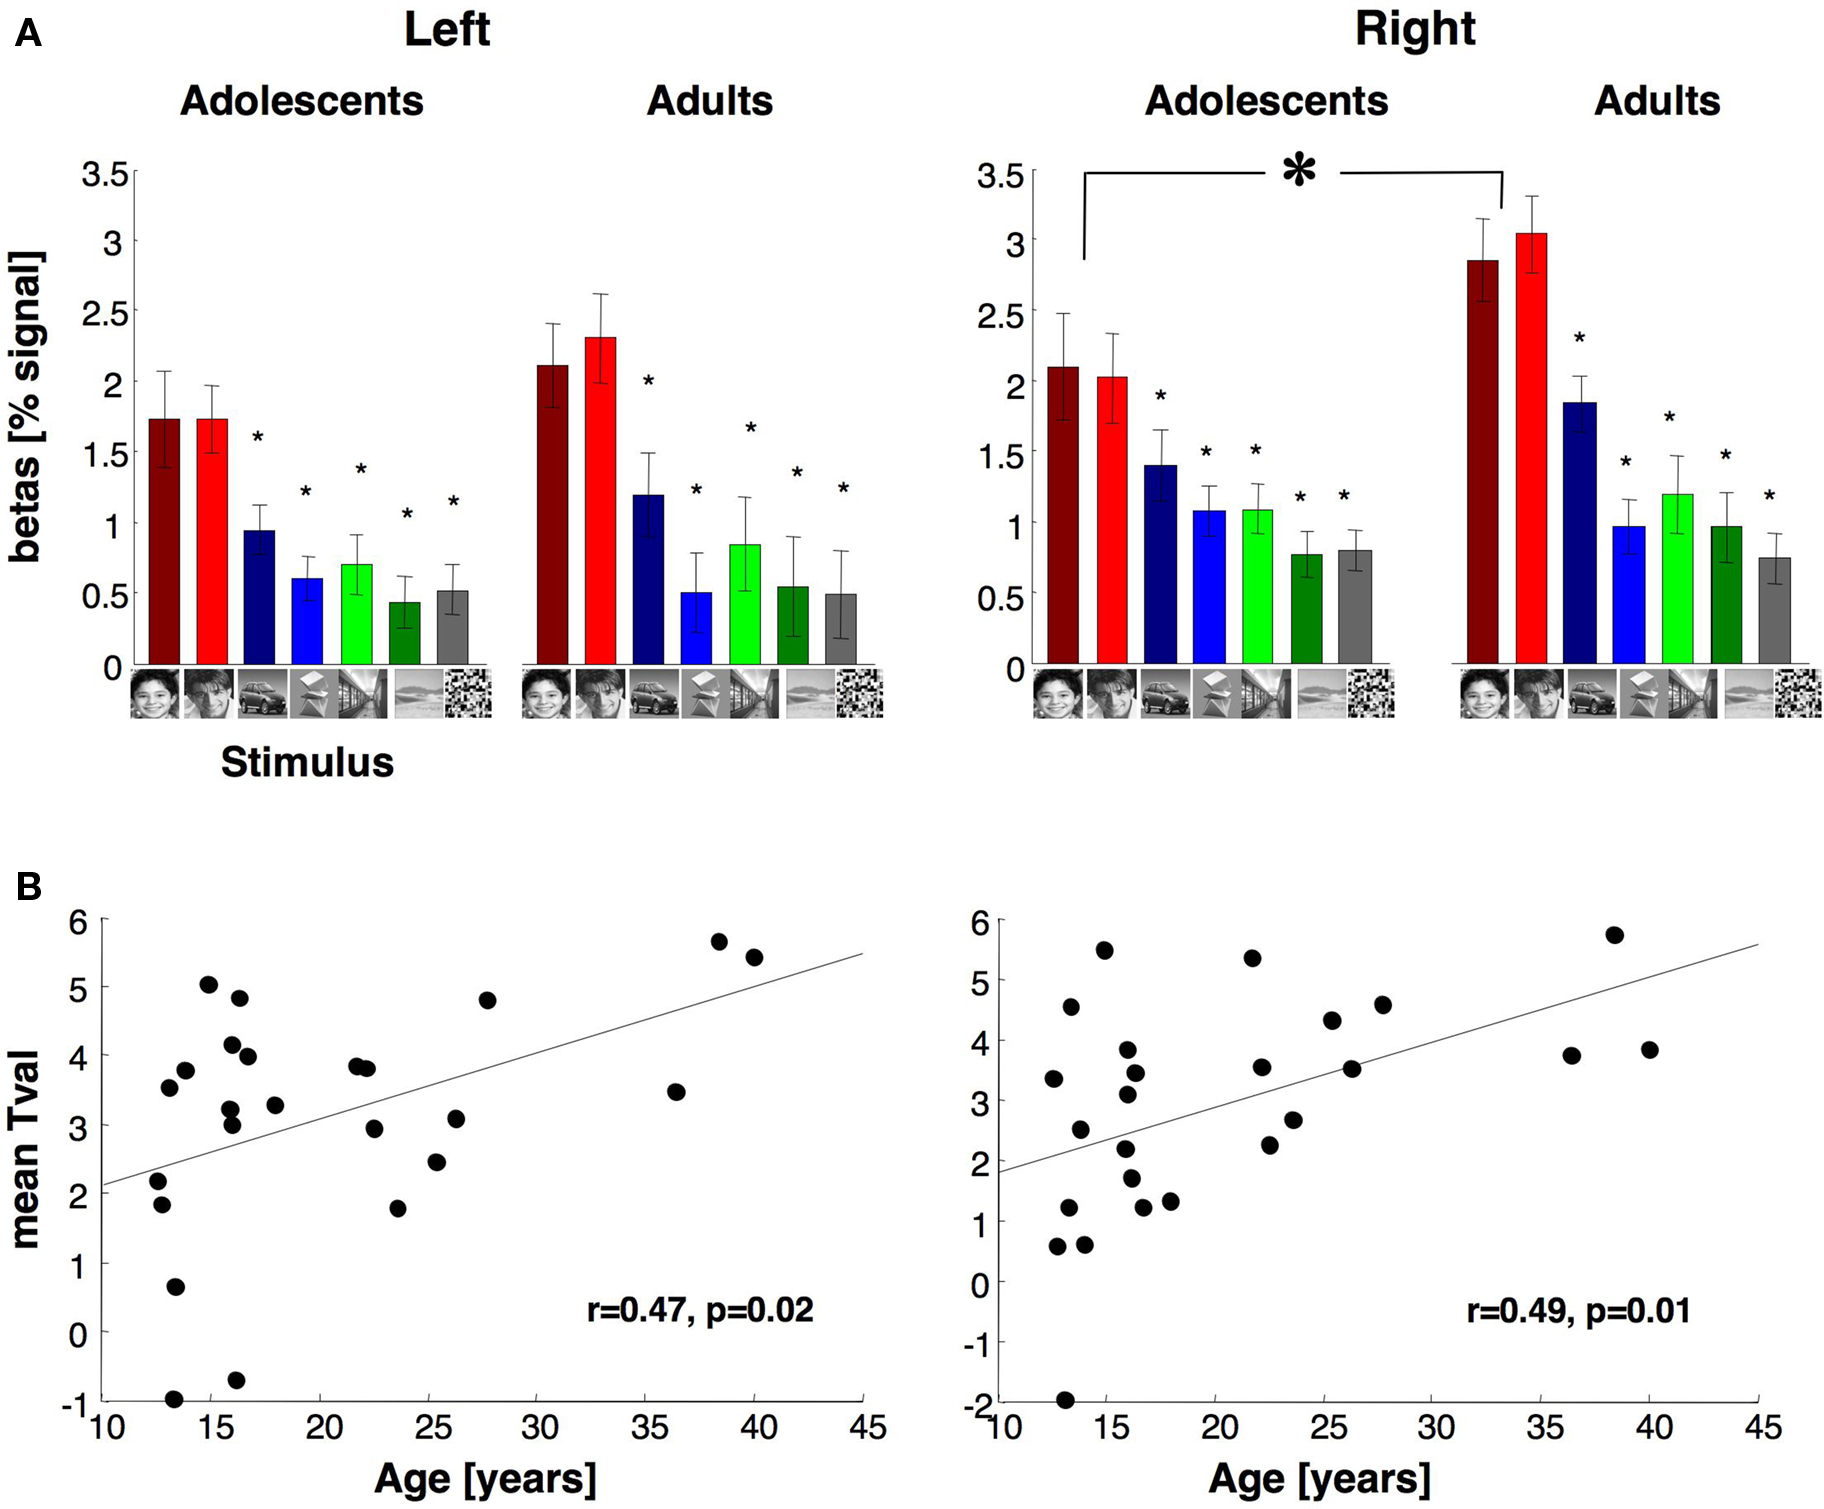
Figure 5. Average response to different stimuli and face selectivity within face selective regions of fusiform gyrus. (A) Average responses to different image categories (relative to the blank baseline) of face selective voxels during run 2. Data are averaged across 14 adolescents and 11 adults in the right hemisphere and 13 adolescents and 11 adults in the left hemisphere. Face selective voxels were independently defined using run 1 data with the contrast: man and boy > cars and abstract objects, P < 10–3, uncorrected. Error bars indicate SEM across subjects. Small asterisks indicate responses that are significantly less than faces (P < 0.05, t-test across subjects) and are corrected for multiple comparisons using Bonferroni correction. Large asterisk indicates significantly lower responses to faces in adolescents than adults (P < 0.05, t-test across subjects). (B) Face selectivity is plotted as a function of age. Each point represents a subject’s mean t-value for the contrast faces vs. objects from run 2 data across all face selective voxels in VTC as in (A).
In the left VTC, the response amplitudes of face selective voxels were not significantly different across age groups (F1,20 = 0.32, P = 0.58) or genders (F1,20 = 0.00, P = 0.99), and there was no significant interaction between factors of age and gender (F1,20 = 0.02, P = 0.88, Figure 5
A).
The between age group differences in the response magnitude to faces suggests that face selectivity may be higher in adults than in adolescents. To test this possibility, we measured each subject’s mean selectivity to faces using run 2 data from the face selective voxels defined by run 1 data, as above. The mean selectivity was defined as the mean t-value across all face selective voxels for the contrast man and boy > cars and abstract objects in run 2. The mean t-value was higher in adults (right: 3.7 ± 1.3, left: 3.7 ± 1.2, mean selectivity ± std deviation) than in adolescents (right: 2.3 ± 1.98, left: 2.64 ± 2, mean selectivity ± std deviation). These differences reached statistical significance in the right hemisphere (right: t23 = 2.1, P = 0.02; left: t23 = 1.5, P = 0.07, one-tailed test). Furthermore, there was a significantly positive correlation between subjects’ age and the mean face selectivity in both hemispheres (right: r = 0.49, P = 0.01; left: r = 0.47, P = 0.02, Figure 5
B). In sum, development of face selective activations during adolescence manifests as an increase in the total volume of face selective regions, as well as increased response amplitude to faces (but not non-faces) in face selective voxels and consequently, increased face selectivity.
Right FFA is Smaller in Adolescents Regardless of Age of Face Stimuli
We asked if the smaller FFA volume in adolescents depends on the choice of face stimuli. In each subject we redefined face selective ROIs, once as the clusters of voxels that responded more to faces of boys than to objects (boy > car and abstract objects, P < 10−3, uncorrected) and separately using men faces (man > car and abstract objects, P < 10−3, uncorrected, Figure 6
A). Both contrasts detected face selective voxels in the fusiform gyrus and OTS with significantly larger rFFA volumes in adults than in adolescents (F1,23 = 4.84, P = 0.04, repeated measures ANOVA, Figure 6
B). However, there was no significant effect of age of face stimulus (P = 0.62) and no interaction between age of face stimulus and age of subject (P = 0.77). Results were similar when we measured the total volume of all supra-threshold voxels in the right VTC across various thresholds (man > cars and abstract objects: F1,23 = 4.6, P = 0.04; boy > cars and abstract objects: F1,23 = 6.58, P = 0.02, repeated measures ANOVA Figure 6
C). In contrast, between age group differences in lFFA volume did not reach statistical significance (F1,23 = 2.22, P = 0.15), regardless of the face stimulus used to define the ROI (Figures 6
B,C). The lFFA volume was larger when defined by faces of boys rather than men, across all subjects (F1,23 = 6.49, P = 0.02, Figure 6
B). However, there was no interaction between age of face stimulus and age of subject (P = 0.96). Thus, age of face stimuli did not determine between age group effects on the volume of face selective activations in VTC.
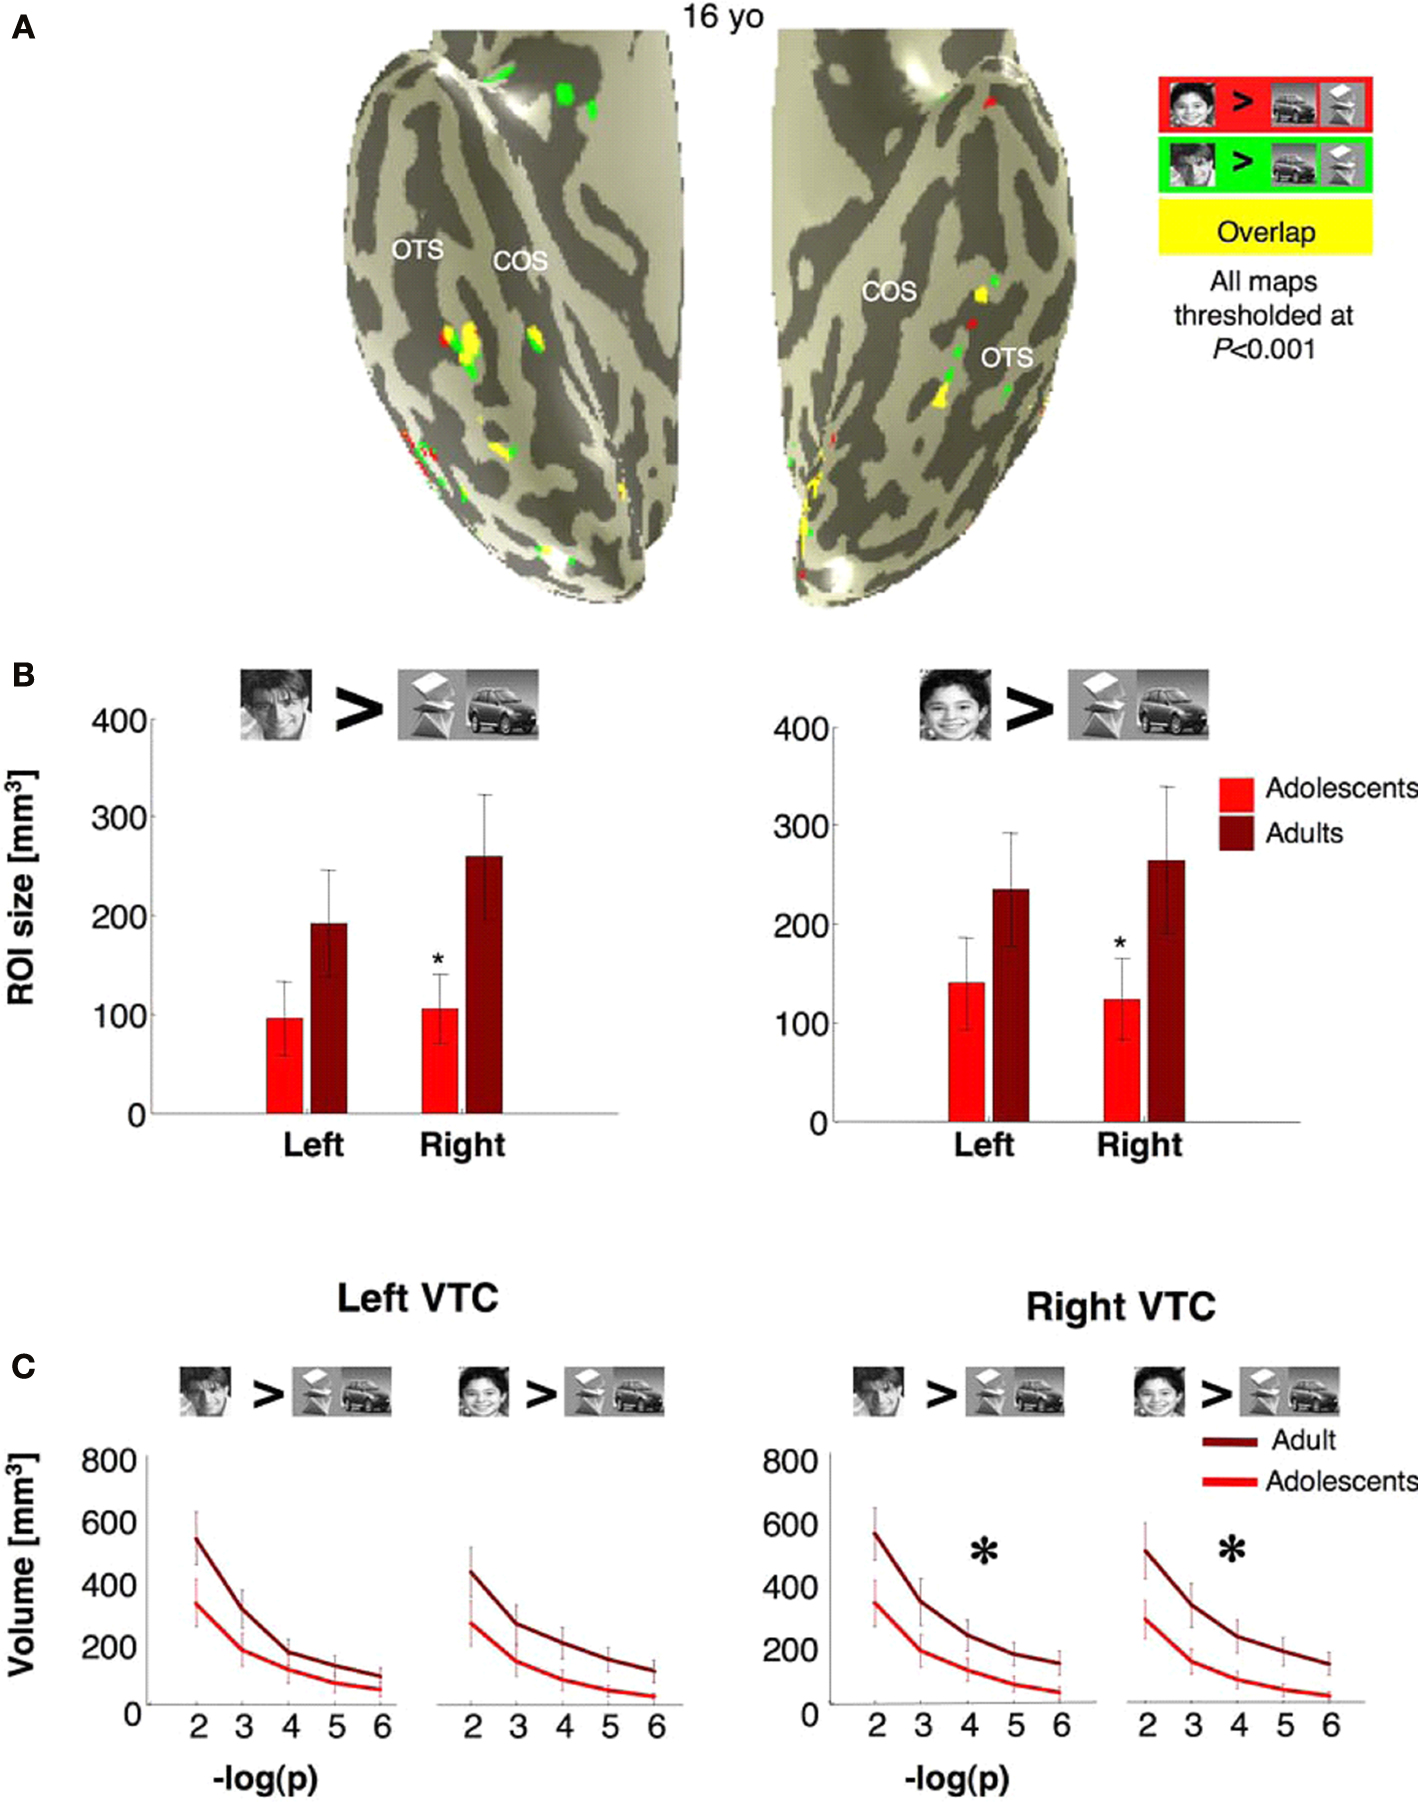
Figure 6. Volume of face selective activations defined using either man or boy faces. (A) Activation maps for boy selective voxels (boy faces > cars and abstract objects, P < 10–3), red, man selective voxels (man faces > cars and abstract objects, P < 10–3), green, and overlapping voxels (yellow). Data are shown for a representative adolescent brain. (B) Average volume of the cluster of voxels defined by the same contrasts as in (A). Error bars show group SEM. (C) The volume of all man selective or boy selective voxels in the VTC regardless of contiguity at five different statistical thresholds (10–2 to 10–6, uncorrected). Light red: adolescents (ages 12–16 years, n = 14); dark red: adults (ages 18–40 years, n = 11). Error bars show group SEM. Large asterisks indicate significantly larger volume in adults vs. adolescents (P < 0.02, F-test repeated measures ANOVA).
The Spatial Overlap between FFA Regions Selective for Faces of Boys or Men
We asked if the boy and man face stimuli activated spatially segregated regions in the fusiform gyrus, perhaps to varying degrees depending on the subjects’ age. We examined the extent of the spatial overlap between the two ROIs that were separately defined as clusters of activation by faces of men vs. objects (man > cars and abstract object, P < 10−3, uncorrected) or faces of boys vs. objects (boy > cars and abstract objects, P < 10−3, uncorrected). There was approximately 50% overlap between the two ROIs in both age groups (see Figure 6
A). Importantly, there was no interaction between age of subject and the size of the non-overlapping volume that responded more to man faces than objects (but not boy faces than objects) and vice versa, in either hemisphere (Ps > 0.7). Likewise, response amplitudes from these non-overlapping regions showed no significant interactions between age of subject and age of stimulus (P > 0.14). Thus, we found no evidence that the spatial extent, response amplitudes, or spatial location of selectivity depended on the age of face stimuli.
The Volume and Response Amplitudes of Object Selective Activations
We asked if developmental changes in the VTC are specific to face selective regions, or reflect a more general process involving other regions that are selective for non-face categories such as objects and scenes (Figure 7
A). Thus, we measured the volume (Figures 7
B and 8
A) and response amplitudes of object selective activations in the VTC (Figure 8
B).
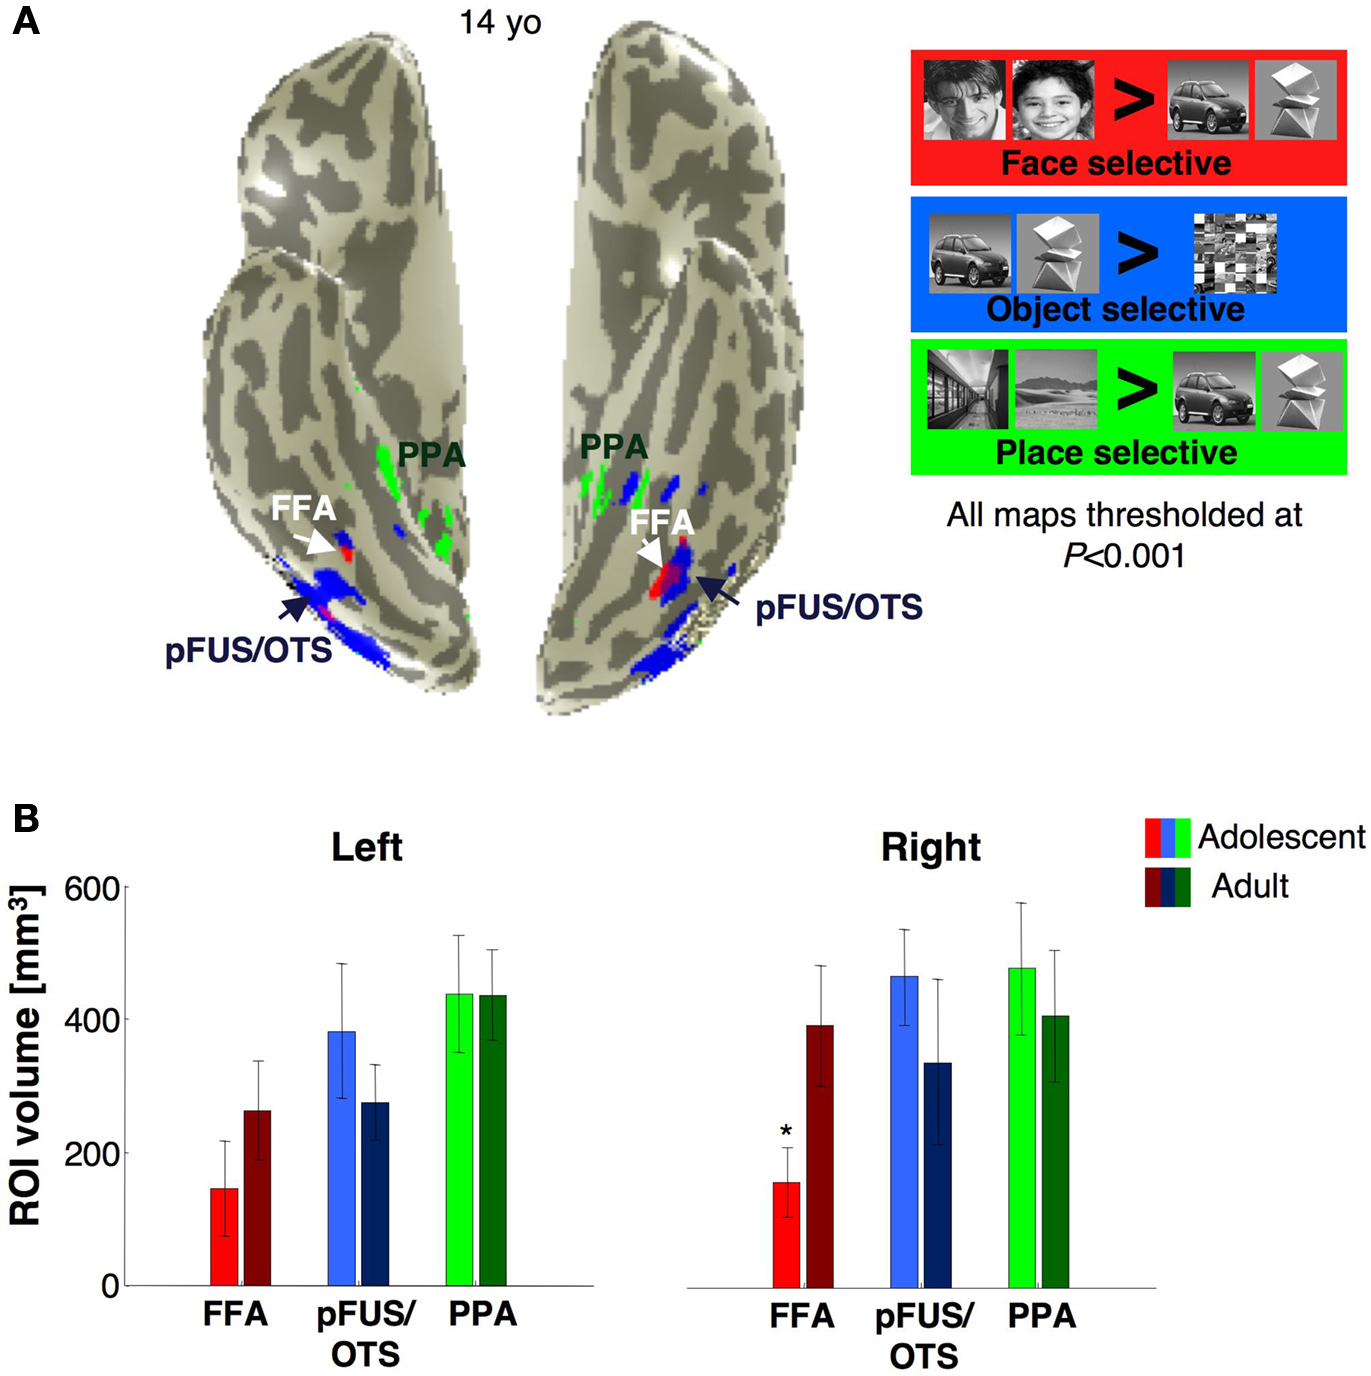
Figure 7. Face-, object- and place selective activations in ventral cortex. (A) Face (red), object (blue) and place (green) selective activations in a representative 14-year-old subject. All activation maps are plotted at the P < 10–3 threshold, uncorrected. Overlapping face and object activations are shown in magenta. The spatial relation among face, object and place selective activations and also their location relative to anatomical landmarks were similar across adults and adolescents. (B) The volume of FFA, PPA and pFus/OTS averaged across 11 adults (light bars) and 14 adolescents (dark bars). Error bars indicate between subjects SEM. Asterisks indicate significantly larger volume in adults than in adolescents (P < 0.05, t-test).
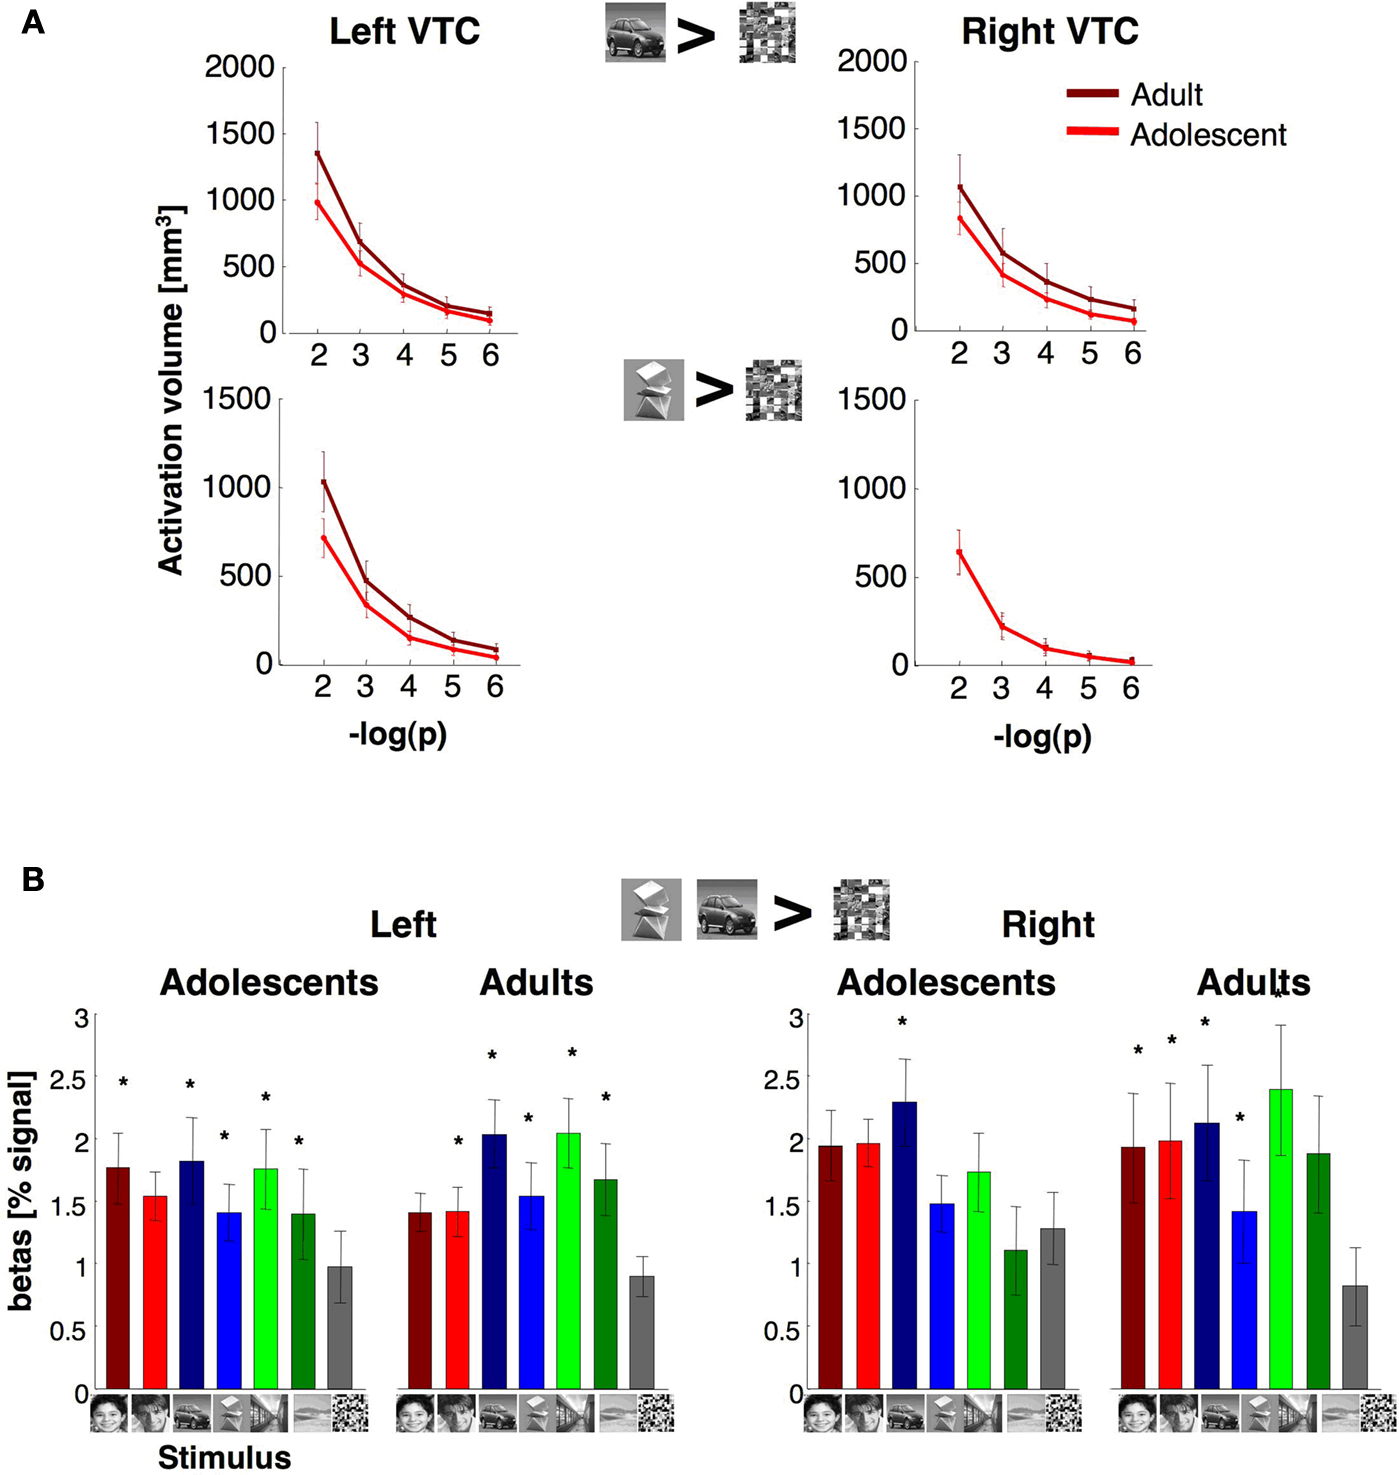
Figure 8. Volume and response amplitudes of object selective activations in VTC. (A) The total volume of activated voxels for cars > scrambled, or abstract objects > scrambled at five different thresholds (10–2 to 10–6, shown as minus logarithm base 10, uncorrected). Light red: adolescents (ages 12–16 years, n = 14); dark red: adults (ages 18–40 years, n = 11). (B) Percent signal change for object selective voxels. We defined in each subject object selective voxels in the VTC using the contrast: cars and abstract objects > scrambled, P < 10–3, from run 1 data. Object selective voxels were found in all subjects from run 1 data. Signal amplitudes were extracted from these voxels in run 2 data. We calculated the average response across each subject’s voxels and then averaged across subjects. Error bars show group SEM (11 adults and 14 adolescents). Asterisks indicate significantly higher than scrambled (P < 0.05, t-test across subjects) and are corrected for multiple comparisons using Bonferroni correction.
We defined an object selective region along the posterior fusiform gyrus, often extending into the occipito-temporal sulcus referred to as pFus/OTS (see Materials and Methods). The volume of the right pFus/OTS was significantly larger in females than in males (F1,23 = 6.39, P = 0.02), but there were no between age group differences (P > 0.22, Figure 7
B), and no interactions between the factors of age and gender in either hemisphere (P > 0.31). Similarly, there were no significant between age group differences in the total volume of object selective activations (cars and abstract objects > scrambled) at five different thresholds (10–6 < P < 10–2, uncorrected) in either the right or left VTC (Ps > 0.22). Additionally, we did not find significant between age group differences in activation volumes in either hemisphere when we separately defined the activations for abstract objects versus scrambled images or cars versus scrambled images at five different thresholds (Ps > 0.15).
Response amplitudes were generally higher for objects, faces and scenes compared to scrambled images, and there were no significant effects of age (right VTC: F1,21 = 0.64, P = 0.43; left VTC: F1,21 = 0.03, P = 0.86, Figure 8
B) or interaction between age and response amplitude to image categories (P > 0.19) in either hemisphere.
Response amplitudes were significantly higher among females than males in the right VTC (right VTC: F1,21 = 6.31, P = 0.02; left VTC: F1,21 = 0.46, P = 0.51), but there was no interaction between age and gender in either hemisphere (Ps > 0.13), or between either factors of age or gender and image category (Ps > 0.2).
The degree of selectivity among the object selective voxels in VTC was measured as the mean t-value for the contrast cars and abstract objects > scrambled in run 2. This selectivity was higher in the left hemisphere of adults (2.5 ± 1.3, mean selectivity ± std deviation) than in adolescents (1.7 ± 1.1, mean selectivity ± std deviation, t23 = 1.7, P = 0.05, one-tailed test). In contrast, in the right hemisphere, this mean t-value among the supra-threshold object selective voxels was not statistically different across age groups (mean selectivity in adults: 2.3 ± 1.5, in adolescents: 1.6 ± 1.1, t23 = 1.2, P = 0.24). Furthermore, there were no significant correlations between age and magnitude of object-selectivity among the supra-threshold object selective voxels in the right or left VTC (rs < 1.7, Ps > 0.42), in contrast to the positive correlation between age and face selectivity among the supra-threshold face selective voxels in VTC.
The Volume and Response Amplitudes of Place Selective Activations
We examined place selective activations in the VTC (Figure 7
) to test if the volume and selectivity of place selective activations increase during adolescence in tandem with the development of face selective activations.
We defined the PPA as a scene selective region along the parahippocampal gyrus, often extending into the collateral sulcus (indoor and outdoor scenes > cars and abstract objects, P < 10–3, Figure 7
A). The PPA volume in both hemispheres was similar across age (Ps > 0.58) and gender groups (Ps > 0.70, Figure 7
B). Likewise, there were no between age group differences in the volume of place selective activations in the VTC at five different thresholds (right: F1,23 = 0.10, P = 0.75; left: F1,23 = 0.64, P = 0.43; Figure 9
A), suggesting that the PPA reaches its adult volume by adolescence and earlier than the FFA.
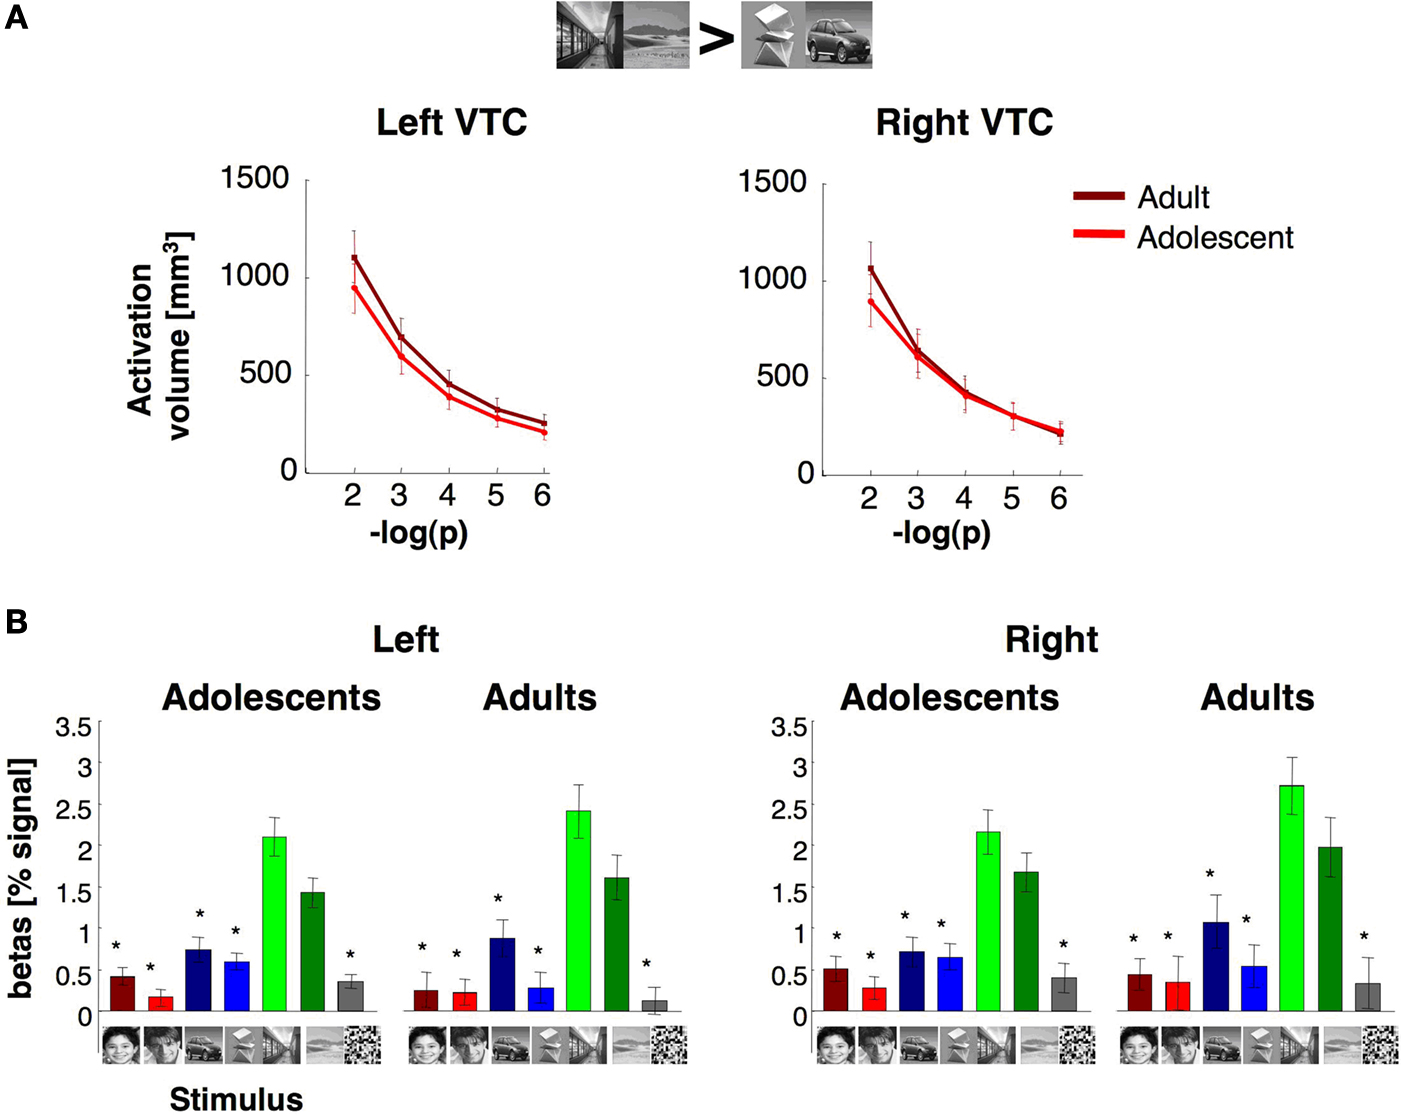
Figure 9. The volume and response of place selective activations in the ventral temporal cortex. (A) The total volume of place selective activations for indoor and outdoor scenes > cars and abstract objects at five different thresholds (10–2–10–6, uncorrected, shown in minus log base 10 of p). Light red: adolescents (ages 12–16 years, n = 14); dark red: adults (ages 18–40 years, n = 11). (B) Response amplitudes to visual stimuli across place selective VTC voxels. Place selective voxels in the VTC were defined by the contrast scenes > objects, P < 10–3, in run 1. Percent signal changes were extracted from run 2 (mean and SEM). Asterisks indicate responses that significantly less than response to indoor and outdoor scenes (P < 0.05, t-test across subjects) and are corrected for multiple comparisons using Bonferroni. Error bars reflect SEM across subjects.
Response amplitudes of place selective voxels in the VTC were higher for scenes than all other categories (Figure 9
B). There were no significant effects of age (right VTC: F1,21 = 0.36, P = 0.56, left VTC: F1,21 = 0.02, P = 0.91), gender (right VTC: F1,21 = 0.42, P = 0.52; left VTC: F1,21 = 1.74, P = 0.20), or interaction between these factors (Ps > 0.17).
The degree of selectivity among the place selective voxels in VTC, as measured by their mean T value, was similar in adults (right: 3.7 ± 1.0, left: 3.7 ± 1.2, mean selectivity ± std deviation) and adolescents (right: 3.1 ± 1.4; left: 3.2 ± 1.3, mean selectivity ± std deviation) and not significantly different in either hemisphere (Ps > 0.27). Despite some trends, the correlation between subjects’ age and the magnitude of place-selectivity among place selective voxels did not reach statistical significance in either hemisphere in the VTC (rs < 0.35, P > 0.08).
Distributed Responses to Object Categories in VTC Across Age Groups
We asked if the development of face selectivity in the VTC also manifests as changes in the spatial pattern of its distributed responses. It is well documented that category information is also present in the distributed responses across the VTC, as different categories elicit distinct distributed response patterns (Haxby et al., 2001
; Cox and Savoy, 2003
). In other words, the correlation between MVP of responses across different categories is typically lower than the correlation between MVPs for the same category. Thus, MVP analysis is a useful approach for measuring any age-related changes in the distributed response patterns. Specifically, our findings of fewer face selective voxels in the adolescent VTC, lower response amplitudes elicited by faces (but not objects or scenes) and lower face selectivity suggests that fewer voxels in the adolescent VTC differentially respond to face versus object stimuli. Consequently, face MVPs may be less distinct than non-face MVPs (i.e. more positively correlated) in adolescents than in adults.
MVPs for different categories across the VTC are shown in Figure 10
A from one representative adolescent subject. In general, the spatial pattern of response was similar across adolescents and adults. For the stimuli presented in our experiment, face MVPs showed responses above the mean in the lateral VTC (red and yellow in Figure 10
A) and below the mean in the medial VTC (blue and cyan in Figure 10
A). Scene MVPs showed the opposite spatial pattern. The MVPs of responses to cars and abstract objects were more diffuse in both age groups.
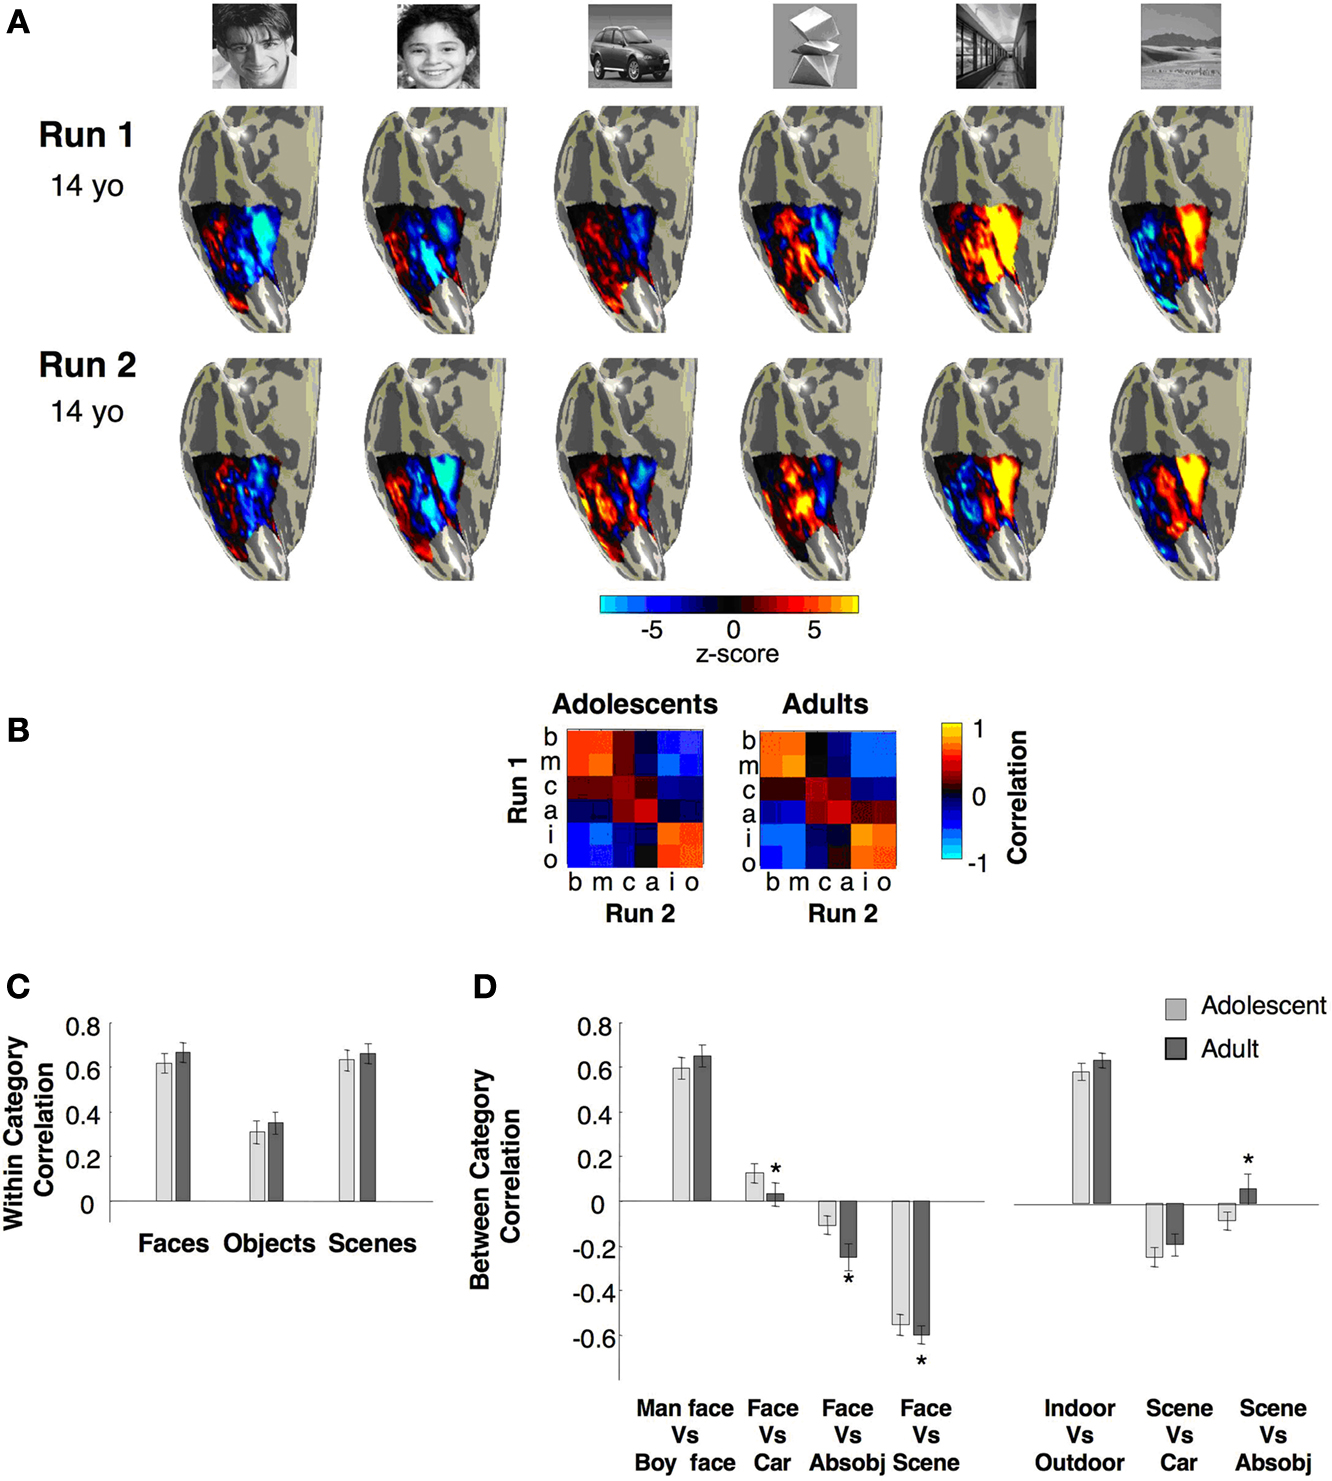
Figure 10. Multivoxel pattern (MVP) analysis of distributed responses to categories across the right VTC. (A) Visualization of the MVP to stimulus categories in run1 and run2 in a representative 14-year-old adolescent. (B) Group averaged Pearson correlations within and between categories from run1 versus run2. The on-diagonal components indicate the within-category reproducibility of the MVPs across runs, using different exemplars of the same stimulus category. Off-diagonal components indicate between-category correlations. (C) Summary of within-category correlations from (B). (D) Across-category correlations from (B) between faces and non-faces and between scenes and objects. Light grey: adolescents n = 11, ages 12–16 years; Dark grey: adults, n = 11, ages 18–40 years. Asterisks indicate significantly different correlations in adults vs. adolescents (P < 0.02, t-test across subjects). Error bars denote SEM across subjects.
We calculated the Pearson correlation between MVPs across all pairings of stimuli across runs 1 and 2 in each subject and then averaged across subjects in each age group.
Results are summarized in a correlation matrix (Figure 10
B). The diagonal of this correlation matrix shows the within-category reproducibility of MVPs across the two runs for each of the stimulus categories. In both adults’ and adolescents’ within-category correlations for all stimulus types were significantly positive (all ts > 4, Ps < 0.001). Within-category correlations were particularly high for faces and places (mean rw > 0.6, Figure 10
C-left), with lower but significantly positive within-category correlations for objects (mean rw > 0.3, Ps < 0.001). Thus, within-category MVPs were highly reproducible between runs. Critically, there were no between age group differences in the reproducibility of the MVPs (Ps > 0.1, ts < 1.7). Furthermore, the between-category correlations between MVPs for different face types (man vs. boy, Figure 10
C) were similar to the within-category correlation for the same face types (man vs. man or boy vs. boy, adults: rb = 0.65, adolescents: rb = 0.57, t48 = 1.6, P = 0.11). Thus, there was no evidence for an age of stimulus by age of subject interaction.
Next, we compared the between-category correlations for face vs. non-face MVPs in each subject (Figure 10
C). In adults, the correlations between face MVPs and non-face MVPs (cars, abstract objects and scenes) were either close to zero (in case of cars), or negative (in case of abstract objects and scenes, Figure 10
C), suggesting distinct spatial patterns of response to face and non-face stimuli. Similarly, in adolescents, the correlation between face and non-face MVPs were significantly lower than the within-category correlation among face MVPs (Figure 10
C), indicating that these MVPs were distinct in this group as well. However, the degree of this distinctness was significantly lower in adolescents compared to adults. Specifically, the mean correlation between face vs. car MVPs was near zero in adults, but significantly positive in adolescents (between group difference, t-test, P < 0.02). Likewise, the between-category correlations for face vs. abstract object MVPs, and also across face vs. scene MVPs were significantly less negative in adolescents (Ps < 0.02). Thus, face MVPs become more distinct from non-face MVPs across the VTC with age.
To test the category specificity of these developmental changes, we examined the correlations between the MVPs to scenes and objects across age groups. In both age groups there were highly positive correlations between indoor scene MVPs and outdoor scene MVPs. In both age groups the correlation between scene MVPs and car MVPs were negative, showing distinct patterns of response to scenes versus cars across the VTC (Figure 10
C). However, the correlation between MVPs for scenes vs. abstract objects was significantly more negative in adolescents than in adults (Figure 10
C). Thus, the distributed responses to scenes vs. abstract objects were less distinct in the VTC of adults compared to adolescents, contrasting the more distinct pattern of face vs. object responses in adults.
Finally, we asked if there are age group differences in the inter-subject variability of MVP correlations. Thus, we calculated the inter-subject correlation between MVP correlation matrices across all pairs of subjects (see Materials and Methods). In each age group, inter-subject correlations were high (adult-adult: r = 0.91 ± 0.04; adolescent-adolescent: r = 0.91 ± 0.03), indicating highly similar correlation matrices and low between-subject variability within each age group. Importantly, the mean inter-subject correlation between pairings of adult and adolescents’ matrices was also high (adolescent-adult, r = 0.9 ± 0.04), indicating that, overall, the correlations among category MVPs were highly similar across the age groups, despite the face- and scene- specific differences that we found.
Relating the Development of rFFA to Improvements in Face Recognition Memory
To determine how our fMRI findings relate to visual recognition performance, we first asked if there were age-related improvements specifically in face recognition memory performance, or more generally for non-face categories as well. Face recognition memory was significantly higher in adults than in adolescents (t23 = 2.75, P = 0.01). In contrast, recognition memory performance for non-face stimuli was not different across age groups (P > 0.3). Females were significantly better than males at recognition memory for indoor and outdoor scenes (P = 0.001), but there was no interaction between factors of age and gender for any of the stimulus categories (P > 0.73). Thus, age-related recognition memory improvements during adolescence were specific to faces.
Next, we asked if rFFA volume is correlated with face recognition memory performance. Notably, face recognition memory performance was significantly correlated with rFFA volume (r = 0.54, P < 0.008, significant after Bonferroni correction for multiple comparisons, Figure 11
) with similar trends in the lFFA (r = 0.52, P < 0.01). In contrast, place and object recognition memory was not correlated with either the right or left FFA volume (Figure 11
, Table 2
). Furthermore, there were no significant correlations between face recognition memory and the volume of either the pFus/OTS or the PPA (despite a trend for the lPPA, which was not statistically significant after Bonferroni correction, Table 2
).
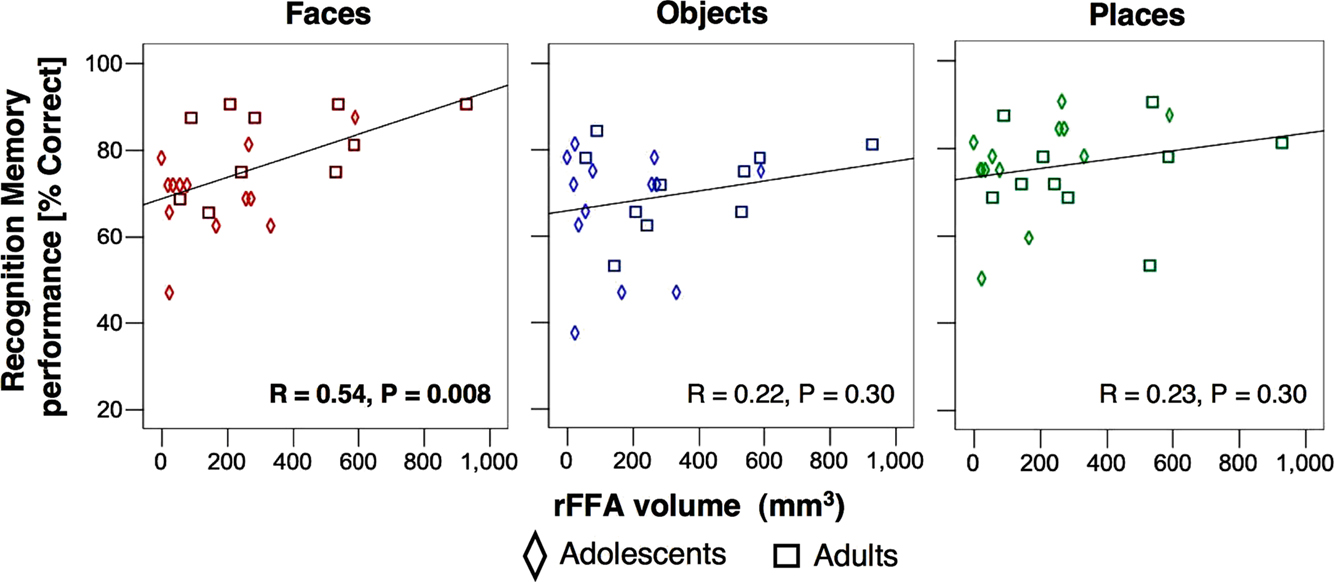
Figure 11. Correlations between rFFA volume and recognition memory performance for faces (Red), objects (Blue) and places (Green). Diamonds: adolescents, n = 14 ages 12–16 years; Squares: adults, n = 11, ages 18–40 years.
Table 2. Correlations between ROI volumes, subject’s age and behavioral measures of visual processing. Right and left hemisphere are indicated by (r) and left (l) respectively. Face selective fusiform face area (FFA), object selective pFus/OTS region (pFus), parahippocampal place area (PPA). Bold entries indicate significant correlation after Bonferonni correction for multiple comparisons.
We also asked if performance on other face tasks outside the scanner were correlated with rFFA volume. We used the Benton face recognition task to assess perceptual face discrimination, and an affect perception task to examine recognition of facial expressions of emotion. Performance on the Benton task was significantly better among adults than adolescents, but there were no between group differences in their performance on the affect task (Table 1
). Furthermore, FFA volume did not predict performance on either of these tasks (Table 2
). These findings suggest a substantial degree of specificity in the FFA’s role in the development of recognition memory for face identity.
We found evidence for development of face selectivity in the VTC during adolescence. This development manifested as an age-related growth of the rFFA volume, increased rFFA response amplitudes and selectivity for faces, and increased differentiation between distributed patterns of activations to face versus non-face stimuli in the VTC of adults compared to adolescents. Importantly, rFFA size was correlated with subjects’ performance on a face recognition memory task, but not recognition performance for objects or places. In contrast to the rFFA, the volumes and response amplitudes of object- and place selective activations in the VTC were similar across age groups. Our findings demonstrate that the development of the rFFA continues during adolescence, after the PPA and pFus/OTS have reached their adult size.
We addressed several methodological factors that may produce non-specific face selective differences and potentially confound comparison of fMRI results across age groups (Grill-Spector et al., 2008
). First, we based our functional analyses on individually defined ROIs without spatial normalization in order to avoid confounds due to possible between group differences in brain shape. This approach precluded direct between group comparisons of the location of the FFA, but our subject-by-subject analysis suggests that such differences are likely to be subtle. Second, we improved the spatial resolution of our study relative to previous reports by prescribing smaller voxels during scanning and by avoiding any spatial smoothing of the data. Previous studies of adolescent VTC which employed spatial smoothing (Golarai et al., 2007
) and normalization (Scherf et al., 2007
) did not find significant differences between adult and adolescent FFA size, despite some trends (Golarai et al., 2007
). Thus, the improved spatial precision of our study was likely a critical factor in our ability to detect developmental changes in the FFA of adolescents. Third, subjects across different age groups were matched on several factors that could potentially affect BOLD signals. These include performance on a 1-back task during scan, total motion during the scan, and the percentage of variance across the time-course data that is explained by the GLM. Fourth, we examined whether the functional differences were by-products of between age group differences in the anatomical size of the VTC. Although we found evidence for a larger right hemisphere in adolescents than in adults, the size of the anatomical ROI of the VTC (to which we restricted most of our analyses) was similar across age groups. Thus our functional results in the VTC cannot be explained by between group differences in anatomical size. Our methods involved reconstructing the gray matter by including a uniform gray matter thickness across the whole brain in all subjects. Thus, our measurements are proportional to the surface area of the gray/white matter boundary and preclude direct assessment of any potential between group differences in gray matter volume that might arise from variations in gray matter thickness. However, previous studies suggest that gray matter thickness in the VTC is relatively stable during childhood to adulthood (Sowell et al., 2002
), consistent with our anatomical measurements. Fifth, we examined the volume of face-, object- and place selective activations across a range of statistical thresholds and found consistent results across this range, indicating that our findings are not dependent on the choice of the statistical threshold on contrast maps or voxel clustering. Sixth, we examined the reproducibility of distributed responses to visual categories in the VTC across two independent runs, and found them to be highly reproducible in both adults and adolescents, suggesting that our fMRI data were equally reliable across age groups. Thus, neither between age group differences in performance during the scan, BOLD-related confounds, size of the anatomical VTC, nor data reliability can account for our results.
The rFFA volume was substantially larger in adults compared to adolescents across several analyses. Our results are consistent with previous fMRI studies that found evidence for a prolonged development of the rFFA among children ages 7–11 years (Golarai et al., 2007
; Scherf et al., 2007
; Peelen et al., 2009
). However, previous studies did not clarify whether or not this development continued through adolescence. Specifically, in our previous report (Golarai et al., 2007
), we found a trend for smaller rFFA size in adolescents versus adults (using a different group of subjects), which was inconclusive, perhaps due to the lower spatial resolution in that study. Another study found a positive correlation between age vs. size or selectivity of rFFA among a group of subjects ranging from age 7–17, however children and adolescents were not separately compared to adults (Peelen et al., 2009
). In contrast, a third study found no between group differences in the size or response amplitudes of the rFFA when comparing adults and adolescents (Scherf et al., 2007
). The methodological improvements in our current study enabled us to detect substantial developmental changes in rFFA size and face specific responses during adolescence. The smaller rFFA size in adolescents was coupled with lower responses to faces (but not objects) and lower face selectivity in this region. These data are consistent with our previous findings of lower responses to faces (but not objects) in a penumbral region adjacent to the nascent FFA (Golarai et al., 2007
).
The development of face selective activations in the VTC was evident in both males and females, although FFA size was larger among females than males in both age groups. This latter effect of gender might be due to our choice of male face stimuli, although previous behavioral studies suggest that females’ better face recognition memory performance is only apparent for female faces (Lewin and Herlitz, 2002
). Thus, full characterization of gender effects on the size of the FFA will require presentation of both male and female faces in future experiments. Nevertheless, our data show that the rFFA undergoes a substantial development during adolescents in both genders.
Some behavioral studies suggest better face recognition memory performance when older adult observers view faces of their own-age group compared to faces of younger adults (Anastasi and Rhodes, 2005
; Perfect and Moon, 2005
). These findings have led to the possibility that own-age faces may produce stronger brain responses than faces of other age groups, analogous to the differential FFA responses to faces of other races (Golby et al., 2001
). However, we found no evidence for an own-age bias. First, the volume of face selective activations was larger in adults than adolescents whether we defined them using both types of faces, or only men or boy faces. Second, response amplitudes to faces of men and boys were similar in both age groups, whether we defined face selective activations by one or both face stimuli. Third, there was no interaction between the age of subject and size of the non-overlapping activations elicited by man or boy faces alone. Fourth, the distributed patterns of activations across the VTC for faces of men and boys were highly correlated in both age groups, suggesting that our findings are not limited to discrete regions of the VTC, and our current measurements do not distinguish between patterns of responses to faces of men or boys across the VTC.
We did not precisely match the age of face stimuli with the age of participants. Although such a precise matching could increase our sensitivity to potential effects of age of face stimuli, it would also involve perceptual variability across the stimulus sets and potentially introduce additional unwanted variability in the fMRI signals across subjects, rendering data interpretation more difficult. Thus, we chose to minimize this later source of variability by using a single set of stimuli from a range of ages, so that men faces overlapped the age range of the adult subjects and boy faces overlapped the age range of the adolescent subjects and included younger age groups as well. We reasoned that if the FFA size reflects years of prior experience with faces, then adolescents’ response to children’s faces would reflect this relatively recent experience with children’s faces, and bias our experiment towards finding a more adult-like FFA size in this group (i.e. opposite to our results). Given the absence of any trends towards an own-age bias in our data, it is highly unlikely that age of face stimuli could explain the substantially smaller rFFA size in adolescents.
Developmental changes in the VTC were specific to the face selective region of FFA, as place- and object selective regions were similar in their volume and response properties across age groups. We previously reported that the left PPA also undergoes a prolonged development during the first decade of life and is larger in adults than children (ages 7–11 years). In the previous study we found no significant differences between adults and adolescents’ PPA volumes, but adolescent PPA volumes were intermediate between child and adult volumes. Here, we found that the size of the PPA and its response profile to visual stimuli were similar across adults and adolescents. Our present findings are consistent with (Scherf et al., 2007
) who reported no differences in place selective activations in 11–14 year olds compared to adults using a group analysis. Here we extend those findings as we measure volumes of activations in individual subjects as well as perform independent analyses of response amplitudes and selectivities, which were not performed in previous studies.
Similarly, we found no age-related differences in the size or response properties of an object selective region (pFus/OTS), which is anatomically close to (and sometimes overlaps) the FFA. Thus, it is unlikely that our finding of a smaller rFFA in adolescents is due to anatomical or BOLD-related confounds in the vicinity of the rFFA. Consistent with this interpretation, a recent study found evidence for substantial age-related increases in the rFFA size, but stable size of a nearby body-part selective region in the fusiform gyrus (fusiform body area, FBA) in the same subjects (Peelen et al., 2009
). Furthermore, our results are consistent with previous reports that the volume and amplitude of object selective responses across the entire lateral occipital complex are adult-like by the age of 7 years (Golarai et al., 2007
; Scherf et al., 2007
). Here, we extend previous findings by showing that the lack of development of object selective responses was independent of the level of prior familiarity with the choice of object category in our study, as we found similar results when we separately examined object selective activations to cars (a familiar object category with identifiable parts and a common configuration of those parts) or abstract sculptures (varied exemplars of novel objects). These findings do not preclude the possibility that the PPA and pFus/OTS might show age- or experience-dependent changes, if probed with more sensitive designs such as fMRI-adaptation (Grill-Spector and Malach, 2001
). Nevertheless, our findings underscore the differential development of face selective activations as compared to nearby object- or place selective activations during adolescence.
We found developmental changes in the distributed pattern of responses to faces across the VTC. Importantly, the distributed patterns of responses to faces vs. non-face stimuli were more distinct in adults than adolescents. This observation is consistent with our findings of fewer supra-threshold face selective voxels and lower face selectivity of these voxels in adolescents. Whether the results of our pattern analyses reflect wide spread changes in face selectivity across the entire VTC or a region localized to the vicinity of the nascent FFA remains to be determined in future studies. Our previous finding of lower face responsiveness and selectivity in a region surrounding the nascent FFA in children (Golarai et al., 2007
) suggests that our current findings may reflect localized changes in the vicinity of the nascent FFA. Future studies are needed to determine how anatomically widespread or restricted the age-related changes in the distributed VTC responses are. Nevertheless, our findings reveal that developmental changes in the VTC responses during adolescence are reflected in the distributed patterns of responses to faces, and are not limited to a modular view of the VTC’s functional organization.
The age-related increase in the distinctness of the MVPs was specific to faces vs. objects, as the overall spatial organization of the distributed responses were highly consistent within and across age groups, and the increased distinctness was not a general trend in the VTC for all categories. For example, the between-category correlations for scenes versus most other stimuli were similar across age groups. Meanwhile, the between-category correlation of scenes vs. abstract objects was less distinct in adults than adolescents. Given that we found no differences in the size or selectivity of the PPA across age groups, one interpretation of these findings is that with age, more (sub-threshold) VTC voxels outside the PPA respond similarly to scenes and abstract objects. Thus, the age-related decrease in the distinctness of distributed responses for scenes vs. abstract objects was opposite to the increased distinctness of responses to faces vs. objects. Whether or not these opposite shifts are causally related remains to be determined. However, our findings emphasize the specificity of the developmental increases in the distinctness of the distributed patterns of responses to faces vs. objects.
The age-related increases in rFFA size were associated with behavioral improvements in face recognition memory, consistent with our previous findings (Golarai et al., 2007
). Face recognition memory performance was correlated with rFFA volume, but not with the size of object- or place selective regions, and rFFA size was not correlated with recognition performance for objects and places. It is unclear how larger rFFA size subserves better face recognition memory. Nevertheless, we can speculate that, if a larger FFA contains more face selective neurons which are tuned to more face-exemplars, it may produce a better cortical representation of the range of human faces, which in turn may improve face recognition memory. Future studies utilizing concurrent measurements of FFA responses and face recognition performance, using both familiar and non-familiar faces may provide important new insights into the relationship between FFA volume and face recognition performance. Likewise, examination of recognition performance with simultaneous fMRI and electrophysiological recordings in animal models (Tsao et al., 2006
) will be essential in elucidating the specific relationship between development of face selective regions and behavioral performance.
An important question is why face selectivity in particular undergoes such a prolonged development during adolescence. One intriguing possibility is that this reflects the ongoing experience-dependent neural changes that accompany encoding and recognition of newly encountered faces, which most socially active adolescents frequently experience. Developmental theories often refer to faces as a special type of visual stimulus, partly due to the early onset of face processing shortly after birth (Johnson et al., 1991
). Our findings complement this notion by suggesting that the particularly prolonged development of face selective responses in the VTC may be an additional special feature of face processing, providing a basis for continued plasticity at least throughout the second decade of life. Alternatively, this prolonged plasticity may be a more widespread characteristic of the VTC, which may be evident also after expert learning of new visual categories (Gauthier et al., 1999
, 2000
). An intriguing possibility is that the fusiform gyrus remains plastic across the entire life span as individuals continuously encounter new faces throughout their lives and recognize them later. These possibilities are not mutually exclusive and could be addressed in future studies.
In conclusion, we found evidence for a prolonged development of face selective activations in the right VTC through adolescence that was associated with increases in the size of face selective regions, increases in responsiveness and selectivity for face stimuli, greater differentiation of distributed responses to face and object in the VTC, and behavioral improvements in face recognition memory. This development occurred in both male and female participants and was not dependent on the age of face stimuli. Our findings of differential development across the VTC provide important constraints for developmental theories of high-level vision, suggesting that development of face recognition occurs over a surprisingly long time, and is likely to require extensive experience. These findings set the stage for understanding the neural basis of developmental disorders in face processing.
The authors declare that the research was conducted in the absence of any commercial or financial relationships that could be construed as a potential conflict of interest.
Thanks to Sungin Hong for help with experimental preparations and scanning, Rory Sayers for software support, Kathleen Ojeda for help with brain segmentation, Ted Kelly and Brittany Wheelock for help with whole brain volume measurements, Nathan Witthoft for help with MVP analysis and Anders Greenwood for useful comments on the manuscript. This work was supported by NSF grant BCS-0617688 and NIH R21EY017741 grants to KGS.