Directed coupling in local field potentials of macaque V4 during visual short-term memory revealed by multivariate autoregressive models
- 1 Institute for Theoretical Computer Science, Graz University of Technology, Graz, Austria
- 2 Department of Physiology of Cognitive Processes, Max-Planck-Institute for Biological Cybernetics, Tübingen, Germany
- 3 Institute for Human-Computer Interfaces, Graz University of Technology, Graz, Austria
- 4 Department of Medicine/Physiology, University of Fribourg, Fribourg, Switzerland
Processing and storage of sensory information is based on the interaction between different neural populations rather than the isolated activity of single neurons. In order to characterize the dynamic interaction and transient cooperation of sub-circuits within a neural network, multivariate autoregressive (MVAR) models have proven to be an important analysis tool. In this study, we apply directed functional coupling based on MVAR models and describe the temporal and spatial changes of functional coupling between simultaneously recorded local field potentials in extrastriate area V4 during visual memory. Specifically, we compare the strength and directional relations of coupling based on generalized partial directed coherence (GPDC) measures while two rhesus monkeys perform a visual short-term memory task. In both monkeys we find increases in theta power during the memory period that are accompanied by changes in directed coupling. These interactions are most prominent in the low frequency range encompassing the theta band (3–12 Hz) and, more importantly, are asymmetric between pairs of recording sites. Furthermore, we find that the degree of interaction decreases as a function of distance between electrode positions, suggesting that these interactions are a predominantly local phenomenon. Taken together, our results show that directed coupling measures based on MVAR models are able to provide important insights into the spatial and temporal formation of local functionally coupled ensembles during visual memory in V4. Moreover, our findings suggest that visual memory is accompanied not only by a temporary increase of oscillatory activity in the theta band, but by a direction-dependent change in theta coupling, which ultimately represents a change in functional connectivity within the neural circuit.
Introduction
Cortical oscillatory activity measured from local field potential (LFP) recordings or electroencephalogram (EEG) is a widespread neuronal phenomenon and is considered to underlie the communication of local and distant neural populations throughout the brain (Fries, 2005 ). Different parameters of oscillations in distinct frequency bands often show correlations with various aspects of sensory information processing (Buzsaki and Draguhn, 2004 ). A prominent example is the modulation of gamma synchrony in visual cognition, for example in tasks involving the manipulation of visual attention (Fries et al., 2001 ), binocular rivalry (Gail et al., 2004 ) or object recognition (Supp et al., 2007 ).
In contrast to visual processing, several studies revealed a specific role of theta oscillations (3–12 Hz) in mnemonic processing, for example in spatial memory in rodents (Okeefe, 1993 ; Buzsaki, 2005 ), working memory in humans (Klimesch, 1999 ; Raghavachari et al., 2001 , 2006 ) and visual short-term memory in non-human primates (Rainer et al., 2004 ; Lee et al., 2005 ). In the latter study, neuronal oscillations in the theta band in extrastriate area V4 have been shown to mediate the coding and maintenance of relevant visual information within short-term memory. Thus, theta oscillations in V4 could provide a possible mechanism for supporting and coordinating cross-neuronal interactions within neuronal ensembles during visual memory. However, physiological evidence for directed oscillatory interactions in the theta-frequency range during short-term memory has not been obtained yet.
A description of the interaction patterns of oscillatory processes is provided by different measures that quantify various aspects of functional coupling. For example, some measures such as the phase-locking value (Lachaux et al., 1999 , 2000 ) provide insights into the instantaneous phase-relationship between two oscillatory processes and are derived from Wavelet- or Hilbert transform-based methods. In contrast, coupling measures derived from multivariate autoregressive (MVAR) models are becoming increasingly important as they capture not only instantaneous interactions between neural signals, but can give insights into the causal relationship between oscillations as well as the direction of their interaction. Thus, MVAR models are powerful in capturing the complex nature of oscillatory interactions and their role in neural processing.
Multivariate autoregressive models are a generalization of univariate autoregressive (AR) models, which were among the first methods that were applied to EEG data to reveal the spectral properties of brain signals already in the late 1960s (Zetterberg, 1969 ). MVAR models are able to take the interactions of multiple simultaneously recorded brain signals into account. A large set of coupling measures in the frequency domain such as coherency (Nunez et al., 1997 , 1999 ), Directed Transfer Function (DTF; Kaminski and Blinowska, 1991 ) or Partial Directed Coherence (PDC; Baccala and Sameshima, 2001 ) as well as variants of these and similar measures can be derived using the MVAR model parameters (Schlögl and Supp, 2006 ; Porcaro et al., 2009 ) and the implementation of coupling analyses is readily achieved by various toolboxes (Cui et al., 2008 ; Schlögl and Brunner, 2008 ).
Importantly, DTF and PDC, unlike coherency, assess the directionality of couplings between signals, i.e., they measure the direction of information flow between different channels. Both measures are based on the concept of Granger causality (Granger, 1969 ), which can be informally stated as follows: if the observation of a time series x(t) significantly improves the prediction of a time series y(t), x(t) “Granger-causes” y(t). PDC differs from DTF by having the ability to reveal exclusively direct couplings, which means that it does not assess indirect couplings via intermediate sites. For example, if the model incorporates three observed channels, with a connection structure A → B → C, PDC is not expected to show a connection from A to C. It is important to note that Granger causality is not identical to physical causality, but is a statistical measure reflecting the improvement of predictability of one signal based on the information of another.
Previously, AR models have been applied to EEG data and LFP data for various brain areas and frequency bands of interest and have revealed important insights into the functional relations between neuronal assemblies involved in sensorimotor behavior, sensory integration and visual attention (Bressler et al., 1999 , 2007 ; Liang et al., 2000 , 2001 , 2003 ; Brovelli et al., 2004 ; Chen et al., 2006 ; Supp et al., 2007 ; Anderson et al., 2009 ; Kayser and Logothetis, 2009 ).
In the present study, we applied MVAR modeling to simultaneous LFP recordings from multiple electrodes in V4 while monkeys performed a visual identification task. MVAR models have been used previously to examine causal influences in area V4 in order to elucidate physiological mechanisms underlying neuronal oscillations in the alpha frequency range (i.e., 10–15 Hz) (Bollimunta et al., 2008 ).
In our study, our goal was to exploit the advantages of MVAR models in order to investigate the directed functional relationship between multiple sources underlying theta oscillations during visual memory in V4. In order to gain insights into the direct interaction between multiple oscillatory components (i.e., bypassing coupling due to indirect influences) our MVAR models incorporated LFP activity of more than two simultaneously recorded channels. In addition, we evaluated the temporal and spatial dynamics of these direct interactions and provide a first description of causal and directed oscillatory coupling in the theta-frequency range during visual memory.
Materials and Methods
In the following, we describe the procedure that was used for our analysis. Afterwards, the experimental procedures for the data acquisition are described.
Preprocessing
Local field potential data was preprocessed using standard techniques, as described for example in Ding et al. (2000) . First, we resampled the data to a frequency fs of 200 Hz. This sampling rate is low enough to be able to use a sufficiently low MVAR model order while being high enough for an adequate representation of the frequency bands of interest. Then, we used a 50 Hz notch filter to suppress the electrical supply line noise. Afterwards, the data was normalized by subtracting the mean waveform across trials (grand-averaged mean waveform) from each single trial and subsequently dividing the result by the standard deviation across trials. This is necessary to remove first order instationarities from the data and to set the ensemble mean of the resulting data set to zero. We did not apply the same normalization procedure using the temporal mean and standard deviation for each separate trial, which is also frequently proposed, because this can lead to an underestimation of the low frequency components in which we were particularly interested.
Multivariate Autoregressive Modeling
To assess coupling between different LFP channels, we separately generated linear MVAR models of the data for each recording session and each time interval of interest. The MVAR model can be expressed as:
The model tries to predict the data at sample t from a linear combination of the P previous samples of all M channels. Here, y(t) is the vector of M simultaneously observed LFP recordings, P is the model order stating the number of preceding samples that are used to predict the data at sample t, and the innovation process x(t) (sometimes addressed as the “residual error” or “prediction error”, see Schlögl, 2000 ; Supp et al., 2007 for comments) is assumed to be a multivariate white noise process and is equal to the difference between the model prediction and the actual data. In order to estimate the model parameter matrices Ap that weight the previous samples of the time series to predict the current one such that the mean quadratic error is minimized, we use the Burg-type method of Vieira–Morf (Marple, 1987 ) which, according to Schlögl (2006) , is expected to provide the most accurate estimates of the model parameters. We used 250 ms windows for the time-frequency analysis, with an overlap of 200 ms for subsequent time intervals (Ding et al., 2000 called this procedure an Adaptive MVAR or AMVAR approach), and 1 s windows for the assessment of statistical significance of coupling and change in coupling between the two investigated task conditions (cf. Experimental Task). Note that the model assumes the data to be stationary, which is usually not the case for longer time segments of electrophysiological data, but for the short time intervals that are investigated in this study, the data is assumed to be quasi-stationary. We used the freely available open source Matlab implementation of the BioSig Toolbox for biomedical signal processing (Schlögl and Brunner, 2008 ) for our analysis, which can be found at http://biosig.sf.net/ .
There exists a number of criteria for estimating the optimal model order for each data set such as the Akaike Information Criterion (AIC; Akaike, 1974 ) or Schwarz’s Bayesian Information Criterion (BIC; Schwarz, 1978 ) which try to estimate the optimal model order for the MVAR model.
Both criteria take the goodness of fit to the empirical data into account, but also penalize for increasing numbers of free parameters to avoid overfitting to the data. Note that smaller values indicate better model orders. Unfortunately, the optimal model order is usually not consistent for different criteria and different data sets. We tried to estimate the optimal model order (in the range between 1 and 50, which reflects the length of the 250 ms windows we used for the time-frequency analysis) by using these measures, but the results did not show consistent local minima and qualitatively decreased with increasing model order instead (see Figure 1 ). We compared models of order 20 and 40 for the 250 ms windows and found the resulting average power spectra and couplings to be qualitatively consistent. Therefore, we used a model order P of 20 for every data set, which corresponds to a time window of 100 ms given the sampling frequency of 200 Hz. This model order reflects a tradeoff between spectral resolution (specifically, we make clear that the model order does not determine the spectral resolution, which is in fact infinite, but instead it determines the number of observed frequency components for each pair of channels, which is P/2, and relates to the “frequency resolution” in this sense; Schlögl and Supp, 2006 ) and overparametrization and approximately corresponds to the model orders used in similar approaches. For example, Brovelli et al. (2004) used a model order of 10 (corresponding to a 50 ms window) for analyzing beta oscillations, Supp et al. (2007) revealed couplings in the gamma frequency range using a model order of 15 (30 ms), and Kayser and Logothetis (2009) and Anderson et al. (2009) studied oscillations including the theta range using model orders of 6 (60 ms) and 17 (85 ms), respectively. Additionally, this model order fulfills all the requirements stated in Schlögl and Supp (2006) to obtain a sufficient model of the data. Furthermore, one should note that slight changes in the model order do not lead to arbitrarily large changes in the prediction error, but it is still an important parameter for the correct estimation of the couplings (Schlögl, 2000 ).
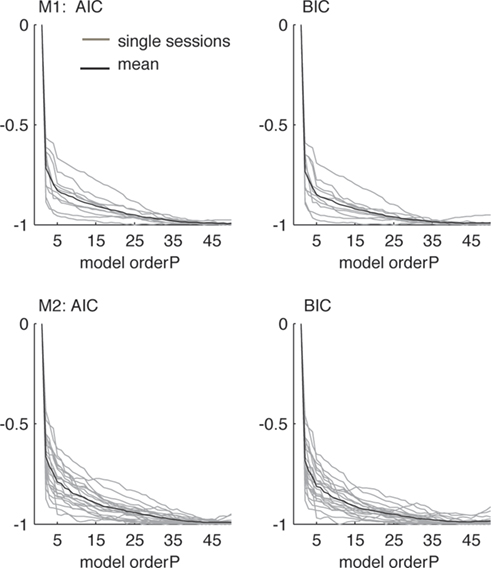
Figure 1. Evaluation of model orders using Akaike Information Criterion (left, AIC) and Schwarz’s Bayesian Information Criterion (right, BIC), normalized between maxima and minima of each session for the 1-s data from the delay condition. Gray lines indicate single sessions, black lines correspond to the average over all sessions. Criteria did not show consistent local minima, but qualitatively decreased with increasing model order up to P = 50. Smaller values indicate better model orders. For the data from both animals and all sessions, the model order P = 20 was chosen as a tradeoff between frequency resolution and overparametrization.
Generalized Partial Directed Coherence
As mentioned earlier, we used generalized partial directed coherence (GPDC; Baccala et al., 2007 ) for our analysis, which is a slightly adapted version of PDC with better variance stabilization properties. Analysis of the validity of this coupling measure using simulated and real data for which the ground truth is known as well as a comparison to DTF and other measures can be found elsewhere (Baccala and Sameshima, 2001 ; Kus et al., 2004 ; Pereda et al., 2005 ; Gourevitch et al., 2006 ; Porcaro et al., 2009 ). Moreover, Porcaro et al. (2009) indicated that PDC is the most suitable method for this kind of analysis based on their results on MEG data.
Generalized partial directed coherence is derived by first transforming the MVAR model from the time domain into the frequency domain to obtain the frequency representation of the model parameters:
where I refers to the M-dimensional identity matrix and fs is the sampling frequency. Note that in this equation, i2 = −1.
Then, GPDCij (which reflects the coupling from channel j to channel i) is calculated to be:
where  refers to the variance of the innovation process xi(t). GPDCij is normalized in the interval [0, 1], with increasing values for stronger interactions at particular frequencies, and sums up to one for each frequency component over all destination channels including the channel itself. The idea is to calculate the degree of influence of channel j to channel i with respect to the total influence of j on all channels. Note that this normalization procedure of (G)PDC was recently criticized (Schelter, 2009
) because of some difficulties in comparing interaction strengths for different frequencies. As the values Aij(f) and Aji(f) are not necessarily identical, directionality of coupling is obtained. As GPDCjj has to be interpreted as the remaining amount of coupling that can not be assigned to the influence on other channels, we excluded self-coupling of channel j to itself for the subsequent analysis.
refers to the variance of the innovation process xi(t). GPDCij is normalized in the interval [0, 1], with increasing values for stronger interactions at particular frequencies, and sums up to one for each frequency component over all destination channels including the channel itself. The idea is to calculate the degree of influence of channel j to channel i with respect to the total influence of j on all channels. Note that this normalization procedure of (G)PDC was recently criticized (Schelter, 2009
) because of some difficulties in comparing interaction strengths for different frequencies. As the values Aij(f) and Aji(f) are not necessarily identical, directionality of coupling is obtained. As GPDCjj has to be interpreted as the remaining amount of coupling that can not be assigned to the influence on other channels, we excluded self-coupling of channel j to itself for the subsequent analysis.
Experimental Task
Two adult male rhesus monkeys (Macacca mulatta) participated in the experiments. All studies were approved by local authorities and were in full compliance with applicable guidelines (EUVD 86/609/EEC) for the care and use of laboratory animals. The behavioral task of the monkeys was a delayed matching to sample task. The monkey was seated in front of a screen at a distance of approximately 110 cm. An initial tone indicated the potential start of a trial. The monkey initiated a trial-start by grasping a lever and fixating on a small fixation spot on the center of the screen (baseline period). After 1500 ms, a first stimulus appeared on the screen for 250 ms, the so-called sample stimulus. As sample stimuli we used different natural images. The stimuli that were used in all of the experiments were chosen from the Corel-Photo-CD “Corel Professional Photos” comprising a collection of natural images showing birds, flowers, monkeys and butterflies in their natural surroundings. The images used in this study were randomly selected. All images were manipulated by Fourier techniques that have been described in detail elsewhere (Liebe et al., 2009 ). The sample stimulus was followed by a delay period of 1500 ms during which the monkey held fixation. After the delay, a second stimulus, the so-called test stimulus, was presented. The monkeys were rewarded for a lever release whenever the test stimulus matched the sample stimulus. Whenever the test stimulus did not match the sample, the monkeys’ task was to withhold the lever release until, after a brief delay of 200 ms, a second test stimulus appeared, that always matched the sample. This procedure ensured that the monkey had to initiate a behavioral response on every trial. The monkeys were rewarded with juice for every correct trial. Within one session, the different trial types were randomly interleaved. Stimuli were 7° × 7° in size, at 24-bit color depth, and presented at the center of gaze on a 21″ monitor (ViewSonic P810) with linear luminance response as well as linear response at separate color channels (gamma corrected).
Electrophysiology
Local field potentials were recorded from recording chambers placed on the surface of the skull based on stereotaxic coordinates allowing vertical access to the dorsal region of extrastriate area V4. The Hoarsley–Clark coordinates for the center of the recording chambers for monkey 1 were AP: −6.5, ML: −29.7. For monkey 2 the chamber coordinates were AP: −5.2, ML: −29.9. The implantation as well as surgical procedures used are described in detail in Lee et al. (2005) . Neural signals were measured using two custom made micro drives mounted on a plastic grid (Crist Instruments, Hagerstown, MD, USA). In each recording session 4–6 tungsten microelectrodes (UEWLGDSMNN1E, FHC Inc., Bowdoinham, ME, USA) were manually lowered down into the cortex in pairs with a minimal separation between electrodes of 0.5 mm. The impedance of the microelectrodes was approximately 1 MΩ. The signal from each electrode was preamplified (factor 20, Thomas Recording, Giessen, Germany) using the recording chamber as the external reference. The analog signal was then filtered and amplified (BAK electronics, Germantown, MD, USA) to extract the LFP responses. After an additional waiting period of at least 1 h we started the recordings. The LFP was obtained by band-pass filtering the signal between 0.1 and 300 Hz and digitizing with a sampling rate of 4464 Hz. One unit of the analog-to-digital converter corresponds to 5 μV.
We recorded LFP activity from 44 channels in 10 sessions from monkey 1 and 86 channels in 20 sessions from monkey 2. This resulted in 202 channel pairs for monkey 1 and 398 channel pairs for monkey 2. For each monkey, the minimum number of channels per session was 3, the maximum number of channels was 6. The spatial distribution of all recorded channels for monkey 1 and 2 can be found in Figure 2 . For each recording site, its location is defined by two dimensions (anterior to posterior, and medial to lateral) based on the recording grid placed within the recording chamber. In order to measure coupling as a function of distance between recording sites, we calculated the Euclidian distance between two sites based on their respective locations along the two dimensions. The minimal distance between sites was 0.5 mm (i.e., sites directly neighboring each other within the grid), the maximal distance we obtained was 4 mm.
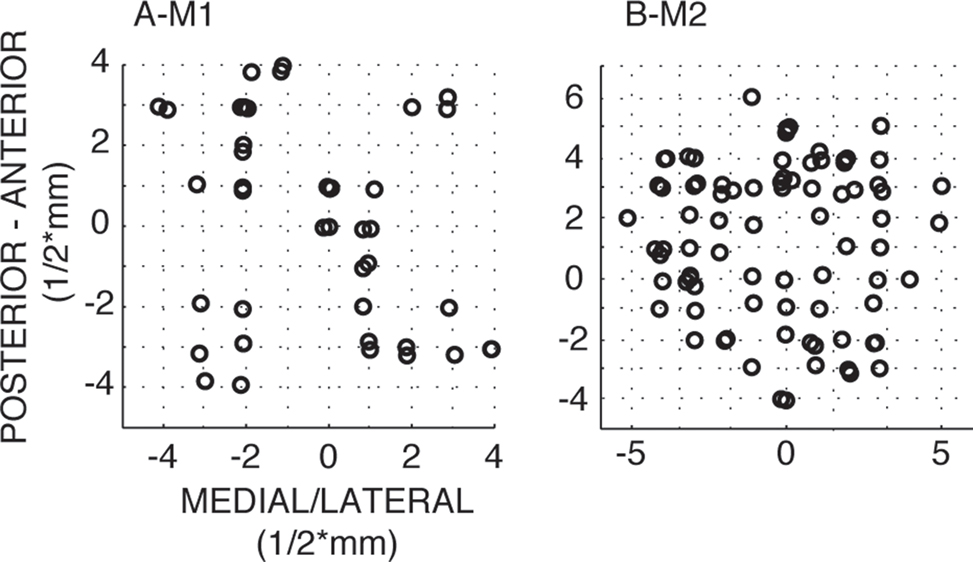
Figure 2. Recording locations along the medial–lateral and anterior posterior direction for monkey 1 and 2. 1 unit corresponds to 1/2 mm. Note that symbols are slightly jittered at their recording locations for better visualization.
Statistical Analysis
In order to be able to calculate confidence intervals that can be used to evaluate the significance of differences in coupling between different time intervals, we used a bootstrapping procedure that samples with replacement from the original trial set in order to generate bootstrap samples of the same size as the original data, but with different subsets of trials in them (Efron and Tibshirani, 1993 ). For each regarded data set of 1 s (last second of baseline and delay period), a set of 1000 bootstrap samples was generated. These bootstrap samples were then independently used to calculate the MVAR models as stated above and to estimate the couplings between the simultaneously recorded LFP channels with their respective confidence intervals. Change in coupling was considered significant if both the 0.01st and 99.9th percentile of the bootstrap distribution was above (increase) or below (decrease) the average baseline level.
Significance of coupling strength compared to the hypothesis that there was no coupling at all was assessed using a shuffling procedure. For each recording channel, trials were independently permuted repeatedly to obtain 1000 shuffled samples. MVAR model estimation was then also applied to these data sets.
For assessing the statistical significance of the effects of coupling as a function of distance between recording sites, we used a shuffling procedure that randomly shuffles the coupling values over distances to obtain 104 shuffled samples. Statistical significance of the real rank correlation was then calculated with respect to this distribution.
Results
Power Spectra
First, we examined the frequency content of induced oscillations during different periods of the visual memory task. Previously it had been found that there is enhanced power in the theta band during the delay period of the task in V4 (Rainer et al., 2004 ; Lee et al., 2005 ). We first sought to confirm these findings and compared the power spectrum for the delay period (i.e., across last 1000 ms before the onset of the test stimulus) to the power spectrum obtained from the 1000 ms time interval preceding the onset of the sample stimulus (“baseline”). Figure 3 shows the median amplitude spectra of LFP activity across all recorded channels (Figure 3 A) derived using a Morlet wavelet based approach (Tallon-Baudry and Bertrand, 1999 ; Graimann and Pfurtscheller, 2006 ). In both monkeys, the power spectra showed a local peak in the theta-frequency range during the delay period (black) which is absent during the pre-stimulus baseline period (gray). Figure 3 B shows the distribution of power at the peak frequency within the theta range for the baseline vs. delay period and illustrates a significant change in theta power during the delay compared to the baseline.
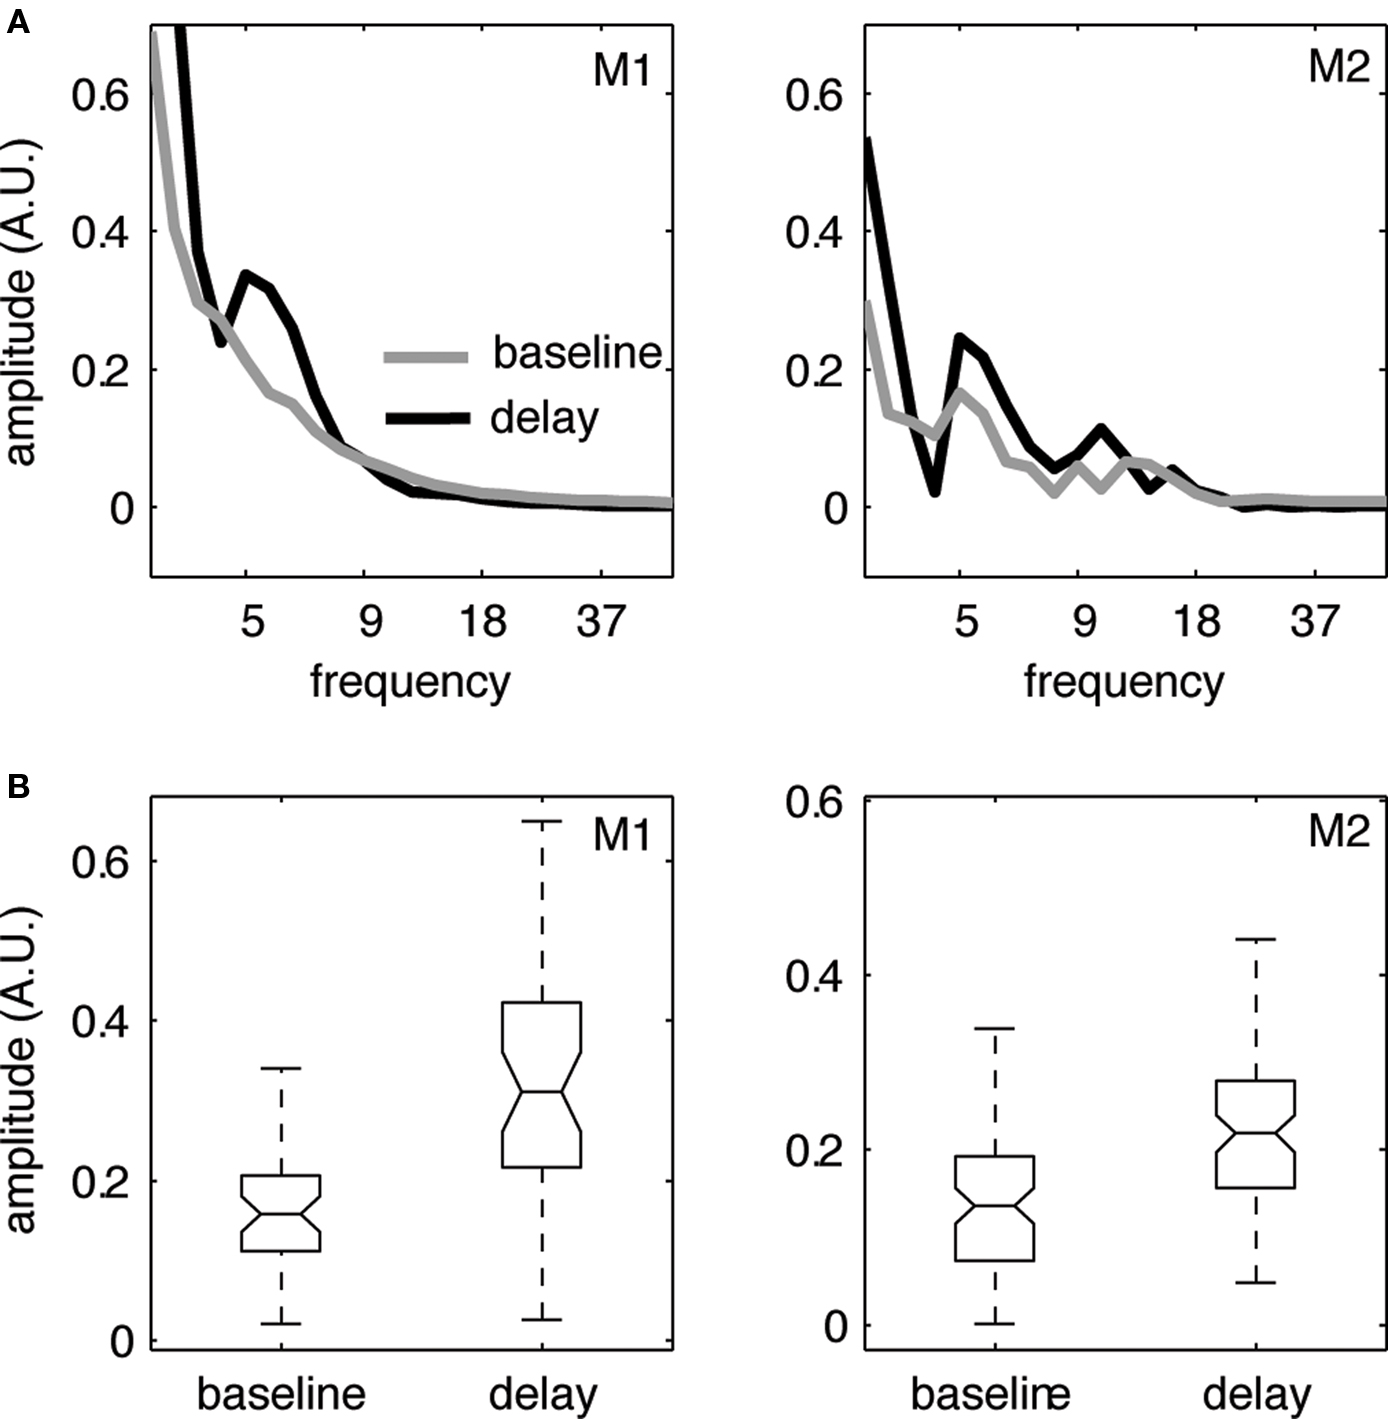
Figure 3. Enhanced power in the theta band during the delay period of the task. (A) Amplitude spectrum of LFP activity (median across all recorded channels in V4, N = 44/86 for monkeys 1/2, respectively) during the pre-stimulus baseline period (gray) and the delay period (black) of the delayed matching to sample task for frequencies from 1 to 40 Hz. We find enhanced power in the theta band (4–10 Hz) during the delay period for both monkeys. (B) Boxplots showing the distribution of power at the peak frequency within the theta range for the baseline vs. delay period. Both monkeys show a significant increase in theta power from baseline to delay (Wilcoxon signed rank test Z = 6.95/4.47, p < 0.01 for monkey 1/2, respectively).
General Coupling Analysis
Based on the occurrence of enhanced theta power during the delay period, we analyzed coupling strength between the different recording sites using GPDC obtained from MVAR modeling. We were interested in whether the enhanced theta power we observed during the delay period of the task coincides with directed coupling in the theta band. Thus, we first examined GPDC coupling as a function of frequency during delay (see Figure 4 A). Similar to the power spectra, we observed local peaks in GPDC coupling within the theta range (3–12 Hz) for both monkeys, albeit at slightly different frequencies. For monkey 1 the average peak frequency for highest coupling within the theta range was 4.33 ± 3.6 Hz (mean across sessions, ±1 SD) and was located well within the range of the maximum power peak frequency at 5.86 ± 0.81 Hz (see Figure 3 ). For the second monkey the average peak frequency for highest coupling was larger (8.35 ± 3.8 Hz), and also higher than the average peak of power (5.51 ± 1.77 Hz), but not significantly higher (p > 0.05). Similarly, inspection of Figure 3 shows that although the peak in power for monkey 2 is around 5 Hz, we find elevated power during the delay up to 10 Hz. Thus, the peak frequencies at theta power and theta coupling were overall similar. Note that these and subsequent results are based on the models that were fitted to 1 s time intervals in baseline and delay conditions (equivalent time intervals as for power spectra).
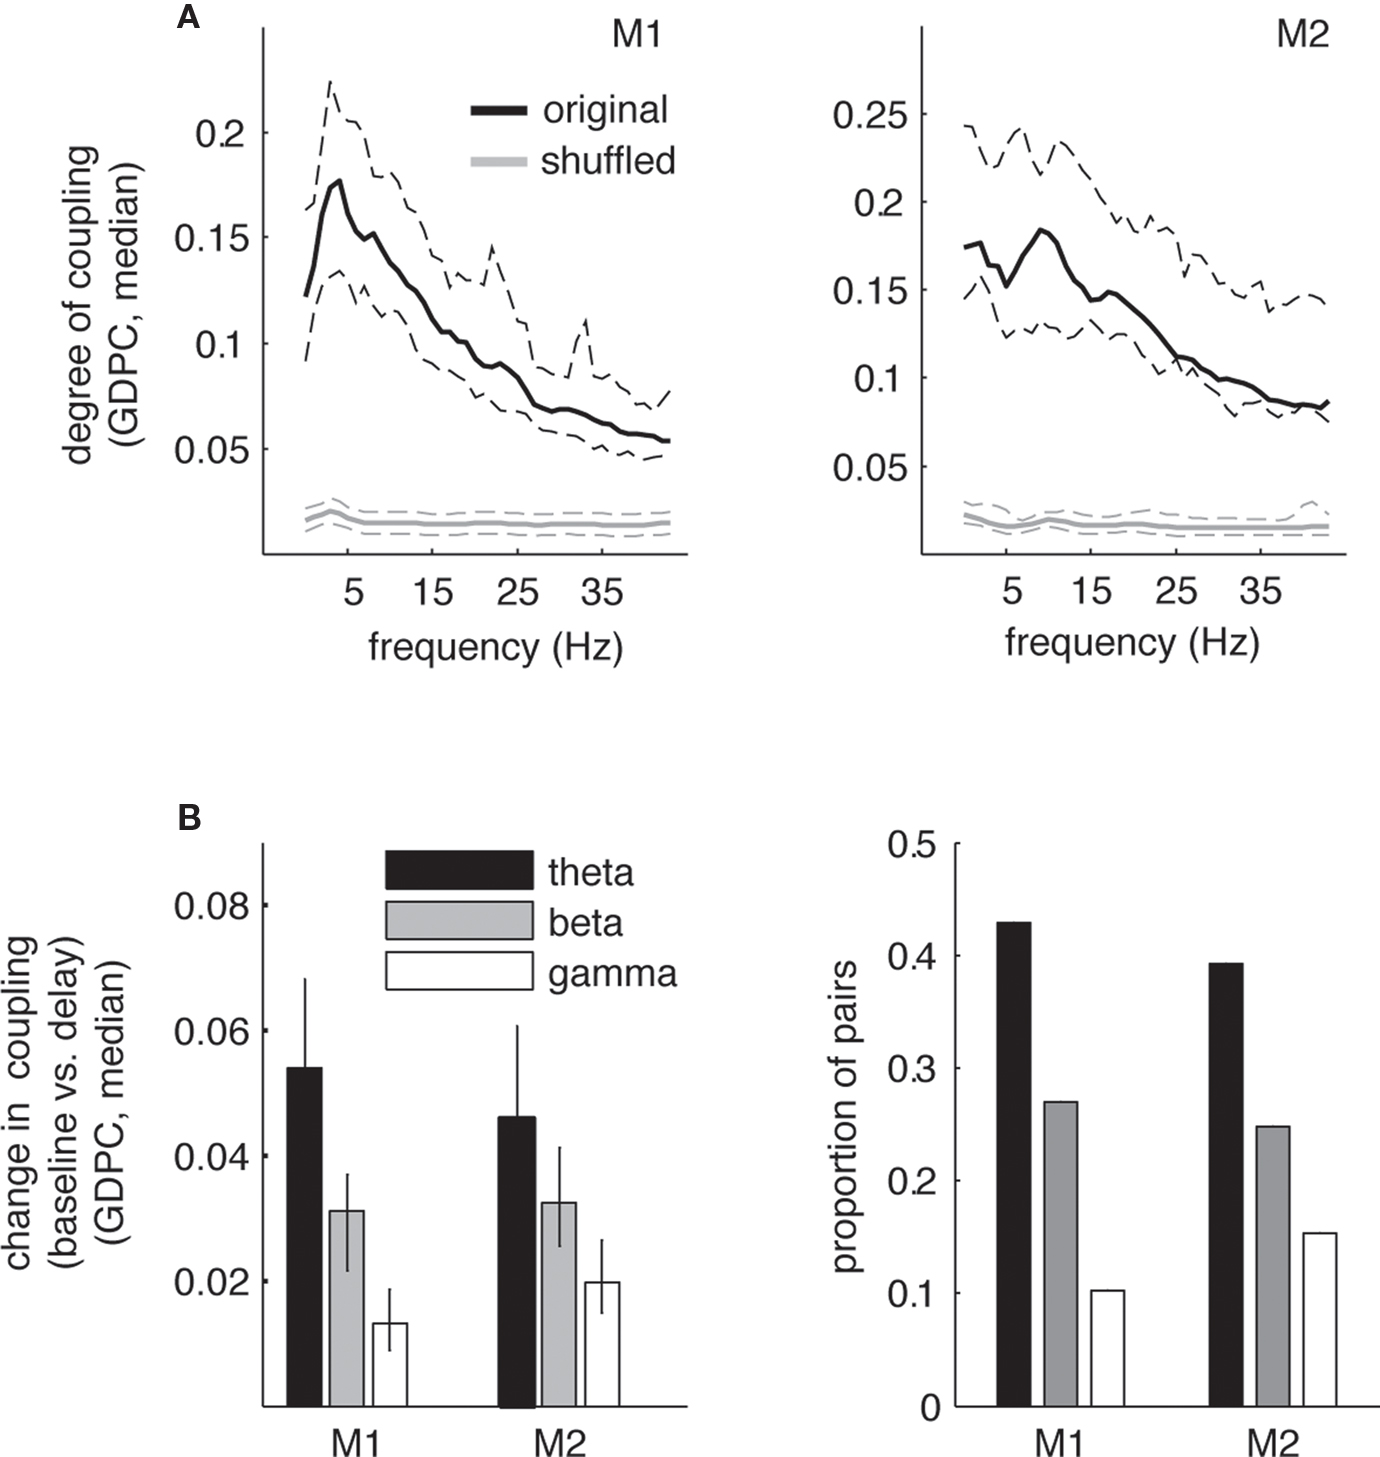
Figure 4. Generalized partial directed coherence coupling in theta band during the delay period of the task. (A) Median degree of coupling (GPDC) as a function of frequency during the delay period (black) across all pairs in V4 for monkeys 1 and 2 for non-shuffled (black) and shuffled pairs. For both monkeys we find a peak in coupling in the theta-frequency range (3–12 Hz), although peak coupling occurred at slightly different frequencies (around 5 Hz for monkey 1, around 9 Hz for monkey 2). Dashed lines correspond to ±34th percentiles of values around the median. Note that for the shuffled data, overall coupling was found to be around 0.02 for the whole frequency range. (B) Median absolute difference in degree of coupling (GPDC) (left) and proportion of pairs showing a significant change (p < 0.001) in coupling between pre-stimulus baseline and delay period for different frequency bands (right). Error bars correspond to ±34th percentiles around the median. In both monkeys, the median change in coupling between baseline and delay is highest in the theta band (non-parametric ANOVA Kruskal–Wallis test, χ2 = 11.4/4.23, p < 0.01). Likewise, the proportion of pairs showing significant changes in coupling is also highest in the theta band compared to the other frequency bands (χ2 test for comparison of proportions, χ2 > 8.2, p < 0.001 for all comparisons).
Subsequently, we assessed changes in coupling between the baseline and the delay period for several frequency bands that have been traditionally implicated in the interaction of oscillatory components during sensation and cognition and also follow conventional definitions of theta and beta bands [theta (3–12 Hz), beta (20–35 Hz), gamma (40–80 Hz); Buzsaki, 2006 ]. Figure 4 B shows the median absolute difference in coupling between baseline and delay period (left). The graph shows that the degree of change significantly decreases with increasing frequencies with the largest coupling change occurring in the theta band. Likewise, the proportion of pairs that show significant changes in coupling is highest in the theta range compared to the other frequency bands (right). In the theta band, 116 of 202 pairs showed significant changes in coupling (57%, p < 0.001) in monkey 1, in monkey 2 235 pairs showed significant changes in coupling (59%, p < 0.001). In both monkeys we found significant increases as well as decreases in theta coupling during the delay when compared to the baseline. Specifically, in monkey 1 74 pairs showed significant increases, and 42 pairs showed significant decreases in coupling. In contrast, in monkey 2 89 pairs showed increases and 146 pairs decreases. Thus, monkey 1 shows significantly more increases than monkey 2 and vice versa (χ2 = 18.5, p < 0.01). One factor that might contribute to this difference is the different distribution of electrode spacing between the animals, with monkey 1 showing significantly larger distances between electrodes than monkey 2 (mean [median] distance 4.6 [4]/3.5 [3] for monkey 1/2, respectively; ranksum-test, Z = 5.23, p < 0.01). This is supported by several facts. First, for the smallest distance between electrodes, i.e., the distance that is identical and therefore comparable between the animals (unit 1, or 0.5 mm), the proportion of increases vs. decreases is similar between the monkeys, i.e., statistically identical (50%/27% increases, Z = 3.6, p > 0.05). Second, for the smallest distance we find an identical proportion of increases and decreases (i.e., 50/50) in monkey 1. Third, the proportion of significant decreases is slightly enhanced for smaller distances (50% at distance 1 vs. 20% at distance 4 for monkey 1, and 72% vs. 53% for distances 1 and 3 for monkey 2) and likewise the proportion of increases reduced at smaller distances. As the distances between electrodes are significantly lower in monkey 2 compared to monkey 1, the percentage of decreases should be higher in monkey 2, and vice versa. Ultimately, due to the limitations in spatial sampling, the differences in spatial configuration can only give an indication of why we find differences in the proportion of significantly increased vs. decreased coupling between the monkeys. In summary, our findings demonstrate that significant directed interactions between LFP within V4 during visual memory predominantly occur in the theta-frequency range and the frequencies at which highest coupling occurs are comparable to the frequency range of power increases during the delay period. Based on these results we further investigated the time course and directionality of theta coupling during the delay period.
Time Course and Directionality of Coupling
To illustrate the time course of theta coupling during the task, we used moving windows comprising time intervals of 250 ms (with an overlap of 200 ms) and fitted MVAR models to these individual windows. Figure 5 shows representative time courses of theta coupling in single recording pairs as well as the time course of coupling in the opposite direction (left/right graphs, respectively). These examples represent channel pairs with a significant (p < 0.001) increase or decrease in GPDC during the delay period compared to the baseline period and were chosen based on the previous analyses using coupling measures obtained from 1 s windows (see also Materials and Methods).
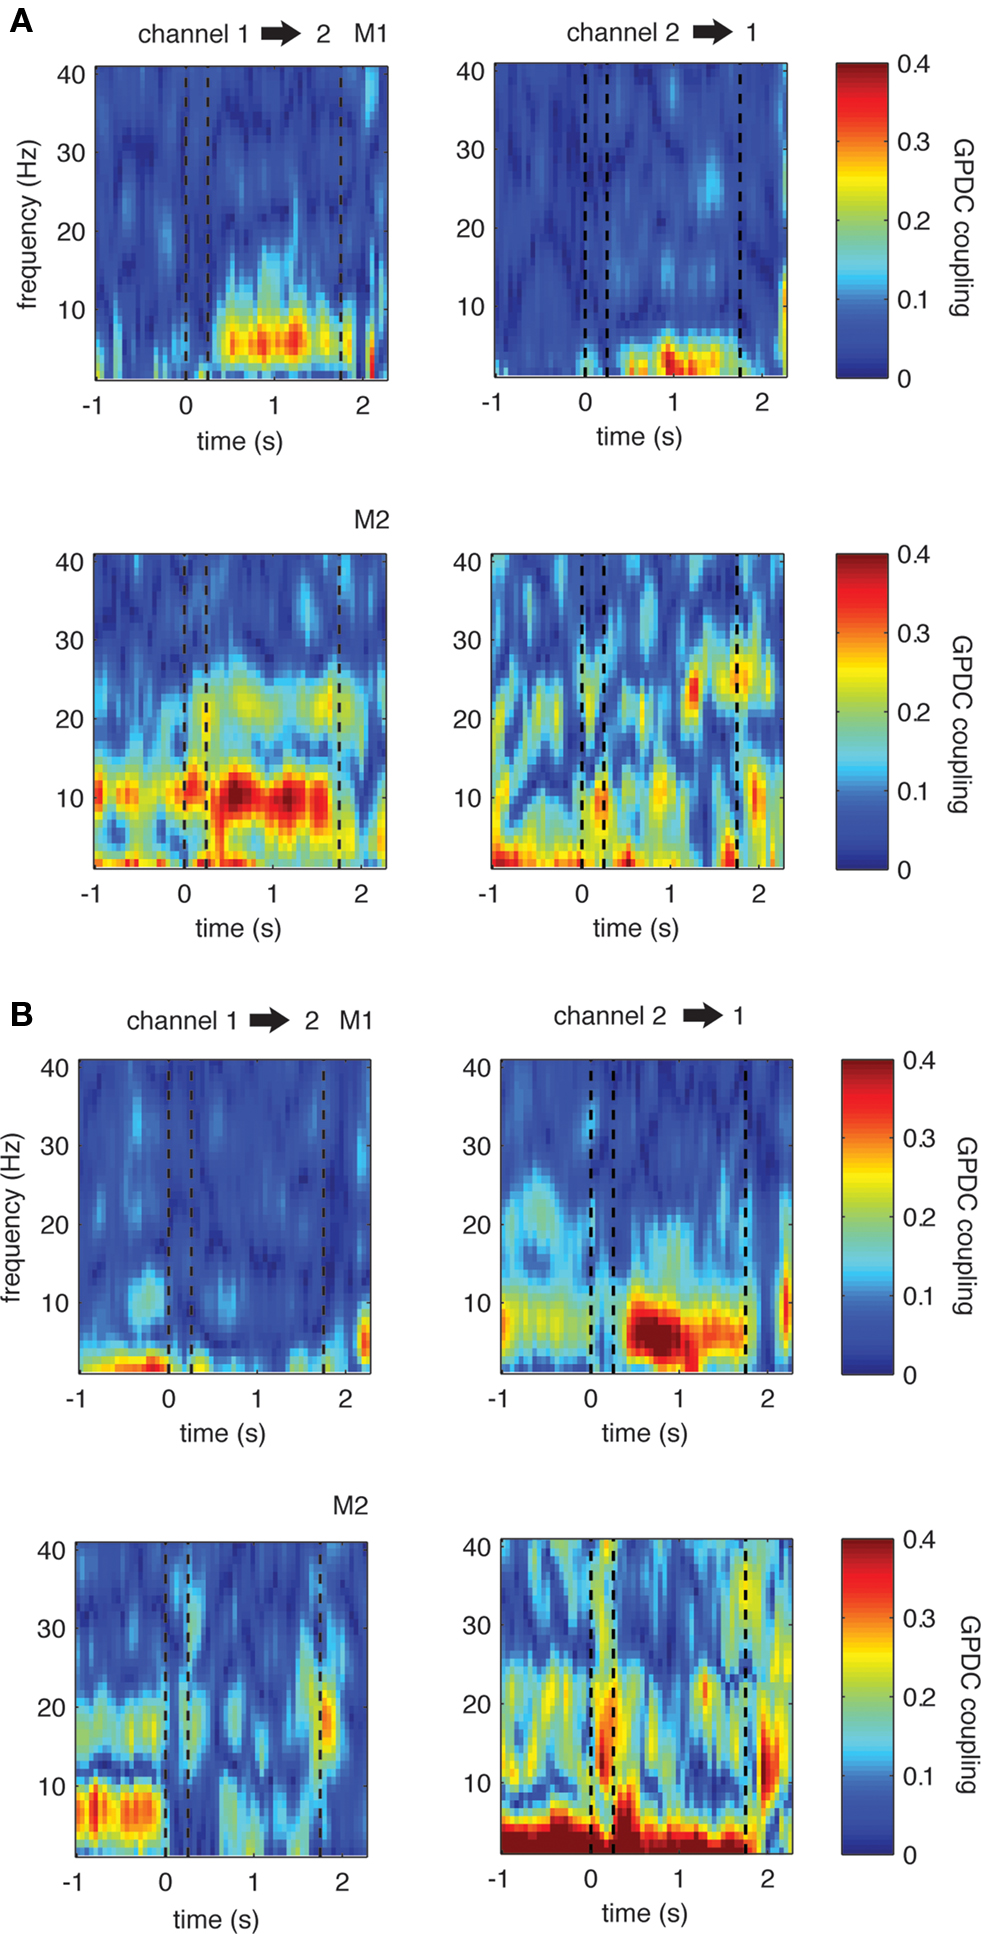
Figure 5. Single example LFP channel pairs showing significant changes in coupling during the delay period compared to baseline. (A) One example for each monkey in which there is significant increase in coupling in the direction from channel 1 to 2 (left). (B) Two examples in which there is significant decrease in theta in one direction (left). The opposite directions show less strong or even opposing trends, indicating that coupling is not symmetric between sites. Dashed lines represent the on- and offset of the sample stimulus, as well as the onset of the first test stimulus during the trials, from left to right, respectively. This convention is also used in the subsequent figures.
In all examples, theta increases and decreases occur shortly after the offset of the sample stimulus and are sustained throughout the entire 1500 ms long delay period. Interestingly, in all selected pairs we find differences in coupling strength and even opposing effects between pair directions, for example a significant increase in theta coupling in one, and a significant decrease in theta coupling in the opposite direction (see graph B example for monkey 1). To investigate this asymmetry across all channel pairs in more detail, we first computed the median coupling across all pairs showing significant increases or decreases in the theta band. We subsequently selected all pairs with the respective opposite direction and computed the median coupling across these pairs. The reasoning behind the procedure is as follows: if all channels show significant changes in theta coupling in both directions (i.e., from channel X to channel Y and from channel Y to channel X), each channel pair will be represented in both groups. Consequently the median coupling across the channel pairs would be the same.
However, this is not the case. Figure 6 displays the resulting median coupling strength over all site pairs showing significant couplings within the theta range (left) and their respective opposite direction (right): for both monkeys we find asymmetrical, i.e., more unidirectional increases and decreases in theta coupling during the delay. This result is further illustrated in Figure 7 that shows the ratio of median coupling between pairs of channels and their opposite directions separately for each monkey (Figures 7 A,B). Furthermore, Figure 7 C shows coupling strength in the delay for sites with significant changes from baseline to delay in the theta band vs. the couplings in the opposite direction. Similarly to the observed asymmetries in coupling values, significant proportions of pairs (64/48% monkey 1/2, Z > 15.4, p < 0.001) show significant increases in one direction only and significant proportions of pairs (57/58% monkey 1/2, Z > 18.6, p < 0.001) of the pairs show significant decreases in only one direction. Overall, in three out of four cases, the majority of pairs showed significant changes of coupling in one channel pair direction, but not the other.
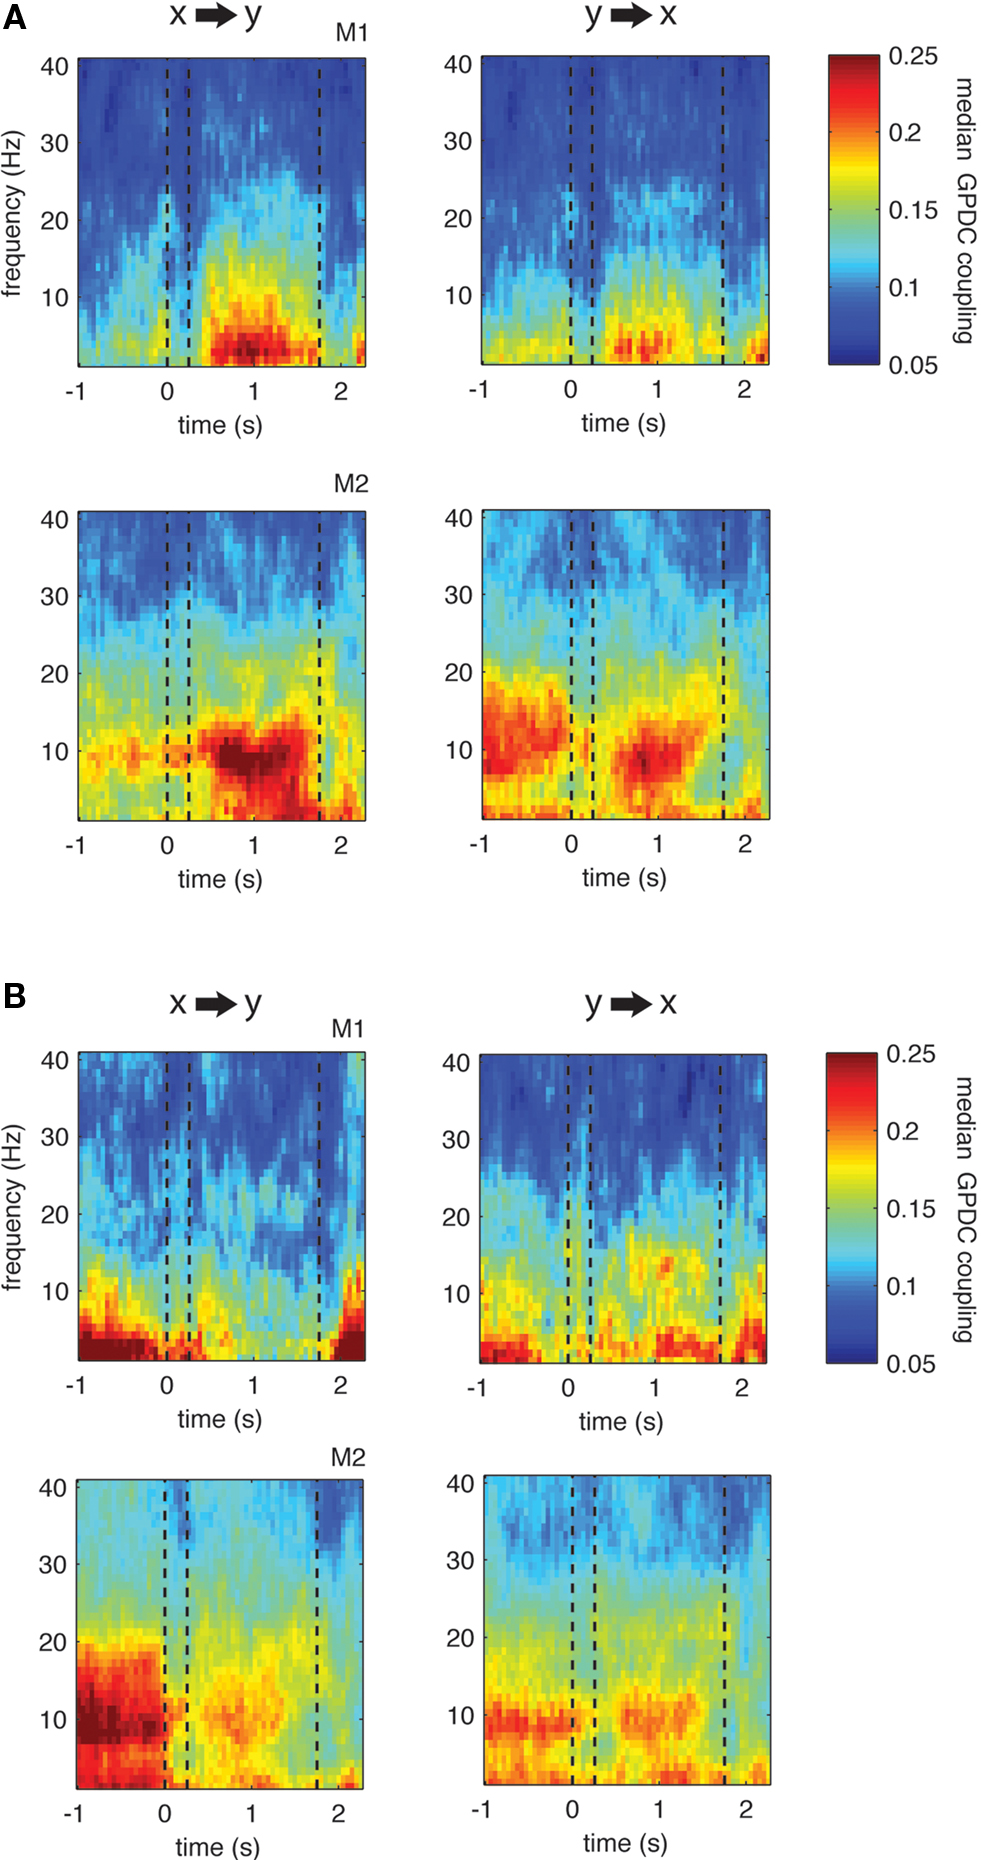
Figure 6. Grand-Median directed coupling across all pairs showing significant increase (A) or decrease (B) during delay compared to baseline (p < 0. 001, left column) as well as the median coupling for the opposite direction of channel pairs (right column). Note that if there is significant increase (decrease) in both directions (i.e., from x to y and vice versa), both channel pair directions will contribute to the median for both directions of interaction. Otherwise, if all pairs would show significant increase (decrease) in both directions, left and right plots would be identical.
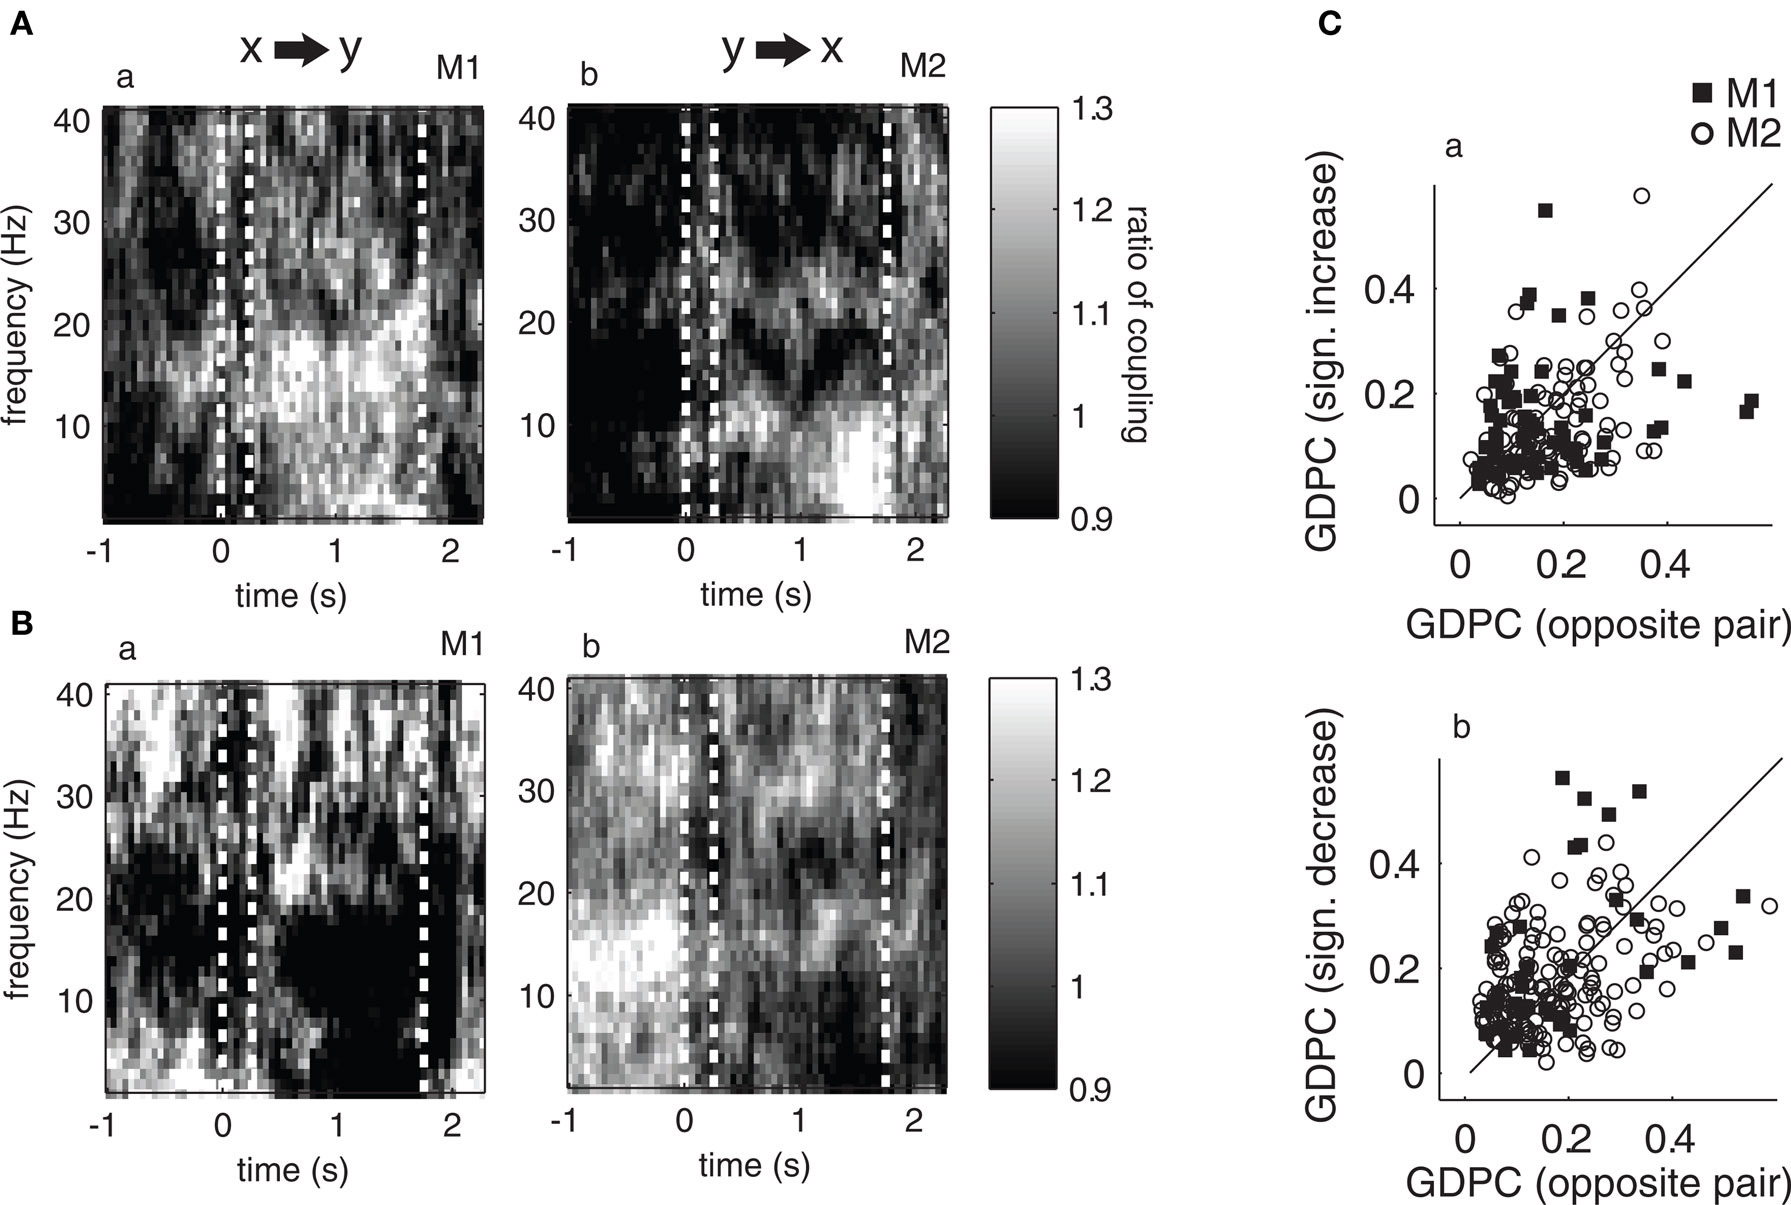
Figure 7. Ratio of median coupling between pairs showing significantly enhanced (A) and reduced (B) directed coupling during baseline and their opposite pairs (i. e., coupling in opposite direction). Plots a–b show the ratio of median coupling across the time course of the trial for different frequencies for monkey 1 and 2, respectively. A ratio larger (or smaller) than one indicates a stronger median coupling in one than the opposite direction, thus the ratio is an indicator of how “directed” or “symmetric” the coupling is between pairs of channels. Graphs (C) plot the degree of coupling of significant pairs and their opposite directions (y-axis pairs chosen based on sign difference between delay and baseline, x-axis shows opposite direction) in the theta band. If the degree of coupling is not symmetric between directions, data points deviate from the diagonal. Also note that if there was a significant increase (decrease, respectively) in both directions for a single pair, two data points are shown (one below, one above the diagonal if the respective increase/decrease is not fully symmetric).
Taken together, these findings illustrate that theta coupling during the delay is not symmetric between channel pairs and provide evidence for a complex interaction involving both directionally dependent increases and decreases in coupling during visual memory. In the following we examine a different aspect of these coupling phenomena, namely their dependence on the spatial layout of the different oscillatory components. Our recording setup allowed us to simultaneously measure the activity of up to 6 LFP electrodes that were spatially distributed across a cortical surface area of approximately 6 mm × 6 mm. Therefore, within one session, electrode locations varied in spatial position and distance to each other.
Relation of Coupling Strength and Distance Between Recording Sites
Figure 8 illustrates the dependence of absolute directed coupling and changes of coupling on the distance between electrodes, with higher direct coupling occurring at lower distances (both monkeys: ρs = −0.52/−0.32, p < 0.0001). Similar effects were found for the changes in coupling (i.e., decrease M1: rank correlation coefficient ρs = −0.24, p < 0.05, M2: ρs = −0.31, p < 0.01 and increase M1: ρs = −0.12, p = 0.1, M2: ρs = −0.2, p < 0.05) during delay with respect to the baseline). Note that the decrease of change in coupling with higher distance in monkey 1 does not reach a significance level of p < 0.05 for increases in coupling, but is at trend level.
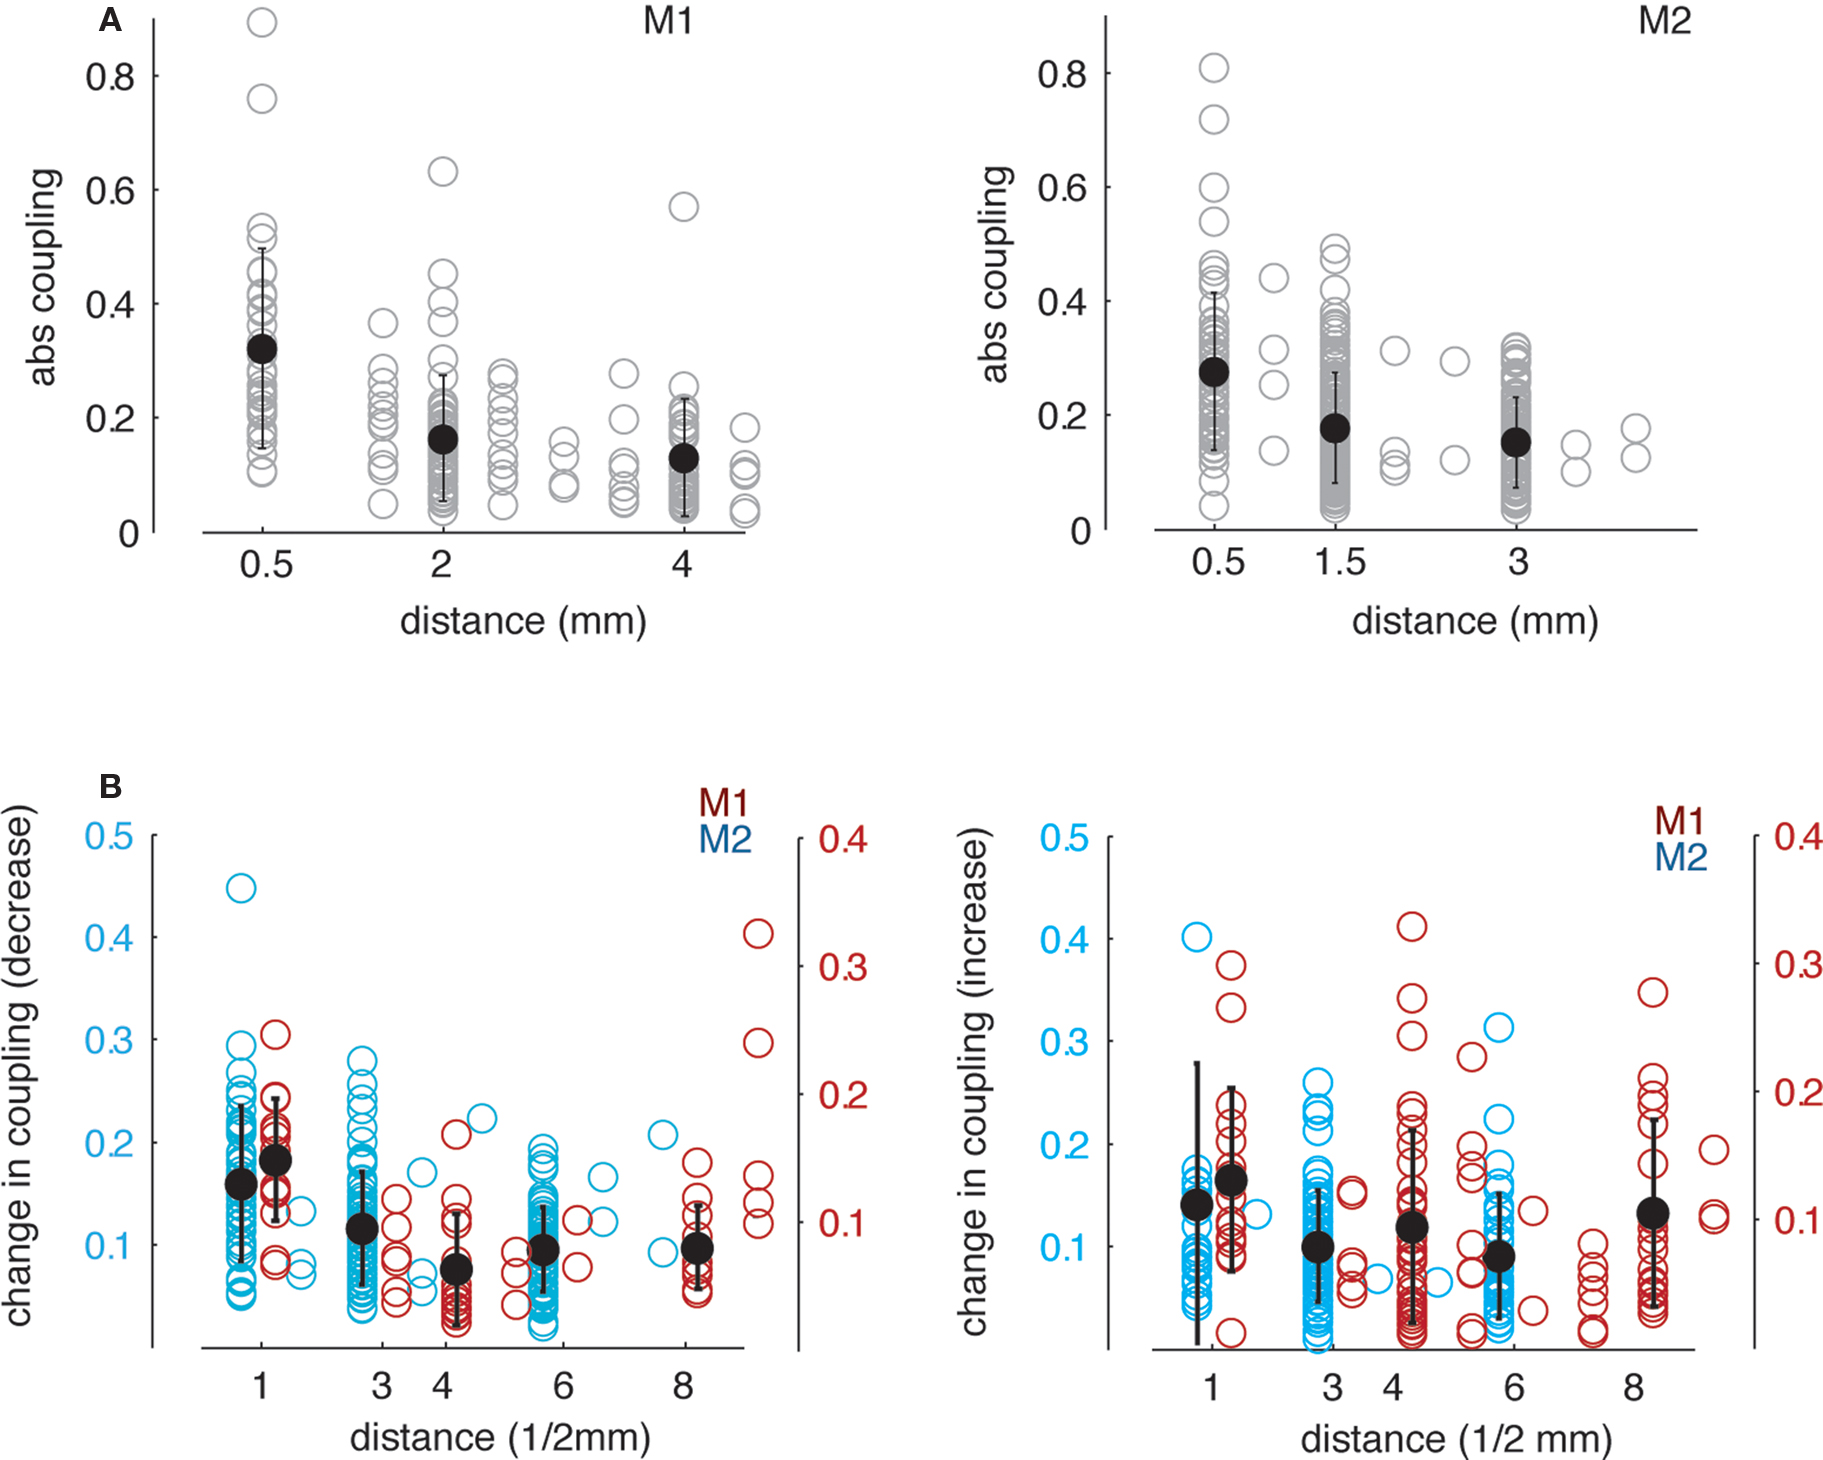
Figure 8. Dependence of GPDC in theta band on distance between simultaneously recorded channels. (A) Absolute coupling as a function of Euclidian distance across all recorded pairs. Open symbols denote coupling values for single pairs, closed symbols represent the mean ± 1 SD across pairs within three bins. For both monkeys, absolute coupling decreases with increasing distance. (B) Dependence of increases and decreases in GPDC during delay relative to baseline in theta band on distance between simultaneously recorded channels. Absolute decrease (left) and increase (right) in coupling as a function of Euclidian distance across all recorded pairs showing decreases (left) or increases (right) in coupling. In both cases, changes in coupling during delay are higher for smaller distances. Note that we shifted the data points for M1 (blue) and M2 (red) slightly to the left and to the right, respectively for better visual discriminability.
Our results indicate that both the strength of coupling and the change in coupling from the baseline to the delay condition are stronger for smaller distances between site pairs. This dependence could be found despite the differences in electrode spacing between the animals (see also General Coupling Analysis). Thus, not only absolute coupling but also the dynamic changes in coupling are a local phenomenon within the neural network. Our findings are consistent with earlier reports for example from V1 recordings of in the macaque showing that pairwise spectral coherence in LFP activity between electrodes decreases as a function of receptive field distance (which is related to spatial distance; Frien and Eckhorn, 2000 ) and from recordings of several sites of the human cortex (Raghavachari et al., 2006 ) and extend these previous results using directed coupling measures.
Discussion
Oscillatory activity in neural networks as measured by EEG or LFP recordings is a widespread phenomenon of neural behavior and is thought to arise from the synchronous activity of neuronal populations at various spatial and temporal scales (Salinas and Sejnowski, 2001 ; Buzsaki and Draguhn, 2004 ; Fries, 2005 ). In many studies it has been shown that oscillations in different frequency bands are important for neural computations. Synchronous activity can, for example, establish and support temporal relationships between different elements within a neural network depending on context, stimulus or behavioral state (Tallon-Baudry, 2009 ; Uhlhaas et al., 2009 ) or represent information about sensory events that can not be inferred from spiking activity alone (Montemurro et al., 2008 ). Thus, oscillatory activity serves the precisely timed cooperation between neural ensembles and could also provide temporal windows that allow for the selective routing and gating of information in an efficient manner (Mizuseki et al., 2000 ; Fries et al., 2001 ; Salinas and Sejnowski, 2001 ). Another important characteristic of neuronal oscillations is that oscillations at different frequencies are thought to subserve different behavioral and cognitive functions. Prominent examples are the involvement of gamma oscillations (>40 Hz) in visual and attention-related processes (Fries et al., 2001 ; Keil et al., 2001 ), the role of beta oscillations (15–35 Hz) in sensorimotor tasks (Murthy and Fetz, 1992 ) and the importance of theta oscillations in memory-related processing (Okeefe, 1993 ; Rainer et al., 2004 ; Lee et al., 2005 ; Raghavachari et al., 2006 ).
The quantification of neural synchrony has traditionally been carried out using measures that assess the pairwise and instantaneous correlation in either amplitude or phase between two neural signals, for example using cross-correlation analysis between spike trains of multiple neurons (Aertsen and Arndt, 1989 ), spike-field coherence between the spiking activity of neurons and LFP activity (Fries et al., 2001 ; Pesaran et al., 2002 ) or phase-locking analysis of simultaneously recorded LFP or EEG data (Lachaux et al., 1999 , 2000 ). However, despite the fact that these measures assess the strength with which two neural processes are coupled, they fail to provide information on several aspects of synchronization that can be important to fully describe their interaction, for example the direction of coupling between neural elements.
Here, MVAR models have proven to be efficient tools for assessing the direction of coupling and can be more appropriate to capture the complexity of oscillatory dynamics as synchrony between neuronal ensembles changes across time or behavioral conditions. However, it is important to note that unipolar signals are vulnerable to volume conducted far-field effects and issues related to the usage of a common reference against which all differences in electrical potential are measured. Both factors might lead to adversely affected measures of coupling strengths, and elaborate methods for resolving these issues completely (besides using bipolar signals) need still be found (Schlögl and Supp, 2006 ; Bollimunta et al., 2009 ). Nevertheless, the application of coupling measures based on MVAR models has revealed important insights into neural interactions in many studies (Bressler et al., 1999 ; Brovelli et al., 2004 ; Supp et al., 2007 ; Kayser and Logothetis, 2009 ). For example, Brovelli et al. (2004) analyzed interaction patterns in monkey sensorimotor cortex and found unidirectional couplings from somatosensory areas to motor areas within the beta frequency range that might be used to control motor output. In a different study Kayser and Logothetis (2009) investigated interactions of monkey auditory and superior temporal cortices related to sensory integration and found that while interactions from auditory cortex to superior temporal regions prevail below 20 Hz, interactions in the other direction are more pronounced at frequencies above 20 Hz. A third example are the findings of the study by Supp et al. (2007) in which the authors demonstrated that visual processing of familiar and unfamiliar objects engages different cortical networks at different degrees of directionality via interactions in the gamma frequency range. In all these studies, MVAR models revealed insights into the directed spatio-temporal dynamics of multiple cortical areas during cognitive processing that went beyond the description of synchrony between these areas.
In our study we used MVAR models to provide a description of the directed coupling of theta oscillations during short-term memory. This oscillatory phenomenon has been described in a number of studies in relation to short-term memory processes both in humans and animals. There are mainly two lines of research that focus on the role of these oscillations for memory-related processes. A large set of studies provides strong evidence on a connection between theta oscillations and (especially spatial) memory for the rat hippocampus, revealing that the timing of spikes both within hippocampus and within regions like prefrontal cortex is strongly connected to the hippocampal theta rhythm (Okeefe, 1993 ; Mizuseki et al., 2000 ; Buzsaki and Draguhn, 2004 ; Siapas et al., 2005 ). A second line of research has concentrated on the importance of theta oscillations for memory performance in primates with the focus on EEG and LFP recordings in various cortical areas. Using EEG in human subjects, multiple studies have shown that there are increases as well as decreases in theta power that can depend on the specific nature of the memory task demand (Klimesch, 1999 ; Raghavachari et al., 2001 , 2006 ). For example, Raghavachari et al. (2001 , 2006 ) showed an increase in theta power during the delay period of a memory task that co-varied with delay period length in multiple cortical regions, including frontal, temporal and occipital areas. Very recently, one study also incorporated MVAR modeling to reveal directional influences between different cortical regions (Anderson et al., 2009 ), providing evidence for memory-related theta-frequency interactions between prefrontal and medial temporal sites in the human brain. In contrast to human studies, only few studies have investigated the relation between theta oscillations and visual memory in the non-human primate. Here, research has focused on the extrastriate visual area V4, in which theta oscillations occur during the memory phase of the task, are modulated by task difficulty (Rainer et al., 2004 ) and are involved in the coding of visual stimuli during visual memory (Lee et al., 2005 ). In summary, research on theta synchrony during short-term memory has thus far provided evidence for the hypothesis that memory processing is accompanied by increased theta power and synchrony.
However, as previously mentioned, measures of directed coupling based on MVAR modeling have shown to be useful for investigating the complex interaction patterns in LFP during cognitive processing. Thus we applied these coupling measures to analyze neural interactions in the theta band during visual short-term memory within V4. Our analyses firstly confirmed earlier results, showing enhanced theta power during the delay period. Using the coupling measures based on MVAR models, we additionally found increases as well as decreases in coupling between recording sites in the delay period with respect to the baseline period that were most prominent in the theta band. This was evident in the coupling value estimates as well as in the proportion of site pairs showing significant changes in coupling. More importantly, however, we showed that these changes in coupling tend to be asymmetric between sites, i.e., they depend on the considered direction between site pairs. This finding suggests that not the mere occurrence of oscillatory activity or coherence in the theta band correlates with memory processing. Instead, the selective and direction-dependent change in theta coupling, which ultimately represents a change in functional connectivity within the neural circuit, plays an important role in this process. Our results on the asymmetrical nature of directed interaction during memory also favors the hypothesis that theta oscillations and therefore coupling arise locally within the V4 network. In contrast, if coupling would be a phenomenon due to common input, one would expect bidirectional coupling with similar strength in both directions if the data from the neural elements producing the common input is not incorporated by the model. When interpreting the results from MVAR models, one should keep in mind that the model is based on data from only a small subset of the whole neural system (Stevenson et al., 2008 ). In addition, we were able to confirm earlier work on the relations of interaction strength and spatial distance that showed decreasing coherence of signals with increasing distance between sites and extended their results by measuring direct causal interactions instead of coherence (Frien and Eckhorn, 2000 ; Raghavachari et al., 2006 ).
Taken together, these effects would not have been revealed using more traditional methods that incorporate only phase synchronization or coherence. Therefore, our work clearly shows the advantage of using directed coupling measures based on MVAR models for studying functional connectivity patterns within the brain and highlights the importance of direction-dependent modulations of local interactions between neural populations for studying sensory and cognitive processing.
Finally, we would like to point out that while the methods that we applied provide important insights into the functional connectivity patterns within the brain, their power is still limited because they can only assess linear interactions. While some extensions to nonlinear MVAR models (together with all the issues of nonlinear optimization) have been proposed (Pereda et al., 2005 ; Sun, 2008 ; Jachan et al., 2009 ), there is still work to be done to further improve these methods. In addition, our findings provide only the elementary description of the pattern of interaction between different oscillatory processes during visual memory. Further investigation will be needed to assess the specific role of directed coupling in relation to various cognitive parameters, for example task difficulty, performance or memory load. In addition, MVAR analysis can also be used to assess the interactions of LFP and spiking activity if the spike trains are properly preprocessed for this purpose. Here, it seems to be interesting to see how oscillations at the level of the LFP exert an influence on neuronal firing directly measured from the spiking activity of single neurons.
Conflict of Interest Statement
The authors declare that the research was conducted in the absence of any commercial or financial relationships that could be construed as a potential conflict of interest.
Acknowledgments
Written under partial support by the Max Planck Society, the Austrian Science Fund FWF #S9102-N13 and projects #FP7-506778 (PASCAL2) and # FP7-231267 (ORGANIC) of the European Union. We would like to thank Jakob Macke for helpful discussions and useful comments on the manuscript.
Supplementary Material
The Supplementary Material for this article can be found online at http://www.frontiersin.org/computationalneuroscience/paper/10.3389/fncom.2010.00014/
References
Aertsen, A., and Arndt, M. (1989). Response synchronization in the visual cortex. Curr. Opin. Neurobiol. 3, 586–594.
Akaike, H. (1974). A new look at the statistical model identification. IEEE Trans. Automat. Contr. 19, 716–723.
Anderson, K. L., Rajagovindan, R., Ghacibeh, G. A., Meador, K. J., and Ding, M. (2009). Theta oscillations mediate interaction between prefrontal cortex and medial temporal lobe in human memory. Cereb. Cortex (in press), doi: 10.1093/cercor/bhp223
Baccala, L., and Sameshima, K. (2001). Partial directed coherence: a new concept in neural structure determination. Biol. Cybern. 84, 463–474.
Baccala, L., Sameshima, K., and Takahashi, D. (2007). Generalized Partial Directed Coherence. 15th International Conference on Digital Signal Processing, 2007, Cardiff, 163–166.
Bollimunta, A., Chen, Y., Schroeder, C., and Ding, M. (2008). Neuronal mechanisms of cortical alpha oscillations in awake-behaving macaques. J. Neurosci. 28, 9976–9988.
Bollimunta, A., Chen, Y., Schroeder, C., and Ding, M. (2009). Characterizing oscillatory cortical networks with Granger causality. in Coherent Behavior in Neuronal Networks, eds K. Josić, J. Rubin, M. Matías, and R. Romo (New York: Springer), 169–189. doi: 10.1007/978-1-4419-0389-1_9.
Bressler, S. L., Ding, M., and Yang, W. (1999). Investigation of cooperative cortical dynamics by multivariate autoregressive modeling of event-related local field potentials. Neurocomputing 26–27, 625–631.
Bressler, S. L., Richter, C. G., Chen, Y., and Ding, M. (2007). Cortical functional network organization from autoregressive modeling of local field potential oscillations. Stat. Med. 26, 3875–3885.
Brovelli, A., Ding, M., Ledberg, A., Chen, Y., Nakamura, R., and Bressler, S. L. (2004). Beta oscillations in a large-scale sensorimotor cortical network: directional influences revealed by Granger causality. Proc. Natl. Acad. Sci. U.S.A. 101, 9849–9854.
Buzsaki, G. (2005). Theta rhythm of navigation: link between path integration and landmark navigation, episodic and semantic memory. Hippocampus 15, 827–840.
Buzsaki, G., and Draguhn, A. (2004). Neuronal oscillations in cortical networks. Science 204, 1926–1929.
Chen, Y., Bressler, S. L., and Ding, M. (2006). Frequency decomposition of conditional Granger causality and application to multivariate neural field potential data. J. Neurosci. Methods 150, 228–237.
Cui, J., Xu, L., Bressler, S., M., D., and Liang, H. (2008). BSMART: a Matlab/C toolbox for analysis of multichannel neural time series. Neural Netw. 21, 1094–1104.
Ding, M., Bressler, S. L., Yang, W., and Liang, H. (2000). Short-window spectral analysis of cortical event-related potentials by adaptive multivariate autoregressive modelling: data preprocessing, model validation, and variability assessment. Biol. Cybern. 83, 35–45.
Efron, B., and Tibshirani, R. J. (1993). An Introduction to the Bootstrap. New York: Chapman and Hall.
Frien, A., and Eckhorn, R. (2000). Functional coupling shows stronger stimulus dependency for fast oscillations than for low frequency components in striate cortex of awake monkey. Eur. J. Neurosci. 12, 1466–1478.
Fries, P. (2005). A mechanism for cognitive dynamics: neuronal communication through neuronal coherence. Trends Cogn. Sci. 9, 474–480.
Fries, P., Reynolds, G., Rorie, A., and Desimone, R. (2001). Modulation of oscillatory neuronal synchronization by selective visual attention. Science 291, 1560–1563.
Gail, A., Brinksmeyer, H., and Eckhorn, R. (2004). Perception-related modulations of local field potential power and coherence in primary visual cortex of the awake monkey during binocular rivalry. Cereb. Cortex 14, 300–313.
Gourevitch, B., Le Bouquin-Jeannes, R., and Faucon, G. (2006). Linear and nonlinear causality between signals: methods, examples and neurophysiological applications. Biol. Cybern. 95, 349–369.
Graimann, B., and Pfurtscheller, G. (2006). Quantification and visualization of event-related changes in oscillatory brain activity in the time-frequency domain. Prog. Brain Res. 159, 79–97.
Granger, C. W. J. (1969). Investigating causal relations by econometric models and cross-spectral methods. Econometrica 37, 424–438.
Jachan, M., Henschel, K., Nawrath, J., Schad, A., Timmer, J., and Schelter, B. (2009). Inferring direct directed-information flow from multivariate nonlinear time series. Phys. Rev. E Stat. Nonlin. Soft Matter Phys. 80. 011138-1 – 011138-5. doi: 10.1103/PhysRevE.80.011138
Kaminski, M., and Blinowska, K. (1991). A new method of the description of the information flow in brain structures. Biol. Cybern. 65, 203–210.
Kayser, C., and Logothetis, N. K. (2009). Directed interactions between auditory and superior temporal cortices and their role in sensory integration. Front. Integr. Neurosci. 3:7. doi: 10.3389/neuro.07.007.2009.
Keil, A., Gruber, T., and Müller, M. (2001). Functional correlates of macroscopic high-frequency brain activity in the human visual system. Neurosci. Biobehav. Rev. 25, 527–534.
Klimesch, W. (1999). EEG alpha and theta oscillations reflect cognitive and memory performance: a review and analysis. Brain Res. Rev. 29, 169–195.
Kus, R., Kaminski, M., and Blinowska, K. J. (2004). Determination of EEG activity propagation: pair-wise versus multichannel estimate. IEEE Trans. Biomed. Eng. 51, 1501–1510.
Lachaux, J.-P., Rodriguez, E., Le Van Quyen, M., Lutz, A., Martinerie, J., and Varela, F. J. (2000). Studying single-trials of phase synchronous activity in the brain. Int. J. Bifurcat. Chaos 10, 2429–2439.
Lachaux, J.-P., Rodriguez, E., Martinerie, J., and Varela, F. J. (1999). Measuring phase synchrony in brain signals. Hum. Brain Mapp. 8, 194–208.
Lee, H., Simpson, G., Logothetis, N., and Rainer, G. (2005). Phase locking of single neuron activity to theta oscillations during working memory in monkey extrastriate visual cortex. Neuron 45, 147–156.
Liang, H., Bressler, S. L., Ding, M., Desimone, R., and Fries, P. (2003). Temporal dynamics of attention-modulated neuronal synchronization in macaque v4. Neurocomputing 52–54, 481–487.
Liang, H., Ding, M., and Bressler, S. L. (2000). On the tracking of dynamic functional relations in monkey cerebral cortex. Neurocomputing 32–33, 891–896.
Liang, H., Ding, M., and Bressler, S. L. (2001). Temporal dynamics of information flow in the cerebral cortex. Neurocomputing 38–40, 1429–1435.
Liebe, S., Fischer, E., Logothetis, N. K., and Rainer, G. (2009). Color and shape interactions in the recognition of natural scenes by human and monkey observers. J. Vis. 9, 1–16.
Mizuseki, K., Sirota, A., Pastalkova, E., and Buzsaki, G. (2000). Theta oscillations provide temporal windows for local circuit computation in the entorhinal-hippocampal loop. Neuron 64, 267–280.
Montemurro, M., Rasch, M., Murayama, Y., Logothetis, N., and Panzeri, S. (2008). Phase-of-firing coding of natural visual stimuli in primary visual cortex. Curr. Biol. 18, 375–380.
Murthy, V., and Fetz, E. (1992). Coherent 25–25-hz oscillations in the sensorimotor cortex of awake behaving monkeys. Proc. Natl. Acad. Sci. U.S.A. 15, 5670–5674.
Nunez, P. L., Silberstein, R. B., Shi, Z., Carpenter, M. R., Srinivasan, R., Tucker, D. M., Doran, S. M., Cadusch, P. J., and Wijesinghe, R. S. (1999). EEG coherency II: experimental comparisons of multiple measures. Clin. Neurophysiol. 110, 469–486.
Nunez, P. L., Srinivasan, R., Westdorp, A. F., Wijesinghe, R. S., Tucker, D. M., Silberstein, R. B., and Cadusch, P. J. (1997). EEG coherency I: statistics, reference electrode, volume conduction, Laplacians, cortical imaging, and interpretation at multiple scales. Electroencephalogr. Clin. Neurophysiol. 103, 499–515.
Pereda, E., Quiroga, R. Q., and Bhattacharya, J. (2005). Nonlinear multivariate analysis of neurophysiological signals. Prog. Neurobiol. 77, 1–37.
Pesaran, B., Pezaris, J., Sahani, M., Mitra, P., and Andersen, R. (2002). Temporal structure in neuronal activity during working memory in macaque parietal cortex. Nat. Neurosci. 5, 805–811.
Porcaro, C., Zappasodi, F., Rossini, P. M., and Tecchio, F. (2009). Choice of multivariate autoregressive model order affecting real network functional connectivity estimate. Clin. Neurophysiol. 120, 436–448.
Raghavachari, S., Kahana, M., Rizzuto, D., Caplan, J., Kirschen, M., Bourgeois, B., Madsen, J., and Lisman, J. (2001). Gating of human theta oscillations by a working memory task. J. Neurosci. 21, 3175–3183.
Raghavachari, S., Lisman, J., Tully, M., Madsen, J., Bromfield, E., and Kahana, M. (2006). Theta oscillations in human cortex during a working-memory task: evidence for local generators. J. Neurophysiol. 95, 1630–1638.
Rainer, G., Lee, H., Simpson, G., and Logothetis, N. (2004). Working-memory related theta (4–7 Hz) frequency oscillations observed in monkey extrastriate visual cortex. Neurocomputing 58–60. doi: 10.1016/j.neucom.2004.01.153
Salinas, E., and Sejnowski, T. (2001). Correlated neuronal activity and the flow of neuronal information. Nat. Rev. Neurosci. 2, 539–550.
Schelter, B. (2009). Assessing the strength of directed influences among neural signals using renormalized partial directed coherence. J. Neurosci. Methods 179, 121–130.
Schlögl, A. (2000).The Electroencephalogram and the Adaptive Autoregressive Model: Theory and Applications. Aachen: Shaker Verlag.
Schlögl, A. (2006). A comparison of multivariate autoregressive estimators. Signal Processing 86, 2426–2429. Special Section: Signal Processing in UWB Communications.
Schlögl, A., and Brunner, C. (2008). BioSig: a free and open source software library for BCI research. Computer 41, 44–50.
Schlögl, A., and Supp, G. (2006). Analyzing event-related EEG data with multivariate autoregressive parameters. Prog. Brain Res. 91, 135–147.
Siapas, A., Lubenov, E., and Wilson, M. (2005). Prefrontal phaselocking to hippocampal theta oscillations. Neuron 46, 141–151.
Stevenson, I., Rebesco, J., Miller, L., and Körding, K. (2008). Inferring functional connections between neurons. Curr. Opin. Neurobiol. 18, 582–588.
Sun, X. (2008). “Assessing nonlinear Granger causality from multivariate time series,” in ECML PKDD ’08: Proceedings of the European conference on Machine Learning and Knowledge Discovery in Databases – Part II (Berlin/Heidelberg: Springer), 440–455.
Supp, G. G., Schlögl, A., Trujillo-Barreto, N., Müller, M. M., and Gruber, T. (2007). Directed cortical information flow during human object recognition: analyzing induced EEG gamma-band responses in brain’s source space. PLoS ONE 2, e684. doi: 10.1371/journal.pone.0000684.
Tallon-Baudry, C. (2009). The roles of gamma band oscillatory synchrony in human visual cognition. Front. Biosci. 14, 321–332.
Tallon-Baudry, C., and Bertrand, O. (1999). Oscillatory gamma activity in humans and its role in object representation. Trends Cogn. Sci. (Regul. Ed.) 3, 151–162.
Uhlhaas, P., Pipa, G., Lima, B., Melloni, L., Neuenschwander, S., Nikolic, D., and Singer, W. (2009). Neural synchrony in cortical networks: history, concept and current status. Front. Integr. Neurosci. 3:17. doi: 10.3389/neuro.07.017.2009.
Keywords: multivariate autoregressive model, local field potential, partial directed coherence, visual short term memory, macaque monkey, theta frequency range, V4, multi-channel recordings
Citation: Hoerzer GM, Liebe S, Schloegl A, Logothetis NK and Rainer G (2010) Directed coupling in local field potentials of macaque V4 during visual short-term memory revealed by multivariate autoregressive models. Front. Comput. Neurosci. 4:14. doi: 10.3389/fncom.2010.00014
Received: 30 November 2009;
Paper pending published: 30 March 2010;
Accepted: 30 April 2010;
Published online: 26 May 2010
Edited by:
Nicolas Brunel, Centre National de la Recherche Scientifique, FranceReviewed by:
Hualou Liang, Drexel University, USAMingzhou Ding, University of Florida, USA
Copyright: © 2010 Hoerzer, Liebe, Schloegl, Logothetis and Rainer. This is an open-access article subject to an exclusive license agreement between the authors and the Frontiers Research Foundation, which permits unrestricted use, distribution, and reproduction in any medium, provided the original authors and source are credited.
*Correspondence:
Gregor M. Hoerzer, Institute for Theoretical Computer Science, Graz University of Technology, Inffeldgasse 16b/I, A-8010 Graz, Austria. e-mail: gregor@igi.tugraz.at;
Stefanie Liebe, Department of Physiology of Cognitive Processes, Max-Planck-Institute for Biological Cybernetics, Spemannstrasse 38, D-72070 Tübingen, Germany. e-mail: stefanie.liebe@tuebingen.mpg.de