1
Center for Integrated Molecular Brain Imaging, Copenhagen, Denmark
2
DTU Informatics, Technical University of Denmark, Lyngby, Denmark
3
Neurobiology Research Unit, Copenhagen University Hospital, Rigshospitalet, Copenhagen, Denmark
A few neuroinformatics databases now exist that record results from neuroimaging studies in the form of brain coordinates in stereotaxic space. The Brede Toolbox was originally developed to extract, analyze and visualize data from one of them – the BrainMap database. Since then the Brede Toolbox has expanded and now includes its own database with coordinates along with ontologies for brain regions and functions: The Brede Database. With Brede Toolbox and Database combined, we setup automated workflows for extraction of data, mass meta-analytic data mining and visualizations. Most of the Web presence of the Brede Database is established by a single script executing a workflow involving these steps together with a final generation of Web pages with embedded visualizations and links to interactive three-dimensional models in the Virtual Reality Modeling Language. Apart from the Brede tools I briefly review alternate visualization tools and methods for Internet-based visualization and information visualization as well as portals for visualization tools.
In a narrow sense, neuroimaging workflows involve neuroimaging image processing and analysis. In a more broader sense, the workflow in a neuroimaging study involves a number of other processes: gathering information, designing the experiment, brain scanning, interpretation of the study, relating it to other studies and communicating the study. Data mining in neuroimaging may not only be applied as the standard neuroimaging analysis but also set to work on other components in workflow, and visualization of the data mining results may help the individual researcher in understanding his or her data as well as in communication with other researchers.
A number of tools exists for visualizing neuroimaging data mining results when the result is a volumetric neuroimage. There are, however, also visualization tools for other aspects of the neuroimaging process, and one example is our Brede Toolbox (Nielsen and Hansen, 2000a
). Starting out as a program for handling and visualization of data from the BrainMap database of Fox et al. (1994)
the Brede Toolbox now includes its own database of results from neuroimaging – the Brede Database (Nielsen, 2003
) – as well as analysis and visualization functions for a range of tasks. We have setup an automated workflow involving a few non-interactive batch scripts that construct practically the entire Web presence of the Brede Database with static Web pages and visualizations. Furthermore, automated workflows using the ontologies of the Brede Database can perform mass meta-analysis across brain functions or brain regions (Nielsen, 2005
; Nielsen et al., 2006a
).
The abundance of tools for visualization as well as for other aspects of the neuroimaging process has spawned an interest in generating overviews for these tools, and now there exist several Web-based directories: Neuroscience Database Gateway (NDG) (Gardner and Shepherd, 2004
), Neuroscience Information Framework (NIF) (Gardner et al., 2008
), Neuroimaging Informatics Tools and Resources Clearinghouse (NITRC) (Buccigrossi et al., 2008
), I Do Imaging and Internet Analysis Tools Registry (IATR), see also (Dinov et al., 2008
). Some of these have an API so that HTML or XML for a specific tool can be requested. The NIF resource may be downloaded as an XML file. NITRC, IATR and I Do Imaging have Web 2.0 components with user-provided tool ratings and NITRC has an associated wiki. Since 2001, I have updated the Bibliography on Neuroinformatics which also lists numerous tools. Recently I began the Brede Wiki with structured information about neuroscience including neuroimaging visualization tools. Anyone can ‘micro-publish’ relevant information, and the structured content allows for off-wiki database queries (Nielsen, 2009
).
Many meta-analyses use so-called forest plots and funnel plots, where scatter plots with whiskers display effect sizes and estimators of their variations in two dimensions (Lewis and Clark, 2001
), see Figure 1
. These meta-analyses typically investigate a single variable – continuous or dichotomous – and its relation to another variable, e.g., a personality trait and its association with a genetic polymorphism. In neuroimaging meta-analysis, we have a quite different situation: The neuroimage result contains not just one variable but many variables, i.e., voxels. One would need thousands of standard meta-analysis plots to capture the result across studies. Another much more fundamental problem stems from the fact that neuroimaging researchers typically only report the positive results, e.g., areas with activation to a given task, – not signal changes for brain regions that did not survive the statistical threshold selected. Meta-analysts usually regard the discarding of negative results as a heresy, referring to it as the file drawer problem or with the term publication bias. All the standard statistical meta-analysis technique require that also negative results are reported, – at least to some extent (Hedges and Olkin, 1985
). So we may ask if it is at all possible to make appropriate analyses and visualizations across studies in neuroimaging?
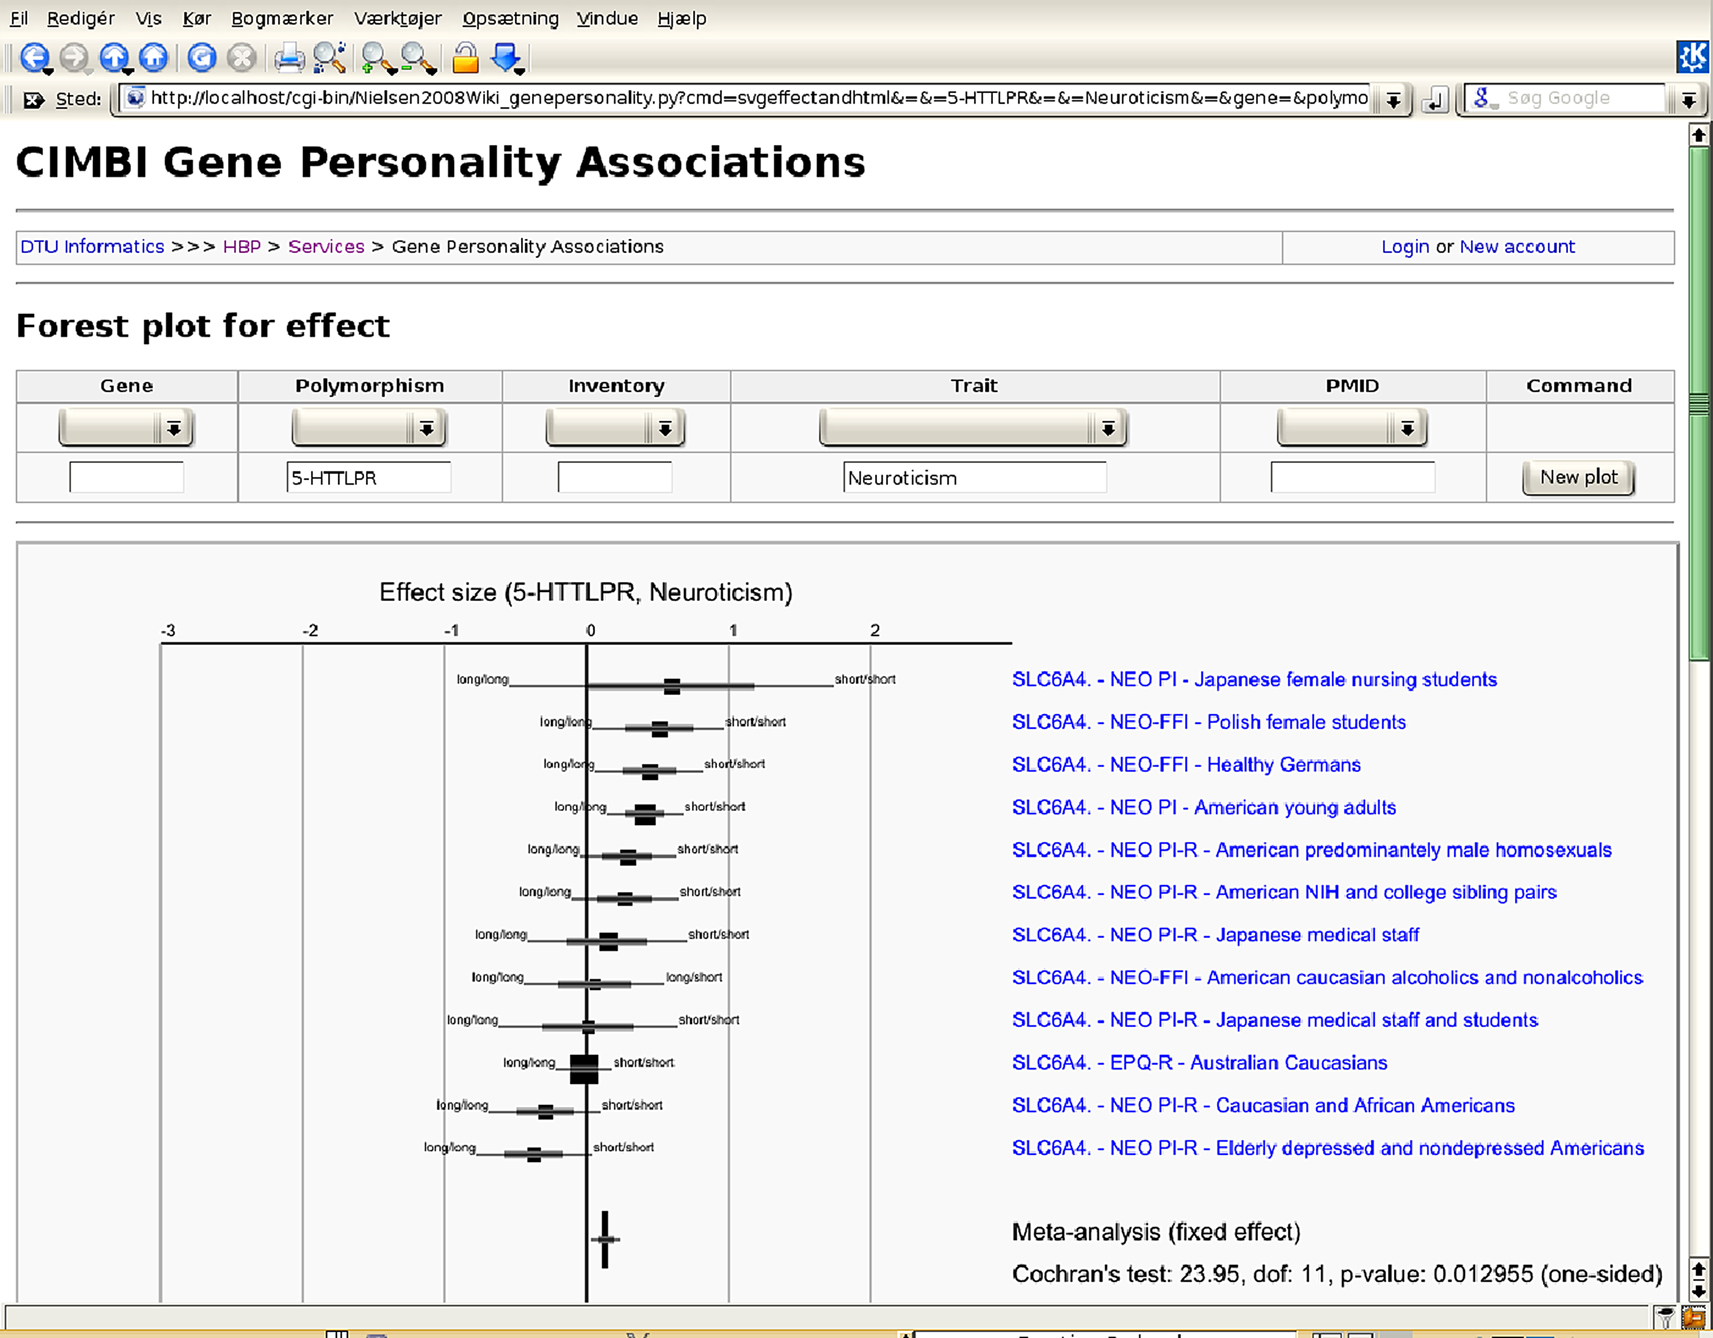
Figure 1. Meta-analytic forest plot as a Web service with studies on personality genetics. Components in the Scalable Vector Graphics image file are hyperlinked and the content may be controlled interactively through a HTML form. Recent work with image-based meta-analysis has shown the possibility of constructing sensible forest and funnel plots for functional neuroimaging data (Salimi-Khorshidi et al., 2009b
).
One simple visualization simply plots the positive results – the reported coordinates – in stereotaxic space. The program associated with the original BrainMap database displayed coordinates in 2D tri-planar plot (Fox et al., 1994
). This type of visualization is maintained in a newer version of the database with the program Sleuth (Laird et al., 2005
). WebCaret may display coordinates in 3D as colored spheres together with an inflated cortical surface (Van Essen and Dierker, 2007
), see Figure 2
. The Brede Toolbox can generate 3D visualizations in the corner cube style of Rehm et al. (1998)
. Plotting points in 3D is not straightforward, – simple ‘zero’ dimensional graphics do not give an important perception of depth, therefore we use 3D glyphs of different color and shape. To help the viewer in spatial localizing the coordinates we can add components in a configurable workflow such as AC/PC axes, stalks for the glyphs, glyph shadows on the tri-planar walls, contour and cerebral cortex outlines from the atlas of Talairach and Tournoux (1988)
. Figure 3
shows two visualizations of this kind with Figure 3
A displaying all coordinates in the Brede Database from papers authored by Edward T. Bullmore and Figure 3
B displaying cingulate coordinates colored according results from a text mining of the associated abstracts (Nielsen et al., 2005
, 2006a
). The batch script setup for the Brede Database will automatically generate a plot like Figure 3
A for each author mentioned in the author ontology. Sometimes these simple plots reveal interesting features: The Bullmore coordinates appear somewhat limited to the middle of the inferior-superior axis perhaps reflecting a restricted field of view selected for some of the studies. The elaborate and automated workflow for generating a plot like Figure 3
B involves:
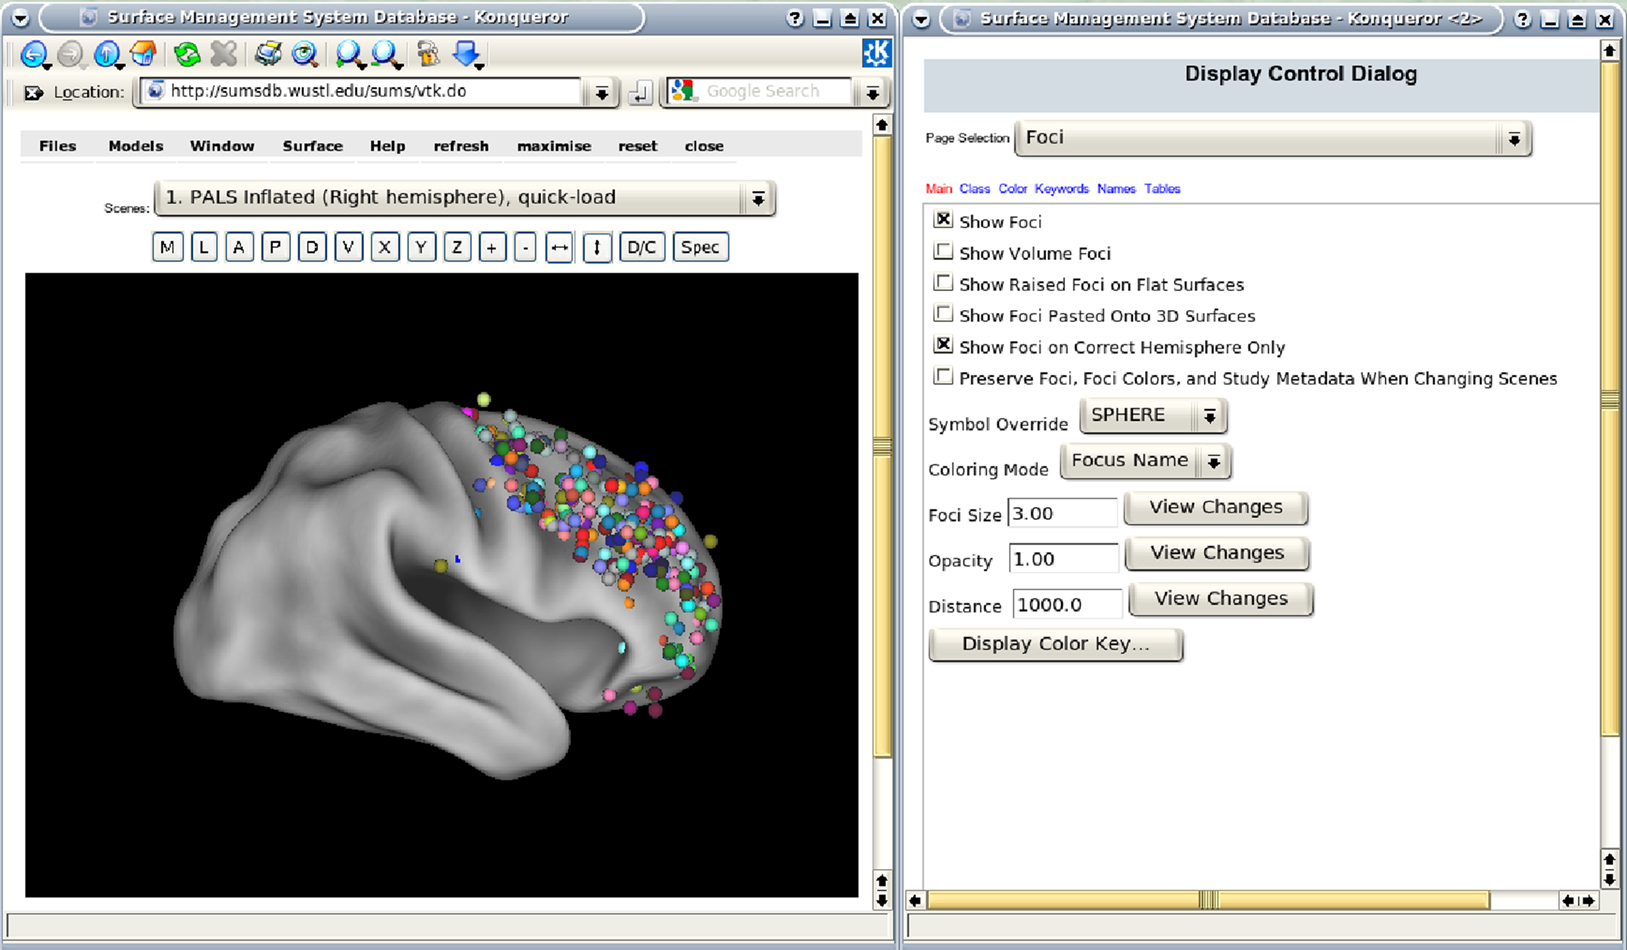
Figure 2. WebCaret server-side display of returned coordinates from the Surface Management System Database (SumsDB) with a query on ‘middle frontal gyrus’. The right window offers some control over the rendering and the buttons in the left window may rotate the cortical surface. SumsDB allows the query on a neuroanatomical label to be invoked from another program or Web site by simple Web linking, and the Brede Wiki automatically constructs such links.
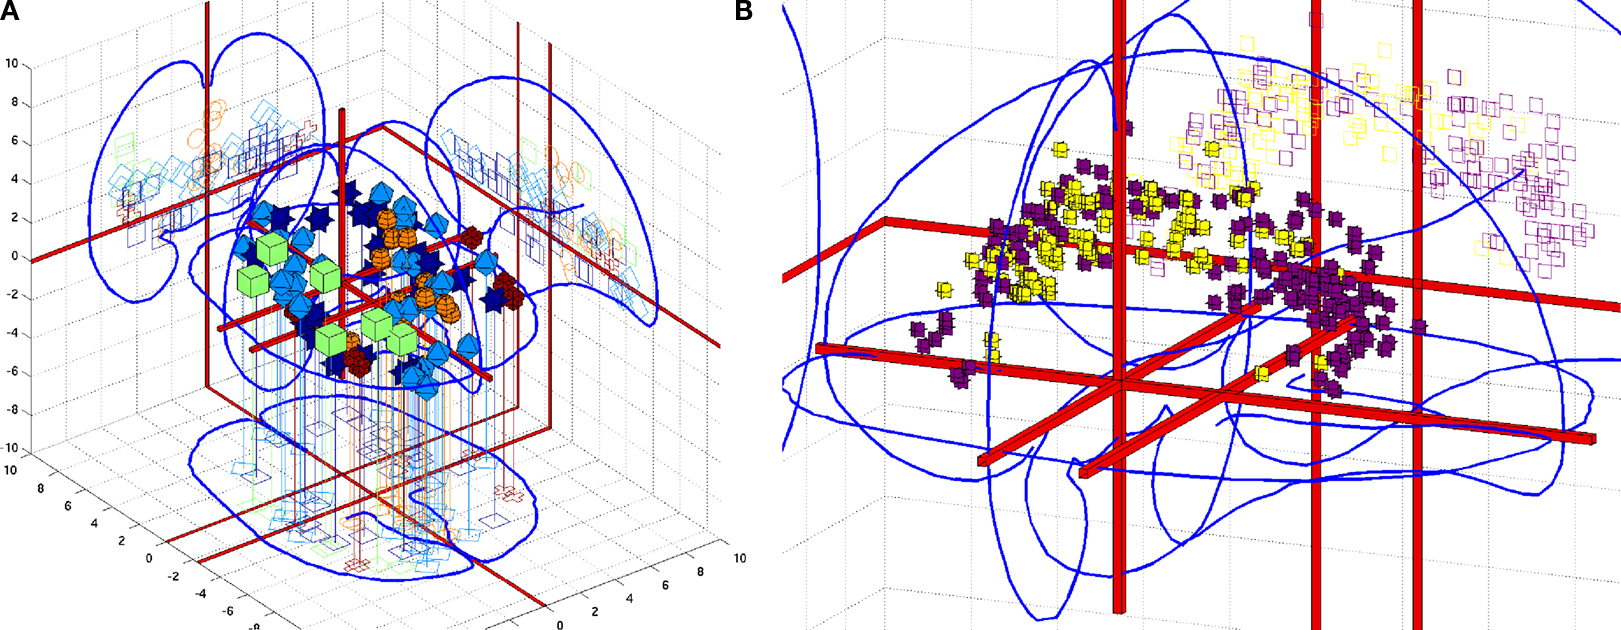
Figure 3. Two examples of coordinates in a 3D corner cube visualization. (A) Coordinates from the five studies in the Brede Database authored by Edward T. Bullmore. The 3D glyphs have type and color according to paper: Dark blue (Phillips et al., 1997
), light blue (Phillips et al., 1998
), light green boxes (Bullmore et al., 1996
), orange spheres (Hunkin et al., 2002
), red (Calvert et al., 1999
). (B) Cingulate coordinates colored according to the clustering results after a text mining of abstracts in the Brede Database. Dark magenta glyphs are from the ‘memory’ cluster while the light yellow are from the ‘pain’ cluster. From Nielsen et al. (2006a)
.
1. Select a brain region and from the Brede Database brain region ontology get all naming variation of the brain region and its subareas. With these names extract coordinates from papers recorded in the database, model their spatial distribution and include extra non-matched coordinates that lies within the region.
2. Get abstracts from the Brede Database that – for the brain region in question – have one or more coordinates and perform text mining, which results in clusters of themes, such as ‘pain’ and ‘memory’ and documents belonging to these clusters.
3. Perform statistical tests on the spatial distribution of the coordinates grouped according to the text mining clusters to determine if the text mining has discovered functions that are segregated in the region.
The procedure is done for all brain regions in the Brede Database brain region ontology and Figure 3
B shows one of the regions that listed high after sorting brain regions according to statistical significance in the spatial distribution test.
Data mining directly with the coordinates has been termed coordinate-based meta-analysis (CBMA) and several methods exists (Wager et al., 2009
), see also Laird et al. (2009)
, this issue. For the most part they involve a form of estimation of a conditional probability density p(v|c) in stereotaxic space v. The conditioning, c, may be, e.g., for a specific brain function or a specific anatomical label. Once the probability density is estimated it can be converted to a volume by sampling the probability density in voxels and visualized in the same way as standard neuroimages, or the density can be used to color-code the cortical surfaces in a 3D visualization, see Wager et al. (2009)
.
Fox et al. (1997)
introduced the method to model the probability density: a single confined area – the primary motor area for the mouth – were examined so only a model with mean and standard deviation was devised, i.e., a simple Gaussian model. As more complex brain functions are distributed in brain space, more flexible models are needed. Our first effort in modeling the probability density was by Gaussian mixture models (Nielsen and Hansen, 1999
):

where each p(v|k) estimates a 3D Gaussian probability density. Figure 4
A shows the isosurfaces in a model of this type where the parameters have been fitted to data from the BrainMap database. Here, each ellipsoids corresponds to a single Gaussian p(v|k) and c corresponds to three different labels of ‘behavioral domain’ from the BrainMap database that are associated with each coordinate. Although the Gaussian mixture model may generalize, the ellipsoids do not look neuroanatomical plausible and call for yet more flexible models. Figure 4
B is generated with kernel density estimation using a Gaussian kernel (Nielsen and Hansen, 2000b
). Such models seems to generate probabilities that are somewhat more neuroanatomical plausible than the Gaussian mixture model.
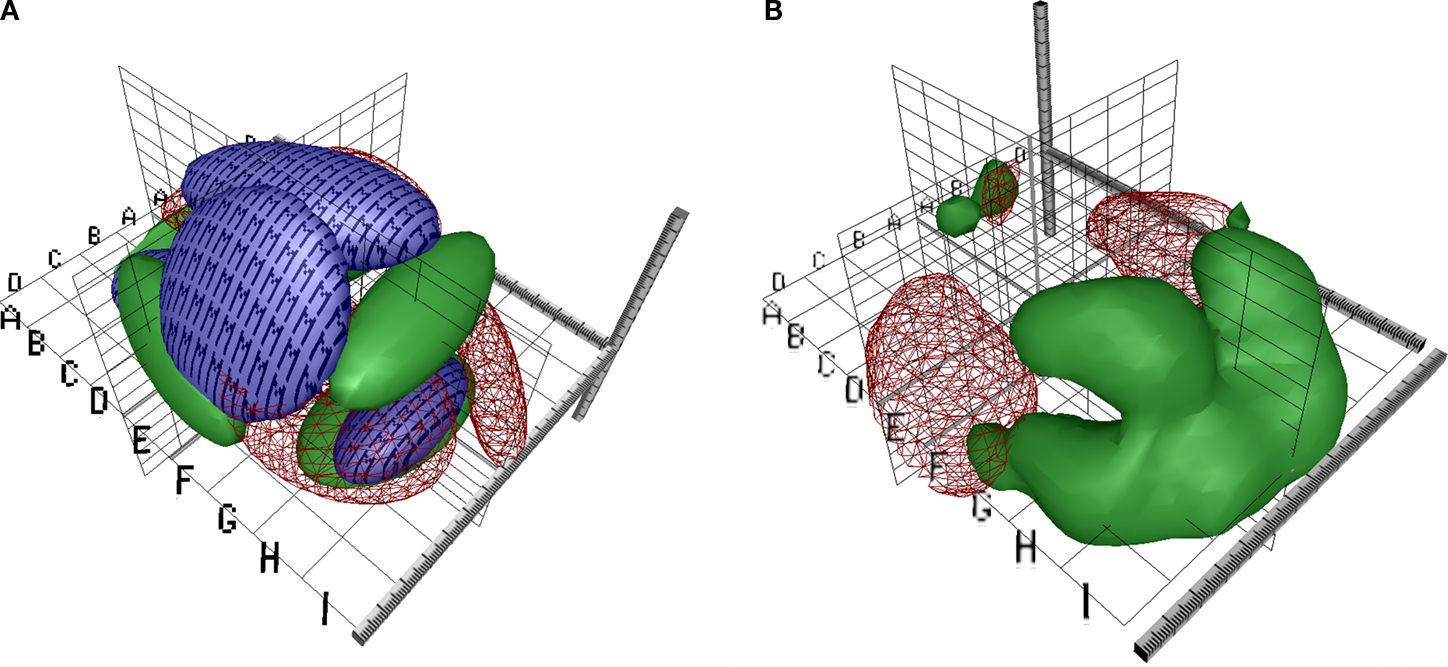
Figure 4. VRML visualizations with coordinate-based meta-analysis of data from BrainMap with isosurfaces in conditional probability densities. (A) Gaussian mixture model of the three main behavioral domains in BrainMap: Perception (red wireframe), cognition (green surface) and motion (‘M’-textured surface). From Nielsen and Hansen (1999)
. (B) Kernel density modeling of auditory (red wireframe) and vision (green) studies. From Nielsen and Hansen (2000b)
.
The isosurfaces in the probability densities in both subplots of Figure 4
has been set for display purpose. More statistically grounded values can be obtained with the methods by Turkeltaub et al. (2002)
; Nielsen (2005)
; Costafreda et al. (2009)
. The methods for probability density estimation of coordinates are not limited to activations but may be applied to any kind of coordinates in stereotaxic space from ‘deactivations’, cortical stimulations, lesions or structural changes, e.g., obtained with voxel-based morphometry.
When a probability density estimate is constructed for a set of coordinates and it is converted to a voxel-volume, then the volumes across multiple sets of coordinates may be aggregated into a single data matrix X(sets × voxels). This data matrix may then be decomposed with multivariate analysis in a number of ways, e.g., with singular value decomposition for principal component analysis, ULV = X, where the left factorization matrix U(sets × components) contains loading over sets of coordinates for each principal component and the right factorization matrix V(vowel × components) contains loadings over voxels. Other types of decomposition for this matrix are independent component analysis (MS = X, with M the mixing matrix and S the source matrix), non-negative matrix factorization (WH = X) and K-means clustering (CA = X, with C a centroid matrix and A an assignment matrix). The right decomposition matrices, V, S, H and A all contain vectors that each represents a volume. As part of the workflow for presenting the information in the Brede Database on the Web the decompositions work on data matrices formed from sets of papers and sets of experiments, and corner cube visualizations are automatically constructed with isosurfaces in the volumes contained in the right decomposition matrices. Figure 5
shows such a visualization for a component from non-negative matrix factorization, i.e., a row in the H matrix. Such visualizations may be useful for navigating among the studies in the database, and to a certain extent they reveal spatial distributions of the ‘cognitive components’ of the brain. Together with the visualization on the Web page are listed the experiments that have high association with the component, i.e., experiments associated with large elements in a column of the left matrix W. For the component in Figure 5
they are experiments described as, e.g., ‘Visual object decision’, ‘Buildings visual objects’, ‘Color perception during free viewing’ and ‘Passively viewed scenes’.
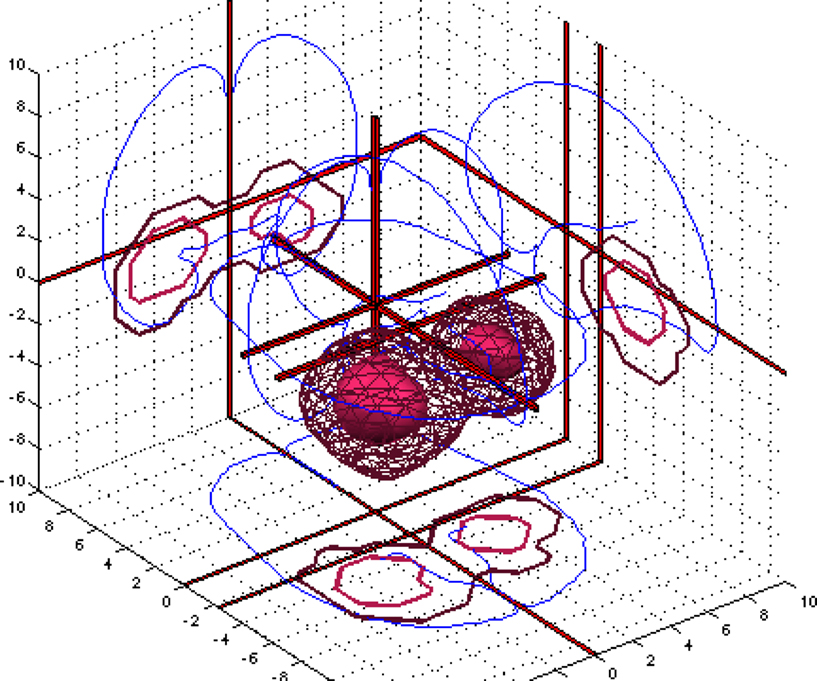
Figure 5. Corner cube visualization on the Web page of the Brede Database with results from a non-negative matrix factorization of experiments in the database.
Before putting too much trust in visualizations and analysis across studies one needs to remember that the study results may have arisen in quite different ways. In standard meta-analysis the only variations between studies that are usually modeled is the number of subjects and the standard deviation of the data in the individual studies. In neuroimaging meta-analysis and visualization these variables are not usually modeled, for exceptions see Fox et al. (1997)
. Besides there are several other variables that neither are considered: The varying thresholds applied, e.g., corrected and uncorrected P-values (Nielsen et al., 2006b
), the difference in field of view between studies, the reporting style of coordinates (e.g., ‘extent threshold’, ‘number of maxima per cluster’) as well as the variation from the different pre-processing and analysis choices that have been made. Furthermore, the different CBMA models may produce different results on the same material. Salimi-Khorshidi et al. (2009a)
compared different CBMA models and their application of a threshold makes a ‘blob’ appear and disappear depending on the type of CBMA.
Quite a few tools exist for interactive neuroimaging visualization across the Internet. Often these tools are based on a client–server model with the client implementing the visualization and graphical user interface in Java. Among these tools are JIV that renders multiple volume data by orthogonal slice views implemented as a Java applet (Cocosco and Evans, 2001
). iiV implements a similar functionality (Lee et al., 2008
), and MindSeer can also render in 3D remotely (Moore et al., 2007
). NeuroTerrain implements 3D visualization and has demonstrated its use in connection with a Mouse atlas (Gustafson et al., 2007
). The Talairach Applet renders a digital representation of the Talairach Atlas and combines it with neuroanatomical labeling of coordinates via the Talairach Daemon described by Lancaster et al. (2000)
. Also in connection with the BrainMap database the Java client-program Sleuth plots 3D points in orthogonal 2D slices based on user query to the BrainMap server (Laird et al., 2005
).
The Internet Brain Volume Database (IBVD) records published values for brain region volumes across variables such as gender and diagnosis (Kennedy et al., 2003
). Since the neuroimaging data analysis arrives at one single value – the brain volume in cubic centimeters – the visualization of the data is relatively simple compared to other neuroinformatics visualizations: From Web-based user queries IBVD generates on-the-fly PNG image-files with the brain volumes from the different studies plotted as a function of age with color-coding and the variability indicated. Interactive visualization systems for neuroimages with server-side 3D rendering have been described by Poliakov et al. (2005) and a public system is available with the WebCaret Web service, see Figure 2
.
With the Brede Toolbox we construct 3D visualizations browsable on the Web by using the Virtual Reality Modeling Language (VRML) (ISO/IEC, 1997
; Nielsen and Hansen, 2000a
), see the VRML examples in Figure 4
. When defined in the middle of 1990s VRML held great promise to get wide-spread use for 3D interactive and hyperlinked visualizations, but since then it has had limited growth: VRML lacks good browser implementations and there has been erratic adoption of a scripting language. Nevertheless, it is one of the few means for Web distribution of 3D content in free standardized form. An alternative format is the Universal 3D File Format (U3D) that can be embedded in newer versions of the PDF format. Apart from the Brede Toolbox ImageSurfer described by Feng et al. (2007)
implements VRML export.
For the Web presentation of the Brede Database, we generate 3D corner cube visualizations of the coordinates in the database with an offline Matlab batch script, – both as image files embedded on the Web page as well as VRML files, see Figure 6
. Matlab is not well suited to work as a Web script, and for the interactive Web scripts associated with the Brede Database, there are presently no visualization implemented. The INC Interactive Talairach Atlas renders 2D orthogonal slices from the Talairach and the MNI single subject atlases. This Web service can merge a user-given coordinate with the visualization, and as such we use it for visualization of individual coordinates from the Brede Database and the Brede Wiki, see Figure 7
for an example.
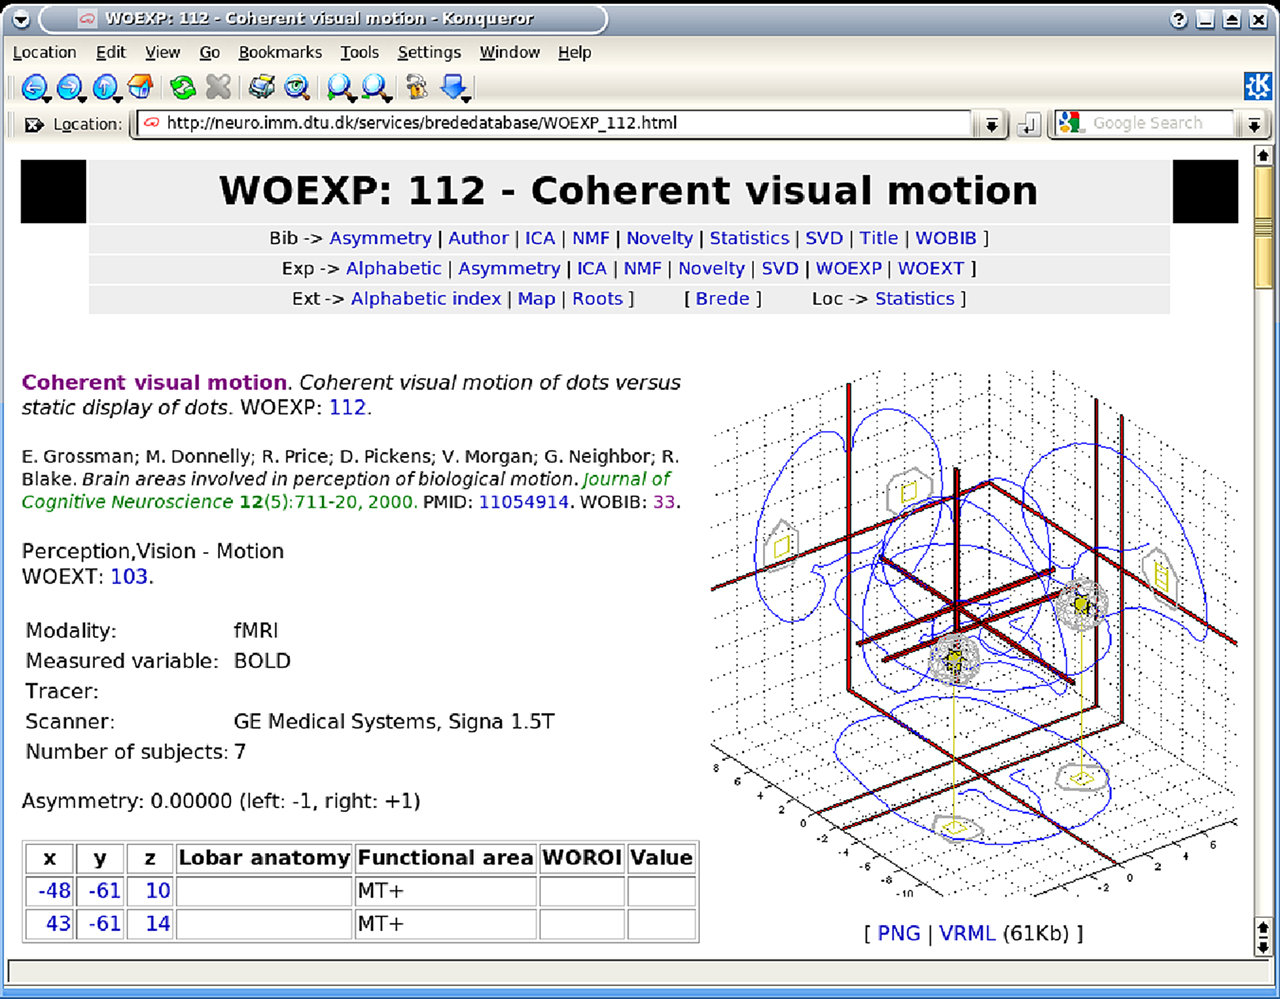
Figure 6. Screenshot of the Web page for an experiment in Brede Database with a corner cube visualization of the coordinates in a experiment together with a wireframe indicating an isosurface of the kernel density estimate with the coordinates. An interactive rendering is provided with the link to a generated corner cube visualization in a VRML file.
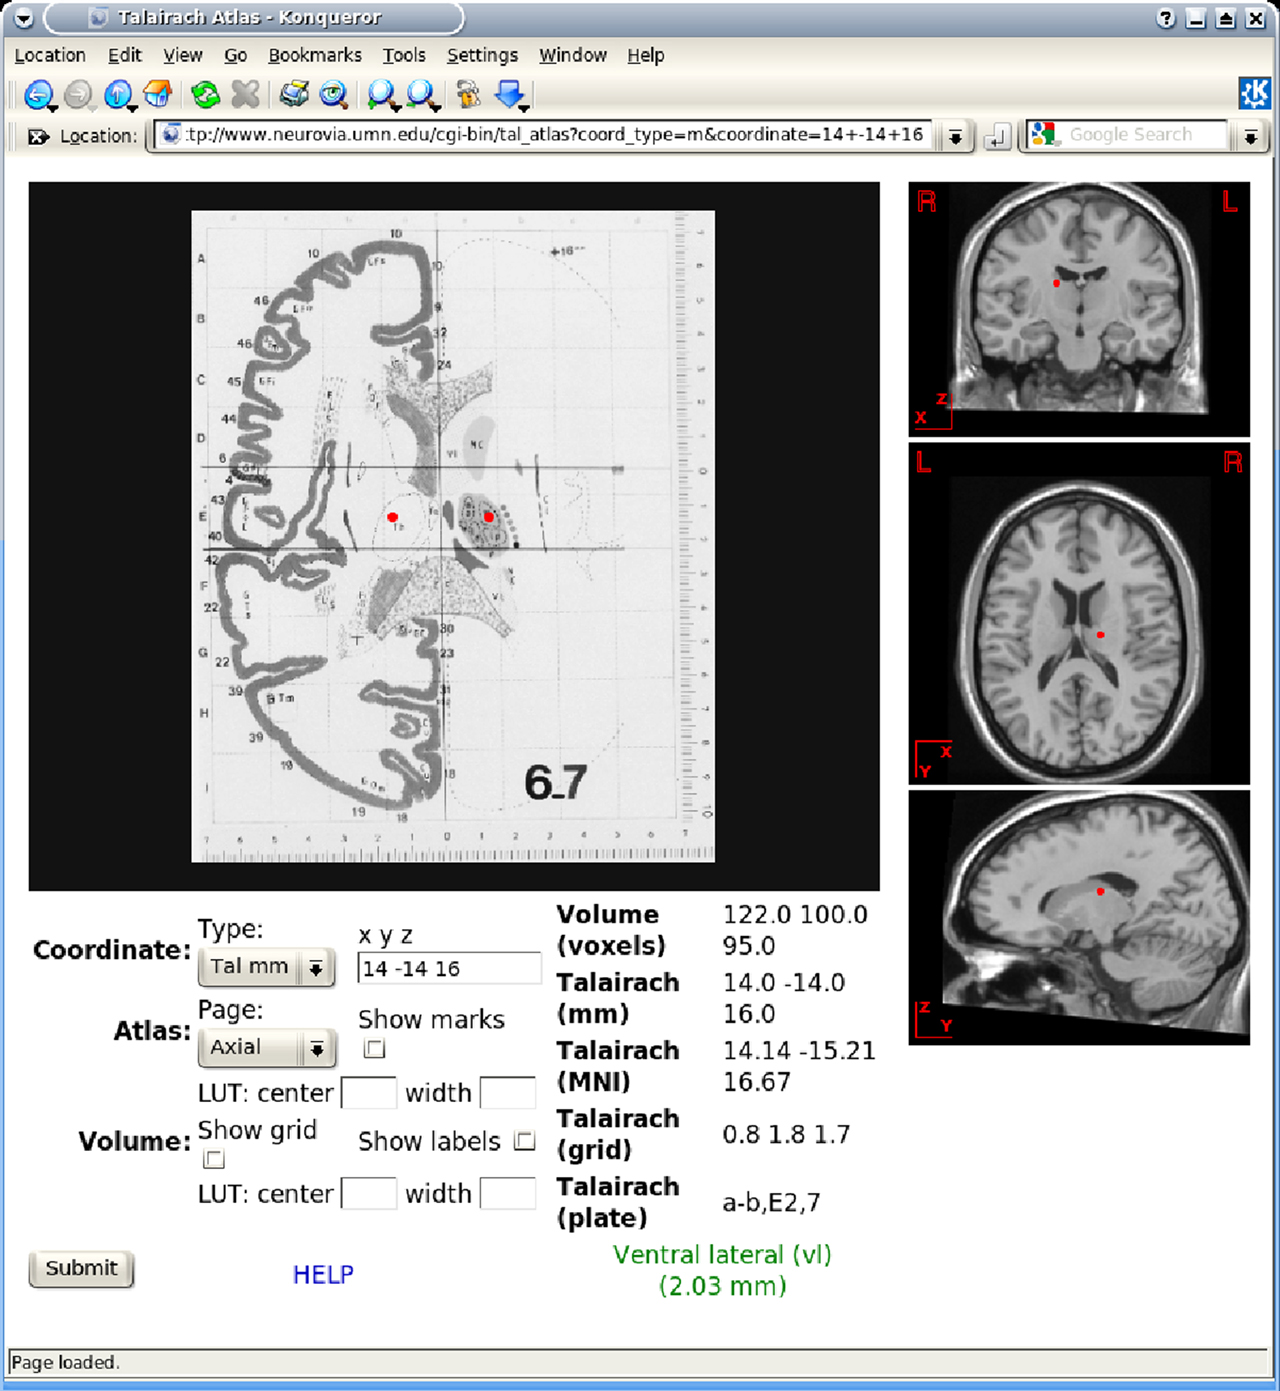
Figure 7. The Web-based INC Interactive Talairach Atlas queried with a coordinate from the Brede Wiki.
Besides Java, VRML and standard image files such as PNG the Scalable Vector Graphics (SVG) format may prove useful for Internet-based visualizations, see Figure 1
for an example. These files may contain hyperlinks and JavaScript. However, Web browsers do not yet consistently implement the standard.
Data mining results from neuroimaging analysis are not the only type of information for visualization. Information about the background, design, scanning, analysis procedure, and interpretation surrounds the data mining results of a typical neuroimaging study. In scientific articles, the body text mostly carries this ‘context’ information, though sometimes authors also use tables to describe, e.g., subject information. Authors rarely apply visualizations for this kind of information except in situations with explanation of the experimental design and scanning. The experimental design has a natural temporal evolution and as such the visualization often displays the design as a function of time. Users of the behavioral experiment software from Psychology Software Tools is familiar with the graphical programming environment of E-Prime which has this kind of visualization as an integral part of the development of the experiment. Other parts of the neuroimaging study may be visualized with what is usually referred to as information visualization.
In a demonstration visualization, we employed a torus topology for an entire neuroimaging study process constructing 3D icons for ‘funding’, the experimental design, authors, experimental subjects, etc. (Nielsen and Hansen, 1997
), see also Figure 8
. The usefulness of such a visualization depends on how effective it conveys information compared to standard text, and if the visualization format requires specialized and limited distributed programs for rendering and interaction the impact may be small. Manual creation of these visualizations is infeasible, – the visualization should be constructed automatically from description of the study, e.g., the so-called ‘provenance’ (Fissell, 2007
). In related visualizations, some workflow management systems display the processing flow graphically (Dinov et al., 2008
).
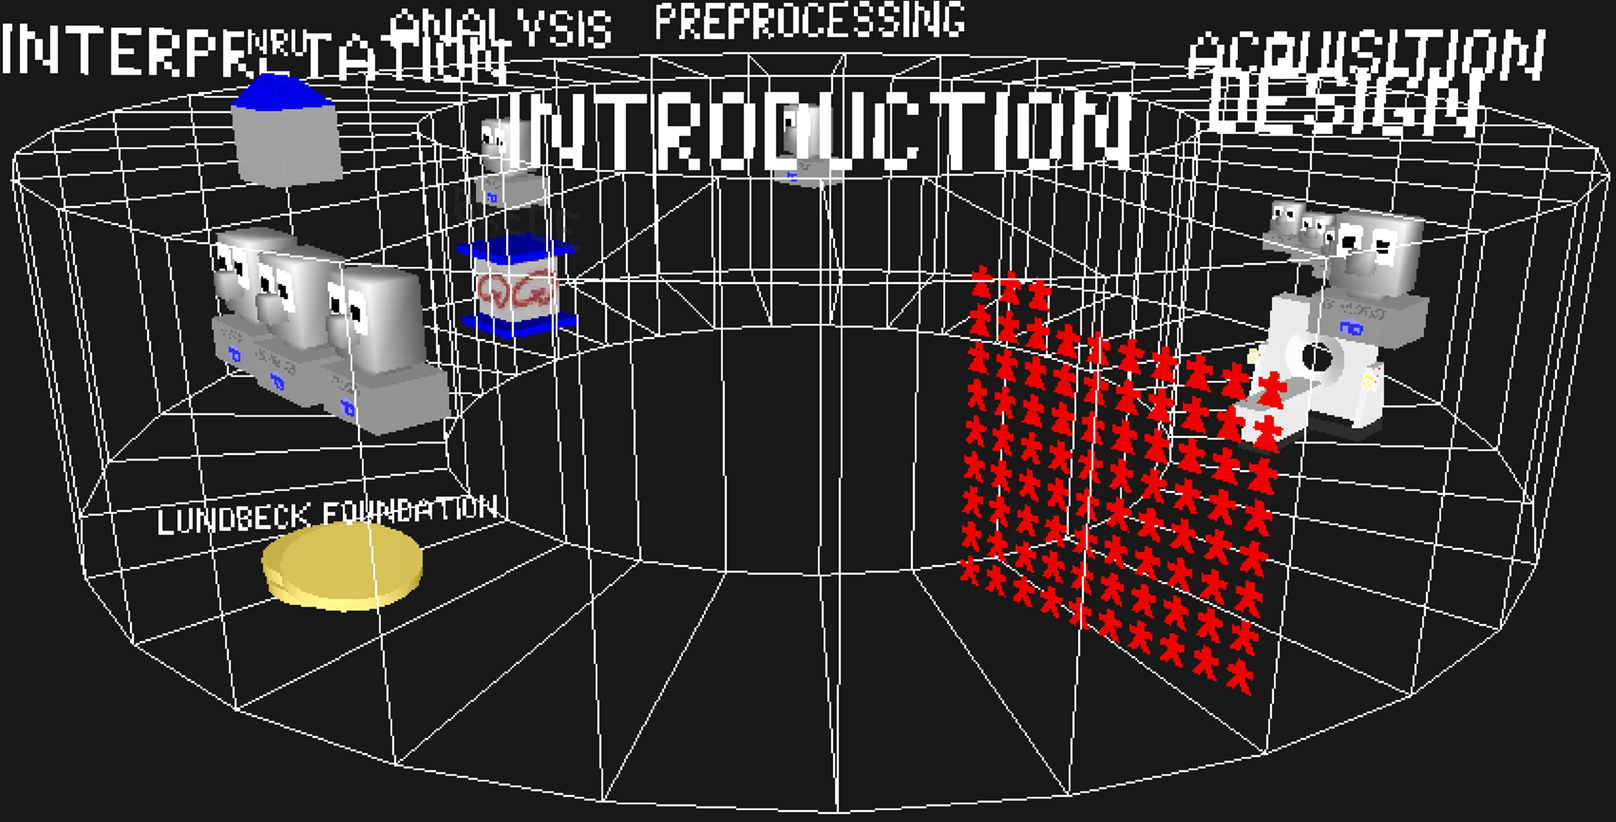
Figure 8. Screenshot of a VRML rendering seeking to convey parts of the information surrounding a neuroimaging study: 3D icons for funding, research organization, researchers, software, subjects, and scanner placed in a torus.
When neuroimaging studies get reported in articles the relationships between the articles can be turned in to visualizations. Many types of visualizations exist and many relationships may be revealed: Between terms, concepts, citations to and from articles as well as between authors, cited authors and cited journals. The visualizations are of course not limited to articles only in neuroimaging, see, e.g., Card et al. (1999)
; Chen (1999)
. For an example in neuroscience Naud et al. (2007)
use a spherical embedding algorithm to display a bipartite graph in 3D space with two spheres. One of their illustrations visualized the relationship between poster sessions in the Society for Neuroscience 2006 meeting together with words from the abstracts in the sessions. Another example of text mining result visualization is what we termed a ‘cluster bush’, that describe the clusters in a hierarchical multivariate analysis (Nielsen et al., 2005
): Clusters are indicated with dots and thick lines indicate a large similarity between two clusters. Given a set of abstracts the automated workflow for generating a plot like Figure 9
involves the conversion of the texts to a bag-of-words matrix, the exclusion of a large number of words (stop words), hierarchical non-negative matrix factorization and lastly the ‘cluster bush’ visualization all implemented with the functions of the Brede Toolbox.
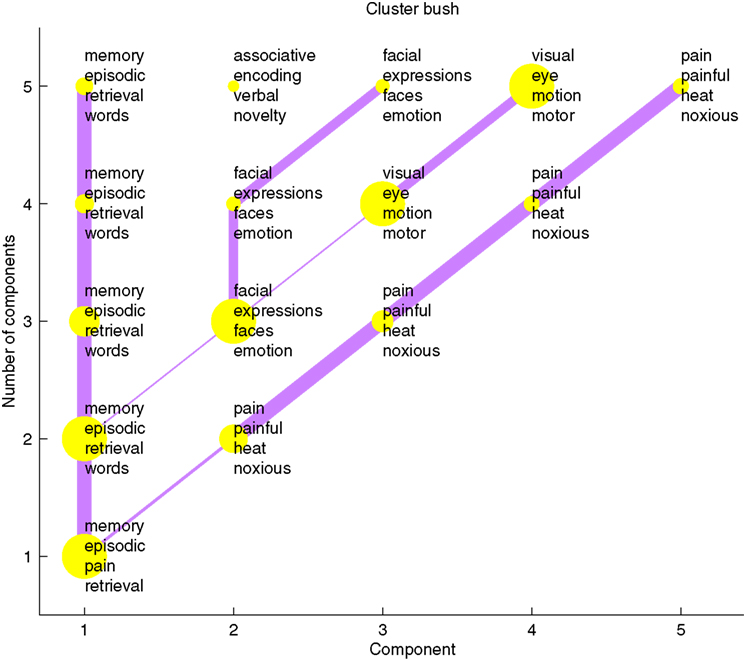
Figure 9. A so-called ‘cluster bush’ visualization of the text mining results of the abstracts in the Brede Database. Each yellow dot is a cluster of articles and words in the article. The four words with highest load on each cluster are listed.
Coordinate-based meta-analysis and text mining can be combined to form visualizations, see Figure 10 and Nielsen et al. (2004)
. The workflow for constructing the visualization in the figure involves the setup of a matrix describing the words in the abstract of papers and the construction of another matrix from kernel density estimation with the coordinates in each paper. After non-negative matrix factorization each individual factor may be rendered in 3D and associated with words from the abstract, e.g., the blue area in Figure 10
A in the occipital lobe is associated with words such as ‘visual’ and ‘eye’.
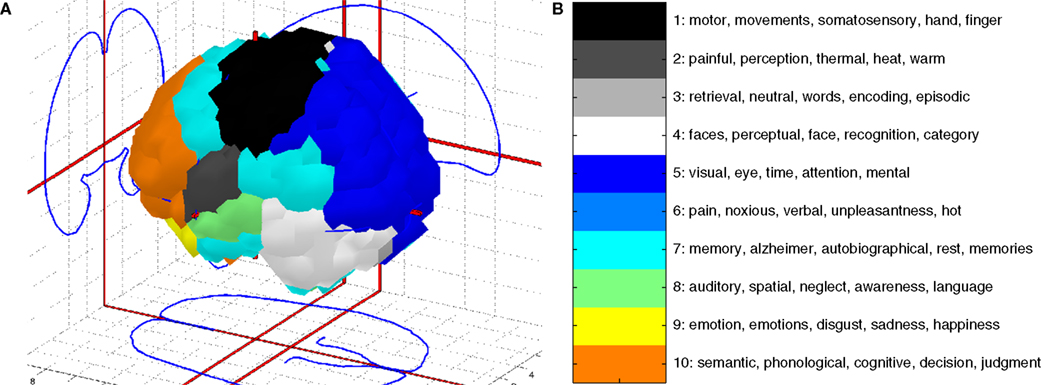
Figure 10. A ‘functional’ atlas generated from a combined data mining of text and brain coordinates from the Brede Database. (A) Corner cube visualization with labeled brain areas. (B) Automatically generated legend with words from the text mining of abstracts.
Based on a corpus of articles published between 1997 and 2000 in the journal NeuroImage we could plot cited authors and cited journals in 2D. The data mining with visualization would for example reveal a dichotomy between PET and fMRI (Nielsen, 2002
), see Figure 11
. Here, the workflow involves specialized algorithms that extract citations and the use of matrix computations, particularly singular value decomposition, for multidimensional scaling-like projection of the data onto 2D. For the Brede Database, we automatically construct what we have termed ‘bullseye plots’ to display the network of coauthors for each recorded author. Figure 12
shows a larger bullseye plot on coauthors in the NeuroImage corpus. Authors near the center, such as Friston and Dolan, have high network degrees, which here corresponds to the number of authored articles (Nielsen, 2002
).
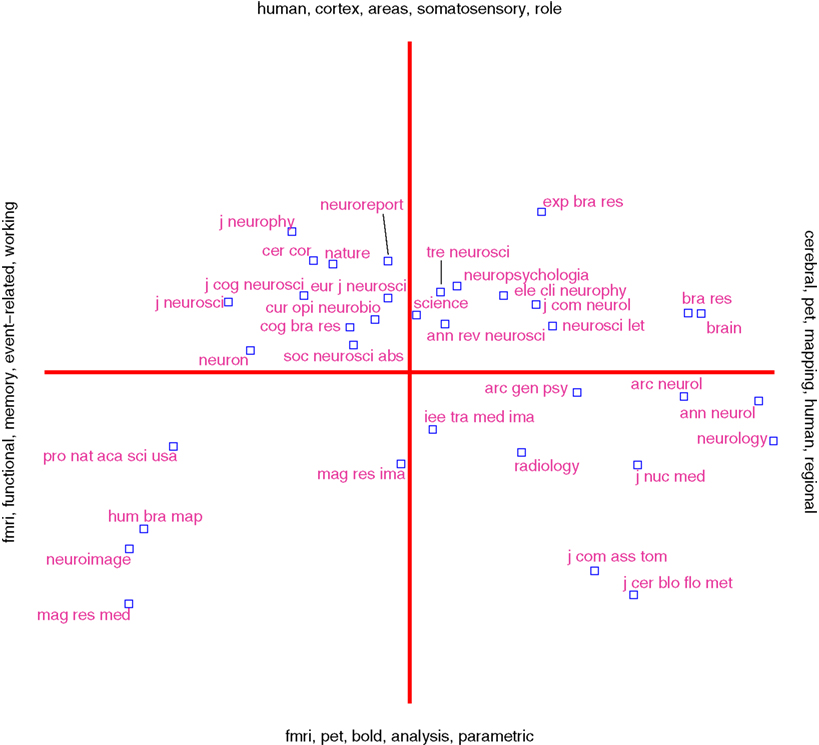
Figure 11. Visualization of data mining result of journal co-citation analysis with singular value decomposition on citation data from NeuroImage.
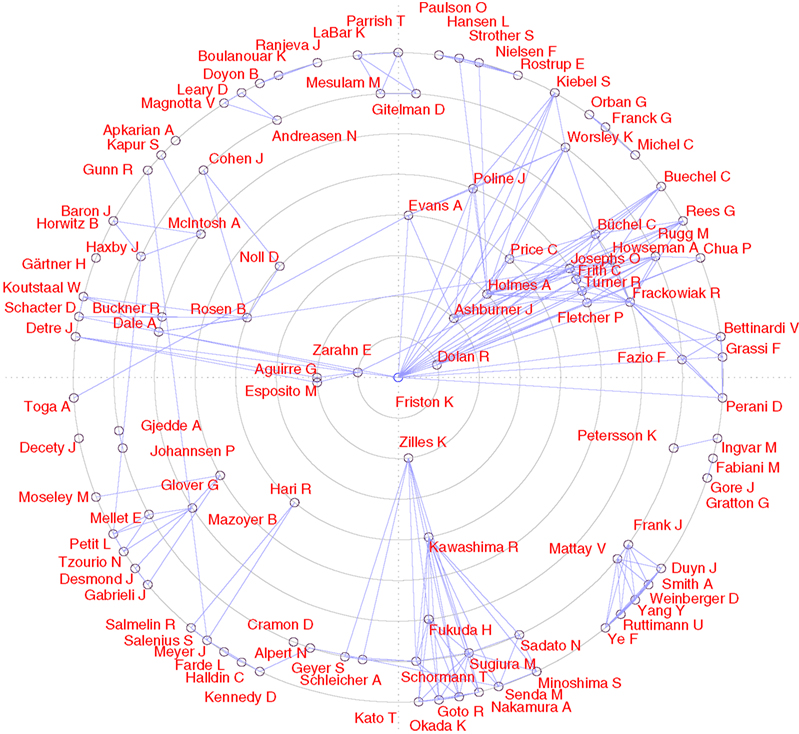
Figure 12. Coauthor bullseye plot (target diagram) with data from NeuroImage 1997–2000. A line between two authors indicates that they co-wrote a paper. The concentric circles indicate the number of articles written by the author in the corpus. The Brede Toolbox automatically constructs similar, albeit smaller, bullseye visualizations for each author represented in the Brede Database author ontology. These are available on the Web.
The well-tested and widely used GraphViz package provides spatial graph layout for a given network (Gansner and North, 2000
). At one point the PubGene Web service used GraphViz in a large-scale application for displaying relations between genes based on literature in PubMed (Jenssen et al., 2001
). GraphViz layouts graphs for the Web presentation of the Brede Database. These graphs display the brain function and brain region ontologies, e.g., indicating that ‘vision’ has ‘perception’ as taxonomic parent or that the cingulate area is a parent for the posterior cingulate, see Figure 13
. Our workflow with the Brede Toolbox involves extraction of the ontology from Brede Database XML files, construction of a file with the graph that GraphViz reads, invoking GraphViz for generation of an image file, and then finally construction of the Web page with the image file embedded. GraphViz can construct HTML image maps so the nodes in the graph image are associated with clickable hyperlinks. On the final Web page a reader may navigate the brain region and brain function ontologies by clicking on the nodes in the graph. The Brede Toolbox can also use GraphViz for layout of other types of data that can be described as a network, e.g., from structural equation modeling of regional neuroimaging data. A number of journal Web sites use plots called Citation map in the style of GraphViz for visualizing in- and out-going citations of each article, see, e.g., BMJ and The Journal of Neuroscience Web sites.
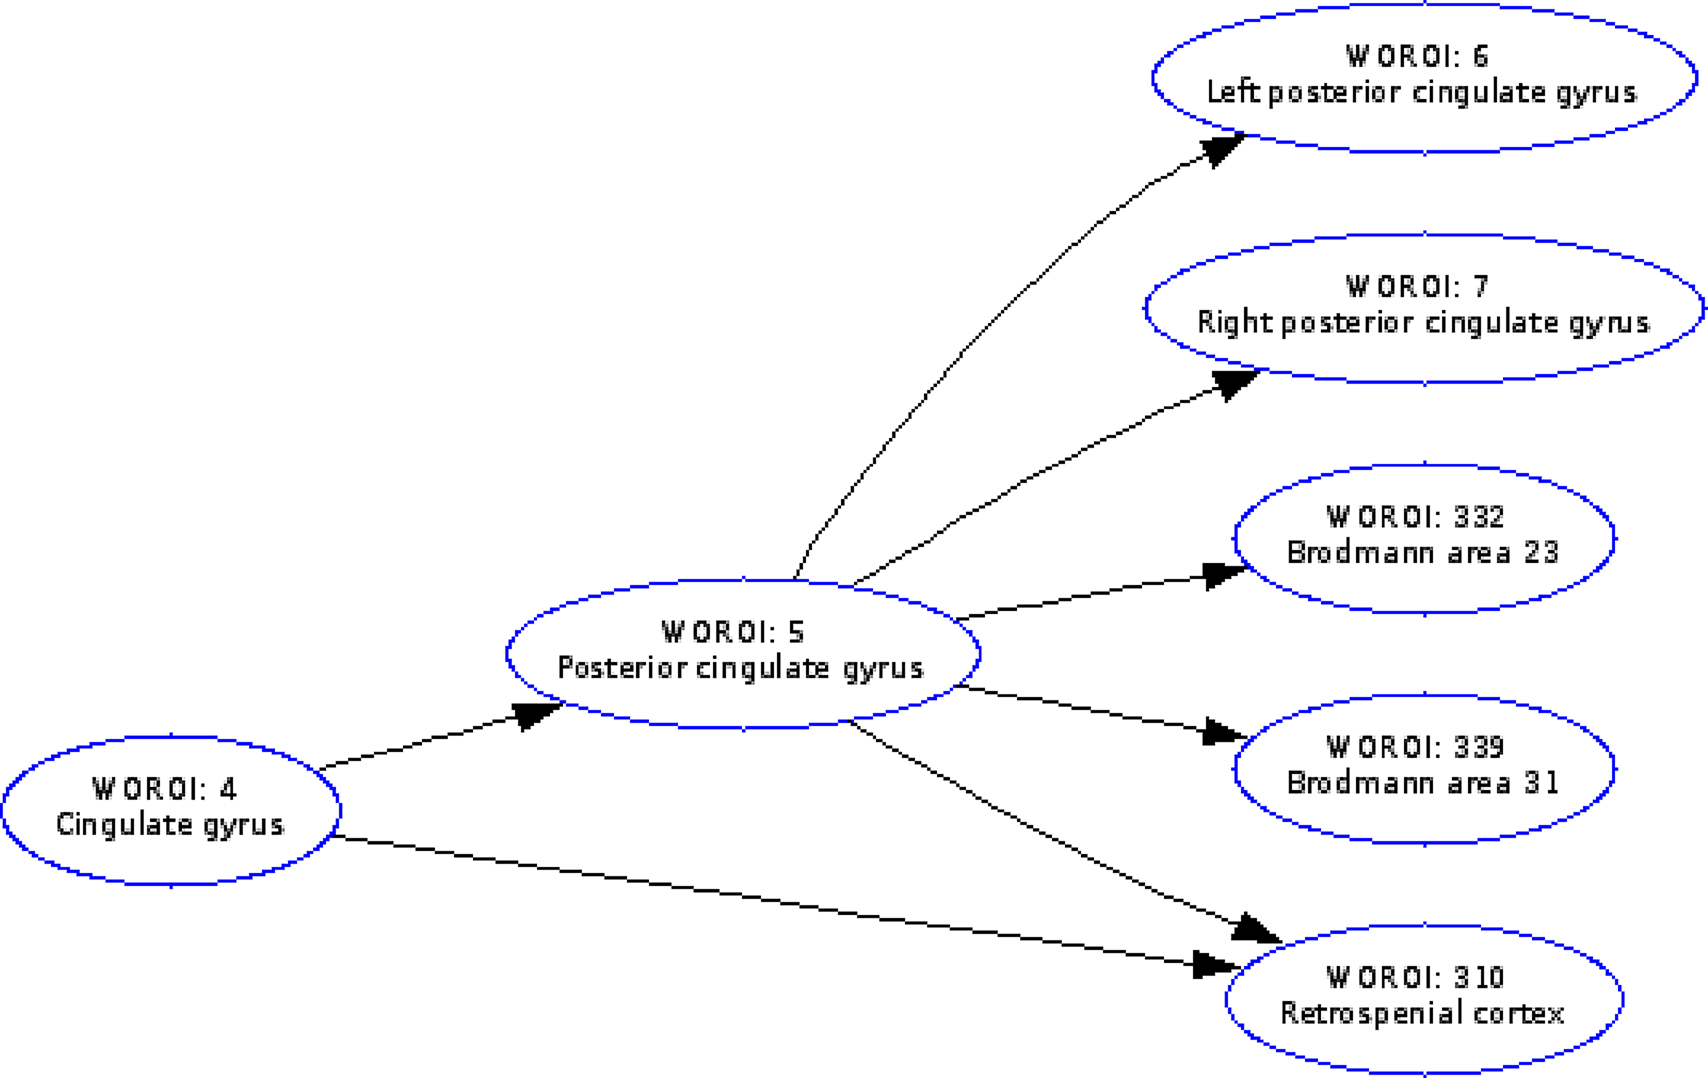
Figure 13. For presenting the Brede Database brain region ontology on the Web the workflow with the Brede Toolbox invokes the GraphViz program which generates hyperlinked plots of the brain region hierarchy, here for the ‘posterior cingulate gyrus’.
Another type of graph visualization within neuroimaging is the interactive graph visualization with a hyperbolic browser that features in tools from the Laboratory of Neuro Imaging (LONI): LOVE and iTools (Dinov et al., 2006
, 2008
). ISI Web of Knowledge provides a Java applet to render their citation information with a similar topology.
With the Brede Toolbox we are able to build a workflow with extraction of data from the Brede Database, automated data mining and visualizations. The automated procedures generate publicly accessible Web pages with interactive visualizations. An advantage of the automated procedure is that little human intervention is required to update the visualizations as new data is added to the database. The visualizations can display not only spatial neuroimages, but for example also results from text mining, and visualization can take place across the Internet with data originating on one server and displayed on another.
The Brede Database represents just a small fragment of the results from the published literature (Derrfuss and Mar, 2009
). Databases such as NeuroNames, BrainMap and SumsDB are much larger. However, no universal database exist for coordinates from functional neuroimaging. To gain a higher degree of coverage future work may attempt to aggregate data from different databases for combined visualizations. Since typical meta-analytic data is anonymous and small (compared to a typical neuroimaging study), it is easier to share such data and we may see collaborative Internet-based analyses and visualizations. Our wiki for personality genetics (Figure 1
) is such a collaborative system. Building a collaborative system for neuroimaging data requires more effort, and in the Brede Wiki only simple visualizations are presently available. A target for future development should be towards ‘Science 2.0’ where data, analyses and visualizations can be shared in Web-based collaborative and user-friendly environments.
The authors declare that the research was conducted in the absence of any commercial or financial relationships that could be construed as a potential conflict of interest.
Many thanks to Kristoffer Hougaard Madsen, Daniela Balslev and Lars Kai Hansen for comments on an earlier version of the manuscript. This work was supported by the Lundbeck Foundation through the Center for Integrated Molecular Brain Imaging.
Buccigrossi, R., Ellisman, M., Grethe, J., Haselgrove, C., Kennedy, D., Martone, M., Preuss, N., Sullivan, M., and Wagner, K. (2008). The neuroimaging informatics tools and resources clearinghouse (NITRC). In 14th Annual Meeting of the Organization for Human Brain Mapping, (Organization for Human Brain Mapping), pp. 319 T–AM.
Cocosco, C. A., and Evans, A. C. (2001). Java internet viewer: a WWW tool for remote 3D medical image data visualization and comparison. In Proceedings of the 4th International Conference on Medical Image Computing and Computer-Assisted Intervention, Volume 2208 of Lecture Notes in Computer Science (London, Springer), pp. 1415–1416.
Dinov, I. D., Rubin, D., Lorensen, W., Dugan, J., Ma, J., Murphy, S., Kirschner, B., Bug, W., Sherman, M., Floratos, A., Kennedy, D., Jagadish, H. V., Schmidt, J., Athey, B., Califano, A., Musen, M., Altman, R., Kikinis, R., Kohane, I., Delp, S., Parker, D. S., and Toga, A. W. (2008). iTools: a framework for classification, categorization and integration of computational biology resources. PLoS ONE 3, e2265.
Gardner, D., Akil, H., Ascoli, G., Bowden, D. M., Bug, W., Donohoe, D. E., Goldberg, D. H., Grafstein, B., Grethe, J. S., Gupta, A., Halavi, M., Kennedy, D. N., Marenco, L., Martone, M. E., Miller, P. L., Müller, H.-M., Robert, A., Shepherd, G. M., Sternberg, P. W., Van Essen, D. C., and Williams, R. W. (2008). The Neuroscience Information Framework: a data and knowledge environment for neuroscience. Neuroinformatics 6, 149–160.
ISO/IEC (1997). Information Technology – Computer Graphics And Image Processing – The Virtual Reality Modeling Language (VRML) – Part 1: Functional Specification and UTF-8 Encoding. International Organization for Standardization/International Electrotechnical Commission. International Standard ISO/IEC 14772–1.
Laird, A. R., Eickhoff, S. B., Kurth, F., Fox, P. M., Uecker, A. M., Turner, J. A., Robinson, J. L., Lancaster, J. L., and Fox, P. T. (2009). ALE meta-analysis workflows via the BrainMap database: progress towards a probabilistic functional brain atlas. Front. Neuroinform. 3:23. doi: 10.3389/neuro.11.023.2009.
Nielsen, F. Å. (2009). Brede Wiki: neuroscience data structured in a wiki. In Proceedings of the Fourth Workshop on Semantic Wikis – The Semantic Wiki Web, Volume 464 of CEUR Workshop Proceedings, C. Lange, S. Schaffert, H. Skaf-Molli, and M. Völkel, eds (Aachen, RWTH Aachen University), pp. 129–133.
Nielsen, F. Å., Balslev, D., and Hansen, L. K. (2006a). Data mining a functional neuroimaging database for functional segregation in brain regions. In Den 15. Danske Konference i Mønstergenkendelse og Billedanalyse, S. I. Olsen, ed. (Copenhagen, The Department of Computer Science, University of Copenhagen).
Nielsen, F. Å., and Hansen, L. K. (1999). Modeling of BrainMap Data. Available at http://isp.imm.dtu.dk/publications/1999/nielsen.nips99.ps.gz
.
Nielsen, F. Å., and Hansen, L. K. (2000a). Experiences with Matlab and VRML in functional neuroimaging visualizations. In VDE2000 – Visualization Development Environments, Workshop Proceedings, Princeton, New Jersey, USA, April 27–28, 2000, S. Klasky and S. Thorpe, eds (Princeton, NJ, Princeton Plasma Physics Laboratory), pp. 76–81.
Nielsen, F. Å., and Hansen, L. K. (2000b). Functional Volumes Modeling Using Kernel Density Estimation. Available at http://www.imm.dtu.dk/pubdb/views/edoc_download.php/4688/pdf/imm4688.pdf
.