To what extent is blood a reasonable surrogate for brain in gene expression studies: estimation from mouse hippocampus and spleen
1
Social, Genetic and Developmental Psychiatry Centre, Institute of Psychiatry, King’s College London, London, UK
2
Department of Neuroscience, Institute of Psychiatry, King’s College London, London, UK
3
University of Tennessee Medical School, Memphis, TN, USA
Microarrays are designed to measure genome-wide differences in gene expression. In cases where a tissue is not accessible for analysis (e.g. human brain), it is of interest to determine whether a second, accessible tissue could be used as a surrogate for transcription profiling. Surrogacy has applications in the study of behavioural and neurodegenerative disorders. Comparison between hippocampus and spleen mRNA obtained from a mouse recombinant inbred panel indicates a high degree of correlation between the tissues for genes that display a high heritability of expression level. This correlation is not limited to apparent expression differences caused by sequence polymorphisms in the target sequences and includes both cis and trans genetic effects. A tissue such as blood could therefore give surrogate information on expression in brain for a subset of genes, in particular those co-expressed between the two tissues, which have heritably varying expression.
Microarray technology captures the variation in expression levels within the transcriptome. Gene expression levels not only vary between different genotypes but also between each tissue within the same individual. Gene expression profiles of a particular tissue can be used in the prognosis and diagnosis of disease. Research on cervical cancer identified approximately 40 genes that could be used to generate a profile to distinguish normal and cancerous tissue (Wong et al., 2003
) This approach has also been used in the prediction of breast (Brennan et al., 2005
), rectal (de Bruin et al., 2007
) and gastric cancers (Wang et al., 2006
). Similar analysis could potentially allow insight into the genetic component of neurodegenerative disorders such as Alzheimer’s disease and Parkinson’s disease. Expression analysis of the brains of deceased Alzheimer’s and Parkinson’s sufferers has revealed major changes in gene regulation associated with each disease (Blalock et al., 2004
; Papapetropoulos et al., 2007
). However, the lack of human brain tissue samples available has limited the scale of such research and ultimately does not allow for the development of diagnostic tools for the disease in living patients. The same limitation can also affect basic research into gene function. One possible solution to this problem is the use of another tissue such as blood as a substitute for the actual tissue of interest (Liew et al., 2006
; Mohr and Liew, 2007
). It is not clear whether this approach is viable due to the effects to tissue-specific expression.
In order to establish the validity of tissue substitution, it is necessary to understand the tissue-specific sources of variation in expression. (Sullivan et al., 2006
) address the question of comparability of expression profiles between tissues. Their analysis compared individual profiles (i.e pairwise correlation of arrays across all expressed transcripts) and concluded that there is substantial correlation between profiles from tissues. These profile correlations are of interest as they reflect a common biological baseline of all cells (as well as the technical profile of the arrays). However, the work is not informative on the main question for surrogate tissues: does the study of blood (for example) offer the opportunity to infer expression differences that also occur in brain?
While such a comparison would be difficult to achieve using human tissue, rat and mouse genetic reference populations (Chesler et al., 2003
) offer an opportunity to study genetically driven expression differences in a highly controlled way. Gene expression studies of these have been used chiefly to explore gene regulation by genetically mapping expression Quantitative Trait Loci (eQTLs). Here we use the data simply to explore the correlation for each transcript between tissues across a panel of different genotypes. Transcripts that do correlate should also show similar eQTLs. Previous analysis of tissue specificity have estimated that a third of tissue specific eQTLs are cis-acting while approximately half are trans acting (Huang et al., 2009
). However, comparisons of tissues have varied in their estimates of similarity between expression values. The BXD recombinant inbred (RI) panel (which is derived from the strains C57BL/6 and DBA/2) is one of the most extensively studied RI panels and currently the largest available in a mammalian species (Taylor et al., 1999
; Peirce et al., 2004
). A study of the BXD RI panel using liver, adipose, muscle and brain tissue identified an overlap of cis-eQTLS of 63–88% (Meng et al., 2007
). Conversely, a study of the BXH/HXB panel of rat recombinant inbred strains found only 15% of cis-eQTLs that were common to both fat and kidney tissue (Hubner et al., 2005
). Here comparable data sets from 21 BXD lines for the hippocampus, (Overall et al., 2009
) and spleen are used to investigate the usefulness of tissue substitution. Comparison of a tissue occurring in the brain and one occurring in the blood provides an indication as to what degree tissue specificity affects overall gene expression levels and hence whether tissue surrogacy is a viable approach to the study of brain tissue.
Previous studies into microarray expression data have raised the issue of what effect Single Nucleotide Polymorphisms (SNPs) have upon the hybridisation and intensity levels for a probe set. (Walter et al., 2007
; Tabakoff et al., 2008
) Differences in hybridisation intensity resulting from polymorphisms would occur in any tissue where the gene was expressed, and thus mimic coordinate differences in mRNA abundance. The presence or absence of a SNP therefore will have a strong effect of gene expression and this is also taken into account within the study.
The hippocampal transcriptome data has been generated by an international consortium for 67 BXD strains (Overall et al., 2009
). The hippocampal formation, not including the subiculum, was dissected and pooled for hybridization to a single Affymetrix M430 2.0 array. Each BXD strain had one male and one female array per line with each sample being generated from a pool of three littermates. Arrays were run and processed at the W. Harry Feinstone Center for Genomic Research, University of Memphis, TN, USA. Raw microarray data were summarised using the RMA method (Irizarry et al., 2003
). Further information about the animals used in this study and individual array-level information can be found at the GeneNetwork site
1
. For the spleen data, a colony of 24 BXD RI strains was maintained at the Institute of Psychiatry using original stocks purchased from The Jackson Laboratory (Bar Harbor, ME, USA). The spleen data is derived exclusively from females with four arrays per line (again, using the Affymetrix M430 2.0 array), all from separate individuals. These were also processed with RMA and the strain means calculated. The 21 strains of the BXD panel for which both hippocampus and spleen data was obtained are BXD1/TyJ, BXD5/TyJ, BXD6/TyJ, BXD8/TyJ, BXD9/TyJ, BXD11/TyJ, BXD12/TyJ, BXD16/TyJ, BXD18/TyJ, BXD19/TyJ, BXD21/TyJ, BXD22/TyJ, BXD23/TyJ, BXD24b/TyJ, BXD27/TyJ, BXD28/TyJ, BXD31/TyJ, BXD32/TyJ, BXD34/TyJ, BXD39/TyJ and BXD40/TyJ. For each data set, only probe sets with mean intensities above the data set median were analysed (the median represents the approximate background level of expression on the array). These filtered subsets largely overlapped, giving 16,949 probesets expressed by this criterion in both data sets.
Coefficient of Variance vs Correlation
In order to compare data matrices from the two data sets, strain means were prepared for all probesets for each line and tissue, yielding a 45,510 by 21 matrix for each tissue. We then excluded low intensity probesets as the variance is such that the probesets are dominated by background noise. Of the 22,550 probesets in the upper half of the intensity distribution in the hippocampus, 16,949 (76%) are also in the upper half of the distribution for spleen, demonstrating that a large number of genes expressed in the hippocampus are also expressed in the spleen. The Pearson correlation coefficients between tissues for each of the 16,949 probesets across the 22 lines were calculated. The distribution of these R values is approximately normal and centred near zero. Superficially this seems to indicate that the spleen arrays do not reflect what is happening in the brain, but in fact the majority of the probesets used in the correlation analysis interrogate transcripts whose true expression levels do not vary across the RI panel. Therefore, the variance that is being compared here is the (random) experimental error. The key question is whether there is correlation in those transcripts that do vary across lines. As an index of this (genetically driven) variation, the coefficient of variation (CV) was calculated for each probe set and tissue. The CV value is given by:

where σ is the standard deviation and µ is the mean. A scatter plot of CV vs R indicates that with increasing CV, there is an increasing incidence of high correlation for both datasets (Figures 1
A,B). To dissect this further, a distribution of R for a range of minimum CV values was plotted (Figure 2
). The data as a whole shows a distribution consistent with uncorrelated randomly varying data, as the filter for ‘variable’ probesets becomes more stringent, a second peak of high correlating probesets becomes more prominent. It can be demonstrated that this is not simply an artefact of our analysis methods by performing a simple permutation experiment. If the identities of the RI lines in the brain sample are randomised, it can be seen that this characteristic pattern of higher correlation in the most variable probesets disappears (Figure 3
). It should be noted that randomising the strains alters the calculated correlations coefficient but not the CV values.
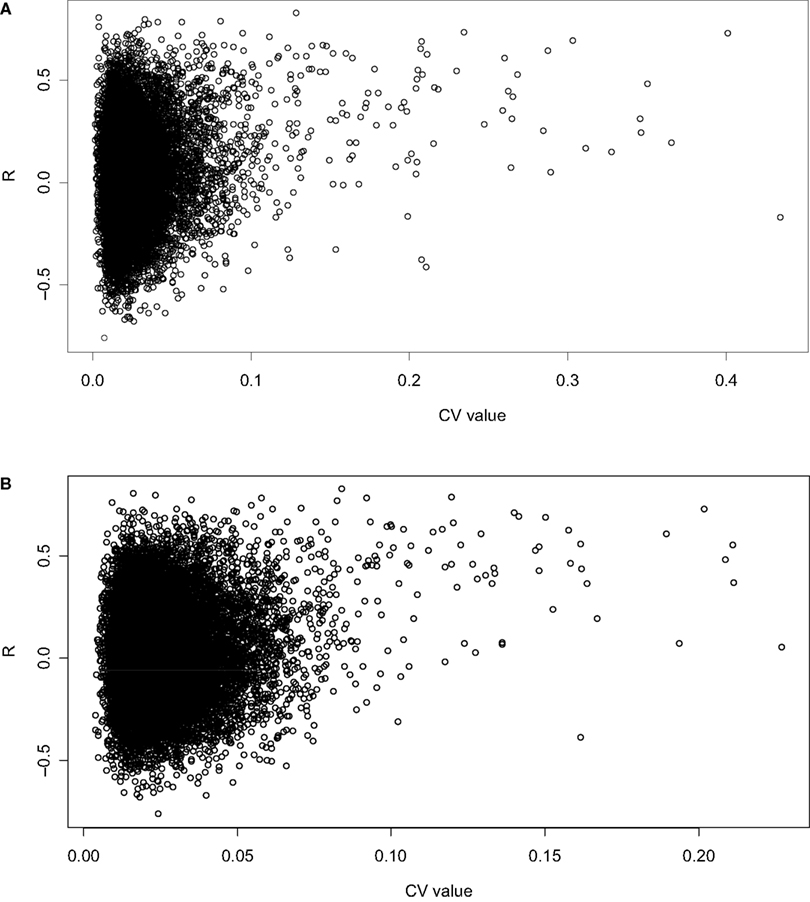
Figure 1. Scatterplot of CV vs showing a positive correlation between CV in the (A) spleen and (B) hippocampus datasets and the correlation between the two tissues.
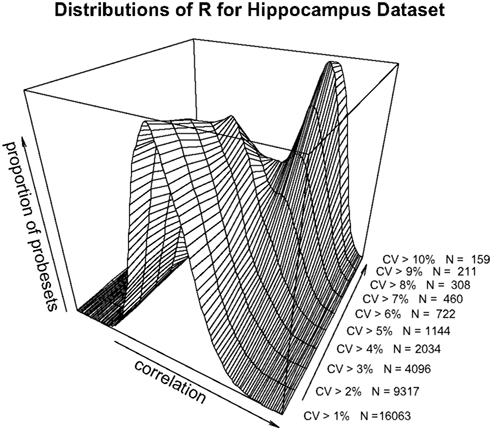
Figure 2. Distribution of correlation coefficients for the entire dataset (17203 probesets) and for subsets with CV > 0.01, CV > 0.02…CV > 0.10 in the hippocampus dataset.
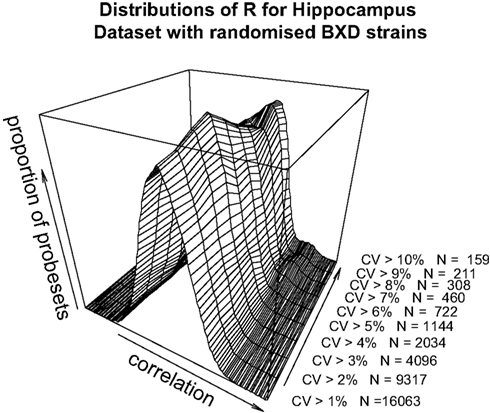
Figure 3. Pearson’s product-moment correlation plotted against the density of CV values for randomised BXD strains for the range of CV > 0.01, CV > 0.02…CV > 0.10 for the hippocampus dataset.
SNP Data
In order to identify how the presence or absence of a SNP can affect apparent QTL expression, the dataset was divided into eQTLs where at least one SNP was present (SNP positive data) and eQTLs where the presence of a SNP was absent or unknown (SNP negative data). A list of probe sets that contain polymorphisms between the C57BL/6J and DBA/2J strains has previously been created by Walter et al. (2007)
. According to this list 2,085 of the 16,494 probesets our analysis considers contained at least one SNP. From this, SNP positive and SNP negative subsets of both the spleen and hippocampus data were created. One possible source of the correlation we observe for some probesets between tissues would be polymorphism within the sequences interrogated by the probes. This could produce a genetically-driven signal intensity difference, observable in any tissue where expression is detectable. The calculated value reflects the different hybridization performances of mismatched probe sequences due to the presence of a SNP in the transcript sequence that does not relate directly to mRNA abundance. A list of probesets containing one or more SNPs has been prepared from several genome-wide sources of data on the progenitor strains of the BXD RI panel, which is believed to be comprehensive or very nearly so (Walter et al., 2007
). Excluding those probesets from the analysis does not materially change the observation. When the datasets are divided into SNP positive and SNP negative probesets, the same correlation is observed (Figures 4
A,B>). This suggests that there are strong contributing factors to expression variation that are not confounded by SNPs in the transcript sequence.
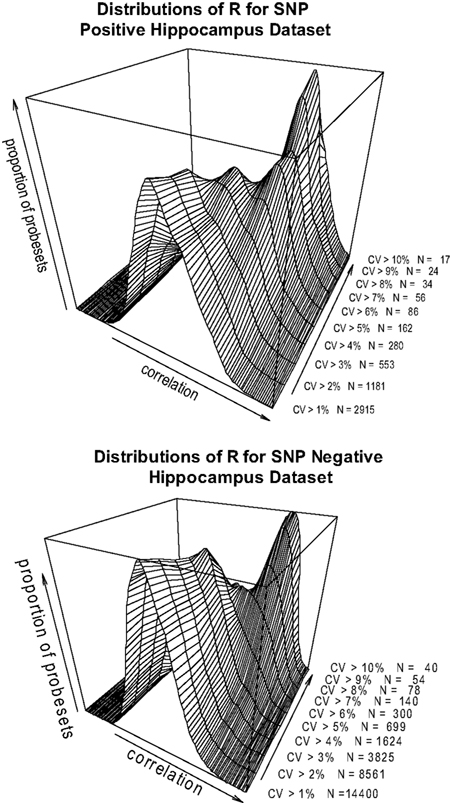
Figure 4. (A,B) Pearson’s product-moment correlation plotted against the density of CV values for the range of CV > 0.1, CV > 0.2…CV > 0.10 in the hippocampus SNP positive (A) and SNP negative (B) datasets.
Cis and Trans Regulatory Effects on Genetic Variance
QTLs for expression of selected probesets were mapped using the R/qtl (Broman et al., 2003
) function scanone (default method) and genotype data was taken from www.webqtl.org
. The genotypes were reduced to 795 markers by retaining only strain distribution patterns unique in the present 21 strains and eliminating X chromosome markers. The 200 probesets which showed the highest CV values for both the hippocampus and spleen dataset were selected for QTL analysis. Using a significance cut-off of LOD (Base −10 log odds ratio) of 4, autosomal cis and trans acting loci were identified for 118 and 125 of the probes for the hippocampus and spleen data sets respectively. A cis-effect is a polymorphism in the gene or its immediate context (a cis regulatory locus can be operationally defined as any within 10 Mb of a gene’s physical location) while a trans-effect eQTL occurs at a different physical location, either distant from the affected gene on the same chromosome or on a different chromosome entirely. There was a large difference in the number of eQTLs, 197 for the hippocampus dataset and 307 for the spleen. The ratio of cis/trans effects is markedly different for the two tissues, trans effects account for 23.6% of hippocampus significant loci but only 8% in spleen. Only two autosomal eQTLs that showed a trans effect for both tissues were identified, rs6253968 at Chr1.qA4 (which occurs within the transcribed region of a voltage-gated potassium channel) and rs13480733 at Chr10.qD1. The analysis therefore fails to establish strong trans effects across the two tissues.
The estimated correlation between the expression values of the spleen and hippocampus tissues depends upon the coefficient of variance across the BXD strains. In the case of genes with highly heritable expression levels, it may be possible that spleen tissue would be able to act as a surrogate for hippocampus tissue. Spleen is used here as an example of a heterogeneous, easily obtained tissue although admittedly it differs in details of its composition from mouse or human blood. An RI panel also does not represent the structure of a human outbred population, but it does offer a highly controlled way to examine to what extent strong effects of potential interest in brain, for example, might be detectable from the analysis of blood.
In order to estimate the validity of this hypothesis, it is necessary to fully understand the contributing factors which determine variation in gene expression. A major source of variation in gene expression is caused by the presence of SNPs within the coding region as well as by the presence of insertions and deletions within the genome. An estimated 17–25% of expression variation can be explained by SNPs or sequence variation (Ciobanu et al., 2008
). Taking isoform variants into account, this proportion rises to 40–50%. The presence of SNPs within the binding region of a probe can alter the hybridization affinity of the probe (this is particularly the case if the polymorphism occurs within the centre of the binding site). A difficulty of analyzing RI strains using a microarray is that the probe set may favour one haplotype over the other. As it is difficult to establish the degree of variation caused by the presence or absence of a SNP, the safest strategy might be to remove all probes from the platform where an SNP occurs. However, Figures 4
A,B indicates that when the probes are separated into SNP-positive and SNP-negative datasets, the same overall pattern of expression correlation is maintained. Thus the analysis would suggest that there must be other sources of variations determining the expression level.
Beyond the presence of SNPs, there are numerous other factors that can affect the microarray signal including Copy Number Variants, indels, alternative splicing and 5′ and 3′ UTR processing (Bemmo et al., 2008
; Kwan et al., 2008
), all of which can affect the calculated expression by the microarray. Also, the extreme 3′ position of many of the Affymetrix probesets in this type of array may give rise to apparent expression differences which do not reflect biologically functional differences in the quantity of coding sequence mRNA (Ciobanu et al., 2008
). It has previously been suggested that the majority of significant regulatory genes are cis-modulated rather than trans (Chesler et al., 2005
). However, there is an imbalance in statistical power in detecting the presence of trans-eQTLs in comparison to cis. While the majority of eQTLs identified in yeast have been trans acting, comparatively few have been identified in rodents and humans (Huang et al., 2009
). There are, however, exceptions such as Qrr1, a QTL-rich region of Chromosome 1 that is known to influence several neural and behavioural phenotypes through trans-modulation (Mozhui et al., 2008
). The presence of different cis and trans acting loci between the two tissues suggests that there might be inherent limitations to the use of one tissue substituting for another. Although this may well be the case, it would be necessary to further understand all the sources of variations within microarray analysis in order to determine the precise causes of tissue-specific expression. Wide scale analysis of multiple brain and body tissues across a large range of recombinant inbred strains, as proposed by Huang et al. (2009)
, may provide a clearer understanding of the effects of tissue-specific expression.
The strain specific correlation of a large variation in expression profiles for the spleen and hippocampus datasets is extremely interesting but does not provide clear evidence that one tissue could be used as a substitute for the other. Partly this is because it is difficult to identify the source of that variation, even when studying inbred mouse populations where the genetic and environmental factors may be more easily controlled. To estimate to what extent spleen works as a surrogate for hippocampus, consider that expression above background on microarrays for the two tissues show an overlap for approximately three-quarters of all probesets. Furthermore, of those probesets which are highly variable in hippocampus (CV > 10), one-third are also highly variable in spleen. Of the potentially interesting differences in hippocampus, therefore, approximately two out of nine should be recoverable from spleen. Although this is only a small fraction, its detection may be worthwhile in an experiment where the aim is to discover entry points into unknown biochemical pathways or to identify potential biomarkers. The calculation is likely to be considerably more favourable if RNA sequencing is used because the threshold for detection of expression is lower and the precision is higher (Sultan et al., 2008
).
All housing and experimental procedures were performed in accordance with the = UK Home Office Animals (Scientific Procedures) Act 1986.
The authors declare that the research was conducted in the absence of any commercial or financial relationships that could be construed as a potential conflict of interest.
This work was supported by MRC Grant Number G0000170 (LCS).
Chesler, E. J., Lu, L., Shou, S., Qu, Y., Gu, J., Wang, J., Hsu, H. C., Mountz, J. D., Baldwin, N. E., Langston, M. A., Threadgill, D. W., Manly, K. F., and Williams, R. W. (2005). Complex trait analysis of gene expression uncovers polygenic and pleiotropic networks that modulate nervous system function. Nat. Genet. 37, 233–242.
Hubner, N., Wallace, C. A., Zimdahl, H., Petretto, E., Schulz, H., Maciver, F., Mueller, M., Hummel, O., Monti, J., Zidek, V., Musilova, A., Kren, V., Causton, H., Game, L., Born, G., Schmidt, S., Muller, A., Cook, S. A., Kurtz, T. W., Whittaker, J., Pravenec, M., and Aitman, T. J. (2005). Integrated transcriptional profiling and linkage analysis for identification of genes underlying disease. Nat. Genet. 37, 243–253.
Sultan, M., Schulz, M. H., Richard, H., Magen, A., Klingenhoff, A., Scherf, M., Seifert, M., Borodina, T., Soldatov, A., Parkhomchuk, D., Schmidt, D., O’Keeffe, S., Haas, S., Vingron, M., Lehrach, H., and Yaspo, M. L. (2008). A global view of gene activity and alternative splicing by deep sequencing of the human transcriptome. Science 321, 956–960.
Wong, Y. F., Selvanayagam, Z. E., Wei, N., Porter, J., Vittal, R., Hu, R., Lin, Y., Liao, J., Shih, J. W., Cheung, T. H., Lo, K. W., Yim, S. F., Yip, S. K., Ngong, D. T., Siu, N., Chan, L. K., Chan, C. S., Kong, T., Kutlina, E., McKinnon, R. D., Denhardt, D. T., Chin, K. V., and Chung, T. K. (2003). Expression genomics of cervical cancer: molecular classification and prediction of radiotherapy response by DNA microarray. Clin. Cancer Res. 9, 5486–5492.