Short promoters in viral vectors drive selective expression in mammalian inhibitory neurons, but do not restrict activity to specific inhibitory cell-types
1
Systems Neurobiology Laboratories, Salk Institute for Biological Studies, La Jolla, CA, USA
2
Department of Bioengineering, University of California, San Diego, La Jolla, CA, USA
3
Razavi Newman Center for Bioinformatics, Salk Institute for Biological Studies, La Jolla, CA, USA
4
Neuronal Network Mechanisms Research Group, RIKEN Brain Science Institute, Saitama, Japan
Short cell-type specific promoter sequences are important for targeted gene therapy and studies of brain circuitry. We report on the ability of short promoter sequences to drive fluorescent protein expression in specific types of mammalian cortical inhibitory neurons using adeno-associated virus (AAV) and lentivirus (LV) vectors. We tested many gene regulatory sequences derived from fugu (Takifugu rubripes), mouse, human, and synthetic composite regulatory elements. All fugu compact promoters expressed in mouse cortex, with only the somatostatin (SST) and the neuropeptide Y (NPY) promoters largely restricting expression to GABAergic neurons. However these promoters did not control expression in inhibitory cells in a subtype specific manner. We also tested mammalian promoter sequences derived from genes putatively coexpressed or coregulated within three major inhibitory interneuron classes (PV, SST, VIP). In contrast to the fugu promoters, many of the mammalian sequences failed to express, and only the promoter from gene A930038C07Rik conferred restricted expression, although as in the case of the fugu sequences, this too was not inhibitory neuron subtype specific. Lastly and more promisingly, a synthetic sequence consisting of a composite regulatory element assembled with PAX6 E1.1 binding sites, NRSE and a minimal CMV promoter showed markedly restricted expression to a small subset of mostly inhibitory neurons, but whose commonalities are unknown.
The mammalian cerebral cortex contains two major classes of neurons, excitatory and inhibitory. Distinguished from excitatory neurons by their primary neurotransmitter, γ-aminobutyric acid (GABA) rather than glutamate, inhibitory neurons make up a modest 10–20% of cortical neurons, yet play critical roles in modulating the activity of cortical circuits.
Cortical circuits consist of precise cell-type specific connections, whereby subcortical brain structures form connections with specific cortical inhibitory neuron subtypes (Freund and Gulyas, 1991
; Hornung and Celio, 1992
; Gibson et al., 1999
). Inhibitory neurons also form selective inter-cortical connections to excitatory neurons and other inhibitory neurons (Somogyi, 1977
; Meskenaite, 1997
; Tamas et al., 1998
; Defelipe et al., 1999
; Gonchar and Burkhalter, 1999
). Inhibitory neuron subtypes can be distinguished by morphology, intrinsic physiological properties and cellular function, and many can be uniquely differentiated by their gene expression profiles (Peters and Regidor, 1981
; Kawaguchi, 1993
; Kawaguchi and Kubota, 1996
, 1997
; Cauli et al., 1997
; Gonchar and Burkhalter, 1997
; Thomson and Deuchars, 1997
; Parra et al., 1998
; Gupta et al., 2000
; Karube et al., 2004
; Xu et al., 2006
). Inhibitory neurons in rat can be divided into four largely non-overlapping groups, distinguished by the expression of either parvalbumin (PV), somatostatin (SST), cholecystokinin (CCK) or calretinin (CR) (Kawaguchi and Kubota, 1997
). CCK and CR both overlap with vasointestinal polypeptide (VIP), but VIP does not overlap with PV or SST. Thus PV, SST, and VIP can also be used to define three largely non-overlapping cell groups. In mice, unlike rats, many CR expressing cells also express SST (Xu et al., 2006
). Nevertheless, as in rats, three non-overlapping groups can be distinguished by PV, SST and VIP.
Recombinant adeno-associated virus and lentivirus are promising vectors for gene therapy because they can infect postmitotic neurons and mediate stable gene expression with minimal toxicity (Monahan and Samulski, 2000
; Galimi and Verma, 2002
). In addition, genetic methods for selective neuronal tracing or inactivation, for which viruses are the best delivery vehicles, have been developed to directly study particular cells, but the utility of these genetic tools requires the ability to selectively target gene expression to specific cell-types (Callaway, 2005
; Luo et al., 2008
). One such way is to use short cis-regulatory sequences (termed promoters), which can regulate gene expression using enhancers, silencers, and/or insulator/boundary elements. We used both rAAV2/1 (AAV2 backbone packaged with AAV1 capsid) (AAV) and VSV (vesicular stomatitis virus)-G-pseudotyped LV (LV) vectors for testing the activity and specificity of promoters. AAV can package DNA sequences up to ∼5 kilobases (kb) (Dong et al., 1996
) while LV can accommodate larger sequences up to ∼9 kb (Kumar et al., 2001
). In the absence of helper virus or genotoxic stimuli, rAAV can either integrate randomly or form circular episomal provirus by intermolecular concatamerization (Duan et al., 1998
; Yang et al., 1999
). In contrast, LV mediates stable transduction by genome integration (Naldini et al., 1996a
), creating the possibility that the same promoter and transgene will function differently in the two viruses. An additional difference between AAV and LV is viral tropism. We previously reported that rAAV2/1 transduces cortical inhibitory neurons more efficiently than excitatory neurons, while VSV-G-LV transduces excitatory neurons more efficiently than inhibitory neurons (Nathanson et al., 2009
). Both AAV and LV also transduce glia. Therefore, AAV presumably provides a better system to test for differential expression amongst inhibitory neuron subtypes, while LV provides an alternative platform, and might be advantageous for determining whether a promoter drives expression in excitatory neurons. AAV and/or LV were used to test promoters derived from Takifugu rubripes (fugu), mouse, human and composite regulatory element sequences. We sought to create viruses with cell-type specific promoters capable of driving expression in specific inhibitory neurons types, particularly the non-overlapping classes expressing either PV, SST or VIP.
With one-eighth the size of the human genome, an average gene density of one gene locus per 10.9 kb of genomic sequence and a similar repertoire of genes (Aparicio et al., 2002
) the fugu genome provides an excellent collection of concise DNA regulatory regions. The intergenic regions, which are thought to contain the bulk of the gene regulatory information, are small and on the same scale as the capacities of AAV and LV. We hypothesized that for some fugu genes, the mere upstream intergenic region may contain genetic regulatory information nearly equivalent to that found in the much larger mammalian sequences, and could be used for controlling gene expression in the mammalian nervous system. Indeed, regulatory regions from the fugu isotocin and vasotocin genes drive specific expression in the corresponding oxytocin and vasotocin cells in the hypothalamus of transgenic rats and mice (Venkatesh et al., 1997
; Gilligan et al., 2003
). Also, a 6.5-kb fragment of the fugu rhodopsin gene produced specific expression in the retina of transgenic mice (Zhang et al., 2003
). Further analysis also revealed a 500-bp fragment capable of driving rod cell specific expression. Therefore, gene regulatory sequences specific for cell-types in the nervous system can be conserved across the large evolutionary distances between fugu and mammals.
The premise of our fugu hypothesis is that distinct subtypes of inhibitory neurons in the fugu telencephalon contain similar proteins and neuropeptides as in mammals, and that their expression may be similarly regulated. Telencephalic inhibitory neurons in mammals and teleosts, of which fugu is a member, and even the ancient sea lamprey, originate in the ganglionic eminences of the subpallial telencephalon (Melendez-Ferro et al., 2002
). Therefore, even though fish lack a cortex, the telencephalic origin of the mammalian cortical inhibitory neurons is shared with fish. As evidence of this link, a reporter construct driven by the zebrafish distal-less homeobox enhancer DLX4/6, which is involved in the generation of inhibitory neurons in the ganglionic eminence, drove expression in cells that became mouse cortical inhibitory neurons (Stuhmer et al., 2002
). Regulatory mechanisms responsible for the generation of inhibitory neurons are thus shared between fish and mammals. Importantly, the fish telencephalon expresses many of the same inhibitory genes for which we intend to test promoters – PV (Brinon et al., 1994
), CR (Diaz-Regueira and Anadon, 2000
; Castro et al., 2003
), SST (Batten et al., 1990
; Becerra et al., 1995
) and NPY (Becerra et al., 1995
; Castro et al., 1999
).
We tested putative regulatory regions from fugu genes orthologous to mammalian inhibitory neuron specific markers PV, CR, SST and NPY. Additional candidate sequences for these cell-types were chosen from genes putatively coexpressed with these inhibitory cell-types in mouse. Sugino et al. (2006)
used microarrays to profile gene expression in several inhibitory neuron subtypes. These coexpressed genes provided additional candidates for targeting inhibitory neuron subtypes. Motivated by this data, we chose the fugu genes titin-cap (TCAP) and secreted frizzled-related protein 2 (SFRP2), which respectively express in PV and SST cell-types in the mouse. In addition to the promoters targeting inhibitory neuron populations, we created a fugu promoter for α-calcium/calmodulin-dependent protein kinase II (CAMK), a gene with expression restricted to excitatory neurons in the neocortex and hippocampus in rat (Liu and Jones, 1996
) and monkey (Jones et al., 1994
).
Since coexpressed genes may also be coregulated (Kielbase et al., 2004
; Cora et al., 2005
), Sugino et al.’s (2006
) data provides a resource which we also used to apply bioinformatics analysis to suggest regulatory modules responsible for neuronal cell-type specific expression in mammals. First, we searched for transcription factor binding sites (TFBSs) conserved across coexpressed genes and across species. Distinctive TFBSs abundant in regulatory regions of genes coexpressed in a cell-type were hypothesized to be important for conferring cell-type specific expression. We chose human candidate genes containing regulatory sequences exhibiting a maximum number of TFBSs enriched in one cell-type, and a minimum number of TFBSs found in genes expressed by the other cell-types. Next, human promoter sequence segments were identified and cloned to putatively target SST, PV or VIP expressing inhibitory neuron subtypes.
Lastly, we tested promoters consisting of synthetic composite regulatory elements (CREs) consisting of TFBSs assembled with a minimal promoter. CREs consisting of more than one transcription factor binding site can drive highly specific patterns of gene regulation (Kel et al., 1995
; Kel-Margoulis et al., 2002
). These factor-factor interactions have been shown to be synergistic or antagonistic. Synergistic interactions can be a result of cooperative binding (Moreno et al., 1995
; Brass et al., 1996
; Butscher et al., 1998
; Muhlethaler-Mottet et al., 1998
; Okuno et al., 2001
) or hierarchical loading (Linhoff et al., 1997
). Antagonistic interactions can be a result of mutually exclusive binding because of competition for overlapping binding sites (Casolaro et al., 1995
; Klein-Hessling et al., 1996
; Takeuchi et al., 1998
) or by repressor masking an activation domain (Diamond et al., 1990
). We created CREs by combining DR1 (Okuno et al., 2001
) or E1.1 (Scardigli et al., 2003
) motifs with a neuron restrictive silencing element (NRSE) (Bessis et al., 1997
; Millecamps et al., 1999
) and a minimal cytomegalovirus (mCMV) promoter.
Design of Fugu Reporter Constructs
Putative fugu gene orthologs were found by tblastn search and gene annotation of the following databases : Fugu rubripes v3.0 or v4.0 genome at JGI
1
, Queen Mary University of London
2
and Ensembl
3
. In case of genes duplicated in the fish genome, a putative fugu orthologous gene was chosen based on preservation of order among short range neighboring genes and DNA sequence conservation. When this was compatible with the virus DNA capacity, the entire fugu upstream intergenic region was introduced into the viral expression vector. When the genomic sequence exceeded the capacity of the viral expression vector, the maximal upstream sequence proximal to the gene 5′ end was chosen. Sequences were isolated from the fugu genomic DNA by PCR amplification using primers flanked with restriction enzyme cloning sites.
Sequences for the fugu viral vectors were as follows.
1. fCAMK (AAV) – α-calcium/calmodulin-dependent protein kinase II, 2567-bp, Fugu 2002 assembly: chrUn:257,733,699-257,736,265 (UCSC), upstream of Ensembl transcript SINFRUT00000157719 (CAMK). Fugu 2004 assembly: chrUn:114,469,050-114,471,616 (UCSC), upstream of Ensembl transcript ENSTRUT00000018600 (CAMK).
2. fCR (AAV) – calretinin, 2595-bp, Fugu 2002 assembly: chrUn:239,797,309-239,799,903 (UCSC), upstream of Ensembl transcript SINFRUT00000150025. Fugu 2004 assembly: chrUn:47,433,038-47,435,619 (UCSC), upstream of Ensembl transcript ENSTRUT00000046308 (CR).
3. fCR (LV) – 6326-bp, A similar, but larger region of fCR (AAV). Fugu 2002 assembly: mapped to chrUn:239,793,595-239,799,905 (UCSC). Fugu 2004 assembly: mapped to chrUn:47,429,323-47,435,621 (UCSC).
4. fNPY (AAV) – neuropeptide Y, 2605-bp, Fugu 2002 assembly: chrUn:103,680,529-103,683,131 (UCSC), upstream of Ensembl transcript SINFRUT00000153449 (NPY). Fugu2004 assembly: chrUn:287,512,332-287,514,956 (UCSC), upstream of Ensembl transcript ENSTRUT00000016839 (NPY).
5. fNPY (LV) – 6443-bp A similar, but larger region of fNPY (AAV). Fugu 2002 assembly: mapped to chrUn:103,680,529-103,686,955 (UCSC). Fugu 2004 assembly: mapped to chrUn:287,509,165-287,514,956 (UCSC).
6. fPV (AAV) – parvalbumin, 2395-bp, Fugu 2002 assembly: chrUn:103,113,651-103,116,040 (UCSC), upstream of Ensembl transcript SINFRUT00000151321 (PV). Fugu 2004 assembly: chrUn:316,053,780-316,056,172, but is no longer identified as the fugu ortholog. The new fugu ortholog is Ensembl transcript ENSTRUT00000000079.
7. fPV (LV) – 2893-bp A similar, but larger region of fPV (AAV). Fugu 2002 assembly: mapped to chrUn:103,113,151-103,116,041 (UCSC). Fugu 2004 assembly: mapped to chrUn:316,053,280-316,056,173 (UCSC).
8. fSFRP2 (AAV) – secreted frizzled-related protein 2, 1218-bp, Fugu 2002 assembly: chrUn:13,504,648-13,505,865 (UCSC), upstream of Ensembl transcript SINFRUT00000138275 (SFRP2). Fugu 2004 assembly: chrUn:96,858,434-96,859,651 (UCSC), part of first intron of Ensembl transcript ENSTRUT00000017303 (SFRP2).
9. fSST (AAV) – somatostatin, 2597-bp, Fugu Assembly 2002: chrUn:228,946,036-228,948,614 (UCSC), upstream of Ensembl transcript SINFRUT00000151429 (SST). Fugu Assembly 2004: chrUn:232,110,513-232,113,091 (UCSC), downstream region of Ensembl transcript ENSTRUT00000025350 (SST).
10. fSST (LV) – 4406-bp A similar, but larger region of fSST (AAV). Fugu 2002 assembly: mapped to chrUn:228,946,036-228,950,367 (UCSC). Fugu 2004 assembly: mapped to chrUn:232,108,687-232,113,091 (UCSC).
11. fTCAP (AAV) – titin cap, 2656-bp, Fugu 2002 assembly: chrUn:17,827,063-17,829,718 (UCSC), upstream of Ensembl transcript SINFRUT00000161814. Fugu 2004 assembly: chrUn:49,879,491-49,882,146 (UCSC), upstream of Ensembl transcript ENSTRUT00000041782 (TCAP).
Design of Mammalian Reporter Constructs
Cortical gene expression data (Sugino et al., 2006
) were analyzed for the excitatory CT6 and YFPH cell-types and for the three inhibitory G30, GIN, and G42 cell-types. Genes with more than a 3-fold enrichment compared to any other cell-type were considered candidate coexpressed genes. The inhibitory cell-types were generally classified by the designation of one of their member genes: G30-VIP, G42-PV (note: PV not actually restricted to only this group, since it was also expressed in the excitatory neuron population YFPH), GIN-SST.
We analyzed the promoters of human genes specific to these cell-types to see if we could find a sequence segment that would give cell-type specific expression. To this end, we considered upstream segments of the candidate coexpressed genes, including multiple sequences for each gene if multiple alternate start sites existed. Some of the genes from the microarray analysis did not appear to be cell-type specific by in situ hybridization according to the Allen Mouse Brain Atlas (Lein et al., 2007
). Genes that were not likely restricted to inhibitory neurons were discarded, leaving 25 genes for G30-VIP, 16 genes for G42-PV and 12 genes for GIN-SST (see Table S1 in Supplementary Material).
In order to enhance the probability of isolating a 3-kb segment from these promoters that would provide cell-type specific expression, we subjected the sequences to computational analysis. We applied a phylogenetic footprinting approach (Zhang and Gerstein, 2003
), coupled with TRANSFAC matrices (Matys et al., 2003
) to predict putative TFBS. Each human promoter sequence was used to gather orthologous upstream regions from 16 vertebrate species using the UCSC Genome Browser Database (Kent et al., 2002
; Karolchik et al., 2008
), and a multi-species promoter alignment was assembled with DIALIGN (Morgenstern, 1999
). Each sequence was then searched against all vertebrate TRANSFAC matrices using MATCH (Kel et al., 2003
) with the “minSUM” score cutoff, which seeks to minimize the sum of both false positive and false negative matches. Putative TFBS were then mapped back to the alignment and used to determine conservation levels for the putative TFBS seen in human (these were considered “conserved” if they were also present in >35% of non-primate mammals in the alignment at the identical location). Presence/absence of conserved putative human TFBS were then collected for each promoter and compared between cell types. To avoid biasing TFBS representation for genes with multiple alternative start sites, this initial analysis was done by combining all of the alternative start site sequences for each gene (i.e. each gene promoter was only counted once).
We sought to identify TFBSs characteristic of each group of genes distinctive to each cell-type, and to find the promoters that had a maximum number of sites for this cell-type and a minimum number of sites for TFBSs characteristic of other cell-types. The analysis did not identify any TFBS enriched in most promoters of one gene group and completely absent in promoters of other groups. However, we did find sites that were clearly overrepresented in each of the three groups of coexpressed genes (see Tables S2–4 in Supplementary Material). Distinctive TFBS for each cell type were defined as those conserved in at least 10% of promoters from that cell type, and enriched relative to the other two cell types by a ratio of >1.5 (or enriched relative to one cell type by a ratio of >2 and the other by a ratio of >1.2, to allow for sites that were particularly distinctive for only one of the other cell types). We next determined which genes had promoters which maximized TFBSs distinctive for one cell-type and minimized TFBSs distinctive for other cell-types. We also selected the optimal alternative start site promoter in genes which had multiple start sites. In almost all cases, the optimal promoter fragment was the one that appeared to be immediately proximal to the coding region of the primary isoform of the gene.
Sequences for the mammalian viral vectors were as follows. Sequences 6–12 were chosen based on the computational analysis described above. Sequences 1–5 were chosen based on previous publications or other bioinformatic analyses.
1. hSyn (AAV) – synapsin I, 468-bp, Human 2006 assembly: chrX:47,364,154-47,364,622 (UCSC) (Kugler et al., 2003
).
2. mGAD2 (LV) – glutamate decarboxylase 2, 4415-bp, Mouse 2007 assembly: chr2:22,473,768-22,478,182 (UCSC).
3. mA93 (AAV) – riken gene A930038C07Rik, 2694-bp. Consists of two conserved regions, which we concatenated. Mouse 2007 assembly: chr6:65,592,490-65,594,288 and chr6:65,620,737-65,621,604 (UCSC).
4. mSST (LV) – somatostatin, 6001-bp, Mouse 2007 assembly: chr16:23,890,831-23,896,831 (UCSC).
5. hPDGFRA (AAV) – platelet derived growth factor receptor alpha, 2650-bp, Human 2006 assembly: chr4:54,787,691-54,790,341 (UCSC).
6. hGRM1 (AAV) – glutamate receptor, metabotropic 1, 2585-bp, Human 2006 assembly: chr6:146,389,761-146,392,345 (UCSC).
7. hNPPC (AAV) – c-type natriuretic peptide precursor, 2585-bp, Human 2006 assembly: chr2:232,499,151-232,501,735 (UCSC).
8. hADM (AAV) – adrenomedullin, 2555-bp, Human 2006 assembly: chr11:10,281,564-10,284,118 (UCSC).
9. hST3GAL6 (AAV) – type 2 lactosamine alpha-2,3-sialyltransferase, 2739-bp, Human 2006 assembly: chr3:99,931,562-99,934,300 (UCSC).
10. hRREB1 (AAV) – ras responsive element binding protein 1, 2715-bp, Human 2006 assembly: chr6:7,050,563-7,053,277 (UCSC).
11. hDIO2 (AAV) – deiodinase, iodothyronine, type II, 2568-bp, Human 2006 assembly: chr14:79,747,568-79,750,140 (UCSC).
12. hNR2F2 (AAV) – nuclear receptor subfamily 2, group F, member 2, 2568-bp, Human 2006 assembly: chr15:94,667,976-94,670,543 (UCSC).
Design of Composite Regulatory Element (CRE) Reporter Constructs
Three CREs were constructed. Elements were ordered as oligonucleotides, and assembled as a DNA cassette.
1. E1.1-mCMV (AAV) – four E.1.1 binding sites (5′TCATTCACGCCTAGAAGCAG3′), as described in Scardigli et al. (2003)
, were assembled upstream of a minimal CMV promoter consisting of 58 base pairs near the 3′ end of the CMV promoter. The distance between the 3′ most E1.1 site TAGGCGTGTACGGTGGGAGGTCTATATAAGCAGAGCTGGTTTAGTGAACCGTCAGATC and the mCMV was 59 bp. This cassette was cloned into the AAV transfer vector. (AAV-E1.1)
2. E1.1-NRSE-mCMV (AAV) – the E1.1-mCMV construct plus a neuron restrictive silencing element (NRSE) binding site (5′TTCAGCACCACGGACAGCGCC3′) inserted between the E1.1 sites and the mCMV. The distance between the 3′ most E1.1 site and NRSE was 61 bp, and between NRSE and mCMV was 3 bp. This construct was cloned into the AAV transfer vector. (AAV-E1.1-NRSE)
3. NRSE-DR1-mCMV (AAV) – a single DR1 binding site (5′TCTAGGGGTCAAAGGTCACCGG3′), as described in Okuno et al. (2001)
, was inserted between an upstream NRSE binding site (5′TTCAGCACCACGGACAGCGCC3′) and downstream of a minimal CMV promoter. The distance between NRSE and DR1 was 9 bp, and between DR1 and mCMV was 12 bp. This construct was cloned into the AAV transfer vector. (AAV-DR1-NRSE)
Virus Production
Promoters were cloned into either ITR flanked AAV transfer vectors (Kaspar et al., 2002
) or LV transfer vectors (pCSC-SP-PW, Marr et al., 2004
) expressing green fluorescent protein (GFP) or red fluorescent protein DsRed-Express (RFP). Plasmids were purified using endotoxin-free maxiprep kits (Qiagen, Valencia, CA, USA). Recombinant rAAV2/1 (AAV2 backbone packaged with AAV1 capsid) was produced by BBS/CaCl2 or PEI mediated co-transfection of 293T cells with the AAV2 ITR flanked transfer vector, pXR1 (AAV type-1) and pXX6-80 (Ad5 genome) (Rabinowitz et al., 2002
). Cells were harvested and lysed, treated with benzonase (Sigma-Aldrich D9542, St. Louis, MO, USA), and virus was concentrated and purified by iodixanol gradient centrifugation (Zolotukhin et al., 1999
). Lentivirus was produced by HBS/CaCl2 mediated co-transfection of 293T cells with the LV transfer vector and plasmids pMDL, pRev, and pVSVG (Naldini et al., 1996b
). Media was collected and virus concentrated through multiple centrifugation steps (Tiscornia et al., 2006
).
Virus Titration
Viral genomes were quantified using SYBR Green with a qPCR cycler (ABI 7900HT, Applied Biosystems, Foster City, CA, USA). AAV genomic DNA was isolated by lysing AAV in 2 M NaOH for 30 min at 56°C, and neutralizing with HCl. LV was incubated with DNase I (NEB, Ipswich, MA, USA), and RNA isolated (QIAamp MinElute Virus Spin kit, Qiagen, Valencia, CA, USA), followed by reverse transcription (Superscript III kit, Invitrogen, Carlsbad, CA, USA). Viral DNA was diluted and compared to a standard curve created from a known quantity of transfer vector. Infectious titers were determined by infecting confluent 293T cells with serial dilutions of virus, followed 60 h later by two PBS washes, trypsinization, centrifugation to isolate cells, DNA isolation by proteinase K digestion in SNET lysis buffer (20 mM Tris (pH 8), 1 mM EDTA, 1% SDS, 0.4 M NaCl) at 55°C for 12 h, followed by alcohol precipitation. Concentration of the precipitated DNA, composed of cellular and viral DNA, was determined by spectrophotometry. qPCR was performed in the same manner as used to determine the genomic titer. The titer was normalized by the concentration of precipitated DNA loaded into the PCR reaction.
Stereotaxic Virus Injections
Adult wild-type ICR mice, wild-type C57BL/6J mice, GAD67-GFP (Δneo) knock-in mice (Tamamaki et al., 2003
), adult wild-type Sprague-Dawley rats, and a ∼4-year old adult monkey (Macaca mulatta) were injected with viruses following procedures approved by the Salk Institute Animal Care and Use Committee guidelines. Animals were anesthetized using a cocktail of ketamine and xylazine, and/or isoflurane. Virus was delivered via a glass micropipette (∼30–50 μm tip diameter) using air pressure applied via a Picospritzer II (General Valve Corporation, Fairfield, NJ, USA). Stereotaxic injections to mouse somatosensory cortex: 3.0 mm lateral, −0.5 mm to −1.0 mm bregma, at depths of 0.75 and 0.45 mm; DG: 1.25 mm lateral, −2.0 mm bregma, at depths of 1.75, 1.45 and 1.10 mm; thalamus: 1.25 mm lateral, −2.0 mm bregma, at depths 2.25 and 2.0 mm. Stereotaxic injection to rat somatosensory cortex: 5.0 mm lateral, −2.3 mm bregma, at depths of 2.0, 1.3 and 0.6 mm. Stereotaxic injections to monkey precentral gyrus (motor cortex) and postcentral gyrus (somatosensory cortex) at depths of 1.2, 0.8 and 0.4 mm. Five-minute injections at each depth usually corresponded to 1–2 μl of virus, delivered at 20 psi, with 1 pulse per second. The pulse duration was adjusted to modulate the flow rate.
Histology and Immunohistochemistry
25–40 μm thick sections cut on a freezing microtome were stained with one or more of the following antibodies: Chicken anti-GFP (Aves Labs GFP-1020 1:500, Tigard, OR, USA), Rabbit (Rb) anti-DsRed (Clontech 632496 1:200, Mountain View, CA, USA), Mouse (Ms) anti-NeuN (Millipore MAB377 1:100, Billerica, MA, USA), Rb anti-PV28 (Swant), Ms anti-PV (Sigma P3088), Rb anti-PV28 (Swant 1:1000), Ms anti-PV (Sigma P3088 1:1000), Rb anti-CR (Swant 1:1000), Rb anti-VIP (ImmunoStar 20077 1:500), Rb anti-NPY(Chemicon AB1915 1:500), Rat anti-Somatostatin (Chemicon MAB354 1:200), and Ms anti-CAMKii (Chemicon MAB869 1:500). As secondary antibodies we used one or more of Cy2 (Jackson Immuno 1:100, West Grove, PA, USA), AlexaFluor 568 (Invitrogen A11036 1:100, Carlsbad, CA, USA), RhodX (Jackson Immuno 1:100), and Cy5 (Jackson Immuno 1:100) fluorophores raised against the appropriate species. Mounted sections were counterstained with 10 μM DAPI (Sigma-Aldrich D9542, St. Louis, MO, USA) in PBS. Sections were dehydrated through xylenes and coverslipped using Krystalon (EMD Chemicals, Gibbstown, NJ, USA).
Imaging and Cell-Counting
Quantitative data described in the results are based on observations of label from at least 2, but typically 5 sections, from 3 or more animals (except for AAV-fPV and results from monkey which are from a single animal). Except for the AAV-fSST-RFP in GAD67-GFP analysis, cells in all cortical layers in each section were combined, as the inhibitory neuron subtype variability across layers was presumed to be less than the variability between sections. For each injection analyzed, tissue sections were scanned to identify the region with the highest density of labeling and this was considered the center of the injection site. Neurons expressing reporter from the injected vector were counted in this section and up to eight adjacent sections and scored for no overlap or double-label with markers identifying neuron subtypes. The total numbers of labeled cells counted and scored varied between sections and layers due to differences in labeling density for different vectors and cell-type antibodies. Typically, ∼10 double-labeled cells were counted per section [range: 0–163 (AAV-fNPY tissue stained with anti-PV antibody)] for cell-type specific antibody labeling, and a total of more than 170 cells for each vector. For AAV-fSST-RFP in GAD67-GFP mice, 8 sections with 17–38 cells per section were counted.
To count and score labeled cells, fluorophores were imaged independently at three confocal planes at 10× or 20× magnification using either a Nikon TE300 with a Bio-Rad radiance 2100 system or an Olympus BX51 with a Bio-Rad Radiance 2100MP system. Images were projected and merged in RGB space. Quantification of overlap of cell labeling was done using the confocal images in Adobe Photoshop. Cortical layers were determined by DAPI staining.
To target specific neuron cell-types in mammals, we tested regulatory sequences derived from multiple sources: (i) promoter sequences derived from putative orthologous fugu genes, (ii) mammalian promoter segments from genes putatively co-expressed in known inhibitory neuron subtypes, and (iii) assembled composite regulatory elements (CREs) containing TFBSs.
We used both AAV and LV as delivery vectors. Most of the viruses were tested for specificity in mouse somatosensory cortex. Some of the viruses were also tested in mouse dentate gyrus or thalamus, or in the cortex of rat or monkey. Cell-type specificity was determined by cellular morphology and co-localization with inhibitory neuron subtype specific antibodies parvalbumin (PV), calretinin (CR), somatostatin (SST), neuropeptide Y (NPY) and/or vasoactive intestinal polypeptide (VIP).
Fugu Promoters
Fugu promoters in AAV drove expression in mouse cortex
Fugu 5′ intergenic DNA sequences up to 2.8 kb, including 5′ UTRs, were cloned into green fluorescent protein (GFP) or red fluorescent protein DsRed-Express (RFP) reporter vectors (Figure 1
). All but one of the vectors tested aimed to target inhibitory neurons. The exception was the fugu α-calcium/calmodulin-dependent protein kinase II (AAV-fCAMK) vector targeting excitatory neurons. All fugu promoters tested drove expression in mouse somatosensory cortex (Figures 2 and 3
, Table 1
), but the expression strength varied between vectors. AAV expression of fugu somatostatin (AAV-fSST) and fugu neuropeptide Y (AAV-fNPY) vectors were widespread in all cortical layers with transduction often observed more than 300 μm from the injection column (Figures 2
A,D). Calretinin (AAV-fCR), parvalbumin (AAV-fPV), secreted frizzed-related protein 2 (AAV-fSFRP2), titin-cap (AAV-fTCAP) and AAV-fCAMK vectors showed expression usually confined to less than 200 μm from the injection site (Figures 2
G,J and 3
A,D,G). Depending on the virus injection, most vectors showed more widespread expression in layers 2/3 and 5 (∼500 μm laterally). Many neuron types in layers 2/3 and 5 send projections to the brain surface, and thus cells far from the injection site are capable of taking up virus which often spreads laterally beneath the pia following pressure injections.
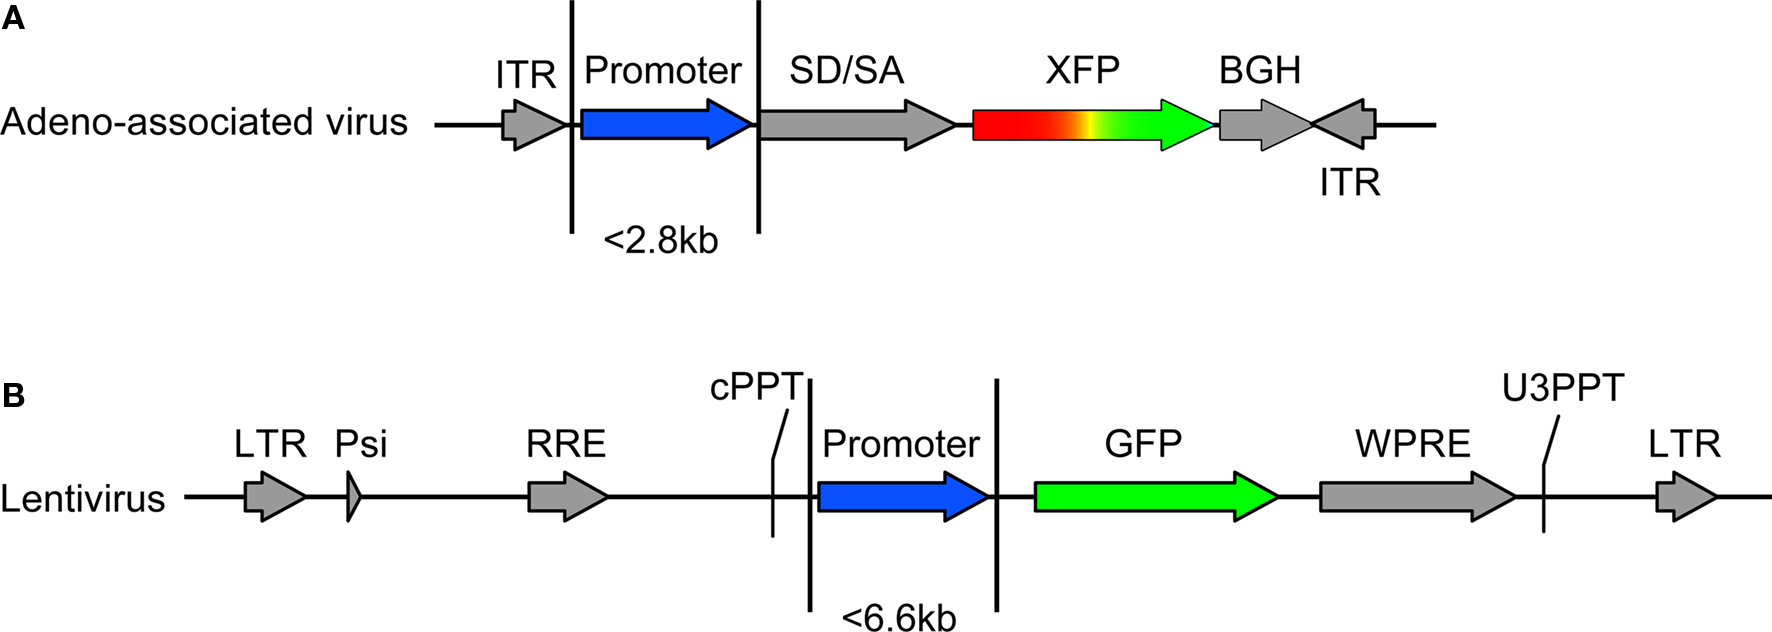
Figure 1. Vector design. Transfer vectors for adeno-associated virus (AAV) and lentivirus (LV) were constructed as in (A) and (B), respectively. The capacity of AAV and LV allowed promoter sequences of approximately 2.8 and 6.6 kb, respectively. AAV contained either the green fluorescent protein (GFP) or red fluorescent protein DsRed-Express (RFP). Lentivirus contained GFP. Components of AAV include: ITR – AAV2 inverted terminal repeat, SD/SA – splice donor splice acceptor intronic element (human beta globin), XFP –either GFP or RFP, BGH – poly(A). Components of LV include: LTR – long terminal repeat, Psi – element for viral genome packaging, RRE – Rev response element, cPPT – central polypurine tract, WPRE – woodchuck hepatitis virus posttranscriptional regulatory element, U3PPT – upstream border of the 3′ long terminal repeat polypurine tract. Viruses were made as described in Tables 1
–3
.

Figure 2. Fugu promoters in AAV expressed in mouse cortex. Fugu promoters in AAV injected in mouse somatosensory cortex expressed GFP. Wide-angle images in the left column (A,D,G,J) show multilayer viral expression patterns. Close-up images centered on layer 5 and layer 2/3 are shown in the middle column (B,E,H,K) and right column (C,F,I,L), respectively. Expression of fugu promoters in AAV are shown in rows: somatostatin [AAV-fSST,(A–C)], neuropeptide Y [AAV-fNPY, (D–F)], parvalbumin [AAV-fPV, (G–I)], and calretinin [AAV-fCR, (J–L)]. Upward arrows mark glia and downward arrows mark excitatory pyramidal neurons. Dorsal (D) and lateral (L) directions for all images are as indicated in (L). Scale bars are 50 μm.
Examination of the morphologies of cells labeled with AAV-fSST, AAV-fNPY, AAV-fPV and AAV-fCAMK indicated expression was almost entirely restricted to neurons, with no visible glial cell expression (Figures 2
A–I and 3
G–I). AAV-fCR, AAV-fSFRP2 and AAV-fTCAP expression was also mostly neuronal, but the presence of small, compact transgene labeled cells with bushy processes indicated that promoters were also active in glia (Figures 2
J–L and 3
A–F, glia marked with upward arrows). Pyramidal shaped cell bodies and apical dendrites are characteristic traits of cortical pyramidal neurons (excitatory neurons). Due to the preservation of apical dendrites, pyramidal neuron identification was best in brain sections cut closest to the coronal plane, parallel to the apical dendrites. Non-ideal cuts do not show continuous apical dendrite label. As predicted, AAV-fCAMK showed many pyramidal cell bodies and apical dendrites (Figures 3
G–I, pyramidal neurons marked with downward arrows). However, injections of AAV-fPV and AAV-fTCAP also labeled excitatory neurons (Figures 2
G–I and 3
D–F). The labeled pyramidal cells were typically located in layer 5. In contrast, AAV-fSST, AAV-fNPY, AAV-fCR and AAV-fSFRP2 did not show many cells morphologically identifiable as excitatory (Figures 2
A–F,J–L and 3
A–C). All promoters, including fCAMK (Figures 3
G–I), showed scattered non-pyramidal cells in all cortical layers consistent with expression in inhibitory neurons.
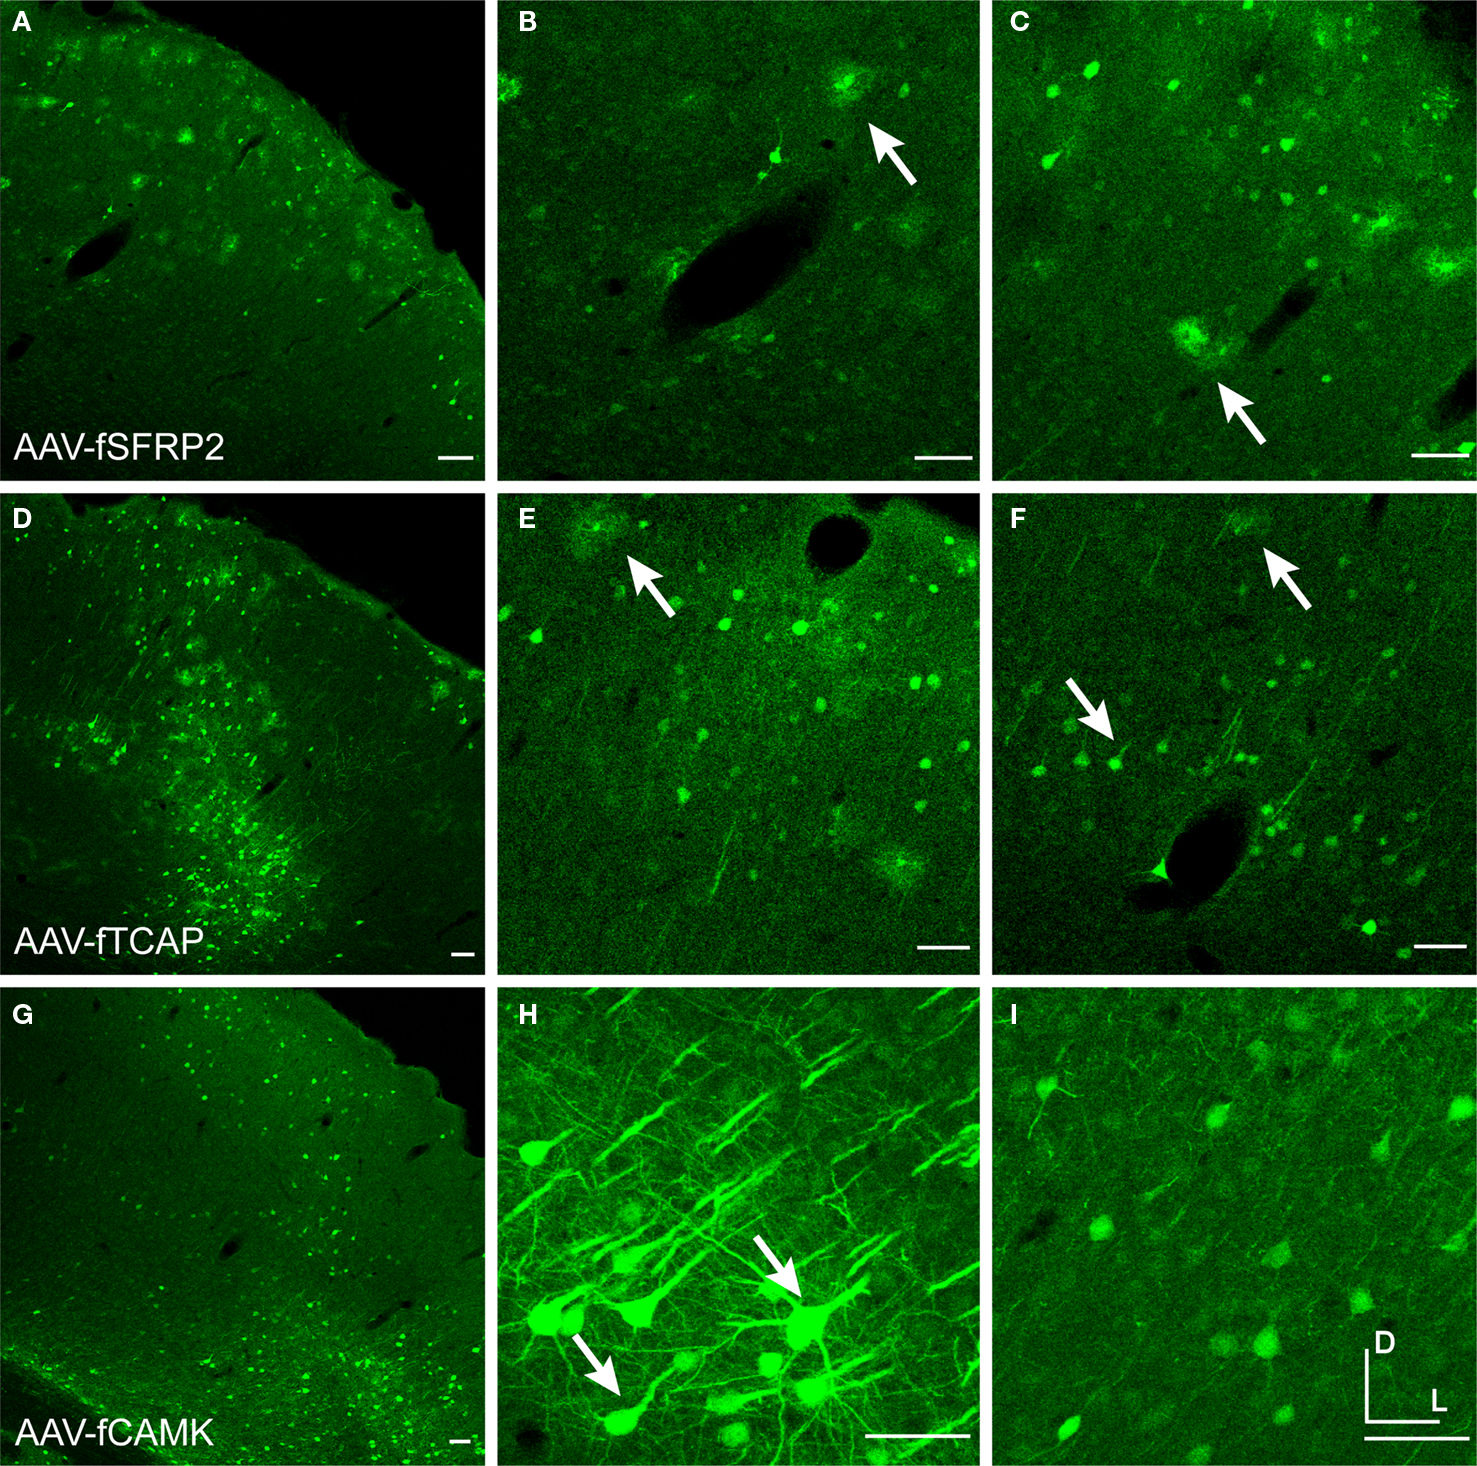
Figure 3. Fugu promoters in AAV expressed in mouse cortex. Fugu promoters in AAV injected in mouse somatosensory cortex expressed GFP. Wide-angle images in the left column (A,D,G) show multilayer viral expression patterns. Close-up images centered on layer 5 and layer 2/3 are shown in the middle column (B,E,H) and right column (C,F,I), respectively. Expression of fugu promoters in AAV are shown in rows: secreted frizzled-related protein 2 [AAV-fSFRP2, (A–C)], titin-cap [AAV-fTCAP, (D–F)] and α-calcium/calmodulin-dependent protein kinase II [AAV-fCAMK, (G–I)]. Upward arrows mark glia and downward arrows mark excitatory pyramidal neurons. Dorsal (D) and lateral (L) directions for all images are as indicated in (I). Scale bars are 50 μm.
Taken together these results indicate that only AAV-fSST and AAV-fNPY restrict expression to mouse inhibitory interneurons. The degree to which promoter specificities and viral tropism contribute to selective inhibitory neuron expression will be considered in the context of further results presented below.
Fugu promoters in AAV drove expression in rat and monkey cortex
Injections of AAV-fSST, AAV-fNPY and AAV-fCAMK into rat and monkey somatosensory cortex showed robust transgene expression that was almost entirely restricted to neurons (Figure 4
). As in the mouse cortex, morphology of AAV-fSST expressing cells suggested that nearly all of the labeled cells were inhibitory neurons (Figures 4
A–C). In contrast, the morphology of AAV-fNPY and AAV-fCAMK expressing cells in rat and monkey cortex indicated expression in both pyramidal and inhibitory cells (Figures 4
D–I). As predicted, AAV-fCAMK labeled many pyramidal neurons. In comparison, AAV-fNPY drove expression in only a few pyramidal neurons. Staining AAV-fCAMK sections with CAMK antibody confirmed some of the AAV-fCAMK labeled cells were excitatory. However, staining of each of these viruses with inhibitory neuron antibody markers NPY, CR and SST confirmed that at least some of the labeled cells from each virus, including AAV-fCAMK, were inhibitory. Therefore, while AAV-fCAMK drove expression in large numbers of excitatory neurons, this vector does not restrict expression to excitatory neurons, and may not be as selective as the mouse CAMK promoter version previously characterized in a lentiviral expression vector (Dittgen et al., 2004
; Nathanson et al., 2009
). Together with the mouse results, we observed that in rodents, of all the fugu promoters tested, only AAV-fSST restricted expression to inhibitory neurons.
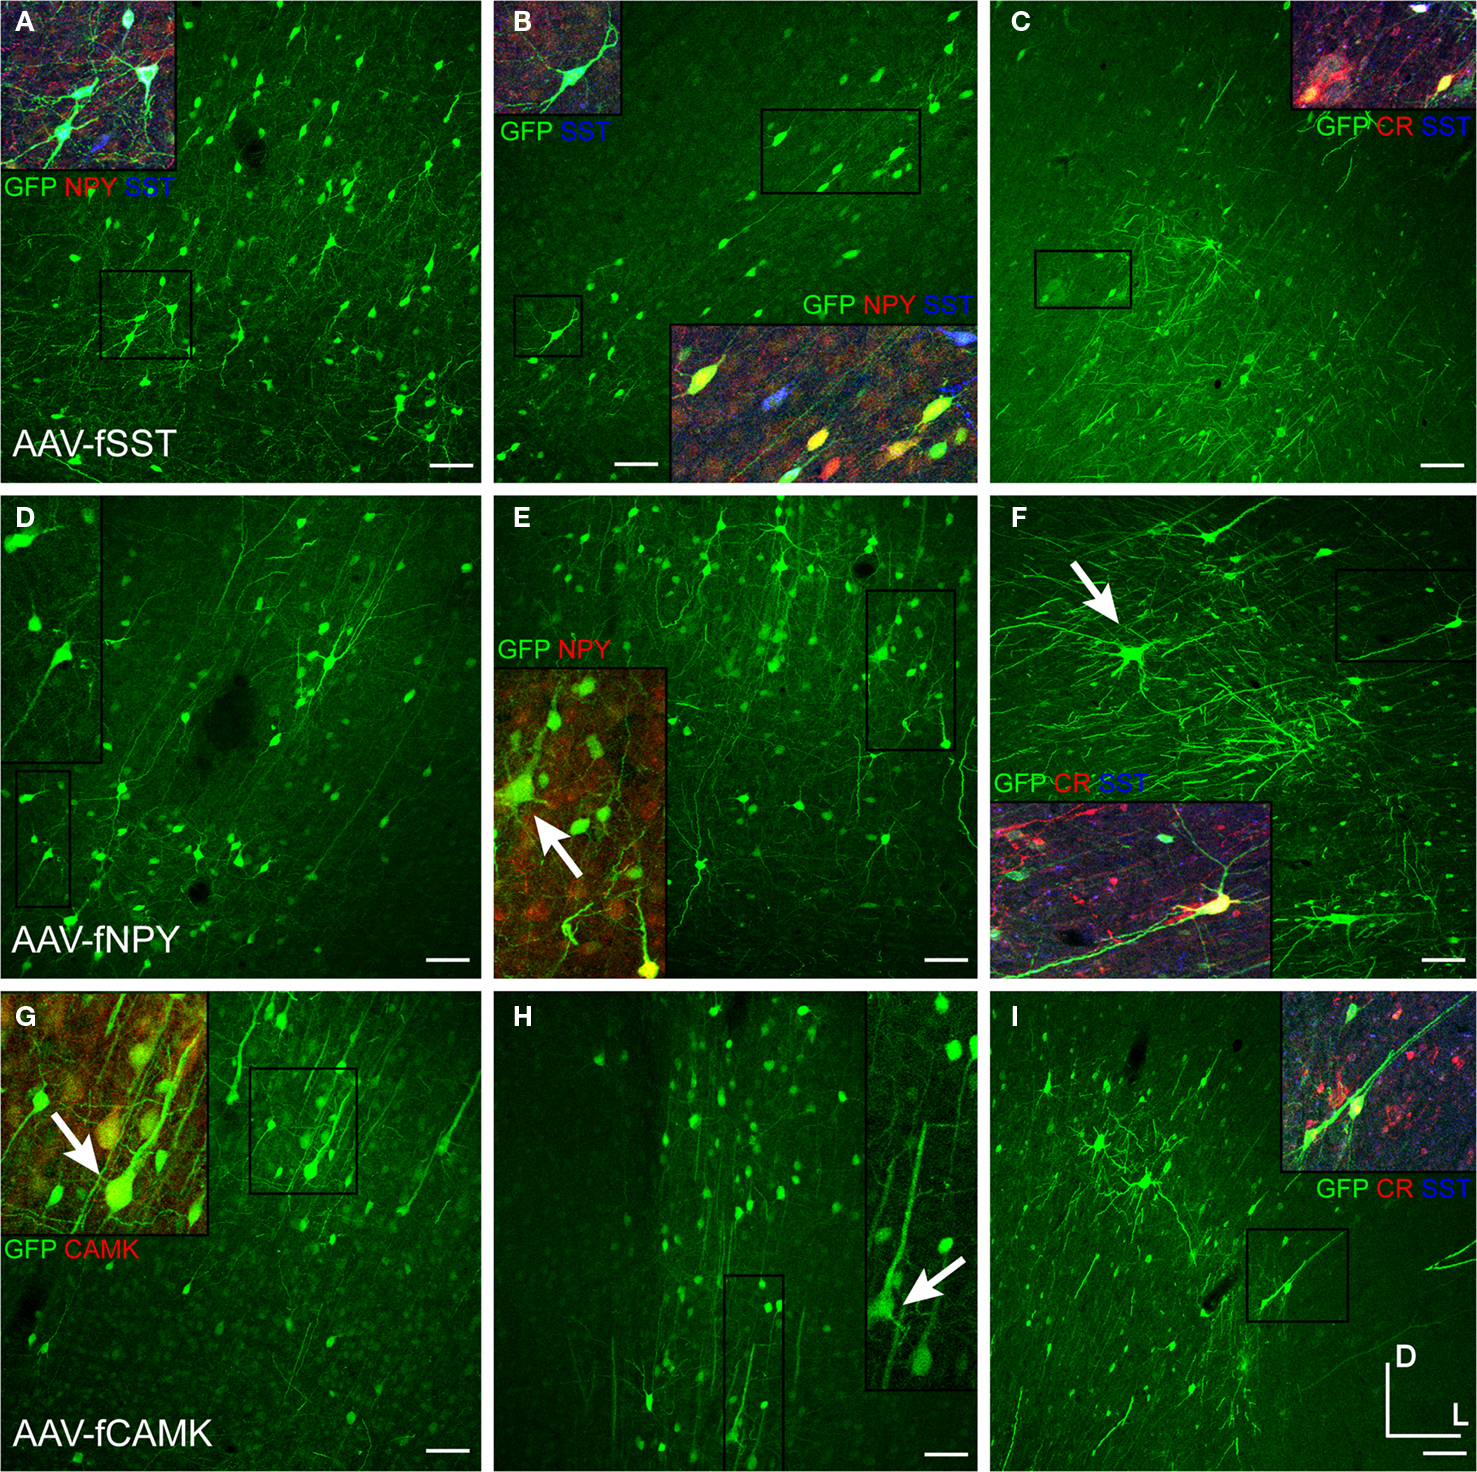
Figure 4. AAV-fSST, AAV-fNPY and AAV-fCAMK expressed in rat and monkey cortex. Viruses expressing GFP were injected in rat somatosensory cortex (A,B,D,E,G,H) and monkey (C,F,I) motor or somatosensory cortex. Molecular identities of some GFP labeled cells of AAV-fSST (A–C) [(C) – motor cortex], AAV-fNPY (D–F) [(F) – motor cortex] and AAV-fCAMK (G–I) [(I) – somatosensory cortex] were determined by co-labeling with NPY, CR, SST and CAMK antibodies. Antibodies are indicated in their representative color. Overlap of green and red is yellow; green and blue is purple; green, red and blue is white. Examples of cells consistent with pyramidal morphology are marked with arrows. Boxed inserts are at 2× magnification. Dorsal (D) and lateral (L) directions for all images are as indicated in (I). Scale bars are 50 μm.
Fugu promoters in AAV drove expression in dentate gyrus (DG) and thalamus
We tested the fugu promoters in dentate gyrus of the hippocampus, which also contains diverse populations of neurons. The granule cell layer (GZ) of the DG is composed predominantly of excitatory granule cells, while inhibitory neurons are concentrated along the inner subgranular lining of the GZ (SGZ) (Patton and McNaughton, 1995
). In the PoDG, about half of the neurons are inhibitory and half of the neurons are excitatory mossy cells (Blasco-Ibanez and Freund, 1997
), yet some of the mossy cells in the PoDG express CR, but are not inhibitory (Blasco-Ibanez and Freund, 1997
). AAV-fSST almost exclusively labeled cells in the PoDG and SGZ (Figures 5
A,B). AAV-fNPY injections in the DG labeled cells in PoDG, SGZ and a few scattered cells in GZ (Figures 5
C,D). While not quantitative, immunostaining of AAV-fSST and AAV-fNPY sections with inhibitory markers PV, SST and NPY confirmed inhibitory labeled cells. Immunostaining, together with little or no expression in the GZ, suggested AAV-fSST and AAV-fNPY may have biased expression towards inhibitory neurons in mouse DG. In contrast and as predicted, AAV-fCAMK drove strong expression both in cells in PoDG and in granule cells (Figures 5
E,F).
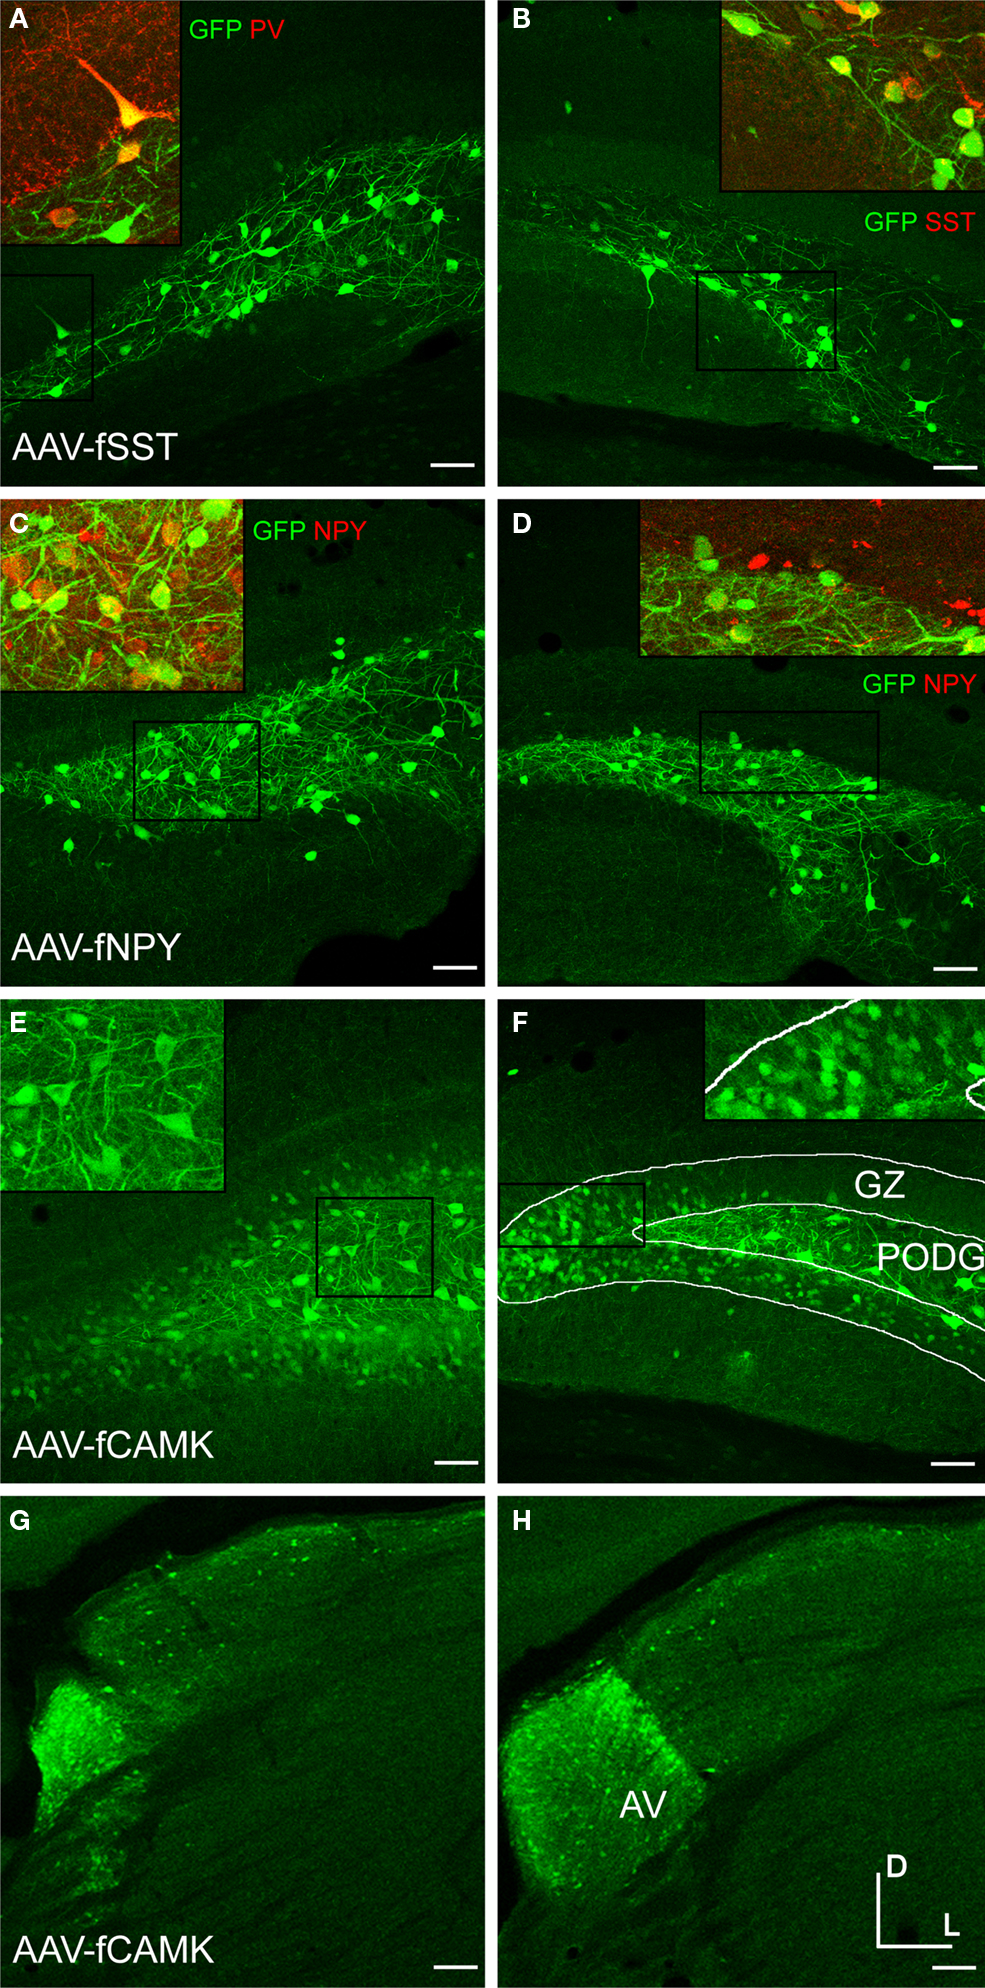
Figure 5. Fugu promoters in AAV expressed in mouse dentate gyrus (DG) and thalamus. Fugu promoters in AAV drove GFP expression in subcortical areas of the DG and thalamus. Virus expression is shown in green [AAV-fSST – (A,B); AAV-fNPY – (C,D); AAV-fCAMK – (E–H)]. Subcortical anatomical regions – granule cell layer (GZ) and polymorphic layer (PoDG) shown in (A–F), are described in (F). The anteroventral nucleus of the thalamus (AV) shown in (G) and (H), is described in (H). Cell-type markers PV, SST and NPY are shown in red. Green and red overlap is yellow. Boxed inserts are at 2× magnification. Dorsal (D) and lateral (L) directions for all images are as indicated in (H). Scale bars are 50 μm.
Deeper injections into mouse thalamus with the AAV-fCAMK vector revealed semi-restrictive expression to the anteroventral nucleus of the thalamus (Figures 5
G,H). Contrary to the activity of AAV-fCAMK, in situ hybridization images from the Allen Mouse Brain Atlas (Lein et al., 2007
) indicate that CAMK expression is weak in the anteroventral nucleus and strong in other areas of thalamus.
Since CAMK has also been reported to be specifically expressed in the koniocellular layer of primate LGN (Calkins et al., 2005
), we also injected this vector in monkey LGN. LGN injections, however showed that AAV-fCAMK did not restrict expression to the koniocellular neurons (data not shown). This evidence indicated that this vector did not recapitulate the natural expression patterns of CAMK in the mouse or monkey thalamus.
AAV-fSST expression strongly favored cortical inhibitory neurons
Since AAV-fSST showed the highest level of inhibitory neuron specific expression, we sought to quantify the degree of selectivity of this vector. To this end a new viral vector, AAV-fSST-RFP driving RFP rather than GFP, was constructed and injected into the somatosensory cortex of the knock-in mouse line GAD67-GFP (Δneo), in which GFP was inserted into the glutamate decarboxylase (GAD67) locus (Tamamaki et al., 2003
) (Figure 6
). In these mice, almost all of the GFP-positive cells showed GAD67 immunoreactivity in the perikarya or neuropil (Tamamaki et al., 2003
) Use of these animals facilitated identification of GABAergic neurons without confounds related to GAD or GABA staining reliability.
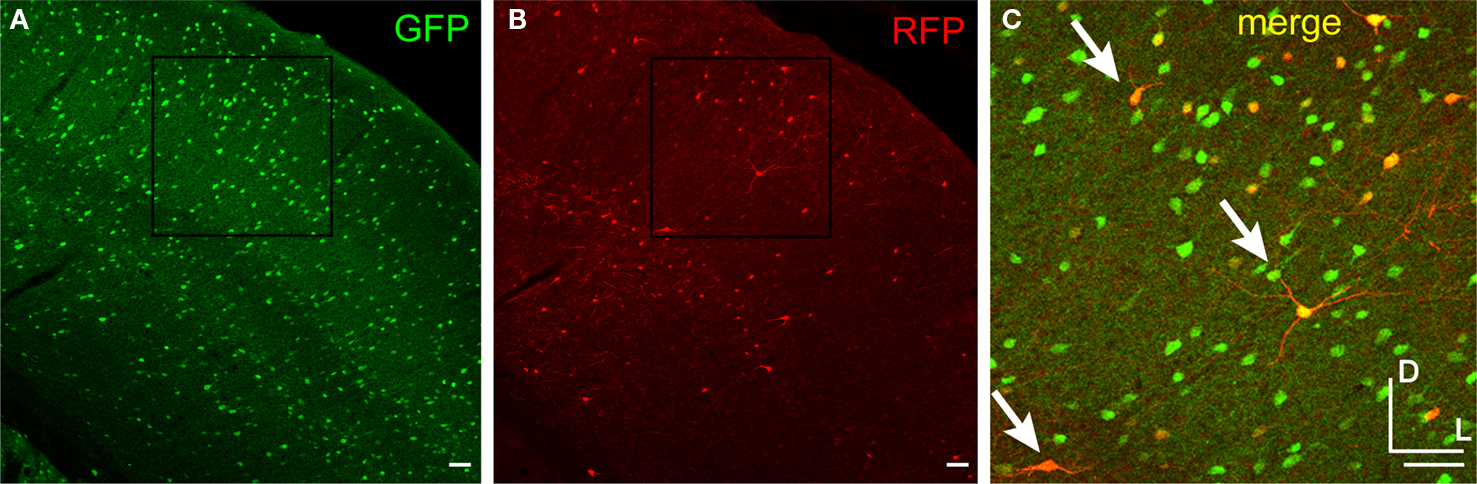
Figure 6. AAV-fSST predominately labeled inhibitory neurons in mouse cortex. Mouse cortex with inhibitory neurons expressing GFP under the control of the GAD67 promoter (A) was injected with AAV-fSST expressing RFP (B). Panel (C) is the overlap of the boxed region in (A) and (B). Green and red overlap is yellow. Examples of cells with green and red overlapping label are indicated by arrows. Dorsal (D) and lateral (L) directions for all images are as indicated in (C). Scale bars are 50 μm.
Cortical sections from GAD67-GFP mice injected with AAV-fSST-RFP were scored for both GFP and RFP expression. Cells expressing both GFP and RFP were considered inhibitory (Figure 6
C). We observed that 93% ± 7%, 95% ± 11%, 80% ± 13% and 89% ± 11% (mean ± standard deviation) of the cells in layers 2/3, 4, 5 and 6 were inhibitory, respectively. To interpret the significance of these percentages, we needed to account for the tropism of AAV and the expected chance rate of inhibitory neuron expression. Our previous work (Nathanson et al., 2009
) showed that with high titer rAAV2/1, reporter expression in excitatory and inhibitory neurons is proportional to their respective population percentages, but that low titer virus reveals a bias towards inhibitory neurons. To estimate the expected proportion of excitatory/inhibitory neurons transduced by AAV virus of this titer (9.1 × 10⁹ infectious particles/ml) we applied a linear fit to transduction ratios from AAV-hSyn-RFP (data from Nathanson et al., 2009
). The expected neurons transduced by the neuronally ubiquitous human synapsin promoter (AAV-hSyn-RFP), are ∼68%, 77%, 50% and 65% inhibitory in layers 2/3, 4, 5 and 6 respectively. These rates reflect a strong but not exclusive bias toward inhibitory neurons, which would have comprised only about 10–20% of the population by chance (Nathanson et al., 2009
). On average, the fSST promoter in AAV preferentially drove expression in ∼40% more inhibitory neurons than would be expected from a promoter producing no bias; the proportion of inhibitory neurons expressing RFP were significantly higher with fSST in AAV than with the hSyn promoter in the same virus and at matched titer (p values of 0.0003, 0.0223, 0.0060, 0.0595 for layers 2/3, 4, 5 and 6 for a one sample t-test to the estimated ratios).
Fugu promoters failed to generate inhibitory neuron subtype specific expression
The expression of fugu promoters in AAV in inhibitory neuron subtypes was quantified in mouse cortex by identifying cells expressing GFP from viral vector that were co-labeled with antibodies for CR, PV, SST, VIP and NPY. Cell-type specific antibody-labeled cells were counted in regions defined by the virus spread. Figure 7
shows an example of cell-type antibody and GFP label in mouse cortex injected with AAV-fSST (GFP).
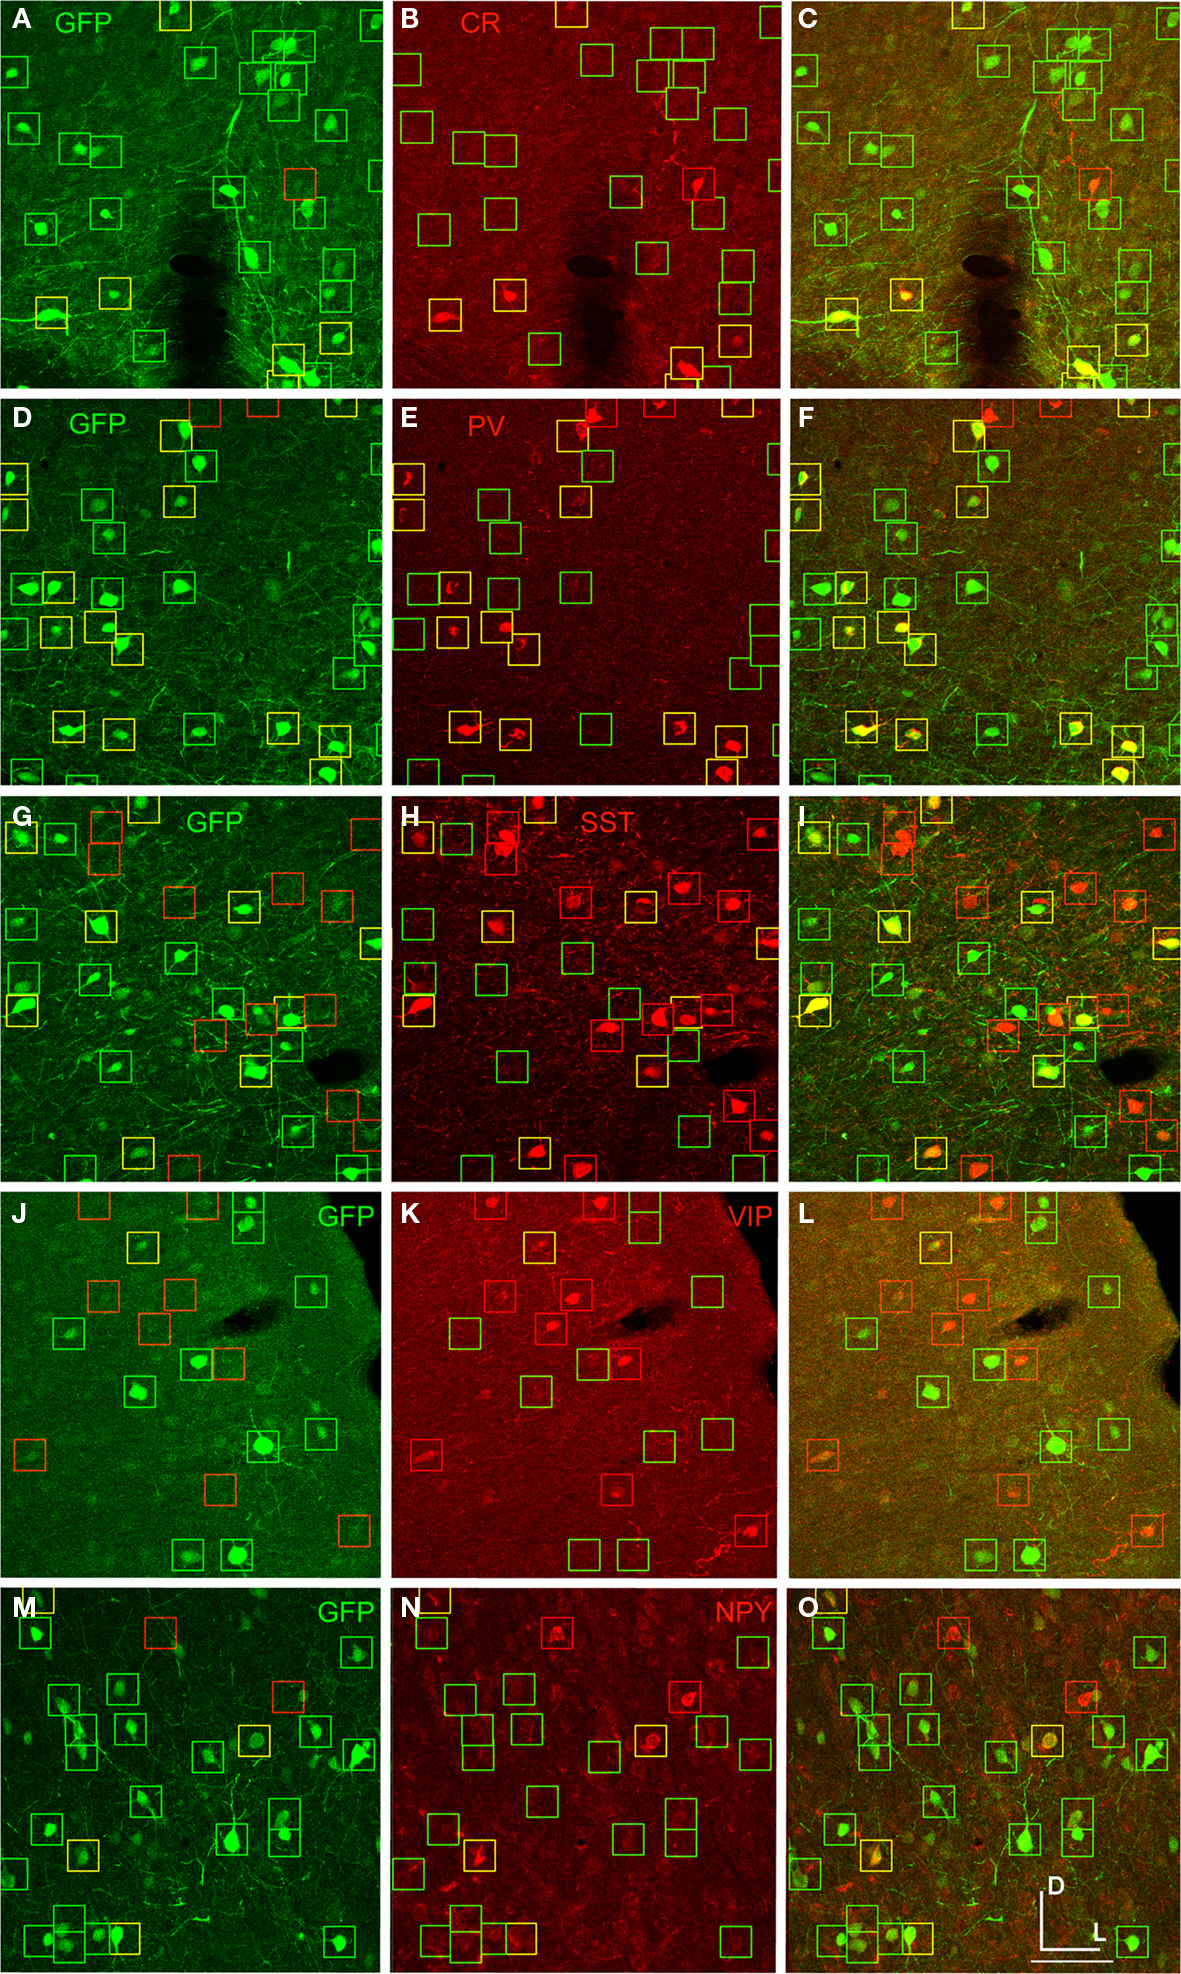
Figure 7. AAV-fSST expression co-labeled with CR, PV, SST, VIP and NPY antibodies. AAV-fSST-GFP expression in mouse somatosensory cortex is shown in the left column (A,D,G,J,M). Cell-type specific antibody labeling in the corresponding sections are shown in the middle column (B,E,H,K,N). Overlaps of the left and middle columns are shown in the right column – (C,F,I,L,O) – calretinin [CR – (B,C)], parvalbumin [PV – (E,F)], somatostatin [SST – (H,J)], vasoactive intestinal polypeptide [VIP – (K,L)] and neuropeptide Y [NPY – (N,O)]. Cells that have GFP label only are marked with green boxes. Cells that have cell-type specific antibody label only are marked with red boxes. Cells that are co-labeled are marked with yellow boxes. Dorsal (D) and lateral (L) directions for all images are as indicated in (O). The scale bar for all images, shown in (O), is 50 μm.
Virus expression in each cell-type was quantified by dividing the number of double labeled cells (GFP and cell-type antibody label) by the total number of cell-type antibody labeled cells in the virus labeled regions. First, to identify a baseline level of transduction of AAV in inhibitory neuron subtypes, expression from the human synapsin (hSYN) promoter was quantified. Even with the high titer AAV-hSYN virus (4.9 × 10¹⁰ infectious particles/ml) (Nathanson et al., 2009
), not every inhibitory neuron expressed the transgene, presumably because many neurons were not infected. In the injected region of mouse somatosensory cortex, AAV-hSYN labeled 72%, 79%, 70%, 55% and 97% of CR, PV, SST, VIP and NPY cells, respectively (Figure 8
). While the numbers of cells were small, these numbers suggest that some inhibitory cell-types were transduced more efficiently than others. For example, almost all of the NPY+ cells, but only about half of the VIP+ cells were labeled.
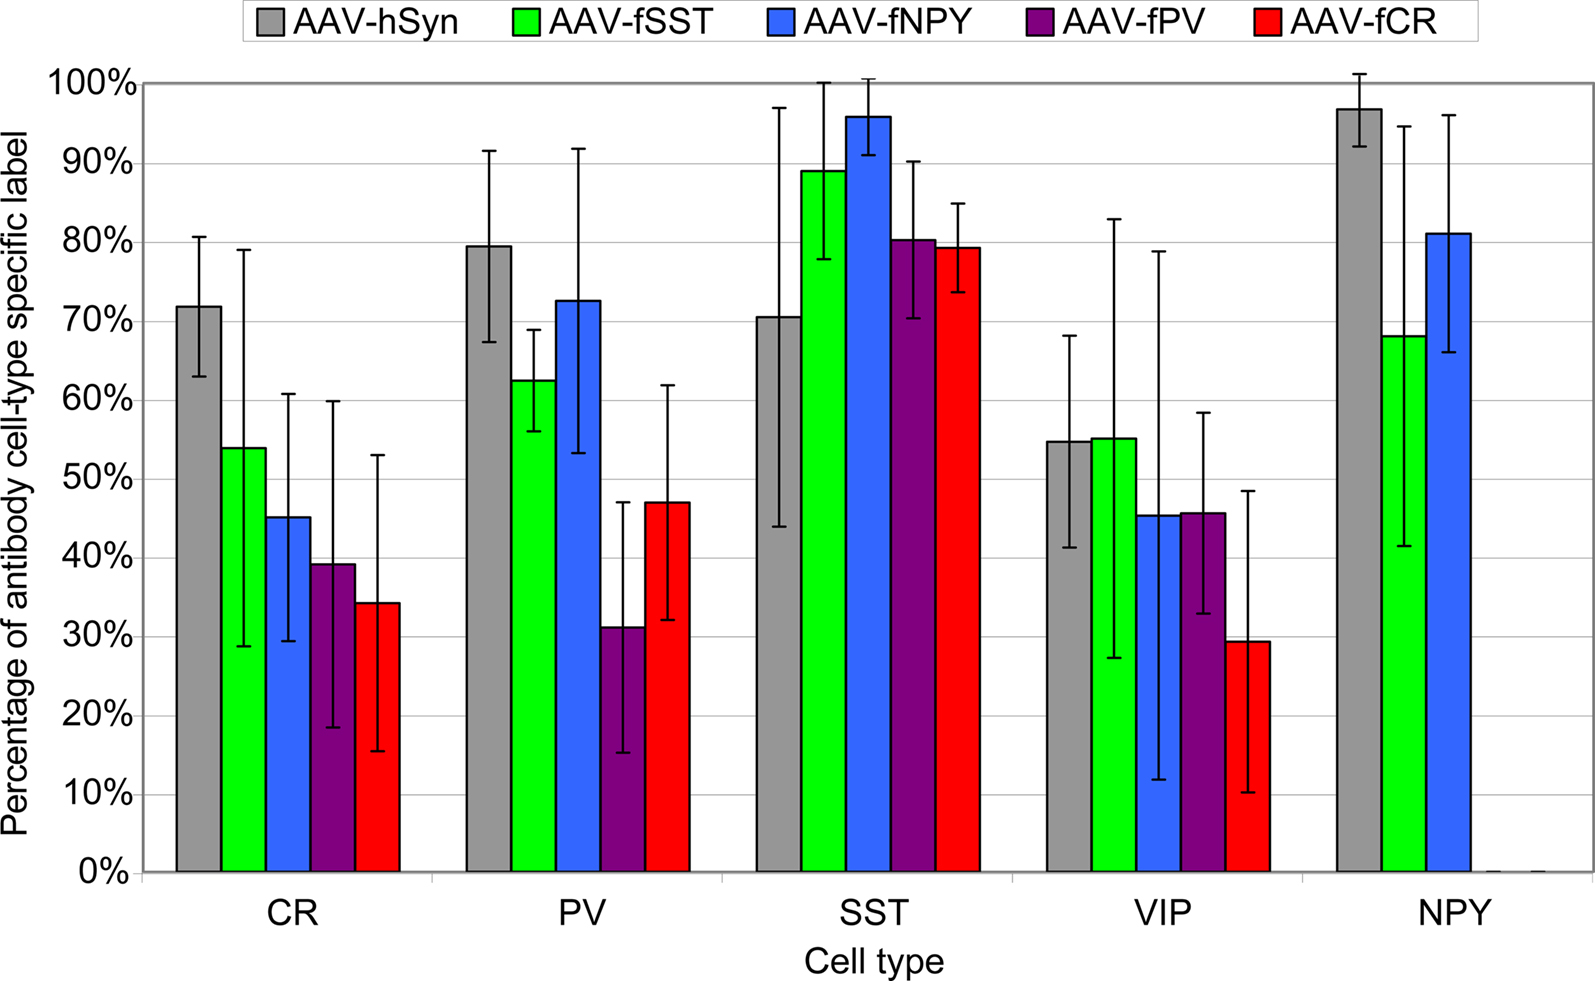
Figure 8. Percentage of virus label in inhibitory neuron subtypes. Viruses expressing GFP were injected into mouse somatosensory cortex and stained for inhibitory neuron markers calretinin (CR), parvalbumin (PV), somatostatin (SST), vasoactive intestinal polypeptide (VIP) and neuropeptide Y (NPY). Percentages were calculated by dividing the number of co-labeled cells (GFP and cell-type specific antibody) by the total number of antibody labeled cells in the injected region. The percentages reflect the combined labeling in cortical layers 2/3–6 and the standard deviations show the labeling distributions treating each section as an independent observation. Sections were counted from a single animal for AAV-fPV, and from three animals for all others. NPY label was not counted for AAV-fPV and AAV-fCR. At least 170 cells were counted for each vector/antibody combination (see Materials and Methods).
We observed that AAV-fSST, AAV-fNPY, AAV-fPV and AAV-fCR expressed in all identified inhibitory cell-types, demonstrating that none of the promoters restricted expression to a particular inhibitory neuron subtype (Figure 8
). AAV-fSST and AAV-fNPY promoters did not show significant differences in inhibitory neuron subtype expression compared to the expression of high titer AAV-hSYN. Interestingly however, AAV-fPV and AAV-fCR showed a significant reduction in PV+ and CR+ cells, respectively (t-test – p = 0.001 and p = 0.003), the very types of cells that their promoters were aimed to target.
Fugu promoters in lentivirus drove expression in excitatory neurons
In comparison to AAV, a GFP expressing lentivirus (LV) vector can accommodate longer promoter sequences up to ∼6.6 kb. Larger regions of the fugu PV, CR, SST and NPY promoter sequences, encompassing up to the entire 5′ intergenic region were cloned into lentivirus driving GFP (Figure 1
). We previously found that following cortical injections, LV labeled large numbers of excitatory neurons and glia, but it did not label large numbers of inhibitory neurons (Nathanson et al., 2009
). These results suggested that LV would provide a skewed, but more sensitive assay than AAV to assess the ability of promoters to express in excitatory neurons.
Injection into mouse somatosensory cortex revealed that all fugu promoters in LV drove gene expression (Figure 8
, Table 1
). LV-fPV and LV-fSST expression signals were the strongest and LV-fNPY and LV-fCR were the weakest (Figure 9
). All of these promoters in LV appeared to restrict expression to neurons versus glial cells. Morphological observations indicated that all fugu promoters in LV drove expression in a higher proportion of excitatory cells than they did in AAV. In LV-fPV, the labeled cells were densely packed, consistent with large numbers of dense pyramidal neurons (Figures 9
A,B). Cell label density was more scattered for LV-fSST, but cell density was still higher than would be expected if all the cells were inhibitory. Consistent with the greater cell density of excitatory neurons, we also observed a few cells with pyramidal neuron morphology (Figures 9
C,D). Expression of LV-fNPY and LV-fCR vectors was restricted to only a handful of cells (Figures 9
E,F). In contrast to AAV-fCR, LV-fCR did not label any glia. Co-label with inhibitory markers PV, CR, SST, and VIP indicated that at least a few cells labeled by each virus were inhibitory (data not shown). Promoter activity in LV was largely in agreement with the promoter activity in AAV, but LV expression shifted toward excitatory expression consistent with the expected differences due to viral tropism (Nathanson et al., 2009
).
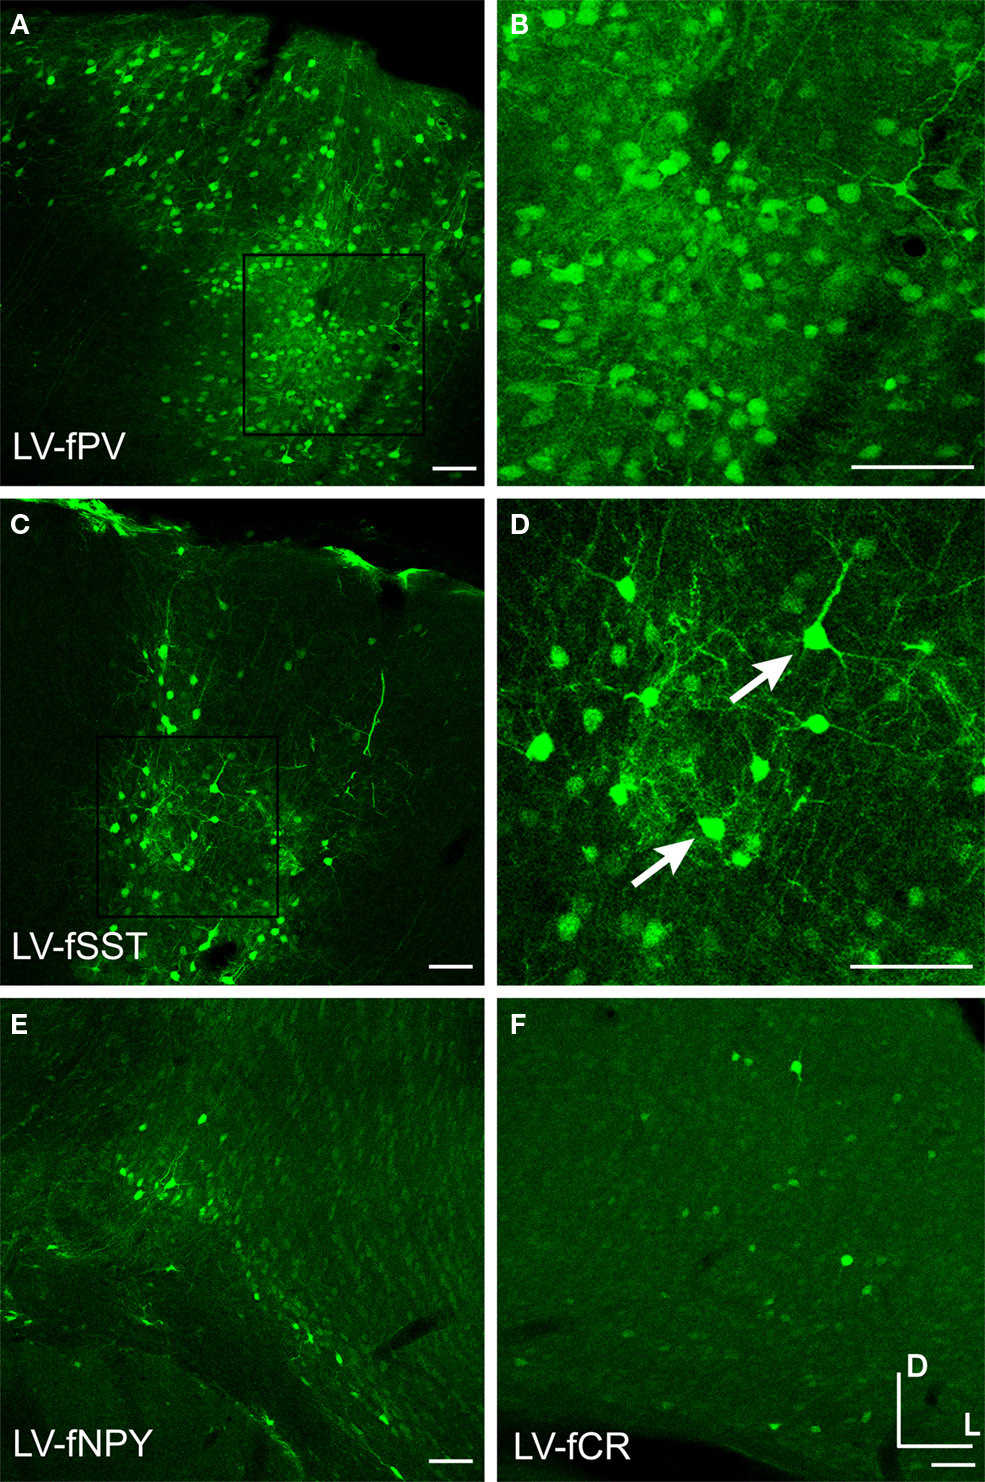
Figure 9. Fugu promoters in LV drove expression in large numbers of excitatory neurons. Fugu promoters in LV expressing GFP were injected into mouse somatosensory cortex – LV-fPV (A,B), LV-fSST (C,D), LV-fNPY (E), LV-fCR (F). Panels (B) and (D) are magnified versions of the boxed regions of (A) and (C), respectively. Arrows mark excitatory pyramidal neurons. Dorsal (D) and lateral (L) directions for all images are as indicated in (F). Scale bars are 50 μm.
Mammalian Promoters
Promoter sequences were isolated from mouse and human DNA sequences for genes associated with known cell-types (Table 2
). Prefixes denote mouse (m) and human (h) derived promoter sequences. The promoters of mouse glutamate decarboxylase 2 targeting all inhibitory neurons (LV-mGAD2) and mouse somatostatin (LV-mSST) were cloned into the LV vector. We also constructed GFP or RFP expressing AAV vectors with the promoters of platelet-derived growth factor receptor, alpha polypeptide (AAV-hPDGFRA) – targeting SST inhibitory neuron populations; and of A930038C07Rik (AAV-mA93) – based on characteristic inhibitory neuron expression patterns observed in the Allen Mouse Brain Atlas (Lein et al., 2007
) and targeting an unknown subpopulation of inhibitory neurons.
Next, we also used microarray data from somatosensory and cingulate cortices compiled by Sugino et al. (2006)
to identify genes co-expressed within one of the inhibitory neuron subtypes G42 (PV), GIN (SST) or G30 (VIP), and not expressed in excitatory neurons. A detailed description of the rationale for choosing these genes and promoter design are provided in Material and Methods. First we analyzed the microarray data for genes that showed more than 3-fold enrichment for a single inhibitory neuron cell-type (see Table S1 in Supplementary Material). Because microarray data is prone to false positives, these genes were then checked in the Allen Mouse Brain Atlas (Lein et al., 2007
) for a pattern of scattered expression, consistent with inhibitory neuron distribution. For each selected gene, upstream and 5′ UTR gene regions were analyzed for the presence of putative TFBSs that were conserved across multiple mammalian species. Conserved TFBSs enriched in a group of co-expressed genes were hypothesized to be determinant regulatory elements for a specific cell-type (see Tables S2–4 in Supplementary Material). In search of promoter sequences most likely to drive cell-type specific expression we chose the ones with the maximum number of cell-type specific regulatory elements and a minimum number of elements characteristic of the other inhibitory cell-types. Using this strategy, AAV vectors expressing RFP were designed with regulatory elements derived from the human genes, aimed at targeting each of the three non-overlapping interneuron cell-types: for SST cell-type – glutamate receptor, metabotropic 1 (AAV-hGRM1), c-type natriuretic peptide precursor (AAV-hNPPC); for PV cell-type – adrenomedullin (AAV-hADM), type 2 lactosamine alpha-2,3-sialyltransferase (AAV-hST3GAL6); for VIP cell-type – ras responsive element binding protein 1 (AAV-hRREB1), deiodinase, iodothyronine, type II (AAV-hDIO2), nuclear receptor subfamily 2, group F, member 2 (AAV-hNR2F2).
Injections of viruses into the cortex of mice or rats revealed that only some of the mammalian promoters drove transgene expression (Table 2
) and only AAV-mA93 showed some cell-type specificity. Morphologies of cells labeled by LV-mGAD2, LV-mSST and AAV-hPDGFRA indicated that these vectors expressed in some excitatory pyramidal neurons (Figures 10
A–C). LV-mSST also drove expression in some glia (Figure 10
B). AAV-hNPPC, AAV-hNR2F2 and AAV-hDIO2 failed to label any cells in mouse cortex. GAD67-GFP knock-in mice injected with viruses expressing RFP are shown in Figure 11
. RFP+ cells that co-labeled with GFP were inhibitory. The sections were also stained with parvalbumin (PV) antibody. AAV-hADM drove expression in only a few cells, all of which appeared to be glia (Figures 11
A–D). Expression of AAV-hGRM1 (Figures 11
E–H), AAV-hRREB1 (Figures 11
I–L) and AAV-hST3GAL6 (Figures 11
M–P) drove expression in both excitatory and inhibitory neurons. In contrast, AAV-mA93 (Figures 11
Q–T) did not appear to label any excitatory neurons, but strongly labeled inhibitory neurons and glia. AAV-hGRM1, AAV-hRREB1, AAV-hST3GAL6 and AAV-mA93 labeled inhibitory neurons that were PV+ and PV−, indicating that none of these promoters drove inhibitory neuron subtype specific expression. Interestingly, most of the PV+ cells labeled by AAV-hRREB1 displayed pyramidal morphology. Since some pyramidal cells have been shown to express low levels of PV protein in monkey (Preuss and Kaas, 1996
) and mRNA in mouse (Sugino et al., 2006
), it is possible AAV-hRREB1 largely restricted expression to PV+ cell-types, both excitatory and inhibitory. Altogether, many of the mammalian promoters failed to express in the cortex, and those that drove expression did not appear to restrict expression to inhibitory neurons better than the fugu promoter sequences.
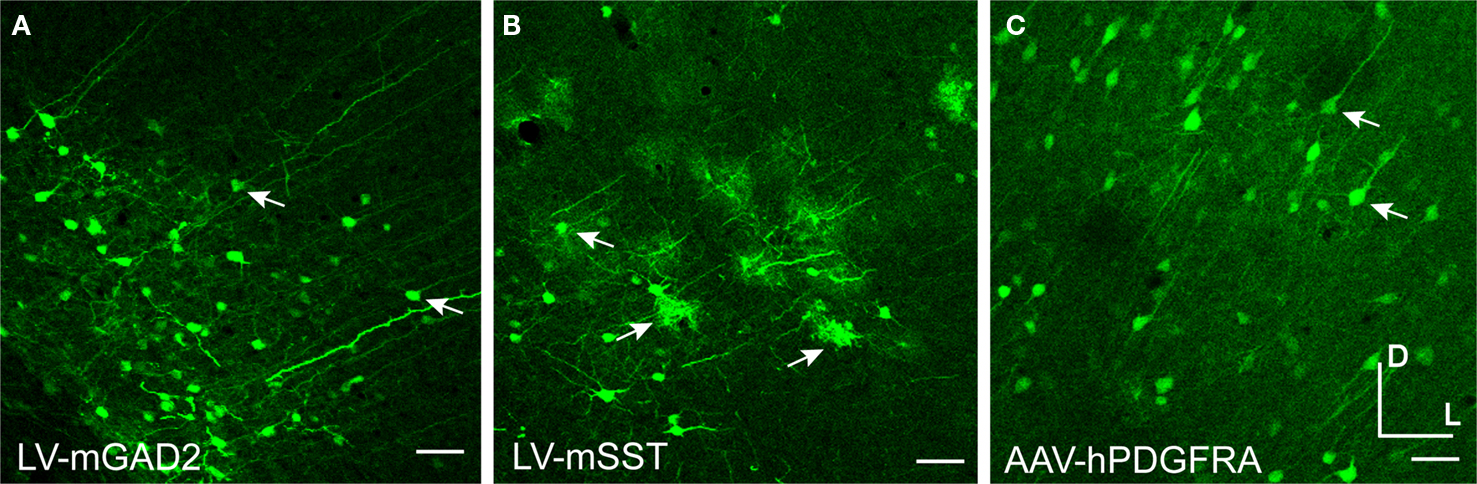
Figure 10. Mammalian promoters drove expression in rodent cortex. Mice were injected with LV expressing GFP driven by mouse promoter sequences for glutamate decarboxylase 2 [LV-mGAD2 – (A)] and somatostatin [LV-mSST – (B)]. Rats were injected with AAV expressing GFP driven by the human promoter sequence for platelet-derived growth factor receptor, alpha polypeptide [AAV-hPDGFRA – (C)]. Rightward pointing arrows mark glia and leftward pointing arrows mark excitatory pyramidal neurons. Dorsal and lateral directions for all images are as indicated in (C). Scale bars are 50 μm.
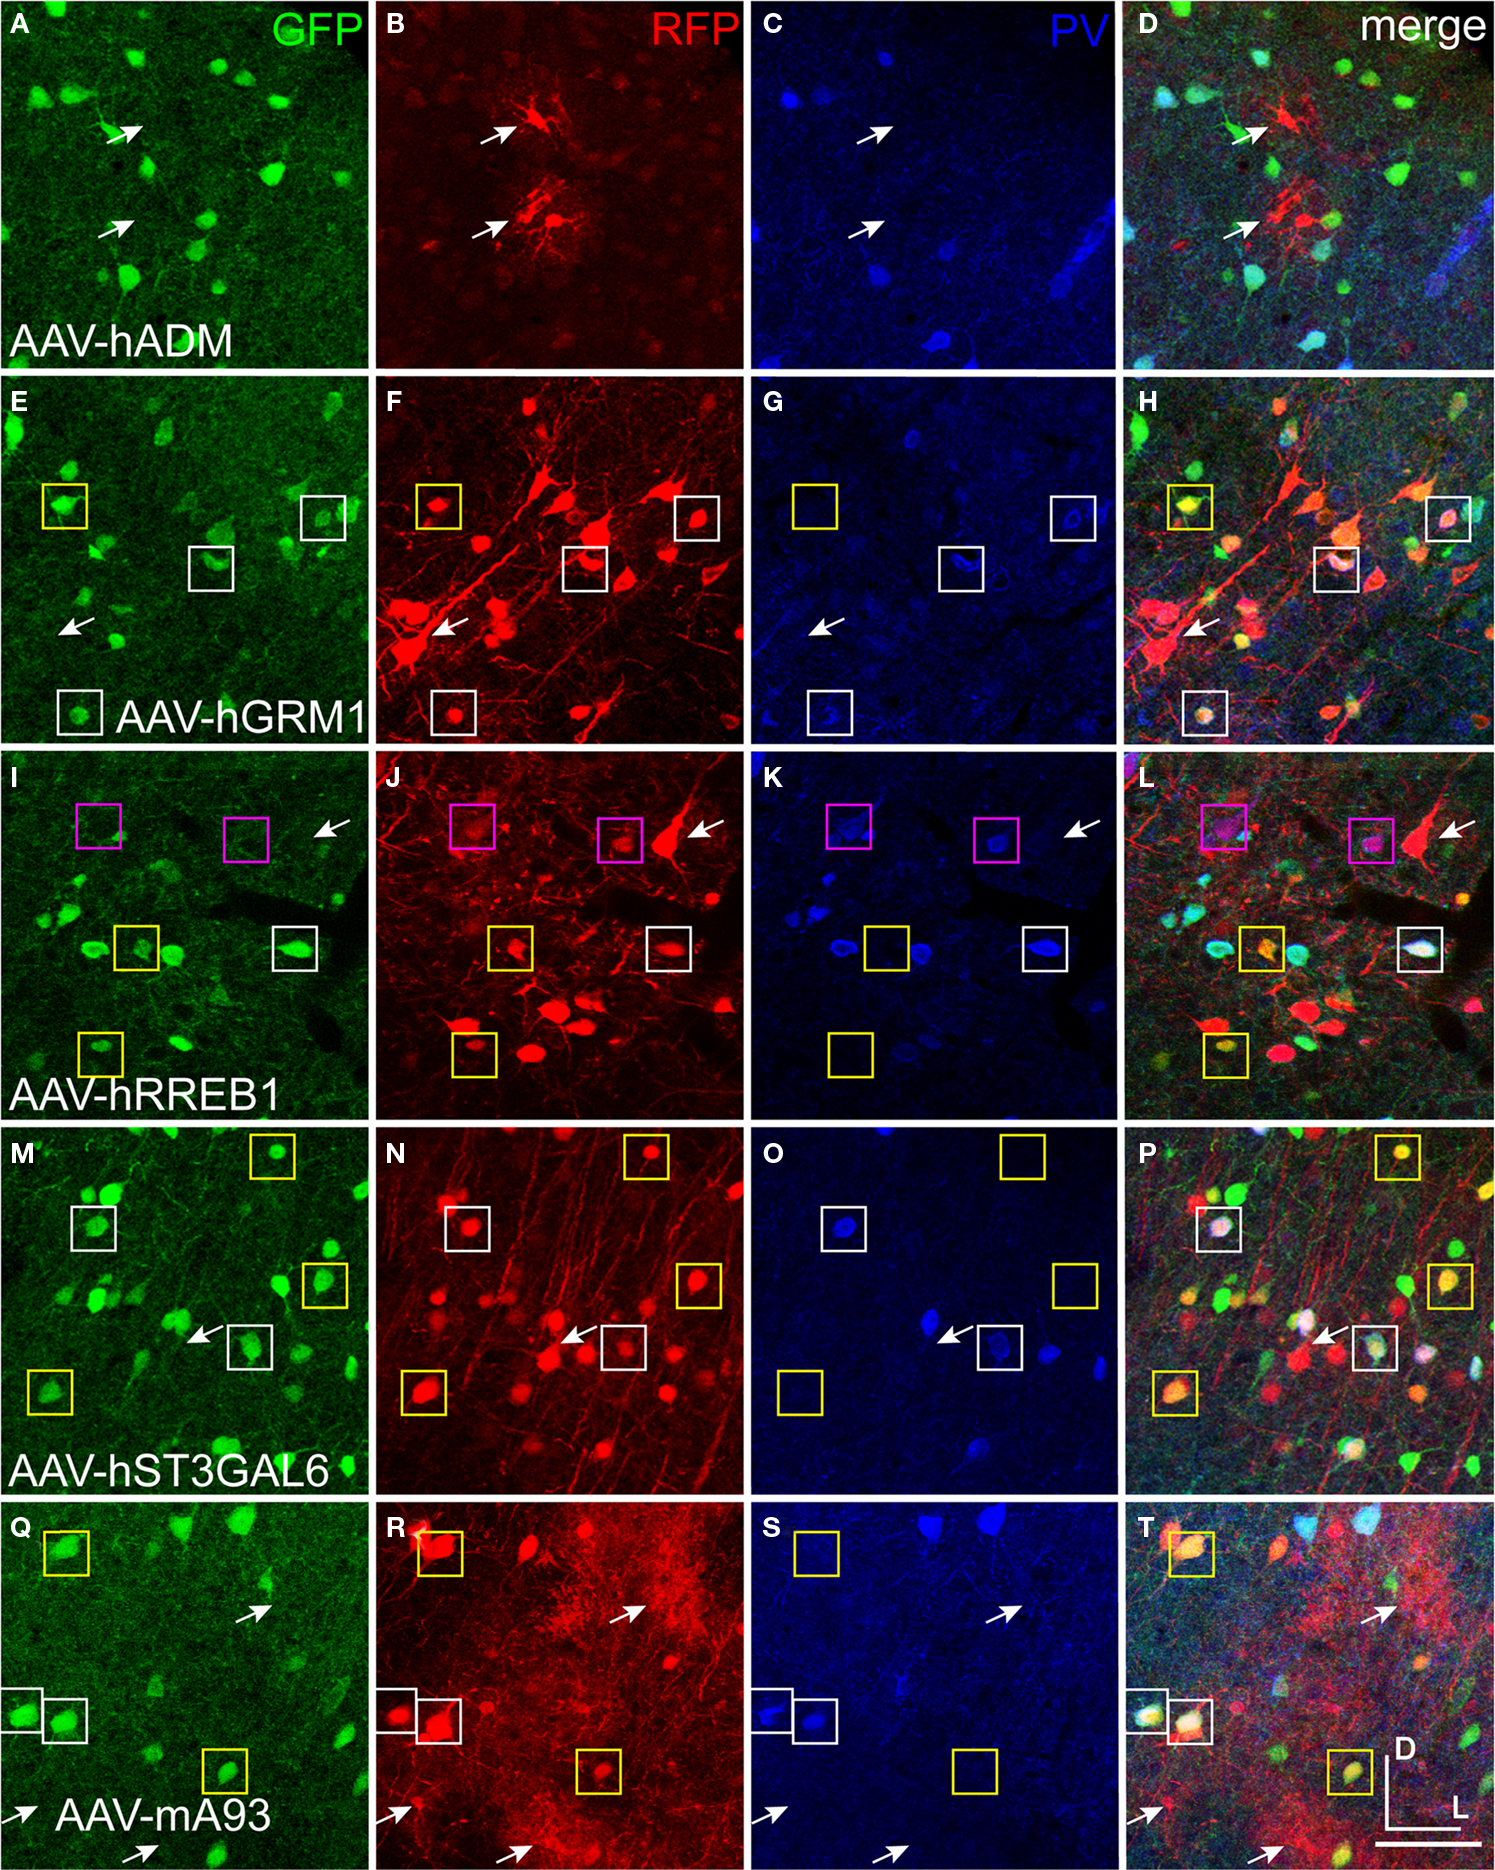
Figure 11. Mammalian conserved TFBS promoters drove expression in mouse brain. GAD67-GFP knock-in mice were injected with AAV expressing RFP driven by promoter sequences with presumed cell-type specific regulatory elements. Images in each row are images of the same section. Green label in the first column on the left (A,E,I,M,Q) is inhibitory neuron specific GAD67-GFP expression. Red label in the second column from the left (B,F,J,N,R) is RFP virus expression. Blue label in the third column from the left (C,G,K,O,S) is parvalbumin (PV) antibody label. The right column (D,H,L,P,T) is the merge of the previous columns. Overlap of green and red is yellow; green and blue is teal; red and blue is purple; green, red and blue is white. Viral vectors were as follows: adrenomedullin [AAV-hADM – (A–D)], glutamate receptor, metabotropic 1 [AAV-hGRM1 – (E–H)], ras responsive element binding protein 1 [AAV-hRREB1 – (I–L)], type 2 lactosamine alpha-2,3-sialyltransferase [AAV-hST3GAL6 – (M–P)] and riken gene A930038C07Rik [AAV-mA93 – (Q–T)]. Examples of double and triple labeled cells are marked with boxes. The color of the box matches the cell overlap color. Rightward pointing arrows mark glia and leftward pointing arrows mark excitatory pyramidal neurons. Dorsal (D) and lateral (L) directions for all images are as indicated in (T). Scale bars are 50 μm.
Transcription Factor Binding Site (TFBS) Assembled Promoters
As an alternative strategy to drive cell-type specific expression in inhibitory neurons, we created artificial promoter constructs assembled with known transcription factor binding sites DR1 (Okuno et al., 2001
) or E1.1 (Scardigli et al., 2003
). The PPARγ/RXRα (peroxisome-proliferator-activated receptor gamma/retinoid X receptor alpha) transcription factor complex (Okuno et al., 2001
) binds to the 24-bp DR1 motif. According to Sugino et al.’s (2006
) microarray data, PPARγ is enriched in the PV+ population and RXRα is expressed at high levels in SST+ and VIP+ inhibitory populations, and at low levels in the PV+ population. Since PPARγ/RXRα complex binds to DR1 in the presence of high molar ratios of PPARγ to RXRα (Okuno et al., 2001
), we expected positive activity of DR1 in PV+ cells.
The E1.1 enhancer element contains 11 nucleotides of the 16-nucleotide PAX6 consensus binding sequence and reportedly restricted expression in Ngn2 positive cells by binding PAX6 in the mouse spinal cord and telencephalon (Scardigli et al., 2003
). Since Sugino et al.’s (2006
) data suggested that PAX6 is enriched in the VIP+ inhibitory population, we expected positive activity of E1.1 in VIP+ cells.
The neuron restrictive silencing element (NRSE) is a 21- to 23-bp DNA transcription factor binding site found in many neuronal genes. The neuron restrictive silencing factor (NRSF) silences neuronal genes in non-neuronal cells by binding to NRSE through the association of the histone deacetylase complex (Huang et al., 1999
; Naruse et al., 1999
) or methyl-CpG-binding protein 2 (Lunyak et al., 2002
). We expected the incorporation of this negative regulator of transcription to restrict promoter activity to neuronal cells.
Three composite regulatory element (CRE) promoters were created by combining DR1 or E1.1 motifs with or without NRSE and a minimal CMV promoter (see Table 3 and Materials and Methods). Mice and rats were injected with vectors expressing either GFP or RFP under the control of these CRE promoters. AAV-DR1-NRSE (RFP) expressed in only a few cells, most of which appeared to be glia (Figure 12
). In contrast, AAV-E1.1 and AAV-E1.1-NRSE expressed strongly and only in a handful of cells scattered over up to ∼200 μm from the injection. AAV-E1.1-NRSE (RFP) expression is shown in Figure 13
. We have observed other viral vectors driving expression at similarly far distances, but the density of cell expression for AAV-E1.1 and AAV-E1.1-NRSE were sparse, suggesting that these promoters restricted expression to only some cell-types. Most of the RFP labeled cells from AAV-E1.1-NRSE co-labeled with GAD67-GFP, indicating this vector predominantly drove expression in inhibitory neurons (Figures 13
A–D,G,H), but a few glial cells also expressed RFP. While the addition of the NRSE to AAV-E1.1 appeared to reduce glia expression, probably the single copy of NRSE in AAV-E1.1-NRSE was not sufficient to completely restrict expression to neurons. Notably, in mice very few RFP labeled cells co-labeled with parvalbumin (PV) antibody, and expression in these cells was faint (Figures 13
E–H). Thus, in mice AAV-E1.1-NRSE largely restricted expression to non-parvalbumin inhibitory neurons. Interestingly however, when rats were injected with AAV-E1.1 (without NRSE), transgene co-labeled with antibodies to inhibitory neuron subtypes (CR, SST and VIP), and PV (data not shown), suggesting that the PAX6 transcription factor may be expressed differently in inhibitory neurons of mouse and rat.
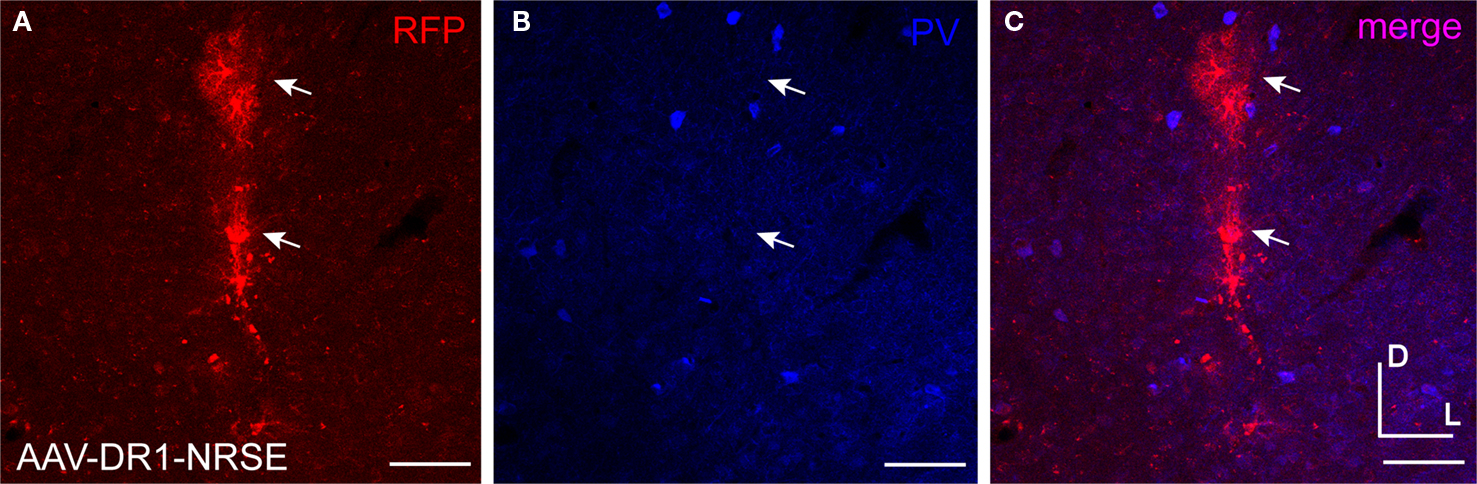
Figure 12. AAV-DR1-NRSE drove expression in only a few cells. AAV driven by the composite regulatory element promoter containing DR1 and NRSE motifs (AAV-DR1-NRSE) was injected into mouse somatosensory cortex. Expression of the RFP AAV transgene is shown in red (A) and PV antibody staining in blue (B). Overlap of red and blue images is shown in (C). Glia are marked with arrows. Dorsal (D) and lateral (L) directions for all images are as indicated in (C). Scale bars are 50 μm.

Figure 13. AAV-E1.1-NRSE drove strong expression in a scattered population of cells. AAV with a promoter containing the E1.1 and NRSE motifs (AAV-E1.1-NRSE) was injected into the somatosensory cortex of GAD67-GFP knock-in mice (A,B,G,H). Expression of the RFP AAV transgene is shown in red (C,D,G,H) and parvalbumin (PV) antibody staining in blue (E–H). Green and red is yellow. The color of the box matches the cell overlap color. Glia are marked with arrows. Dorsal (D) and lateral (L) directions for all images are as indicated in (H). Scale bars are 50 μm.
In this study we targeted inhibitory neuron subtype specific expression using promoter sequences in viral vectors. While none of the promoters tested were capable of restricting expression to inhibitory neuron subtypes, AAV-fSST largely restricted expression to inhibitory neurons both in mouse and in rat. Therefore the SST fugu promoter might be a useful vector in rodent studies targeting the inhibitory neuron class as a whole. In addition, the expression shown by the artificial promoter construct AAV-E1.1-NRSE demonstrates that this vector might be useful for studies targeting SST and VIP, but not PV immunoreactive inhibitory neurons in mice.
In the search for inhibitory neuron specific promoters, we showed that rAAV2/1 is a suitable vector for testing promoter sequences in mouse cortex. Label from AAV-hSyn (and also the fugu vectors in AAV), overlapped with the classical inhibitory neuron markers CR, NPY, SST, PV and VIP. While nearly all of the NPY, and the majority of CR, SST and PV immunoreactive cells were labeled using high titer rAAV2/1, only about half of the VIP immunoreactive cells were labeled. Since we previously observed that labeling efficiency of rAAV2/1 can be biased towards inhibitory neurons depending on the titer of the virus (Nathanson et al., 2009
), we might also suspect that lower titers of virus could result in even fewer proportions of VIP labeled cells. Therefore, one must be cautious in interpreting quantitative results of promoter activity of AAV vectors in inhibitory neurons. This caution is relevant to all viral vectors, and viral tropism should be considered by first using promoters capable of driving the most ubiquitous expression.
In this study we showed that all of the fugu promoters tested drove expression in the mammalian brain. Some of the tested fugu promoter sequences largely restrict expression to inhibitory GABAergic neurons (fSST and fNPY); some promoters limit expression to neuronal cells in general; and others drive expresson in glia as well. None restricted expression to inhibitory neuron subtypes. One possibility for the lack of specificity is that the tested fugu sequences lack negative regulatory signals which might be located in sequences further 5′ of the cloned region, in 5′ UTRs, in introns, or in 3′ intergenic regions of the genes of interest. Alternatively, it is possible that inhibitory neuron cell-type specific gene expression cannot easily be duplicated in adult cells due to epigenetic changes such as CpG methylation. Also, the fact that none of the fugu promoters restricted expression to a particular cell-type may suggest that the intricacies of inhibitory cell-type specific regulation may not be highly conserved among fish and mammals. Indeed, recent work has shown that inhibitory neuron expression can differ even between the small evolutionary distances between different rodent species. Xu et al. (2006)
has shown that unlike in rat, CR expresses in a subset of SST+ cells in mice which are otherwise similar across species in both morphology and intrinsic physiology. Since even simple base pair substitutions and changes in distances between regulatory elements can change gene expression (Rodriguez-Trelles et al., 2003
), complex regulatory environments involving many interacting factors may not be commonly shared between evolutionarily distant species. Small genetic differences can have a profound effect if the regions of difference are important. King and Wilson (1975)
, among others, have suggested that the profound phenotypic differences between humans and chimpanzees which share more than 98.5% nucleotide identity (Ebersberger et al., 2002
), are likely a result of differences in the regulatory regions of genes. Indeed, ∼15% of CpG sites differ between human and chimpanzee (Ebersberger et al., 2002
). Therefore, the ability for the same regulatory region to function across multiple species may be more a rarity than a rule, and those that are evolutionarily conserved are likely to be concentrated among genes that are developmentally indispensable. Indeed, the majority of evolutionarily conserved sequences between fugu and mammals have been found in the proximity of genes encoding transcription factors and/or genes expressed in early developmental stages (Woolfe et al., 2005
). Regulation of the selected genes in inhibitory neuron subtypes may not have these evolutionary constraints. For example, expression of one calcium binding protein such as PV, might be replaced by another, such as calbindin.
As described, a collection of promoters drove expression in neurons, but not glia (fSST, fNPY, fPV, fCAMK, hPDGRFA, hGRM1, hST3GAL6, hRREB1). Likewise, a set of the promoters preferentially drove expression in inhibitory neurons with minimal excitatory neuron expression (fNPY, fSST, mA93, E1.1-NRSE). These results suggest that the regulatory mechanisms responsible for driving expression in the broader cell-type classes of inhibitory neurons, excitatory neurons or glia, may be relatively simple and shared between species. Nevertheless, identification of these regulatory mechanisms between inhibitory and excitatory neurons has remained elusive. In contrast to inhibitory neurons as a whole, our inability to achieve subtype specific expression in inhibitory neurons suggests subtype regulatory mechanisms are quite complex. To this point, even the simple E1.1-NRSE composite regulatory element drove expression in multiple inhibitory neuron subtypes. These results suggest that complex regulatory environments including antagonistic repressors may be needed to restrict expression to inhibitory neuron subtypes.
Lentiviral vectors containing fCR, fSST, fNPY and fPV promoters were also tested. These promoters were larger than in AAV, encompassing the promoters tested in AAV, and in some cases including the entire 5′ intergenic region. We consistently observed many more excitatory neurons in LV than in AAV injected brains among corresponding promoters. In a previous study (Nathanson et al., 2009
) we demonstrated that AAV preferentially drove expression in inhibitory neurons relative to excitatory neurons. With this understanding, the consistent expression differences between corresponding promoters in our current study supports the possibility that viral vector tropism might have contributed more to increased LV excitatory neuron expression than did the differences in composition between the corresponding AAV and LV promoter versions. Nevertheless, AAV-fCR drove expression in glia while LV-fCR did not. Since both AAV and LV efficiently transduce glia, these results suggest differences in the content of these promoters were responsible for these observed differences in glia expression.
None of the mammalian promoters taken from the group of co-expressed genes showed inhibitory neuron specificity. The computational analysis did not resolve the necessary elements for inhibitory neuron cell type specificity. Yet, we might have improved inhibitory versus excitatory neuron specificity if we had contrasted promoter sequences from the inhibitory neuron cell-type groups with those of excitatory neurons, rather than just between inhibitory neuron cell-type groups. In addition, one major limitation towards achieving inhibitory neuron cell-type specific regulation was the relatively small number of genes for which we could reasonably presume to be co-expressed in each of the cell-type groups. Also, the variability of genes within each inhibitory neuron subtype cluster, as evident by the different patterns of expression seen in various regions of the mouse brain, indicate that many of the co-expressed genes are not associated or co-regulated in the same cell-types outside of cortex. Given these limitations, it was not entirely unexpected that we did not find TFBSs which were strongly enriched in one cell-type and absent from the others. Rather than searching for determinant cell-type specific factors, we were resolved to find factors largely enriched in a group. To this end, the analysis revolved around establishing ratios that were out of balance between cell-types (see Tables S2–4 in Supplementary Material). If however our dataset truly consisted of co-expressed genes and the regulatory environments were not too complex, we might expect that an analysis of a limited and noisy dataset could succeed in identifying common regulatory elements. However, together with the lack of cell-type specificity of the fugu promoters, these results suggest that regulation of inhibitory neuron cell-type specificity is likely complex and might also involve epigenetic regulation.
How well does the clustering of co-expressed genes reflect co-regulation? Since a microarray snapshot identifying the groups of co-expressed genes does not account for the dynamically responsive nature of regulatory elements, it may be useful to obtain lists of co-expressed genes satisfying multiple discriminating criteria. For example, do the genes (1) change together under various conditions (Luscombe et al., 2004
); (2) share common biological pathways (Okuda et al., 2006
); and/or (3) show consistent anatomical expression in more than one brain structure? One possible combination using existing data for finding inhibitory subtype specific regulatory elements, would be to combine Sugino et al.’s (2006
) microarray dataset with a complete survey of the Allen Mouse Brain Atlas (Lein et al., 2007
). Inhibitory neurons show distinct patterns of expression throughout the brain, including the cerebellum, cortex, hippocampus and reticular thalamus. Therefore, genes that share common patterns of expression in many regions, and are found by microarray data to be enriched in a specific cell-type, could provide a more stringent and larger basis for identifying common regulatory elements.
Composite regulatory element (CRE) promoters appear to present a viable option for creating cell-type specific promoters. Indeed, of all of the promoters tested, the AAV-E1.1-NRSE vector showed the most potential for inhibitory neuron subtype selectivity. In addition, the simplicity of this promoter suggests that relatively simple modifications might also yield significant improvements. For example, further reduction in glial expression might be achieved by adding additional NRSE sites. And since Bessis et al. (1997)
has shown that the distance between NRSE and other factors can affect whether the NRSF/NRSE restricts or enhances activity, the suppression activity of the NRSE sites might be enhanced by increasing the distance between the NRSE sites and the other binding sites in the CRE. One option for increasing the activity of the AAV-DR1-NRSE vector might be to add multiple copies of the DR1 motif as is the case in the E1.1 vectors. Alternatively, since the Pal3 motif (Okuno et al., 2001
) can bind the PPARγ homodimer without RXRα, this element may prove to drive stronger expression in PV+ cells. Despite the apparent simplicity of these vectors, the number and arrangement of factors in precise orders and at specific distances, consistent with the natural placements, might be important for correct regulation. Therefore the usefulness of regulatory elements as building blocks for obtaining specific and complex regulation may require extensive characterization of these elements. Given the selectivity of the AAV-E1.1-NRSE vector, the extremely short promoter sequences, and that expression datasets such as the microarray dataset by Sugino et al. (2006)
can identify candidate transcription factors, the CRE approach may be a ripe strategy in the pursuit of cell-type specific promoters.
Neither of our promoter approaches achieved inhibitory neuron cell-type specificity. It is possible that there are few workable solutions for inhibitory neuron cell-type promoters given promoter complexities and the size limitations in AAV and LV. At this point, the only dependable method for transcriptional targeting of specific cell populations using inserted DNA is with large BAC sequences, which are used for the creation of transgenic animals (Heintz, 2001
). One possible viral vector based alternative to AAV or LV may be the use of HSV vectors, which can incorporate BACs of up to 150 kb (Saeki et al., 1998
). Efforts to make HSV suitable for gene therapy applications are ongoing (Berges et al., 2007
), and may prove the best suited vector when cell-type specific control is desired. Alternatively, viral pseudotyping via capsid modifications may be a useful approach for cell-type specific targeting (Choi et al., 2005
). Where smaller regulatory elements are required, multi-faceted approaches, including multi-pronged bioinformatic comparisons of co-expressed genes and composite regulatory element promoters are perhaps the most promising avenues of pursuit, and may yield new insights towards achieving cell-type specific regulation.
The authors declare that research was conducted in the absence of any commercial or financial relationships that could be construed as a potential conflict of interest.
We thank Yuchio Yanagawa for his contribution of GAD67-GFP knock-in mice. This work was supported by the NIH Neuroplasticity of Aging Training Grant AG000216 (awarded to UCSD), Chapman Charitable Trust, Aginsky Research Scholarship, and NIH Grants DA011828 and MH063912 to EMC.
The Supplementary Material for this article can be found online at http://www.frontiersin.org/neuralcircuits/paper/10.3389/neuro.04/019.2009/
Aparicio, S., Chapman, J., Stupka, E., Putnam, N., Chia, J. M., Dehal, P., Christoffels, A., Rash, S., Hoon, S., Smit, A., Gelpke, M. D., Roach, J., Oh, T., Ho, I. Y., Wong, M., Detter, C., Verhoef, F., Predki, P., Tay, A., Lucas, S., Richardson, P., Smith, S. F., Clark, M. S., Edwards, Y. J., Doggett, N., Zharkikh, A., Tavtigian, S. V., Pruss, D., Barnstead, M., Evans, C., Baden, H., Powell, J., Glusman, G., Rowen, L., Hood, L., Tan, Y. H., Elgar, G., Hawkins, T., Venkatesh, B., Rokhsar, D., and Brenner, S. (2002). Whole-genome shotgun assembly and analysis of the genome of Fugu rubripes. Science 297, 1301–1310.
Dittgen, T., Nimmerjahn, A., Komai, S., Licznerski, P., Waters, J., Margrie, T. W., Helmchen, F., Denk, W., Brecht, M., and Osten, P. (2004). Lentivirus-based genetic manipulations of cortical neurons and their optical and electrophysiological monitoring in vivo. Proc. Natl. Acad. Sci. U.S.A. 101, 18206–18211.
Karolchik, D., Kuhn, R. M., Baertsch, R., Barber, G. P., Clawson, H., Diekhans, M., Giardine, B., Harte, R. A., Hinrichs, A. S., Hsu, F., Kober, K. M., Miller, W., Pedersen, J. S., Pohl, A., Raney, B. J., Rhead, B., Rosenbloom, K. R., Smith, K. E., Stanke, M., Thakkapallayil, A., Trumbower, H., Wang, T., Zweig, A. S., Haussler, D., and Kent, W. J. (2008). The UCSC Genome Browser Database: 2008 update. Nucleic Acids Res. 36, D773–D779.
Kaspar, B. K., Vissel, B., Bengoechea, T., Crone, S., Randolph-Moore, L., Muller, R., Brandon, E. P., Schaffer, D., Verma, I. M., Lee, K. F., Heinemann, S. F., and Gage, F. H. (2002). Adeno-associated virus effectively mediates conditional gene modification in the brain. Proc. Natl. Acad. Sci. U.S.A. 99, 2320–2325.
Lein, E. S., Hawrylycz, M. J., Ao, N., Ayres, M., Bensinger, A., Bernard, A., Boe, A. F., Boguski, M. S., Brockway, K. S., Byrnes, E. J., Chen, L., Chen, T. M., Chin, M. C., Chong, J., Crook, B. E., Czaplinska, A., Dang, C. N., Datta, S., Dee, N. R., Desaki, A. L., Desta, T., Diep, E., Dolbeare, T. A., Donelan, M. J., Dong, H. W., Dougherty, J. G., Duncan, B. J., Ebbert, A. J., Eichele, G., Estin, L. K., Faber, C., Facer, B. A., Fields, R., Fischer, S. R., Fliss, T. P., Frensley, C., Gates, S. N., Glattfelder, K. J., Halverson, K. R., Hart, M. R., Hohmann, J. G., Howell, M. P., Jeung, D. P., Johnson, R. A., Karr, P. T., Kawal, R., Kidney, J. M., Knapik, R. H., Kuan, C. L., Lake, J. H., Laramee, A. R., Larsen, K. D., Lau, C., Lemon, T. A., Liang, A. J., Liu, Y., Luong, L. T., Michaels, J., Morgan, J. J., Morgan, R. J., Mortrud, M. T., Mosqueda, N. F., Ng, L. L., Ng, R., Orta, G. J., Overly, C. C., Pak, T. H., Parry, S. E., Pathak, S. D., Pearson, O. C., Puchalski, R. B., Riley, Z. L., Rockett, H. R., Rowland, S. A., Royall, J. J., Ruiz, M. J., Sarno, N. R., Schaffnit, K., Shapovalova, N. V., Sivisay, T., Slaughterbeck, C. R., Smith, S. C., Smith, K. A., Smith, B. I., Sodt, A. J., Stewart, N. N., Stumpf, K. R., Sunkin, S. M., Sutram, M., Tam, A., Teemer, C. D., Thaller, C., Thompson, C. L., Varnam, L. R., Visel, A., Whitlock, R. M., Wohnoutka, P. E., Wolkey, C. K., Wong, V. Y., Wood, M., Yaylaoglu, M. B., Young, R. C., Youngstrom, B. L., Yuan, X. F., Zhang, B., Zwingman, T. A., and Jones, A. R. (2007). Genome-wide atlas of gene expression in the adult mouse brain. Nature 445, 168–176.
Matys, V., Fricke, E., Geffers, R., Gossling, E., Haubrock, M., Hehl, R., Hornischer, K., Karas, D., Kel, A. E., Kel-Margoulis, O. V., Kloos, D. U., Land, S., Lewicki-Potapov, B., Michael, H., Munch, R., Reuter, I., Rotert, S., Saxel, H., Scheer, M., Thiele, S., and Wingender, E. (2003). TRANSFAC: transcriptional regulation, from patterns to profiles. Nucleic Acids Res. 31, 374–378.
Moreno, C. S., Emery, P., West, J. E., Durand, B., Reith, W., Mach, B., and Boss, J. M. (1995). Purified X2 binding protein (X2BP) cooperatively binds the class II MHC X box region in the presence of purified RFX, the X box factor deficient in the bare lymphocyte syndrome. J. Immunol. 155, 4313–4321.
Saeki, Y., Ichikawa, T., Saeki, A., Chiocca, E. A., Tobler, K., Ackermann, M., Breakefield, X. O., and Fraefel, C. (1998). Herpes simplex virus type 1 DNA amplified as bacterial artificial chromosome in Escherichia coli: rescue of replication-competent virus progeny and packaging of amplicon vectors. Hum. Gene Ther. 9, 2787–2794.
Woolfe, A., Goodson, M., Goode, D. K., Snell, P., McEwen, G. K., Vavouri, T., Smith, S. F., North, P., Callaway, H., Kelly, K., Walter, K., Abnizova, I., Gilks, W., Edwards, Y. J., Cooke, J. E., and Elgar, G. (2005). Highly conserved non-coding sequences are associated with vertebrate development. PLoS Biol. 3, e7. doi: 10.1371/journal.pbio.0030007.