Institute for Neural Computation, University of California San Diego, La Jolla, CA, USA
High-frequency cortical potentials in electroencephalographic (EEG) scalp recordings have low amplitudes and may be confounded with scalp muscle activities. EEG data from an eyes-closed emotion imagination task were linearly decomposed using independent component analysis (ICA) into maximally independent component (IC) processes. Joint decomposition of IC log spectrograms into source- and frequency-independent modulator (IM) processes revealed three distinct classes of IMs that separately modulated broadband high-frequency (∼15–200 Hz) power of brain, scalp muscle, and likely ocular motor IC processes. Multi-dimensional scaling revealed significant but spatially complex relationships between mean broadband brain IM effects and the valence of the imagined emotions. Thus, contrary to prevalent assumption, unitary modes of spectral modulation of frequencies encompassing the beta, gamma, and high gamma frequency ranges can be isolated from scalp-recorded EEG data and may be differentially associated with brain sources and cognitive activities.
Most analysis of ongoing electroencephalographic (EEG) and local cortical field activity assumes that the observed fluctuations of electrical potential are the sum of more or less narrow-band oscillatory activities in distinct frequency bands. However, invasive electrocorticographic (ECoG) recordings from the cortical surface of patients in preparation for brain surgery to relieve intractable epilepsy include clear and well-replicated 30–200 Hz broadband power fluctuations (Crone et al., 2006
) that appear directly linked to information processing in each cortical area (Crone et al., 1998
, 2001
; Pfurtscheller et al., 2003
; Ray et al., 2008
). These fluctuations are not found to occur within narrow frequency bands [as, for example, within the (8–12 Hz) alpha band (Pfurtscheller, 1989
)], but instead appear to be monotonic modulations of spectral power across the entire upper portion of the local field spectrum. Although a tonic increase in higher-frequency EEG activity recorded from the human scalp has long been associated with wakefulness and arousal (Moruzzi and Magoun, 1949
), and changes in high-frequency broadband activity have recently been shown to correlate with neural spike rate (Logothetis et al., 2001
; Manning et al., 2009
), it is most often assumed that activity above the (30–90 Hz) gamma frequency band does not survive passage through the skull with enough power to be detected at scalp electrodes. In contrast, electromyographic (EMG) activities from scalp and neck muscles make prominent contributions to scalp EEG data across a very wide (at least 20–300 Hz) EMG frequency range, further confounding interpretation of high-frequency brain activity in scalp recordings (Whitham et al., 2007
). Thus, it has been considered very difficult to clearly separate and monitor very high-frequency brain source activities in non-invasively recorded scalp EEG data.
Analysis of scalp EEG data is complicated by the fact that activity recorded at each scalp channel sums activities from several cortical source areas separated as widely as occipital and frontal cortex (Makeig et al., 2002
). To accurately model the relation of EEG dynamics to behavior and experience, therefore, activities of distinct brain and non-brain EEG sources must first be isolated. Independent component analysis (ICA) decomposes scalp-recorded EEG data into a weighted set of maximally temporally independent component (IC) processes by learning spatial filters that maximize the temporal independence of the resulting IC-filtered output time series (Makeig et al., 1996
). Under favorable circumstances, the highly overlapping scalp projections of many ICs each strongly resemble the projection of a single equivalent dipole source, a result compatible with generation by partially synchronous local field activity across a cortical patch, though the scalp maps of a few ICs are clearly better fit by two bilateral equivalent dipoles, possibly reflecting joint activity of two cortical patches whose local field activity patterns may be tightly coupled by parallel sensory inputs or directly by callosal fibers (Makeig et al., 2002
).
Despite the potential for EMG contamination, several studies have reported changes in low gamma-band EEG activity associated with imagined or perceived emotion-laden pictures. For example, integrated gamma-band power in the 30–60 Hz range has been reported to be higher at rest in Buddhist meditators than in controls, and to increase further during their meditations on loving-kindness and compassion (Lutz et al., 2004
). Processing of emotional stimuli was also linked to gamma band power increases in normal subjects (Gemignani et al., 2000
; Keil et al., 2001
; Aftanas et al., 2004
), though this linkage was absent in alexithymic subjects who are unable to identify and describe their feelings (Matsumoto et al., 2006
). In another report, repetitive trans-magnetic stimulation of the medial cerebellum produced spontaneous reports of elevated mood accompanied by increased (right > left) asymmetry in gamma (30–50 Hz) power at frontal scalp electrodes (Schutter et al., 2003
). Of the studies mentioned above, only one (Lutz et al., 2004
) attempted to address the possible confounding influence of scalp muscle by comparing intentional muscle flexing and using ICA to remove temporalis muscle contributions and to localize the apparent brain sources of the scalp gamma activity, although the latter analyses were only submitted as supplemental material.
Many studies of EEG spectral dynamics consider separate, narrow and/or pre-defined frequency bins. However, to better understand the functional roles of local field dynamics in the brain, more flexible data-driven models of spectral dynamics are desirable. Here, we attempted to characterize the distinct, frequency modulations occurring in continuously recorded EEG data, irrespective of their physiological bases, and to determine the inter-relationship of observed modulations in brain and muscle source EEG activities. Previously, we have shown that spectral activity of ICs projecting to the frontal midline scalp exhibit multiple modes of event-related power modulation during a working memory task (Onton et al., 2005
). The method we applied here is a related but novel method for decomposing log-spectral fluctuations of multiple ICs into a product of distinct spectral modulator processes (Figure 1 and Materials and Methods). Such processes might derive from coordinated actions of modulatory factors, for example the brainstem-based neuromodulatory systems releasing dopamine, acetylcholine, norepinephrine, etc., that are linked to arousal and event evaluation (Robbins, 1997
; Bardo, 1998
) or other cognitive/emotional processes. There may appear to be a contradiction between the concepts of ‘independent’ component processes (ICs) and ‘amplitude co-modulated’ processes (co-modulated by one or more IMs), since by strict definition co-modulated processes are not truly independent. Mathematical investigation shows, however, that infomax ICA should correctly separate and identify co-modulated but otherwise independent processes when their probability density functions resemble those of typical brain source ICs (Palmer and Makeig, 2010
).
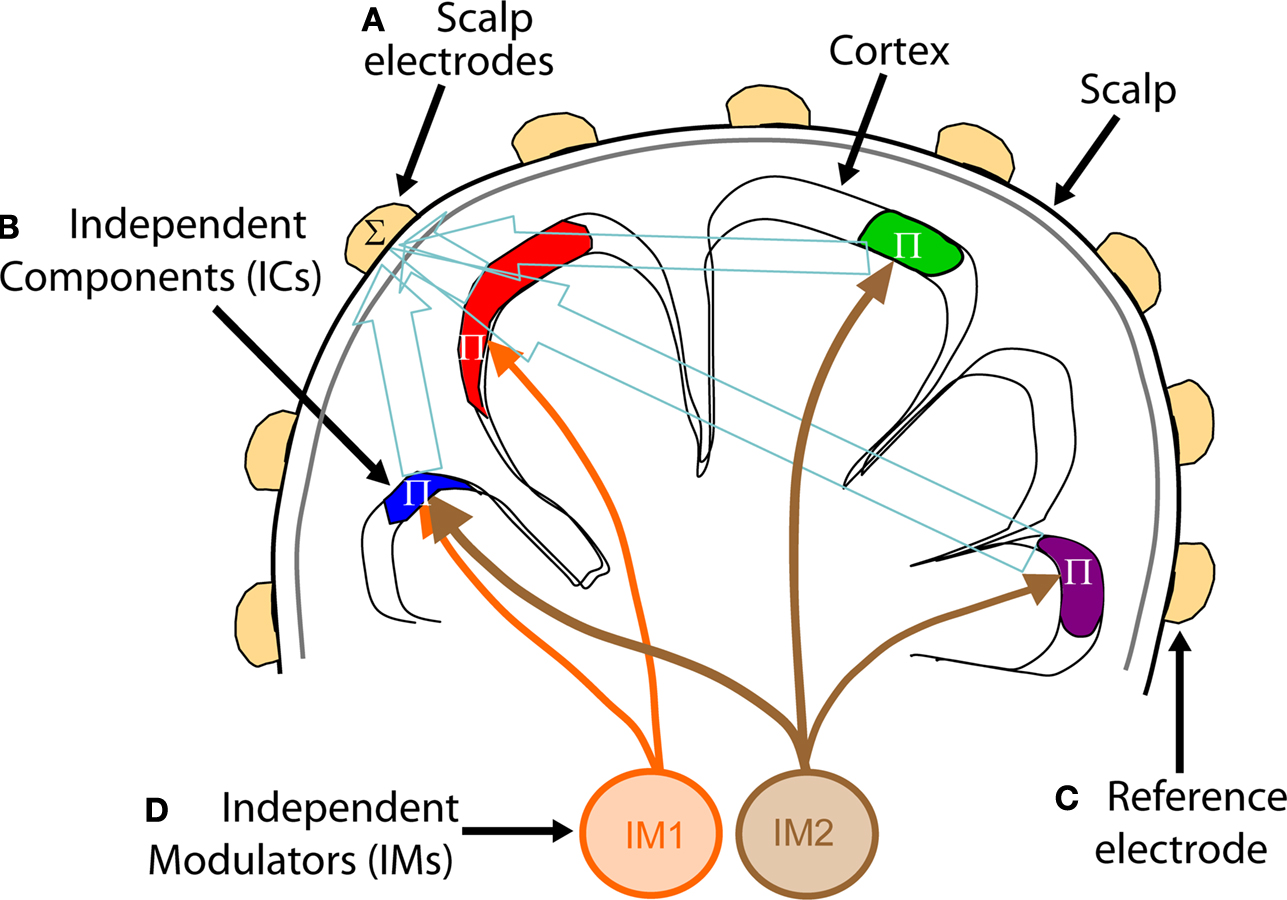
Figure 1. Independent spectral modulators of scalp EEG signals. ICA, applied to EEG data recorded at a large number of scalp electrodes, identifies (A) temporally distinct (independent) signals generated by partial synchronization of local field potentials within cortical patches (B), the resulting far-field potentials summed (Σ), in differing linear combinations, at each electrode depending on the distance and orientation of each cortical patch generator relative to the (A) recording and (C) reference electrodes. On average, power in the cortical IC signals decrease monotonically with frequency, but also exhibit continual, marked, and complex variations across time. Rather than viewing these variations as occurring independently at each frequency, spectral modulations may be modeled as exponentially weighted influences of several distinct but possibly overlapping modulator (IM) processes (D) that independently modulate via multiplicatively scaling (Π) the activity spectra of one or more independent component (IC) signals. On converting the IC spectra to log power, combined IM influences on IC spectra are converted to log-linear weighted sums of IM influences, allowing a linear ICA decomposition of the IC log-power spectra to separate the effects of the individual IM processes (D) on power at selected frequencies of IC sources (B).
Here we show that results of the log-spectral decomposition method, applied to data collected during an experiment involving eyes-closed guided imagery to achieve immersion in various emotion experiences, included three categories of broadband high-frequency modulations associated with brain, scalp muscle, and most likely ocular motor tremor activity, respectively.
Subjects and Task
Thirty-two young adult volunteers participated under informed consent in accordance with UCSD institutional review board requirements (13 male, 19 female; age range: 18–38 years; age mean and standard deviation: 25.5 ± 5 years). None of the subjects were highly trained in meditation, but all stated they felt capable of inducing a realistic emotional state through a verbally guided narrative and their own imagination. Subjects were seated comfortably with eyes closed in a dimly lit room with air-tube fed ear-bud earphones. Imagination of emotional states was encouraged and guided by a set of pre-recorded verbal suggestions. Each session began and ended with 2 min of eyes closed silent rest. The task then began with a recorded verbal explanation of the task, followed by approximately 5 min of verbal guided imagery relaxation instructions to promote a relaxed, inwardly-focused state. A series of 15 guided imagery narratives, each describing a different emotion and potential scenario, were then presented, separated by voice-guided relaxation interludes. Subjects were instructed to use whatever imagery they deemed suitable for stimulating a vivid and embodied experience of the suggested emotion, and were encouraged to pay attention to somatic sensations associated with the target emotion. Subjects were told to take as much time as they needed to recall or imagine a scenario that would induce a realistic experience of the suggested emotion.
Each (15–30 s) pre-recorded emotional imagery induction began with a short description of the emotion followed by suggestions of one or more circumstances in which the target emotion might be vividly experienced. For example, for the emotion ‘excitement’ the suggested circumstance was this: ‘Perhaps something you dreamed of experiencing is finally about to arrive, something that opens up new exciting possibilities for you.’ To minimize subject stress, the emotion sequence was chosen to alternate pseudo-randomly between positive-valence emotions (love, joy, happiness, relief, compassion, contentedness, excitement, awe) and negative-valence emotions (anger, jealousy, disgust, frustration, fear, sadness, grief).
Sixteen of the subjects indicated the onset of the suggested emotion by pressing a right-hand button. Eleven other subjects were asked to make pulsating button presses on a pressure sensitive key, attempting to communicate the quality of the feeling they were experiencing. Five other subjects were asked to press the button at moments when they experienced a surge in the target emotion. Results of the valence analysis reported here for the three button-press subgroups proved similar, so for the purposes of this report the data of all 32 subjects were considered together.
Subjects were asked to experience each suggested emotion for 3–5 min, though no external time indicators were provided to the subjects, and to press a second, left-hand button when the experience of the emotion subsided. This initiated a verbal 15-s relaxation suggestion, followed by the next emotion induction. The durations of the 480 recorded emotion periods (15 emotions × 32 subjects) were between 43 s and 12 min (on average, 218 ± 94 s) during experimental sessions lasting about 80 min.
Data Acquisition
EEG data were collected synchronously from 250 scalp, four infra-ocular, and two electrocardiographic (ECG) electrodes with an active reference (Biosemi, Amsterdam) at a sampling rate of 256 Hz with 24-bit A/D resolution. Onsets and offsets of each guided imagery narrative, as well subject button presses, were recorded in simultaneously acquired event channels. Caps with a custom whole-head montage were used to position the electrodes, which were pressed into plastic wells in an electrode cap filled with water-based conductive gel. The recording montage covered most of the skull, forehead, and lateral face surface, omitting chin and fleshy cheek areas. The whole-head coverage and multiple chinstraps, as well as the active recording technique that eliminated the need to scrape the skin surface, made the process of fitting and wearing the electrodes generally comfortable for the subjects. Locations of the electrodes relative to skull landmarks for each subject were recorded (Polhemus, Inc.).
Data Preprocessing
Separating independent modulator (IM) processes involved several steps detailed below. Data were analyzed by custom Matlab (The Mathworks, Inc.) scripts built on the open source EEGLAB environment (Delorme and Makeig, 2004
). Electrodes with poor skin contact, judged by their grossly abnormal activity patterns, were removed from the data, leaving 134–235 channels per subject (214 ± 18, mean ± SD). After re-referencing to digitally linked mastoids, the data were digitally filtered to emphasize frequencies above 1 Hz. Data periods containing broadly distributed, high-amplitude muscle noise and other irregular artifacts were identified by tests for high kurtosis or low probability activity and removed from analysis using EEGLAB functions (Delorme et al., 2007
). Occurrence of eye blinks, other eye movements, or tonic muscle tension artifacts were not criteria for data rejection.
ICA Decomposition
Remaining data time points were then concatenated and submitted to full-rank decomposition by extended infomax ICA using the binica function (Makeig et al., 1997
) available in the EEGLAB toolbox (http://sccn.ucsd.edu/eeglab
). Infomax ICA finds a matrix, W, that linearly unmixes the original EEG channel data, x, into a sum of maximally temporally independent, and spatially fixed components, u, such that u = Wx. The rows of the resulting ‘activation’ matrix, u, are the IC activities or activations, and its columns, the time points of the input data. Columns of the inverse matrix, W−1, give the relative projection weights from each IC to each scalp electrode. For the derivation of the infomax algorithm, see Jung et al. (2001)
; for practical details of its application to EEG data see Makeig et al. (2004) and Onton and Makeig (2006)
.
Decompositions used default extended-mode binica training parameters with a stopping weight change of 1e-7. Extended infomax ICA (Lee et al., 1999
) was used to allow recovery of components with either supra- or sub-gaussian activity distributions, including 60-Hz line noise contamination. No PCA dimension reduction was performed on scalp EEG data before ICA decomposition. The amount of data decomposed for each subject amounted to between 25 and 57 min (mean data points ± SD: 667 k ± 115 k). The scalp data decomposed by ICA comprised, on average, about 30 time points for each weight in the square ICA unmixing matrix learned from the EEG data (range, 15–70). Note that the lower end of this points-per-weight range is somewhat lower than we have previously recommended (Onton and Makeig, 2006
), yet no adverse effects on decomposition quality were noted, suggesting that the quality of EEG data affects the minimum number of points-per-weight required for useful ICA decomposition, though no systematic exploration of this question has yet been reported.
Independent Component Selection
IC activations from each subject were first assessed and categorized as brain activity or non-brain artifact (e.g., muscle or line noise, or eye movement activity) by visual inspection of their scalp topographies, time courses and activity spectra. Next, an equivalent current dipole model for each brain-IC map was computed using a four-shell spherical head model co-registered to each subject’s electrode locations by warping the electrode locations to the model head sphere using tools from the EEGLAB dipfit plug-in using Fieldtrip toolbox functions by Robert Oostenveld. Components with bilaterally symmetric scalp maps were fit with two symmetrically placed, but freely oriented equivalent dipoles. If the spherical forward-model scalp projection of the best-fitting single or dual-symmetric equivalent-dipole model had more than 15% residual variance over all scalp electrodes from the IC scalp map, the component was omitted from further analysis. ICs with an equivalent dipole located well outside the model brain volume were also excluded. The mean number of remaining brain ICs with near-dipolar scalp maps entered into the subsequent analysis was 16 per subject (SD ± 6; range, 9–31). For some analyses, components accounting for scalp and neck muscle activities were separately identified by their characteristic mean spectral plateau above 25 Hz and the placement of their equivalent dipole outside the brain in the neck or lower head region.
A third class of identified ICs included in the decomposition comprised putative ocular motor ICs with bilaterally symmetrical scalp maps that resembled those of ICs accounting for blink artifacts. However, the activations of these ocular motor ICs did not contain typical blink activity features (though some did exhibit deflections temporally linked to blink events that were primarily accounted for by other eye blink components). These ICs were generally localized using an inverse spherical head model to either the edge of ventral frontal brain regions, or below the brain volume just behind the eye sockets. Based on the characteristic IM power modulations recovered for nearly all these ICs with a broad spectral peak in the region of 50–70 Hz, we judge the source of their independent activities to most likely be the ocular motor muscles producing the well-known bi-ocularly synchronous ocular motor micro-tremor of the eyeballs (Eizenman et al., 1985
; Spauschus et al., 1999
) which to our knowledge has not previously been isolated from scalp EEG signals.
Spectral Analysis
For each subject, the ∼16 (range, 9–31) identified brain-IC activations from emotion imagery periods were separated into 75%-overlapping 2-s Hanning windowed time windows and then transformed into individual frequency power spectra by fast Fourier transform. The 512-point time windows were zero-padded to 2560 points to give frequency bins with 0.1-Hz spacing. These were then re-sampled to 370 approximately quadratically-spaced frequency bins between 3 and 125 Hz. The power values were converted to log power and mean log power at each frequency (across the roughly 865 to 9,500 data windows for all 15 emotions) was subtracted from each single-window spectral power estimate. The resulting time series of log-spectral deviations were concatenated, giving a matrix of size (t, c *f), where t is the number of time windows (865–9500), c the number of subject ICs used in the analysis (between 9 and 31), * means ‘multiplied by’, and f the number of frequency bins (370). The size of this matrix varied across subjects according to the lengths of their imagery periods and the number of ICs included in the analysis. For each subject, this matrix was reduced to its first 41–76 principal dimensions (53.5 ± 10, mean ± SD) by PCA such that each decomposition contained twice as many frequency bins (times number of ICs) as the square of the number of principal dimensions. The resulting principal subspace accounted for between 26% and 55% (34.7 ± 5, mean ± SD) of the original log-spectral data variance.
Log-Spectral Decomposition
The dimension-reduced log-spectral data were then decomposed by extended infomax ICA to find independent modes of log-spectral power modulations or co-modulations across one or more ICs. Below, we refer to the resulting modulatory factors, modes, or processes as IM processes, which each act multiplicatively on the activity spectra of one or more of the brain-IC processes separated from the recorded EEG scalp signals by ICA. The EEG model underlying this analysis is illustrated schematically in Figure 1
, in which two IM processes are shown schematically as discs placed in the brainstem region of the cartoon head. In fact, several arousal or event valuation neuromodulator systems centered in the brainstem are known to modulate cortical field spectra. While the log-spectral decomposition introduced here might separate the influences of such systems on the scalp EEG, there is no guarantee that the IM processes derived statistically from the data need reflect the actions of these or other individual physiological systems; establishing any such suggested linkages would require further and more specific experimental testing.
The log-spectral ICA decomposition of the dimension-reduced IC spectral variability over time returns a spectral unmixing matrix. The inverse of this matrix (the spectral mixing matrix) gives the relative projection weights for each IM to each PCA dimension. These can be expanded into window time series by multiplying the ICA mixing matrix by the pseudo-inverse of the dimension-reduced PCA eigenvector matrix.
The decomposition also returns a matrix of ‘templates’ containing the relative modulatory effects of each IM on all IC spectra. Multiplying the inverse ICA and pseudo-inverse PCA weight matrices with a single IM template produces a back-projected data matrix whose columns estimate the strength of IC log-power fluctuations across time windows (rows) of one IM process. Thus, IM decomposition models principal IC log-power spectral fluctuations as weighted sums of IM process influences, or equivalently, models IC power spectral fluctuations as exponentially weighted produced of IM influences.
Note that an alternate approach beginning with conversion of the single scalp channel data to power or amplitude, then applying ICA and spectral ICA decomposition, would fail to separate distinct sources mixed linearly in the scalp channel data, since taking amplitude or power is a nonlinear operation that cannot be undone by any linear inverse method including ICA and linear inverse source localization methods.
IM Model Derivation
The decomposition of spectral modulations using ICA assumes that the matrix of spectral activities, S, of each IC (c) in each time window is multiplicatively affected (scaled or gated) by the exponentially-weighted product of some number, N, of IM processes whose (template) patterns of log-linear effects on each IC spectrum are given by templates comprising the rows of matrix T. Each of the IM templates scales power in some portions of the IC baseline spectra, B, the strength of these modulations given by a matrix of the scalar exponents, W, associated with each IM, IC, and time window. The magnitudes and polarities of these weights determine the extent to which the N IM templates, T, produce fluctuations in the IC power spectra, S.

where Sc,t is the power spectrum of IC c in time window t, Tm is the template of IM m in window t, Wm,t is the frequency vector of weights for IM m in time window t, and Bc is the mean power spectrum of IC c across time windows. Taking the log of both sides gives the IC log-power spectrum, S, of IC c in time window t.

The log-spectral deviation (D) from the mean power spectrum of c in time window t is

This equation can be written to include all factors, ICs, and time windows as matrix equation

Here, D is the matrix of log-spectral deviations from log-spectral baseline with dimensions (windows by ICs*frequencies). The columns of matrix W, of dimensions (windows by IMs), give the time-window weights. The rows of matrix T, of dimensions (IMs by ICs*frequencies), give the templates of spectral modulation of spectral power across ICs and frequencies. For computational tractability, the height of matrix D may be reduced by PCA before ICA decomposition. The index t in Eqs. 1–3 above then ranges over the retained principal dimensions.
Physiologically, baseline power, B, resembles a power-law function (Robinson et al., 2001
), B ∝ fa. If a template, T, rises log linearly with frequency with a slope b, Tf ∝ fb, then T will transform B → Tw B ∝ (fb)w fa ∝ f(bw + a), a power-law function of frequency, f, in which the IM weight, w, adjusts the power-law exponent (bw + a).
We have reported previously (Onton et al., 2005
) an alternate form of log-spectral ICA decomposition that we call ‘TW’ (‘templates by weights’), which should be distinguished from the current ‘WT’ (‘weights by templates’) decomposition. In the former (‘TW’) decomposition of spectral variability in a single IC cluster, temporal independence of the modulator time courses was maximized across time windows (as in the initial ICA decomposition of the time-domain scalp data). In the present ‘WT’ decomposition, however, the independence maximized by ICA is of the IM templates across ICs and frequencies. That is, ICA here separates the spectral variability into maximally distinct patterns or modes of frequency modulation across spatial source (IC) locations and spectral frequencies. In ‘WT’ spectral decomposition, therefore, the estimated IM time courses themselves may be correlated and/or otherwise mutually informed.
Note that performing log-spectral decomposition on individual scalp channel data would not have the same utility, since taking log power is a nonlinear transform and therefore the log-power spectrum of an electrode signal (summing a number of brain and non-brain source projections) is not equal to the sum of the log spectra of the source projections themselves.
Generalization of this method to EEG data collected under different experimental conditions is quite possible when the numbers of ICA components and time windows are compatible with those presented here. In an event-related paradigm, the width and update interval of the moving spectral window might be adjusted to a higher temporal resolution. In fact, from preliminary testing, it appears that increasing the temporal resolution (thus creating more rows in the decomposition matrix) slightly improves the signal to noise, even when the number of columns in the matrix remains constant. Typically, in temporal ICA decomposition, adding more channels (i.e., rows) requires more data points (EEG samples). However, in the current analyses, as few as 9 ICs × 370 frequencies (=3,330 columns) were used in a 41-dimensional decomposition (reduced by PCA from 3,081 original rows) subject decomposition with no marked differences in the resulting IMs from other subject decompositions.
The choice of a multiplicative model for the IM processes is both mathematically convenient and also appears biologically plausible, at least within some limited range of exponential weights. Typically, neuromodulator processes are not assumed to add to or subtract de novo activity from the ongoing local field spectra, but instead are here modeled as multiplicatively scaling up or down the amplitudes of particular ongoing spectral activity modes whose frequency profiles and time-window weights may be recovered by the log-spectral ICA decomposition.
Note that there appears to be some contradiction between the concepts of ‘independent’ component processes (ICs) and ‘amplitude co-modulated’ processes (co-modulated by one or more IMs), since co-modulated processes cannot be truly independent. Mathematical investigation shows, however, that infomax ICA should correctly separate and identify co-modulated but otherwise independent processes when their probability density functions resemble typical brain source ICs (Palmer and Makeig, 2010
).
IM Template Clustering
For most applications, it should be most advantageous to incorporate only ICs with putative brain generators to increase the number of brain-process IMs recovered. However, to test separation of high-frequency muscle activity from similar broadband activity patterns found in brain ICs, we also tried including selected scalp muscle and ocular motor ICs in the subject log-spectral decompositions.
To find common patterns of spectral modulations across subjects and IMs, all spectral IC template patterns (from the ‘T’ matrix above) whose root-mean square (RMS) amplitudes were at least 50% of the largest RMS IC template for each IM were collected for clustering. The histogram of RMS values was skewed towards the lower values with a median of about 0.19 and therefore a 50% cutoff resulted in inclusion of 13.5% of all IM templates. By this criterion, each IM affected between 1 and 31 ICs (3.3 ± 3.2, mean ± SD). Each subject contributed, on average, 121 IC frequency templates (∼53 IMs × ∼3.3 ICs), yielding a total of 3872 IC templates (∼121 templates × 32 subjects) for clustering.
To cluster IMs with broadband templates, we first isolated all IC templates that had a maximal multiplicative (dB) effect above 35 Hz. Next, we eliminated templates without a clear spectral pattern and with strength of less than 2.5 activation units at all frequencies. Using correlation between all IM template vectors to calculate the linkage between input templates (Matlab pdist() followed by linkage()), we then constructed a dendrogram (using Matlab dendrogram()) with branching set to yield 100 small clusters of IM templates. Clusters with noisy and inconsistent templates were eliminated and IM templates were again collected into a single group. This group of broadband IMs from all subjects was then separated into brain, scalp muscle and ocular motor ICs according to the criteria outlined above. Brain ICs with broadband gamma modulation were found to be localized to the areas indicated in dipole density Figure 9
. Individual subjects varied as to the number and locations of their broadband IMs. Inter-subject variability was not influenced by button-press group assignment, so all subjects were grouped together in Figure 9 and further analyses.
Other clusters with maximal effects in the theta, alpha and beta frequency ranges were also recovered by similar methods and were similarly consistent across subjects; further details will be reported elsewhere.
Multi-Dimensional Scaling of IM Weights
To assess the behavioral relevance of high-frequency broadband IMs, for each subject a separate decomposition was performed, identical to that described above but without including scalp muscle and ocular motor ICs. The resulting IM templates included similar broadband IMs that were clustered as above. Inspection of the time weight histograms for each broadband IM during each emotion period suggested that the median weights for each emotion period could capture the strong and clear differences between emotion periods in some IM activities. Broadband IM time weights from this second decomposition were therefore separated by target emotion, for which median time weights for each IM and emotion were computed. To minimize the effects of any non-stationarities in the brain dynamics and imaginative experience of the subjects within each few-minute emotion period, all further analysis was performed on the emotion-period median weights.
By this method, between 1 and 8 high-frequency broadband IMs (4.8 ± 1.7, mean ± std) were identified for each subject. Together, these median weights across subjects formed a matrix of 15 (emotions) by 154 broadband IMs. This matrix was submitted to the pdist() function in Matlab to create a correlation distance between each pair of emotions. The emotion pair distances were then modeled using non-metric multi-dimensional scaling (MDS) using Matlab’s mdscale(). Non-metric MDS represents the location of each emotion in a low-dimensional space (here, two dimensions) so as to best preserve the monotonic ordering of inter-pair distances.
Subject Reports
At the end of the EEG experiment, each subject filled out a written questionnaire, indicating their overall degree of perceived authenticity and intensity of their emotional experience (1–9, ‘not very’ to ‘very’), the quality of their overall experience (from 1 = ‘negative’ to 9 = ‘positive’), and the extent to which they felt they had ‘genuinely embodied’ each emotion. Their mean response to these questions was 6.9, with mean ratings for the experience of individual emotions in the range 5.6–7.3. Subjects’ overall rating of the authenticity of their experiences (‘How genuine?’, mean 7.2)was slightly higher than their rating of intensity (‘How intense?’, mean 6.4, p = 0.01).
They also wrote brief descriptions of their experiences of each emotion. For example, for ‘love’ several subjects’ descriptions resembled this one, ‘I felt the experience of being in the arms of the one who loves me, the absolute bliss of being consumed by my affection as well as surrounded by it.’ For ‘awe’, several subjects described imagining viewing the Grand Canyon, one writing, ‘I recalled watching a sunset at the cliffs overlooking the ocean. I also recalled the vastness of the Grand Canyon and how small I felt in comparison.’ For ‘frustration’, one subject said, ‘I imagined sitting in traffic and I had to get somewhere right away. I couldn’t do anything to change or help my situation. I also imagined a test and not knowing how to do the problems.’ Only 40 of 32*15 = 480 ratings were less than 5 (on a 1–9 scale). The emotion the subjects reported being least able to ‘embody’ was ‘jealousy’ (z = −0.8, significantly different from 7 other emotions by ANOVA, p < 0.01). ‘Jealousy’ was also the emotion most often mentioned as the hardest to experience, with one subject saying, “(I) thought this would be easier, but had no severe real-life instance to use, and imagining being cheated on didn’t work because that is so deep, seems not possible.” The emotions most often mentioned as the easiest were sadness, anger, happiness and love. Thus, subjects generally reported having been able to immerse themselves in a genuine experience of all or nearly all of the 15 emotions.
Representative Results
Figure 2
shows effects of 14 IMs on 10 (of 16) ICs entered into the log-spectral decomposition for one subject. Each row represents one IM and each column one IC. Note that IM3 clearly modulates only IC33, while other IMs (i.e., IMs 2, 20 and 6) co-modulate the spectra of two or more ICs. Note, in the examples shown here, that the non-zero IC spectral templates forming a single IM affect quite similar frequencies. The ICA decomposition itself is in no way constrained to produce templates with such correlated templates, but simply detects frequencies from any IC(s) that co-vary in a manner maximally distinct from other IC/frequency power variations. Only in rare cases did a single broadband IM both up-regulate and down-regulate activity across the same frequencies in different ICs (not shown).
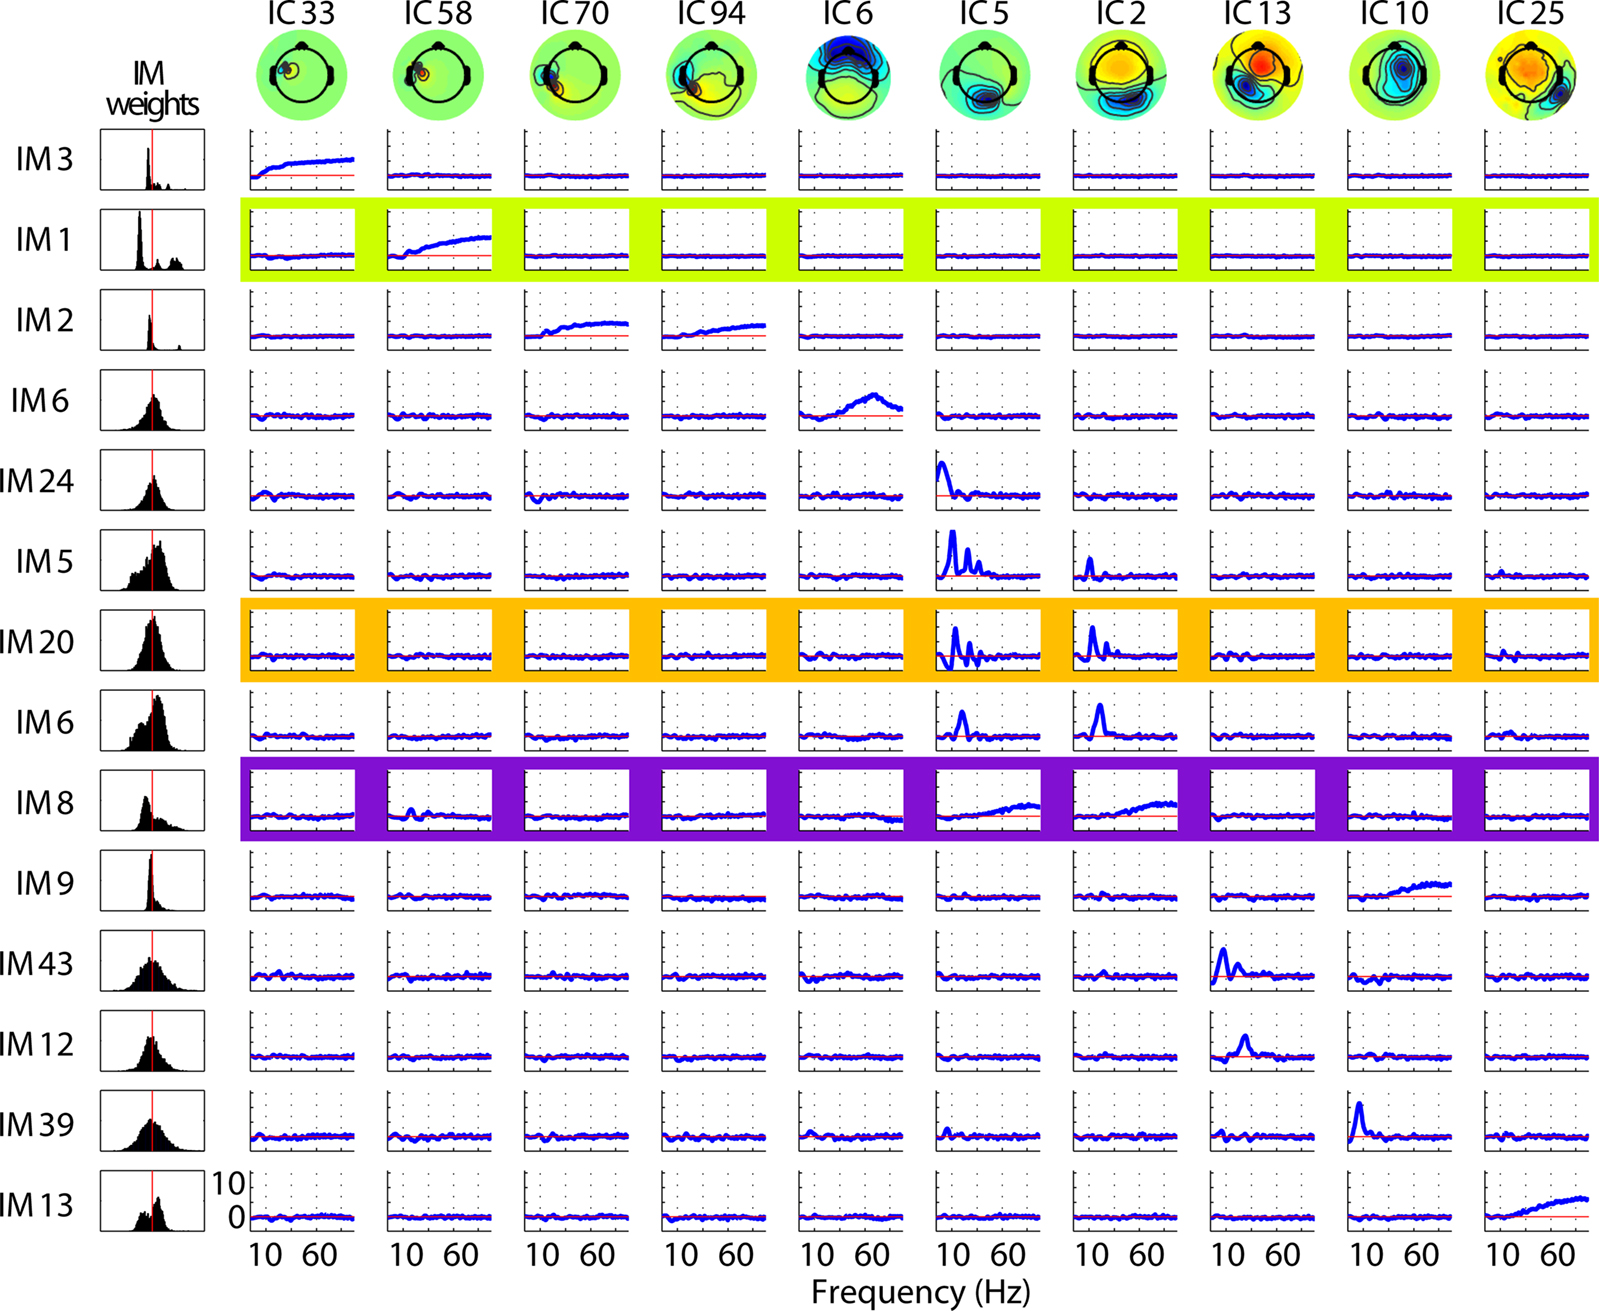
Figure 2. Typical single-subject decomposition of log-spectral power modulations across an hour-long experimental session. The 14 IMs visualized here (14 rows) represent major classes of spectral modulation of 10 of the 16 ICs (rightmost 10 columns) entered into the log-spectral decomposition for this subject. The leftmost column shows histograms of the time-window weights for each IM. The top four IMs (IMs 1–3, 6) are examples of broadband modulators indexing EMG activity. ICs (IMs 1–3) and a putative ocular motor IC (IM6); note the EMG IMs’ multi-modal weight histograms (left). The other IMs (below) affect only brain ICs, either with a broadband pattern (IMs 8, 9, 13) else either predominantly in the theta (IM24), alpha (IMs 5, 20, 39, 43), or beta (IMs 6, 12) frequency range.
Broadband modulations of muscle IC activities (leftmost columns: ICs 33, 58, 70, 94) do not affect broadband or high-frequency power in brain ICs (e.g., IMs 1–3, 8, 9, 13). Likewise IM6, the gamma-band peaked modulation process that may index ocular motor tremor (IC6), does not modulate power in brain-ICs. Narrow-band modulations of brain ICs in the theta, alpha and beta frequency bands also do not affect ICs associated with ocular motor or scalp muscle activity (e.g., IMs 11, 12, 20, 22, etc). Lastly, broadband modulations of brain ICs (e.g., IMs 8, 9, and 13) do not co-modulate high frequencies in either scalp muscle or ocular motor ICs.
The left column of Figure 2
shows the distributions of time-window weights for each IM. Note that most brain IM weight distributions are unimodal, whereas the three (topmost) scalp muscle IMs have bimodal or multi-modal weight distributions, suggesting the action of qualitatively different regulatory systems.
Representative IM Effects
Figure 3
shows frequency spectra associated with maximum (red) and minimum (blue) power values of IMs 1, 8 and 13 (cf. Figure 2
), as they alter the mean log-power spectra (black) of ICs 58, 5, and 2. Here, the maximal influences of the various IMs (red, blue) can be seen as dB deviations from the mean IC log-power spectrum (black). Notice that broadband (EMG) modulations of scalp muscle activity (e.g., effects of IM1 on IC58) are larger than the effect of broadband IMs modulating brain ICs (e.g., effects of IM8 on ICs 5 and 2). Note also that IM20 (orange) modulates alpha band activity (and its harmonics) of occipital/parietal ICs 5 and 2, but not of scalp muscle activity ICs (e.g., ICs 33, 58, 70, and 94).
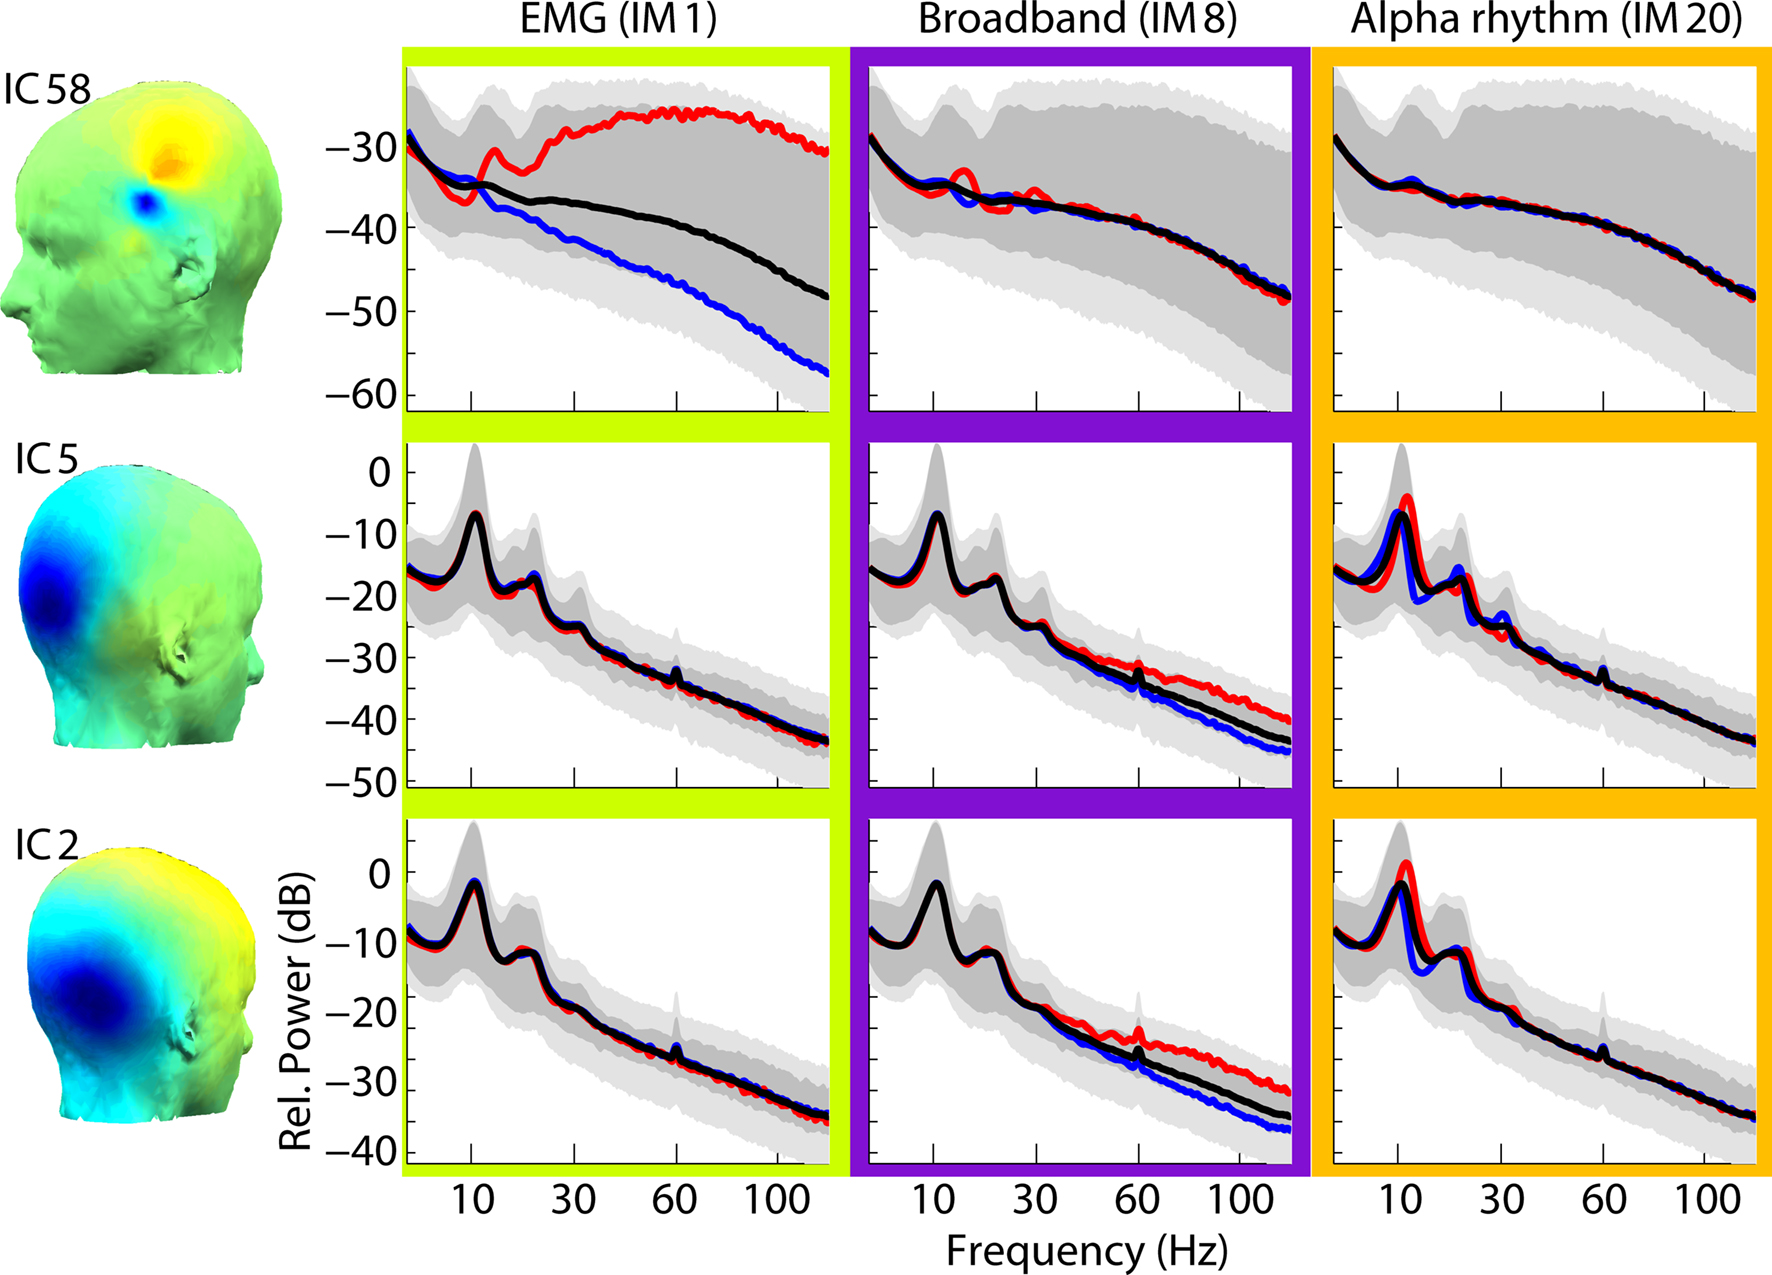
Figure 3. Effects of brain and muscle modulators on independent component spectra. Maximal effects of three IMs (columns) on the power spectra of three ICs (rows) are shown via their maximal (red traces), minimal (blue traces), and mean (black traces) log-power spectra. Outer light grey limits represent the 1st and 99th percentiles of spectral variation across all the 2-s windows during the session. Dark grey areas represent the 1st and 99th percentiles of the PCA-reduced spectral data. Note the much larger broadband IM modulation of an electromyographic IC (IM1 on IC58, upper left) compared to the separate but smaller broadband IM effects on brain ICs (IM8 on ICs 5 and 2, middle column). The effects of the upper alpha rhythm modulator (IM20) include shifting the peak alpha frequencies of IC5 and IC2 (blue versus red traces, right column).
The limits of the light grey shaded regions in Figure 3
show, for three ICs, the 1st and 99th percentiles of power at each frequency. Black traces show the mean IC log spectra. The limits of the PCA-reduced data are shown in darker grey. At some frequencies, the illustrated IMs account for the extremes of the darker grey area. For other frequencies, some portion of the variability of the PCA-reduced data is accounted for by other IMs (not shown). This decomposition illustrates the relative independence of scalp EMG and broadband brain IMs.
Broadband IM Clusters
Figure 4
shows that both brain and scalp muscle ICs exhibited monotonic broadband modulations with similar spectral patterns. However, in our data no broadband IM affected both scalp muscle and brain ICs. In the right three columns of Figure 4
, spheres represent the estimated positions of equivalent-dipole models of the affected ICs, co-registered to the MNI brain template (Montreal Neurological Institute), their color varying according to the RMS strength of their IM template relative to that IM’s highest-RMS IC. Purple spheres represent equivalent dipoles of ICs solely affected by an IM. Green lines connect spheres whose ICs were co-modulated by the same IM.
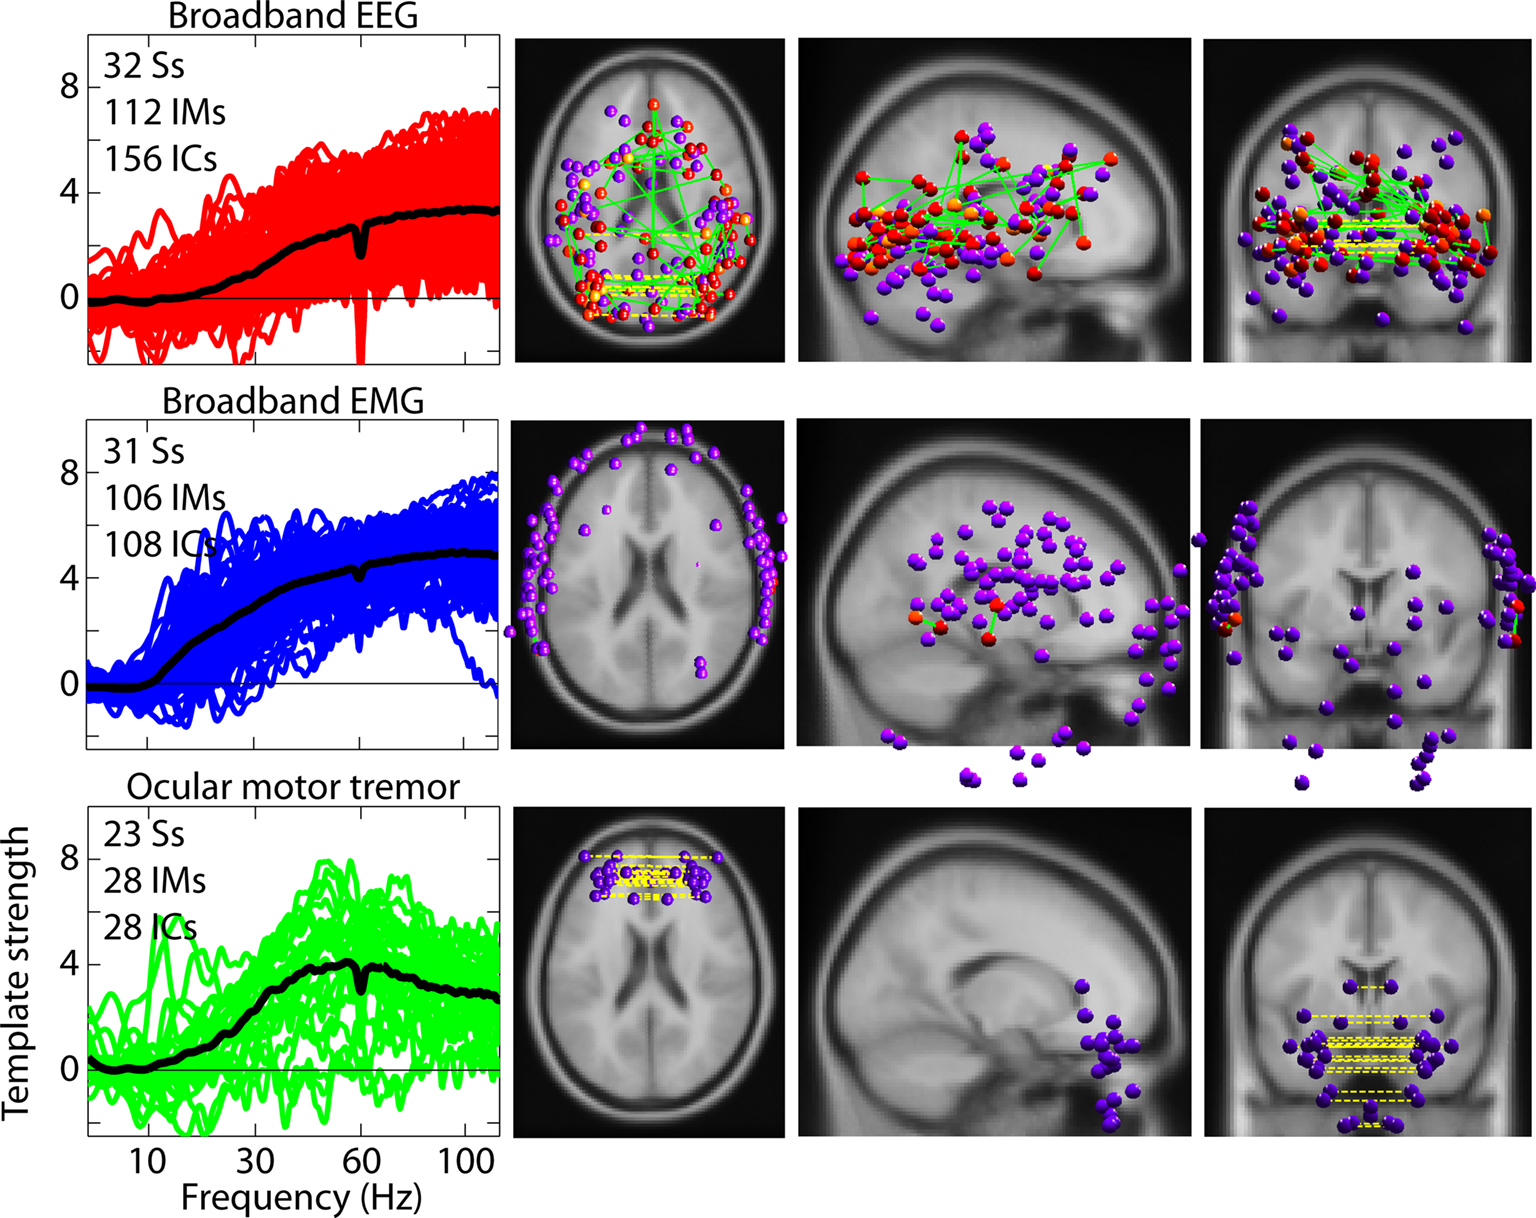
Figure 4. Broadband independent modulators of brain and scalp muscle components. Brain and scalp muscle ICs are separately modulated by IMs with similar broadband high-frequency templates (upper rows). The left column shows broadband templates for each IC category (black trace is the mean). The right three columns show equivalent-dipole locations of the affected ICs. A distinct cluster of putative ocular motor IMs, shown in the bottom row, have a peak effect near 50 Hz on ICs many of whose bilaterally symmetric equivalent-dipole models (bottom right panels) are located near the eyes. (ICs whose best-fit equivalent-dipole model comprised two bilaterally symmetrical dipoles are represented with a dotted yellow line connecting the dipole pair). Dipole locations for scalp muscle ICs are outside the brain volume (middle row). Green lines in dipole plots connect ICs co-modulated by the same IM and the colors of the dipole spheres (yellow to red) indicate the relative strength of modulation (yellow = 50%, to red = 100% of maximal). Purple spheres indicate individually modulated ICs.
Upper Frequency Limit of Broadband IM Effects
To determine the upper frequency limit of the broadband IM phenomena, we recorded and analyzed three additional experimental sessions recorded with an EEG sampling rate of 512 Hz. In each session, we again found broadband IMs whose upper frequency limits varied between 150 Hz and ≥256 Hz. Sample broadband IMs from one of these sessions is shown in Figure 5
.
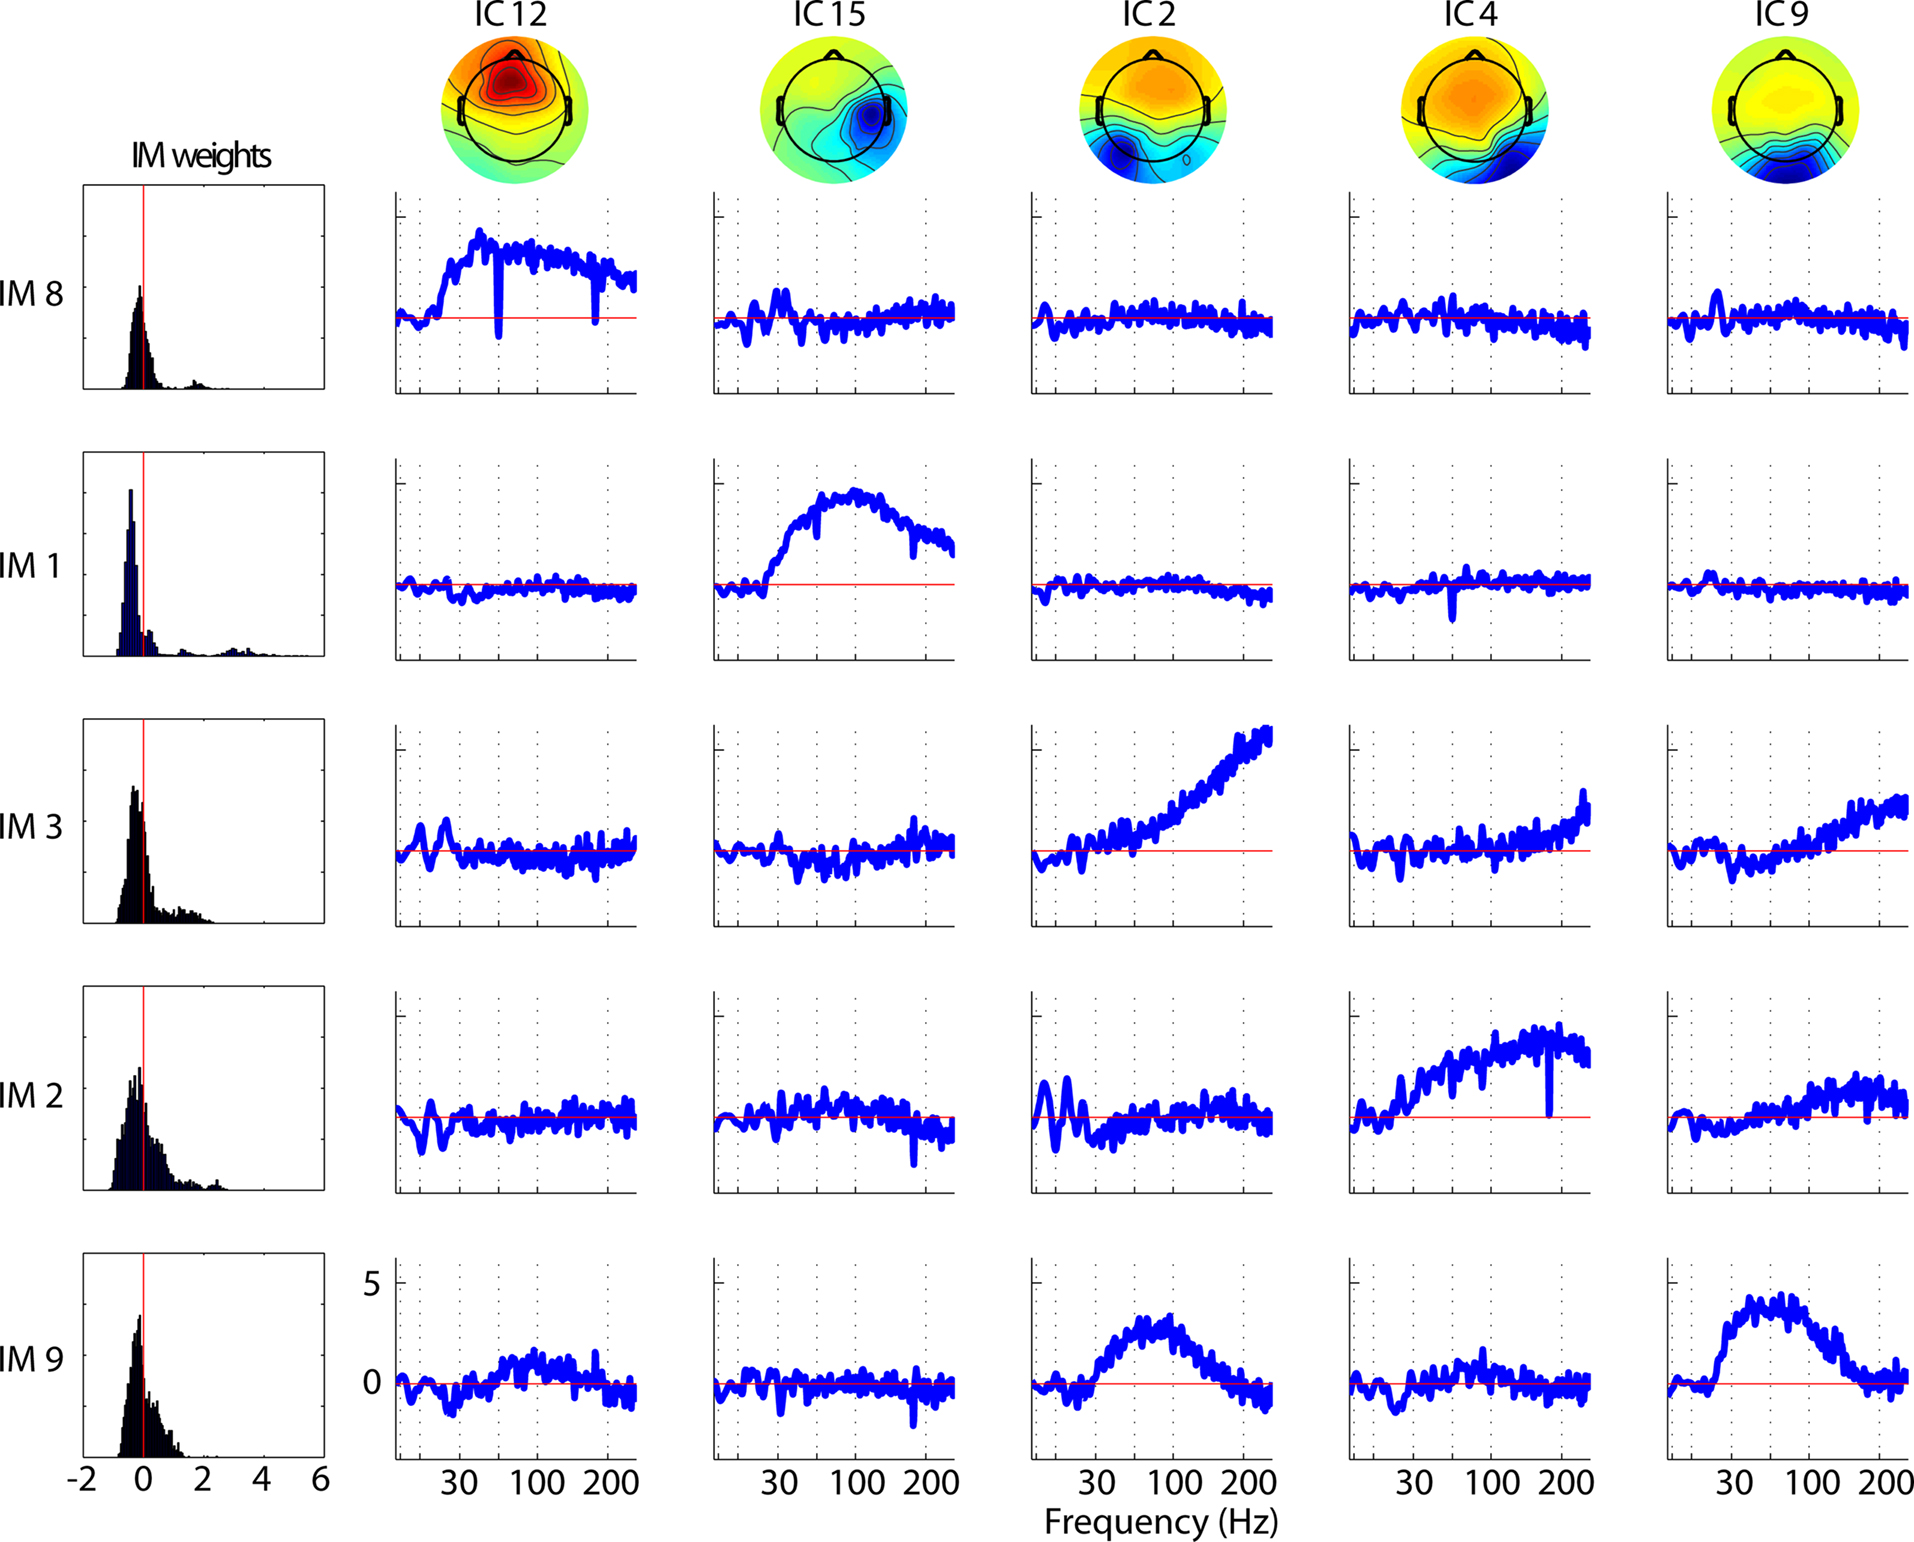
Figure 5. Broadband modulators of a representative data set with higher sampling rate. This decomposition of a data set acquired with a sampling rate of 512 Hz (from a different subject than Figure 2
) allowed an upper frequency analysis limit of 256 Hz, allowing examination of broadband patterns between 128 Hz and 256 Hz. Negative spikes at 60 Hz and 180 Hz in some templates are residual effects of 60-Hz line noise. Note that IM9 (bottom row) has no effect above 150 Hz, while the modulatory effect of IM3 (middle row) is still increasing at 256 Hz.
Correlations Among IM Time Courses
Since the independence maximized by the IMs in our analysis was between their frequency templates, not their time-window weights, the IM time courses were free to be correlated with one another in nearly any manner (though separate IMs could not be perfectly correlated or anti-correlated). Therefore, we computed within-subject temporal correlations between IM weights assigned to 11 brain IM clusters. Table 1
gives the within- and between-cluster correlation means and half inter-quartile ranges. In general, the number of significant correlations in any IM cluster pairing was low, where significance limits were determined by performing correlations using IM time course weights from different rather than the same subjects (p < 0.01). On average, 20% ± 13% (mean ± SD) of IM pair correlations within any cluster pair were significant by this measure. The time courses of broadband IMs were relatively more positively correlated with those of other broadband IMs (r = 0.15 ± 0.17, mean ± half inter-quartile range) than were the time courses of lower-frequency IMs with each other (p < 0.0001 by t-test). Also, the time courses of broadband IMs were weakly negatively correlated with those of lower-frequency IMs (r = −0.09 ± 0.07, p < 0.0001 by t-test; Figure 6
).
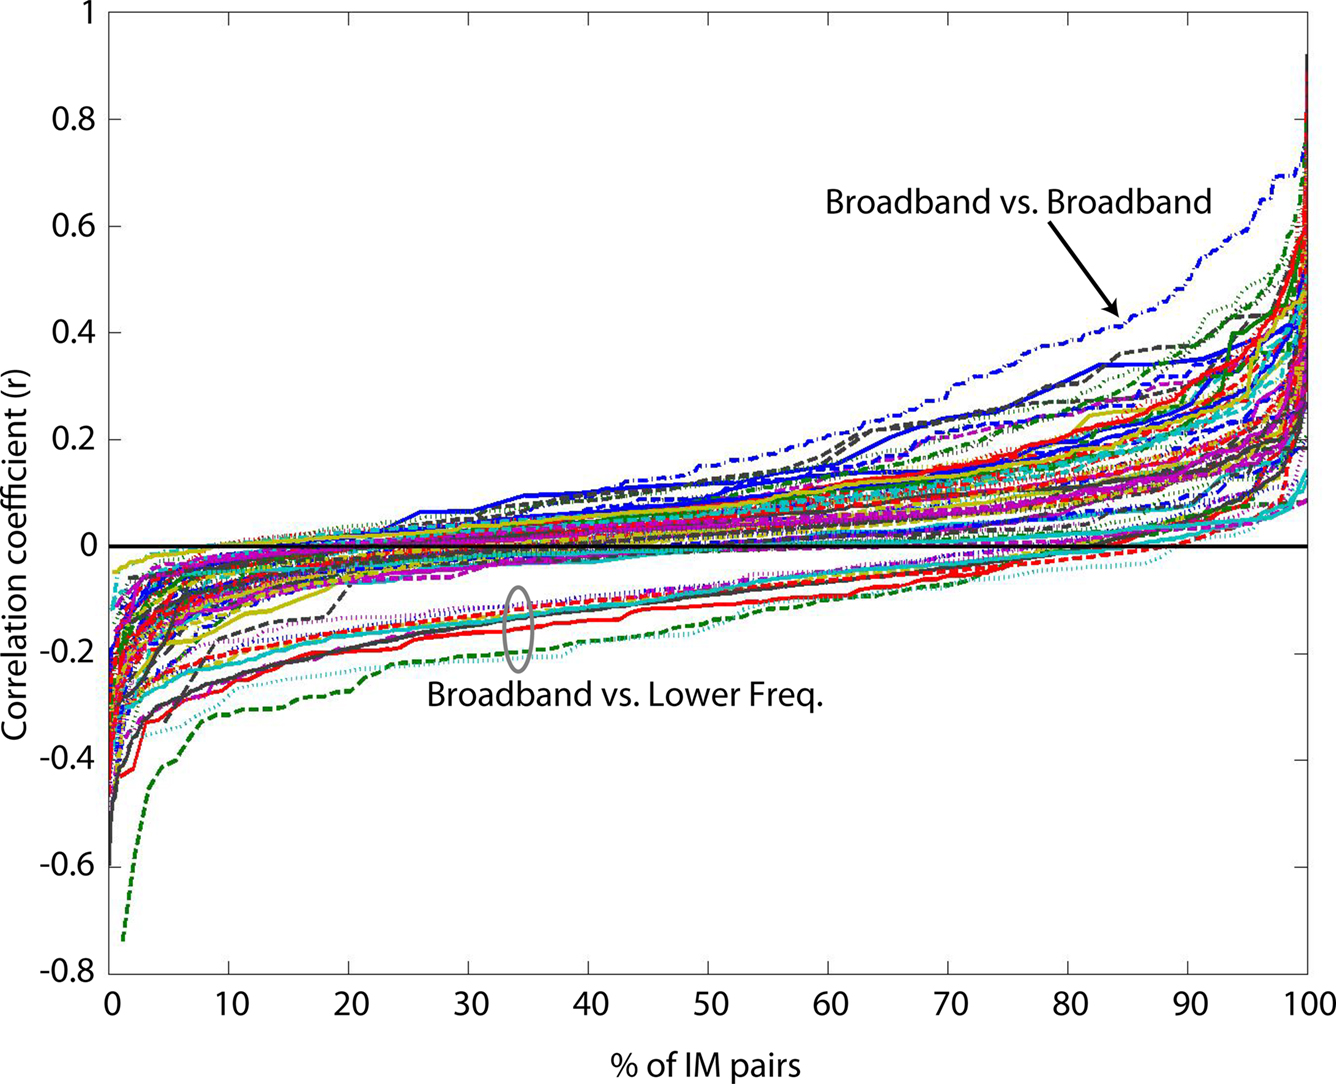
Figure 6. Value-sorted time course correlations of all within-subject IM pairs for each pair of IM clusters. Traces represent sorted correlation coefficients between time weights from pair-wise comparisons of 11 IM clusters, each point representing a within-subject correlation of two IM time courses over 14 emotion imagination periods (excepting ‘compassion,’ see main text). IM clusters affected spectral changes in Delta, low Theta1, high Theta2, below-peak Alpha1, at-peak Alpha2, above-peak Alpha3, low to high Beta1-4 bands, and Broadband high-frequency activity, respectively. See Table 1
legend for frequency-band limits. Most time course correlations were quite weak, but were typically positive between all lower-frequency IM clusters. Correlations for broadband versus broadband IM pairs (arrow) were more often positive than for any other IM cluster pairs. Correlations of broadband IM time courses with lower-frequency IMs (ellipse) tended to be negatively correlated, though nearly all IM time course correlations were weak (|r| < 0.4).
Behavioral Ratings
Figure 7
shows results of the web survey by 100 subjects of differences between the 15 emotion terms used in this experiment on two dimensions long found to characterize differences between affective connotations of emotion names and many other words, valence and arousal (Russell, 1980
). As expected, these results conform to common understanding and experience of these emotion terms, with love, joy, happiness, etc. rated as ‘positive’ valence (i.e., good) emotions, frustration, anger, fear, grief, etc. as ‘negative’ valence (bad), frustration, anger, joy and excitement as associated with relatively ‘active’ arousal, and contentment, grief, and sadness with relative ‘calm.’
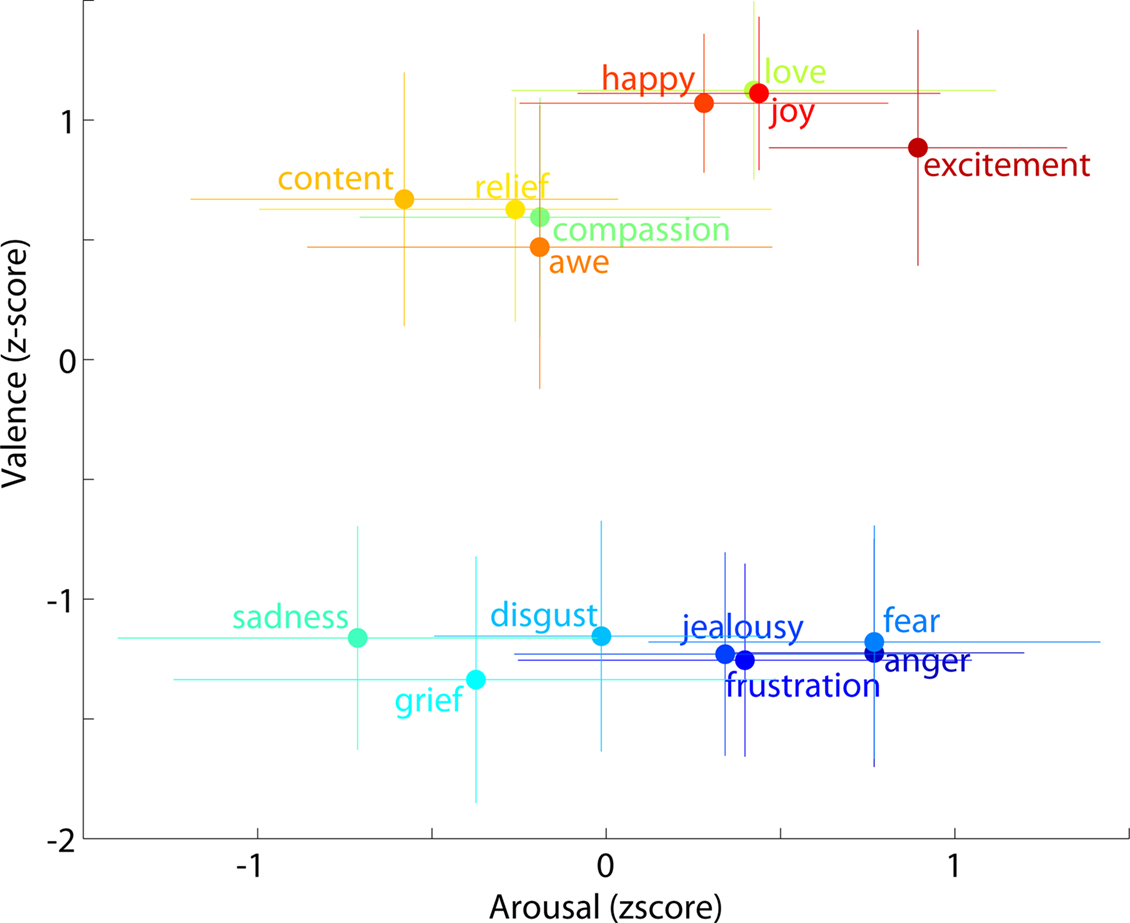
Figure 7. Mean behavioral ratings of the 15 emotion labels used in the experiment. Subjects rated each word on two scales: ‘Valence (negative-positive)’ and ‘Arousal (calm-active)’ labeled ‘Very negative’ (0) to ‘Very positive’ (10), and ‘Low activity’ (0) to ‘Stimulating’ (10), respectively, with the midpoint (5) indicated as ‘Neutral’ on both scales. Rating data were collected from 100 subjects via an anonymous on-line survey. Each emotion point represents the mean z-score and the error bars the standard deviation. Colors are applied from a continuous color spectrum and used simply to differentiate emotions from one another and do not reflect any objective metric or emotion grouping.
Behavioral Relevance of Broadband IM Effects
For all 154 broadband gamma (∼15–128 Hz) IMs were computed from a separate set of log-spectral decompositions (one for each subject) including only brain (non-muscle) ICs, median time-window weights during each of the 15 emotion periods. To look for structured relationships between emotions and changes in broadband IM weights, the resulting (15-by-154) matrix was reduced to three dimensions using non-metric MDS (Cox and Cox, 2000
). The resulting emotion distribution shown in Figure 8
arranged the 15 emotions in a near circular pattern in which emotions with negative valence were arrayed on the left, and emotions rated as positive on the right. In the MDS array of Figure 8
, similar emotions (‘joy’ and ‘happiness’, ‘sadness’ and ‘grief’, etc.) were located near to one another, and emotional opposites (e.g., ‘fear’/‘frustrations’ versus ‘relief’, ‘happiness’ versus ‘grief’/‘sadness’, etc.) opposed one another across the emotion circle. This arrangement of emotions based on high-frequency EEG measurements is in line with years of psychology research on the circumplex model of emotional space (Russell, 1980
).
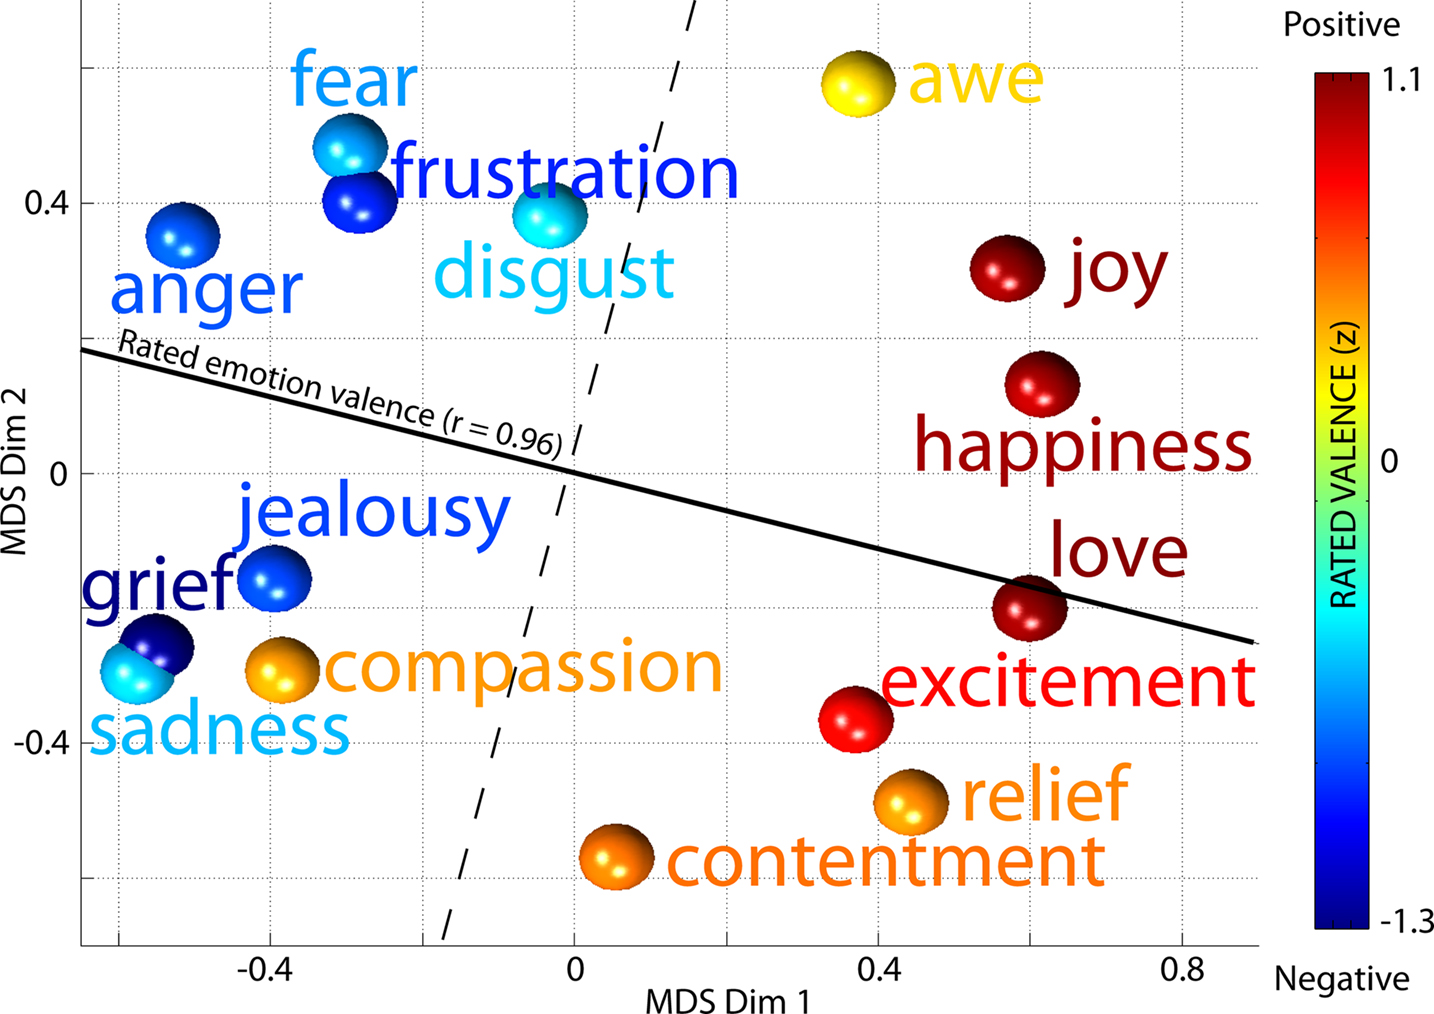
Figure 8. Multi-dimensional scaling of median time weights of broadband IMs for each emotion. Similarities between median IM weights in the 15 emotion periods, drawn from log-spectral decompositions for each subject of brain source ICs only, as represented in the best-fitting two-dimensional space by non-metric multi-dimensional scaling (MDS). Colors of the balls represent the mean behavioral ratings of (positive or negative) valence of the 15 emotion terms by a separate subject cohort. The solid line shows the best-fit regression direction (r = 0.96) predicting mean rated valence for each emotion term from its location in the 2-D MDS space solely based on IM weights after neglecting compassion (see text). The dashed line orthogonal to this cleanly separates positive-valence emotions terms (warm color balls) from negative-valence terms (cool color balls).
Note that in Figure 8
, the position of ‘compassion’ in the MDS array is much closer to ‘grief’ and ‘sadness’ than to other positive-valence emotions. While the term ‘compassion’ was consistently rated a ‘positive’ emotion by a separate cohort of non-EEG subjects, the EEG subjects experiencing the emotion reported imagining scenarios consistent with feeling pity or sadness for others. Thus their self-induced emotional experiences could well have been closer to ‘sadness’ or ‘grief’ than to any positive-valence emotion, as in Figure 8
. We therefore had cause to doubt that the behavioral ratings for ‘compassion’ fairly reflected the predominant experience of the EEG subjects; after eliminating ‘compassion,’ the correlation between positions in the MDS array and the mean behavioral ratings of emotional valence (i.e. along the solid line in Figure 8
) was r = 0.96, significantly higher than expected by chance (see Materials and Methods). The positions of the emotion terms in the MDS space were not significantly correlated (in any direction) with behavioral ratings of the remaining 14 emotion labels on the second major axis of emotional experience – arousal (Lang et al., 1993
).
Brain Sources of Broadband IMs
Equivalent dipoles of ICs affected by broadband IMs were distributed through inferior occipital and temporal cortices, as well as middle temporal and mid-frontal areas (Figure 9
).
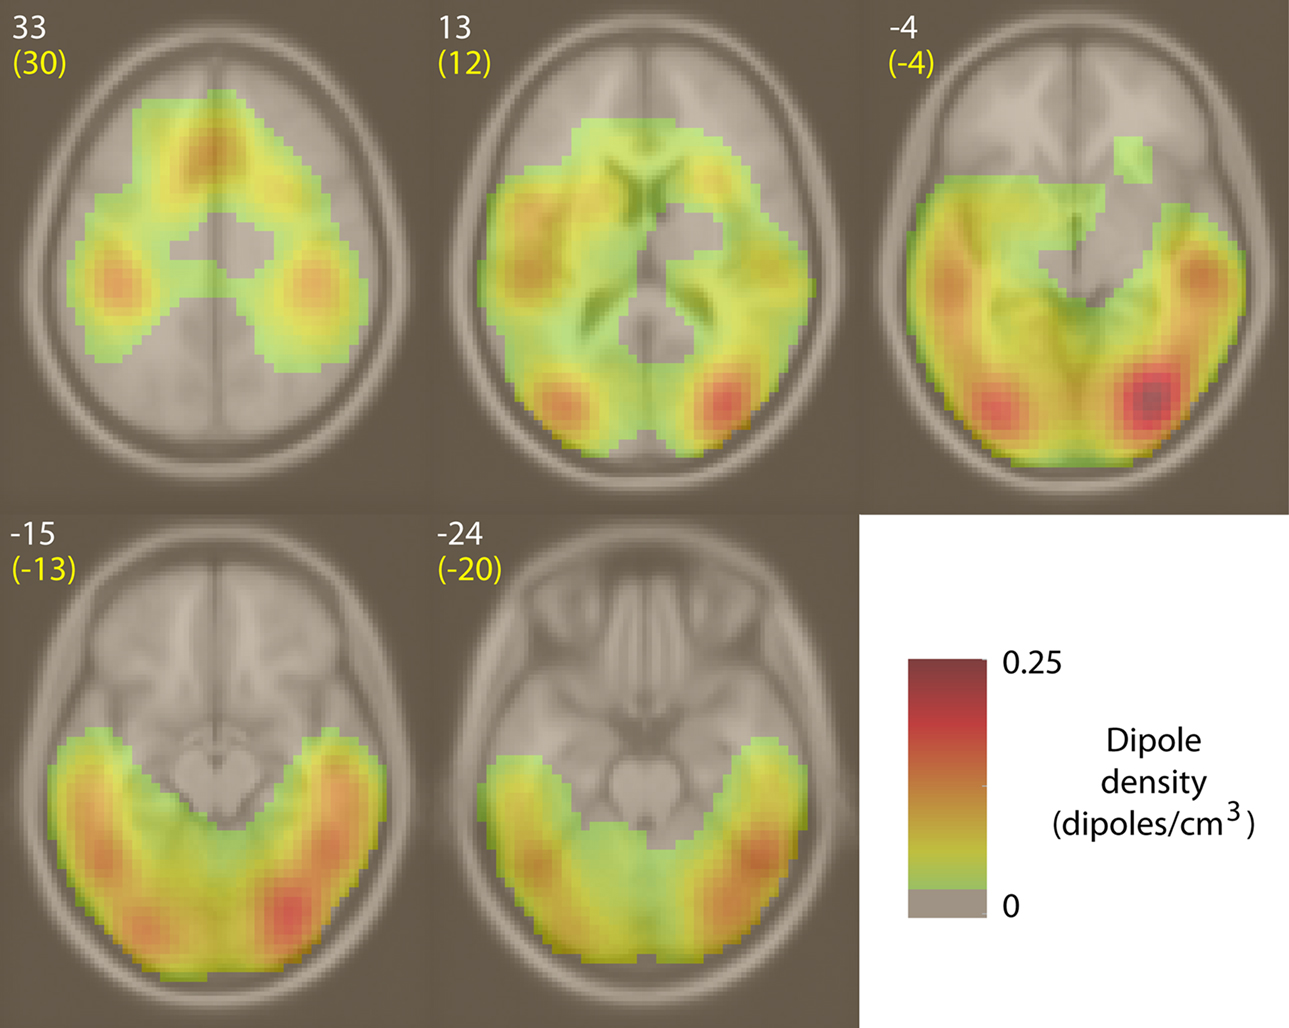
Figure 9. Equivalent-dipole density of ICs affected by broadband IMs. Spatial density of equivalent dipoles (in IC equivalent dipoles/cm3, for 154 broadband IMs from 32 subjects), obtained by convolving each dipole location with a 3-D Gaussian blur (1-cm SD) and then summing after normalizing for boundary effects. White integers above and to the left of each slice image give their standard MNI brain z-axis coordinates, yellow text the nearest Talairach z-axis coordinates. Here, figure left is brain left.
Regional Correlations with Valence
Next, we asked where in the brain median power changes occurring during emotion imagination periods were positively or negatively correlated with the behaviorally rated valence of the emotion labels. To construct Figure 10
, median weights for each broadband gamma IM were correlated with the rated emotional valence of each emotion term. Then, the locations of all IC equivalent dipoles significantly modulated by these broadband IMs (see Materials and Methods) were weighted by the absolute value of this correlation to create two correlation-weighted dipole density plots (in correlation-weighted dipoles/cm3) for positive and negative correlations, respectively. Figure 10
shows the difference between those two density images, masked for significance (p < 0.003, uncorrected) by randomly permuting positive and negative correlation values. IMs positively correlated with valence (i.e., ICs whose median IM broadband power was stronger during imagination of positive-valence emotions) were relatively dense in bilateral mid-temporal cortex (BA20/21), while IMs negatively correlated with rated emotional valence (i.e., ICs whose IMs exhibited larger power during imaginative experience of negative-valence emotions) were relatively dense in bilateral occipital cortex near to but not including the occipital midline (BA17/18).
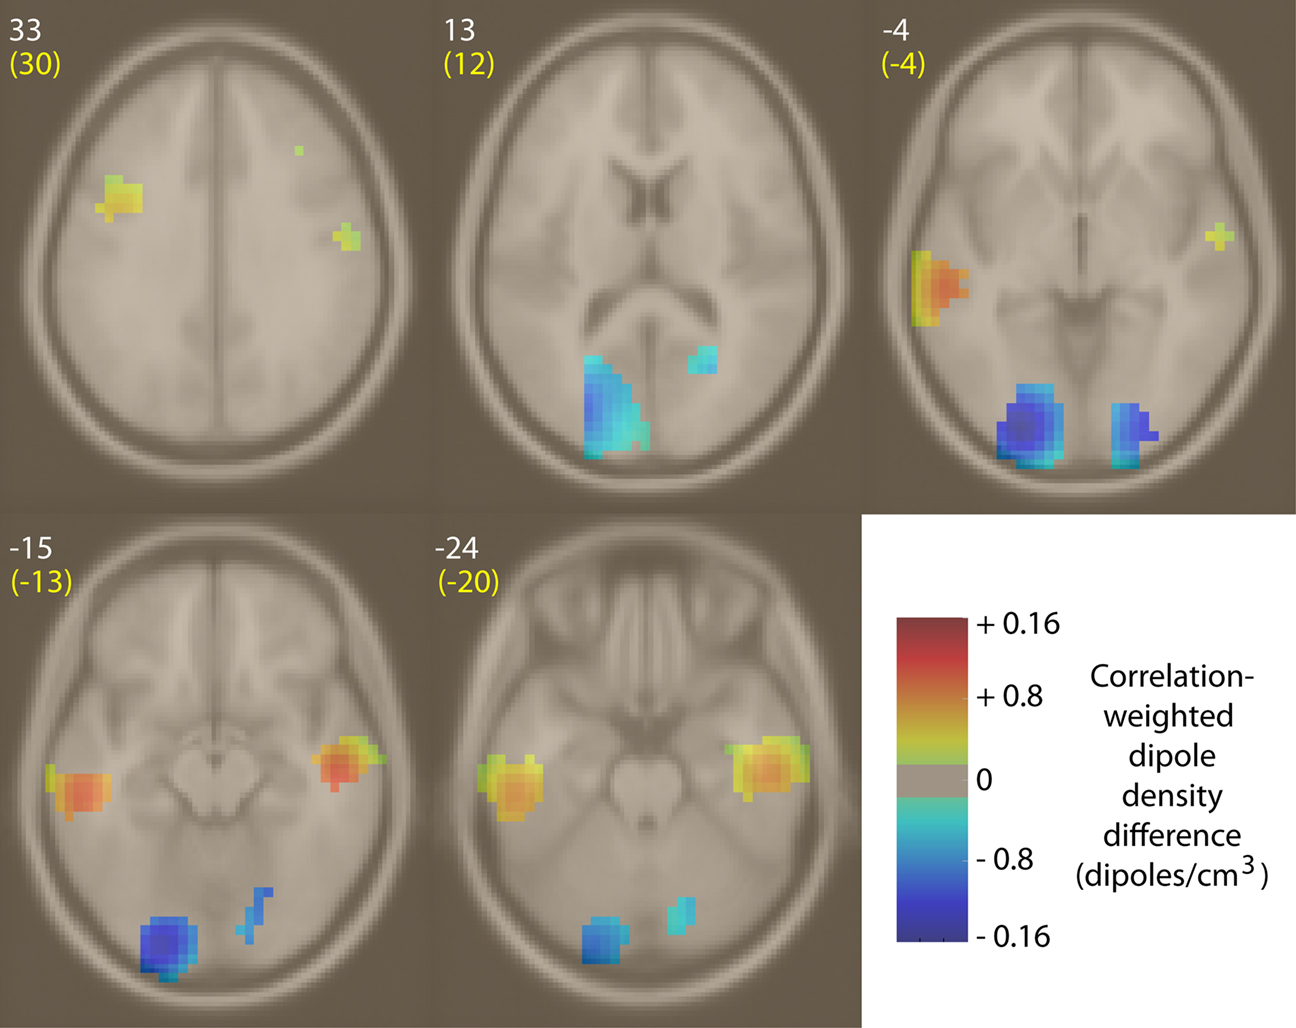
Figure 10. Difference between positive and negative correlation-weighted IC equivalent-dipole densities of IMs whose median weights, across 14 emotion imagination periods, were positively or negatively correlated with behaviorally rated emotion valence. Regions of non-significant density differences were masked using permutation statistics (p > 0.003, uncorrected). Areas of significant density difference between positive and negative correlation densities are colored yellow/red, indicating broadband power increases during positive-valence emotions, or cyan/blue, indicating broadband power increases during negative-valence emotions. White integers near each slice image give the MNI z-axis coordinates; yellow text, the nearest Talairach z-axis values. In these images, left is left. Weights for ‘compassion’ were not included (see text).
We have demonstrated that broadband co-modulation of beta-band, gamma-band, and high gamma-band power (Figure 4
), often localized to a single IC process, can be identified and separated from high-density scalp EEG data. To show this, we modeled log-spectral fluctuations of IC processes in EEG data as a set of distinct multiplicative spectral modulator processes. The results of these decompositions include a class of independent modulators concurrently up- or down-regulating power at all frequencies between ∼15 Hz and at least 128 Hz, though preliminary analyses (Figure 5
) suggest their effects may in some cases continue up to at least 256 Hz. Note that these broadband modulations may be termed a non-oscillatory aspect of EEG signals, one typically ignored in frequency-by-frequency analyses EEG data – the effects of broadband modulation being more akin to shifting a continuous whisper from ‘shhh’ to ‘ssss’ and back again, for example, than to varying the volume of a simple or complex oscillating tonal frequency.
The observation of broadband high-frequency modulation in EEG data is not novel. As Erik Edwards recently pointed out to us, perhaps the first EEG power spectra ever shown (by Grass and Gibbs, 1938
) contain low-amplitude broadband differences in high-frequency power between mean EEG power spectra averaged over consecutive 10-min intervals (Grass and Gibbs, 1938
). Furthermore, elevation of broadband high-frequency power in local field potentials was regarded early on as a key index of arousal linked to neuromodulator processes in the ‘reticular activating system’ (Moruzzi and Magoun, 1949
). Our method identifies this broadband modulation as a frequency-distinct mode of spectral modulation common to most independent brain source processes identified by ICA in our scalp EEG data.
Relation to Power-Law Scaling and Event-Related Gamma-Band Phenomena
Power-law (1/fα) spectra appear in many nonlinear systems and typically have a critical point (i.e., an α slope value) at which they are most sensitive to external influence. Around this point the response of the system external input is most sensitive to small changes in the spectral exponent (Linkenkaer-Hansen et al., 2001
). Thus, relatively small changes in broadband IM power (see Figure 3
) might have strong effects on the functioning of a cortical area within broader brain networks, if the baseline slope of the power spectrum is near a critical point. Critical power-law scaling of local field activity has been observed in isolated visual cortex (Beggs and Plenz, 2003
), and its existence predicted by recent biophysical models of cortical dynamics (Robinson et al., 2001
; Robinson, 2003
; Buice and Cowan, 2007
) (although Bedard et al. (2006)
have questioned whether it might appear simply from capacitive filtering effects of cell membranes in neuropile).
Recently Miller et al. (2009)
have demonstrated approximate power-law scaling in human intracranial electrocorticographic (ECoG) data (Miller et al., 2007
; Miller et al., 2009
). They used a PCA rather than an ICA data decomposition approach to extract a near-flat log-power modulation function from their log-spectral data and demonstrated the relative spatial specificity of broadband high-frequency modulations in stimulus event-related paradigms. By its nature and objective, PCA finds orthogonal (eigenvector) directions in the data that account, successively, for the most variance. ICA, by contrast, attempts to split the data into maximally distinctive components – here, into maximally distinctive frequency template patterns. The relative similarity of our results to those of Miller et al. support the joint conclusion that broadband spectral modulations are a common and distinctive feature of both scalp and intracranial EEG. Our ICA approach should separate the log-spectral data (whether scalp or intracranial) into modulatory processes with more frequency (and possibly functional) specificity.
In this regard, our failure to find modulations peaking in the (30–70 Hz) gamma band (other than putative oculomotor IMs, see below) is of interest, and contrasts to the results of investigations of stimulus attention-related gamma-band phenomena that exhibit sharper band peaks in the gamma band (Fries et al., 2001
; Lachaux et al., 2007
). We note, however, that most previous reports of gamma-band activity in human EEG and MEG have focused on activity evoked or induced by sensory stimuli, therefore using relatively short spectral time windows. Here, by contrast, we used relatively long (2-s) time windows in a non event-related paradigm without external stimulation. In exploratory work, we found that ICA decompositions of log spectrograms based on short time windows (<<1 s) included multiple IMs with peak activity in the gamma band, but also had an noisier character overall. Therefore, for this first report we chose not to further explore their possible functional relationships to the emotions.
Ocular Motor Tremor
In the eyes-closed EEG data of 23 of our 32 subjects, IM analysis revealed a striking pattern of spectral modulation that affected frontal power principally between 40 Hz and 100 Hz for a cluster of ICs with bilaterally symmetric scalp projections, many of whose equivalent-dipole models suggested sources in or near the ocular cavities. Because of our relatively sparse electrode coverage over the face and inaccuracies (most severe near the face) in the spherical head model used here to perform source equivalent-dipole modeling, we could not better localize the physiological sources of these IMs. The spectral modulation pattern of these IMs and their bilateral synchrony correspond well to observed dynamics of the tiny (0.1–2 μm) ocular motor tremor (OMT) that helps maintain retinal activity and visual perception (Eizenman et al., 1985
; Spauschus et al., 1999
). First described in 1934 (Adler and Fliegelmann, 1934
), the OMT is produced by extra ocular muscle activity driven from the ocular motor area of the brainstem (Coakley, 1983
) linked to the reticular arousal system and not dependent on the eyes being open (Prochazka et al., 1985
). Putative OMT IMs with peak effect in the gamma-band (as here, IM6), possibly indexing OMT, did not co-modulate activity of brain source ICs. Narrow-band modulations of brain ICs in the theta, alpha and beta frequency bands also did not modulate the spectra of ICs associated with either scalp muscle or putative OMT activity (left). Possibly, changes in OMT power in our data might be linked to changes in arousal and/or imaginative visualization, which engage similar brain systems as actual vision (Kreiman et al., 2000
).
Relationship to Arousal
The correspondence of arousal to complementary changes in broadband high-frequency ECoG power in animals was noted by Moruzzi and Magoun in their early influential paper on the brainstem ‘reticular activating system’ (Moruzzi and Magoun, 1949
). Complementary changes between power in low (near 3 Hz) and high (35–40 Hz) frequency EEG power in central scalp EEG, correlated with swings in behaviorally indexed alertness, were reported by Makeig and Jung (1996)
, an example of many studies that have sought correlations between high-frequency EEG power and alert behavior using frequency-by-frequency statistics, in contrast to the IM approach we report here. Thus, we here expected, and found, negative correlations between changes in broadband gamma IM power and concurrent power changes in other IMs affecting lower (≤35 Hz) EEG frequencies. However, these correlations (Table 1 and Figure 6
), while negative on average (p < 0.0001, t-test), were quite modest, as were the positive correlations among broadband IMs, meaning nearly none of the variability in broadband gamma IM power could be accounted for by a single central arousal factor. Further, no direction in the two- or three-(not shown) dimensional MDS representation of median broadband IM weights during emotion imagination (Figure 7
) was significantly correlated with behavioral ratings of the level of arousal (‘active’ versus ‘calm’) associated with the same emotion terms. Here, however, we had no independent measure, behavioral or otherwise, of moment-to-moment changes in subject arousal level, so cannot determine more exactly what proportion of broadband IM variance may be linked to fluctuations in subject behavioral arousal during the experiments. However, our results strongly suggest that the identified broadband gamma power modulations did not simply index overall arousal.
Use of Guided Imagery for Emotion Induction
A more common method of attempting to induce emotional states in psychological experiments has been to expose subjects to strongly emotion-arousing pictures (Wiswede et al., 2009
). This may often be effective for some negative-valence emotions (horror, disgust, lust, etc.), although a medical professional, for example, shown a startling picture of an accident victim’s injuries, might assume a detached professional point of view and not experience nearly the degree of palpable fear or disgust as viewers who had never experienced such emergencies. Emotional picture viewing is less successful for inducing positive-valence emotions and in general, for inducing the range of emotions experienced in everyday life (Kim and Hamann, 2007
), most likely because these emotions generally arise in connection with and refer to a variable context of personal connections and/or intentions that cannot be represented in a single picture. Moreover, viewers of pictures relating to everyday emotions (contentment, happiness, awe, jealousy, etc.) generally exercise a large degree of control over the emotional attitude and context they bring to the experience, thereby determining or strongly affecting the emotion they experience during its viewing.
The method of guided imagery (Bonny and Summer, 2002
), by contrast, explicitly enlists the active cooperation of the subject in imagining a scene and event context they personally associate with the target emotion. For example, if suggested to self-induce a feeling of awe, I might recall from experience my first extended look from the rim of the Grand Canyon in Arizona; asked to self-induce a feeling of compassion, I might imagine a dramatic scene in which I came upon someone suffering with whom I felt some emotional connection, etc. Verbal suggestions from another person (including, as here, recorded verbal suggestions) have long been found by storytellers, psychotherapists, and hypnotists to be effective in enlisting the active engagement of cooperative subjects (Bonny and Summer, 2002
). In post-session questionnaires, most subjects reported they were able to experience most of the suggested emotions, often expressing surprise as to the vividness of their emotional experiences. Here, we collected no other psychophysiological measures to verify the degree of experienced immersion and emotionality, for example galvanic skin response, though this measure might not be expected to differentiate between many of the emotion terms we used, particularly low-arousing positive emotions.
Subject and Emotion Variability
Although our short induction paragraph suggesting each emotion gave an example situation to illustrate our intended sense of the emotion term, we also encouraged subjects to select whatever imagined scene they felt would allow them to experience the suggested emotion most effectively. Therefore, we cannot rule out the possibility that the subjects might have both aimed and arrived at rather different experiences for the same emotion term and cannot dismiss the possibility that subjects may have in some cases experienced a mixture of more than one of the suggested emotions. In fact, we suggested this kind of explanation for the apparent EEG spectral resemblance of the experiences of ‘compassion’ to the same subjects’ experience of ‘grief,’ arguing that the scenes they chose to experience for ‘compassion’ might well also have involved feelings of ‘grief’ for the plight of another person. Finally, we did not attempt to use only those emotion terms that we felt were in some sense ‘orthogonal’ to one another. Rather, by using 15 common emotion terms, we hoped to over-sample from the space of common emotions, for example assuming that the physiological characteristics of the ‘joy’ and ‘happiness’ inductions would be closely related, as indeed proved to be the case (Figure 7
).
No doubt there were also considerable differences between our subjects in their degree of real-life experience of the suggested emotions. Only one subject asked to be excused from the experiment early, remarking that he did not believe he could perform the task but there was considerable variation in the emotions the subjects indicated in post-test questionnaires that they were less successful in experiencing (mean emotion ratings for all emotions were ∼ 6.5–7.25 (std ∼2), with the exception of ‘jealousy’ which had a mean rating of 4.9 as well as the largest standard deviation of 3.3).
Broadband Gamma Power and Emotional Valence
The emotional valence of a stimulus has been shown to differentially modulate many physiological variables such as heart rate (Lang et al., 1990
; Sammler et al., 2007
), facial EMG activity (Cacioppo et al., 1986
), brain blood oxygenation levels (Herrington et al., 2005
), and various aspects of the EEG (Cole and Ray, 1985
; De Pascalis et al., 1987
; Tomarken et al., 1992
; Muller et al., 1999
; Gemignani et al., 2000
; Brucke et al., 2007
; Guntekin and Basar, 2007
; Onoda et al., 2007
; Yuan et al., 2007
; Li et al., 2008
). Here, MDS of median broadband IM power in each emotion period showed that broadband power was linked to emotional valence, though IMs with positive and negative correlations with valence appeared in most brain regions, with the exception of left and right anterior temporal lobe, in which IM power was positively correlated with emotion valence, and near-medial occipital lobe, in which IM power was negatively correlated with valence (Figure 7
).
The previous EEG literature linking beta/gamma-band power to emotional valence (as measured in individual scalp channel records) is minimal and inconsistent. More than one study has reported increased gamma-band power over left-frontal electrodes during negative emotional stimuli (Muller et al., 1999
; Gemignani et al., 2000
; Guntekin and Basar, 2007
), whereas we found a consistently positive correlation between broadband power and emotional valence in anterior temporal sources. This discordance may only be an apparent difference, since signals in a wide brain territory may reach left-frontal electrodes. Cole and Ray (1985)
found increased (16–24 Hz) beta-band power (higher frequencies were not analyzed) at right temporal electrodes both during self-induced imagination of positive emotions and following presentation of positive-valence pictures and positron emission tomography revealed right temporal activation during imagined happiness relative to imagined negative emotions (fear and anger) (Damasio et al., 2000
). The negative correlation that we describe between the valence of imagined emotion and gamma power in the occipital region has not been previously reported in the EEG literature, though fMRI studies have reported bilateral occipital activation during self-referential processing of negative as compared to positive words (Fossati et al., 2003
). Clearly, further research using better EEG source localization and performing functional imaging experiments on the same subjects are needed to clarify the consistency of these initial results.
Possible Physiological Mechanisms
An interesting possibility to consider is that the broadband high-frequency modes of EEG spectral modulation, revealed here by log-spectral ICA decomposition, might reflect separate or coordinated actions of known cortical neuromodulatory systems identified with different neurotransmitters – acetylcholine, norepinephrine, dopamine, serotonin, etc. These are known to have extensive cortical and thalamic projections (Robbins, 1997
; Bardo, 1998
) and to strongly affect the power spectra of cortical field potentials (Pinault and Deschenes, 1992
; Swick et al., 1994
; Herculano-Houzel et al., 1999
). For example, application of the muscarinic agonist carbachol to CA3 hippocampal slices has been shown to induce delta, theta, and/or gamma-band oscillations, depending on its concentration (Fellous and Sejnowski, 2000
), and cortical high-frequency power in particular is known to be affected by projections from the cholinergic basal forebrain (Stewart et al., 1984
; Herculano-Houzel et al., 1999
). Similarly, extensive NE projections from the locus coeruleus (Jones et al., 1977
), in both awake monkeys (Swick et al., 1994
) and anesthetized rats (Berridge and Foote, 1991
; Brown et al., 2005
), also increase high-frequency local field activity in frontal cortex and thalamus (Pinault and Deschenes, 1992
). However, the broadband IM modes in this experiment might also reflect linked combinations of neuromodulatory or other influences rather than actions of distinct neuromodulatory systems. Further understanding of the physiological origins of the IM effects reported here will require separate experimental evaluation.
High-frequency local field power similar to that reported here has been reported to correlate with fMRI BOLD activation and deactivation in both theory (Kilner et al., 2005
) and experiment (Logothetis et al., 2001
; Niessing et al., 2005
; Shmuel et al., 2006
). At the neuronal level, a recent report showed that blockage of GABAA receptors in ferret pyramidal cells decreases spectral power of intracellularly recorded synaptic currents between 10 Hz and 200 Hz (Hasenstaub et al., 2005
), implicating the collective action of fast-spiking inhibitory cell networks in the production and regulation of high-frequency cortical field activity. Influences on cortical GABA concentration might thus provide a mechanism for the local and distributed broadband modulations of EEG source power spectra we report here.
The reported correlation between high-frequency local field power and BOLD signal level in human auditory cortex during auditory stimulation suggests a possible functional significance for high-frequency local field activity during active cortical processing (Mukamel et al., 2005
), as do the frequently reported linkage between increased high-frequency EEG power and attention (Fries et al., 2001
) or ‘focused arousal’ (Sheer, 1989
) and the results reported here. However, the frequently studied more narrow-band gamma-band sensory-induced responses (Singer and Gray, 1995
; Tallon-Baudry et al., 1996
; Freeman and Barrie, 2000
; Fries et al., 2001
) might be a quite different phenomenon or reflect in part a mixture of specific gamma-band and broad-band modulations.
Conclusions
Here we report that during eyes-closed imagination of emotional states and circumstances, many of the locally synchronous cortical field potential phenomena that produce scalp EEG activity exhibit a pattern of broadband, spectral modulation of beta, gamma, and high gamma-band activity from near 15 Hz to 200 Hz or higher. Our results demonstrate that high-density EEG data contains reliable high gamma-band activity that can be separated by ICA from spatially overlapping, large-amplitude broadband signals from scalp muscle and ocular motor activities, as well as from overlapping signals in lower-frequency bands. This finding further underlines the importance for EEG analysis of applying source separation by ICA or other methods.
Further, our results show that the actions of these broadband modulations of brain source activity spectra were related to the valence of the imagined emotions, albeit with individual differences in expression, a result that suggests further exploration and testing. Conceivably, better understanding of the modes and mechanisms of spectral modulation of cortical brain activity, requiring application of the methods presented here to many types of datasets, might allow design of multi-dimensional cognitive state monitoring using emerging dry, portable, wireless EEG systems (Lin et al., 2008
), and/or might clarify the brain mechanisms supporting learned volitional control of EEG spectral features as applied in current brain-computer interface (BCI) and EEG feedback research (Delorme and Makeig, 2003
).
Work presented here is neither submitted nor published elsewhere and all human subjects participated under informed consent in accordance with UCSD institutional review board requirements. The authors have no financial interest in the results presented here.
This work was supported by gifts from The Swartz Foundation (Old Field, NY) and by grants from the National Institute for Mental Health USA (R01 NS074293) and the National Science Foundation USA (IIS-0613595). The authors thank Jason Palmer, Lars Kai Hansen, Jack Cowan, Nima Bigdely Shamlo, Kai Miller, and Erik Edwards for helpful discussions, and Stefan Debener for manuscript suggestions.
Brucke, C., Kupsch, A., Schneider, G. H., Hariz, M. I., Nuttin, B., Kopp, U., Kempf, F., Trottenberg, T., Doyle, L., Chen, C. C., Yarrow, K., Brown, P., and Kuhn, A. A. (2007). The subthalamic region is activated during valence-related emotional processing in patients with Parkinson’s disease. Eur. J. Neurosci. 26, 767–774.
Whitham, E. M., Pope, K. J., Fitzgibbon, S. P., Lewis, T., Clark, C. R., Loveless, S., Broberg, M., Wallace, A., DeLosAngeles, D., and Lillie, P., Hardy, A., Fronsko, R., Pulbrook, A., and Willoughby, J. O. (2007). Scalp electrical recording during paralysis: quantitative evidence that EEG frequencies above 20 Hz are contaminated by EMG. Clin. Neurophysiol. 118, 1877–1888.