1
Theoretical Neurobiology, University of Antwerp, Wilrijk, Belgium
2
Volen Center for Complex Systems, Brandeis University, Waltham, MA, USA
3
Computational Neuroscience Unit, Okinawa Institute of Science and Technology, Okinawa, Japan
We recently reproduced the complex electrical activity of a Purkinje cell (PC) with very different combinations of ionic channel maximum conductances, suggesting that a large parameter space is available to homeostatic mechanisms. It has been hypothesized that cytoplasmic calcium concentrations control the homeostatic activity sensors. This raises many questions for PCs since in these neurons calcium plays an important role in the induction of synaptic plasticity. To address this question, we generated 148 new PC models. In these models the somatic membrane voltages are stable, but the somatic calcium dynamics are very variable, in agreement with experimental results. Conversely, the calcium signal in spiny dendrites shows only small variability. We demonstrate that this localized control of calcium conductances preserves the induction of long-term depression for all models. We conclude that calcium is unlikely to be the sole activity-sensor in this cell but that there is a strong relationship between activity homeostasis and synaptic plasticity.
Neurons are continuously evolving through rapid turnover of their basic transmembrane components (Kennedy and Ehlers, 2006
), synaptic plasticity (Abbott and Regehr, 2004
) or changes in their morphology (Segal, 2001
). Despite these ongoing modifications, the essential structure and activity of neurons and neuronal networks are incredibly stable over time, lasting for decades in humans. This ability to maintain stability, essential for life, is designated with the term “homeostasis”.
For neurons with many different types of voltage-dependent ionic channels, “intrinsic” homeostasis regulates channel conductance densities, i.e. the number of channel proteins in the cell membrane, so that the neuron intrinsic electrophysiological behavior remains stable (Marder and Goaillard, 2006
). This property has been observed in many different experimental preparations and studied in several computational models (for comprehensive reviews please refer to Desai, 2003
; Marder and Goaillard, 2006
; Turrigiano and Nelson, 2004
). However, the internal feedback mechanisms that precisely regulate the output activity of neurons are poorly understood (Davis, 2006
).
To maintain a constant output, a system needs one or several sensors that provide information regarding deviation from the target output (Davis, 2006
). Some experiments (Piedras-Renteria et al., 2004
) and models (LeMasson et al., 1993
; Liu et al., 1998
) hypothesized that the activity sensor is the cytoplasmic calcium (Ca2+) concentration. But, in many neurons Ca2+ ions play an important role in the induction of synaptic plasticity (Hartell, 2002
; Ito, 2001
; Konnerth et al., 1992
; Malenka and Bear, 2004
; Miyata et al., 2000
; Tanaka et al., 2007
; Wang et al., 2000
). In the case of Purkinje Cells (PCs), Ca2+ is essential for the induction of long-term depression (LTD), a learning mechanism fundamental for cerebellar motor control (Apps and Garwicz, 2005
; Ito, 2002
, 2006
; Koekkoek et al., 2005
). If the Ca2+ signal is also the activity sensor, there has to be interplay between intrinsic homeostasis and synaptic plasticity.
In a recent paper (Achard and De Schutter, 2006
) we constructed 20 PC models exhibiting similar electrophysiological activity patterns for very different ion channel conductance values. This finding matched experimental data (Swensen and Bean, 2005
), showing that in isolated somata of normal Purkinje cells the size of sodium and calcium currents contributing to bursting behavior varies a lot. Thanks to improved optimization techniques, we obtain here an order of magnitude more models, allowing us to study the implications of homeostasis for Ca2+ signaling.
This work argues for interesting relationships between the shape of the neuron, the channel distributions and Ca2+ signaling. We show that activity homeostasis is correlated with a stable Ca2+ input/output relationship in the spiny dendrites whereas the Ca2+ activity is much more variable in other parts of the cell. These results make the Ca2+ signal a poor candidate for global activity sensing in these cells. Conversely, the constrained Ca2+ signaling in the spiny dendrites led to a robust LTD induction in all models, which we demonstrate using an existing model of biochemical pathways (Doi et al., 2005
). This leads to the prediction that the ability to use a calcium signal to induce synaptic plasticity is an intrinsic property of PCs.
Original PC Model
The model PC is a multicompartmental model developed originally by De Schutter and Bower (1994a
,b)
. The dendritic tree is a reconstruction of a guinea-pig PC (Rapp et al., 1994
), discretized into 1600 compartments. These are divided into four physiological zones: the soma, the main dendrite, the smooth dendrite and the spiny dendrite. The model has the following 10 voltage-gated and Ca2+-dependent conductances: an inactivating and a persistent Na+ channel (restricted to the soma); P-type and T-type Ca2+ channels; an Ih current; a delayed-rectifier, a persistent and an A-type K+ channel; a high-threshold Ca2+-activated K+ channel of the BK type and a low-threshold Ca2+-gated K+ channel of the K2 type. Calcium dynamics are approximated by a fast decaying Ca2+ pool. The channel maximum conductances and calcium dynamics were manually fitted (De Schutter and Bower, 1994a
) to reproduce the firing properties in cerebellar slices (Llinás and Sugimori, 1980a
,b
).
Complex spike (CS) activity was simulated by activating AMPA receptor channels placed on each compartment of the main and smooth dendrite (De Schutter and Bower, 1994b
). These channels had an opening time constant of 0.5 ms and a closing time constant of 1.2 ms. No Ca2+ inflow was simulated through the synaptic channels as this is extremely low in PCs (Tempia et al., 1996
), therefore all CF evoked Ca2+ influx was voltage-gated. The CF activation was simulated as a volley, the synapses located most distally being activated 0.9 ms after the most proximal ones.
Generation of New Models
To generate models that reproduce as much as possible the electrophysiological input/output behavior of the original PC model (De Schutter and Bower, 1994a
), we used automated parameter search methods (Van Geit et al., 2007
). The model contains 24 maximal conductances of ionic channels that are the free parameters of the optimization algorithms. The match of a particular model, also called individual, with the original model was measured by phase-plane analysis of their electrophysiological responses recorded in the soma and smooth dendrite to different inputs (Van Geit et al., 2007
). These analyses were summarized in a distance value of arbitrary scale (the “error function” or “fitness function”), a perfect match corresponding to a null distance to the data.
In our previous work (Achard and De Schutter, 2006
), 9 independent populations of 57 individuals were optimized with an evolution strategy algorithm. To increase the statistical power of this study, we ran 8 additional populations of 60 individuals each. These 993 individuals had a mean distance = 4.7 ± 0.6. Then we submitted 429 of these individuals, including our previous 20 best matches (Achard and De Schutter, 2006
), to another search algorithm called Nomad (Audet and Dennis, 2006
; Rodriguez-Fernandez et al., 2006
) for a run of 100 evaluations each. This subpopulation improved its distance from 4.6 ± 0.7 to 3.3 ± 0.8.
Selection of the Best Models
To select only models that reproduced in fine details the target electrophysiological activity, we rejected models with a distance value above a given threshold. We chose a more stringent distance threshold (3.00) than in our previous publication (3.45) (Achard and De Schutter, 2006
) in order to increase the quality of the models. This allowed us to avoid manual rejection of a few models based on visual inspection of their firing properties as needed in Achard and De Schutter (2006)
. After this cut, 150 individuals remained in our selection.
To ensure that none the individuals found were belonging to the same region of the parameter space, we defined a separation function as  where a and b are two individuals, i labels the 24 currents, gi the maximal conductance of the current i and sdv(gi) the standard deviation of its distribution over the entire selected population. The separation distribution was nicely reproduced by a Gaussian. If a pair of individuals had a separation value below 12.2, corresponding to the mean separation minus 2.32 standard deviations, the equivalent of a one-sided 99% confidence level cut, then the individual with the highest distance value of the pair was removed from the selection and the separations were recalculated. Only two individuals were rejected by this iterative procedure and the remaining well separated 148 models constituted our final selection.
where a and b are two individuals, i labels the 24 currents, gi the maximal conductance of the current i and sdv(gi) the standard deviation of its distribution over the entire selected population. The separation distribution was nicely reproduced by a Gaussian. If a pair of individuals had a separation value below 12.2, corresponding to the mean separation minus 2.32 standard deviations, the equivalent of a one-sided 99% confidence level cut, then the individual with the highest distance value of the pair was removed from the selection and the separations were recalculated. Only two individuals were rejected by this iterative procedure and the remaining well separated 148 models constituted our final selection.Modeling of LTD Induction
A kinetic model of the Ca2+-activated biochemical pathways in a PC spine was simulated as described in Doi et al. (2005)
. In this model PF activation produces inositol triphosphate (IP3) which binds to receptors on the endoplasmic reticulum. This causes by itself little Ca2+ release. The subsequent voltage-gated Ca2+ influx triggered by CS activation potentiates the IP3 receptors, evoking release and a supralinear Ca2+ signal (Wang et al., 2000
).
In this model the spine volume was divided between the post-synaptic density, the cytosol and the endoplasmic reticulum. Ca2+ signal transduction pathways, including release from the endoplasmic reticulum through IP3 receptors, were simulated in full detail. PF inputs were represented by bursts of five pulses of Ca2+, IP3 was generated by pulsatile activation of metabotropic receptors. For CF inputs, we replaced the original square Ca2+ signal by the Ca2+ concentrations obtained during a CS in the spiny dendrite of the 148 PC compartmental models. However, as the original PC model computes the Ca2+ concentration in a thin submembrane shell while the Doi et al. (2005)
model simulates the entire cytosol of the spine, the CS evoked Ca2+ concentrations were divided by a factor 4 to match the more diluted Ca2+ influx of the Doi model.
To calculate the likelihood of the [Ca2+] rise causing LTD we required [Ca2+] to be above 4 μM for at least 100 ms. This is derived from the fact that a ramp-like stimulus of 500 ms required a peak [Ca2+] of 5 μM to achieve maximal LTD (Tanaka et al., 2007
).
Software and Hardware
Compartmental models of PCs were simulated with the Genesis software (Bower and Beeman, 1998
). Spiny Ca2+ pathways were simulated with the Genesis/Kinetikit package (Bhalla, 2002
). The parameters were optimized thanks to the Evolving Objects library (Keijzer et al., 2002
) and the Nomad library (Audet and Dennis, 2006
). The phase-plane analysis was done through a custom written C++ software, now publicly available and accompanied with optimization libraries under the name of Neurofitter (Van Geit et al., 2007
). Data were analyzed with the IgorPro 5.04b software (WaveMetrics Inc., Portland, Oregon).
PC simulations and optimization searches were performed on a cluster of 10 Apple 2.3 GHz G5 dual processor nodes.
Identical Electrophysiological Activity in 148 PC Models with Different Current Combinations
We generated 148 PC models with identical electrophysiological input/output behaviors. In line with our previous study (Achard and De Schutter, 2006
), we used the original PC model (De Schutter and Bower, 1994a
) to define a target activity to reproduce. With automated parameter search algorithms (see Materials and Methods), we generated new models by releasing the 24 maximal conductance parameters of the ionic channels while keeping the cell morphology and ion channel kinetics constant. A distance function based on phase-plane analysis quantified the degree of similarity between any of the new models and the original model. This similarity is measured only at the level of the electrophysiological activity using the membrane voltage traces obtained for different injected currents. None of the ion concentrations were used as a criterion to judge the quality of the new models.
The electrophysiological behaviors of the new models were remarkably identical to that of the original one. Figure 1
compares, for four different amplitudes of injected current, the activity of the original model to that of the two models with respectively the lowest or the highest distance value of the 148 new models. As can be seen, all our new models reproduced in fine detail the complex firing behavior of the Purkinje cell. Precise spike-timing or burst timing were not considered as important factors to reproduce because these show a high variability in experiments. Instead, the ability to reproduce the different activity modes, the spike shapes, burst shapes, inter-spike and inter-burst intervals were more relevant criteria and were all precisely reproduced.
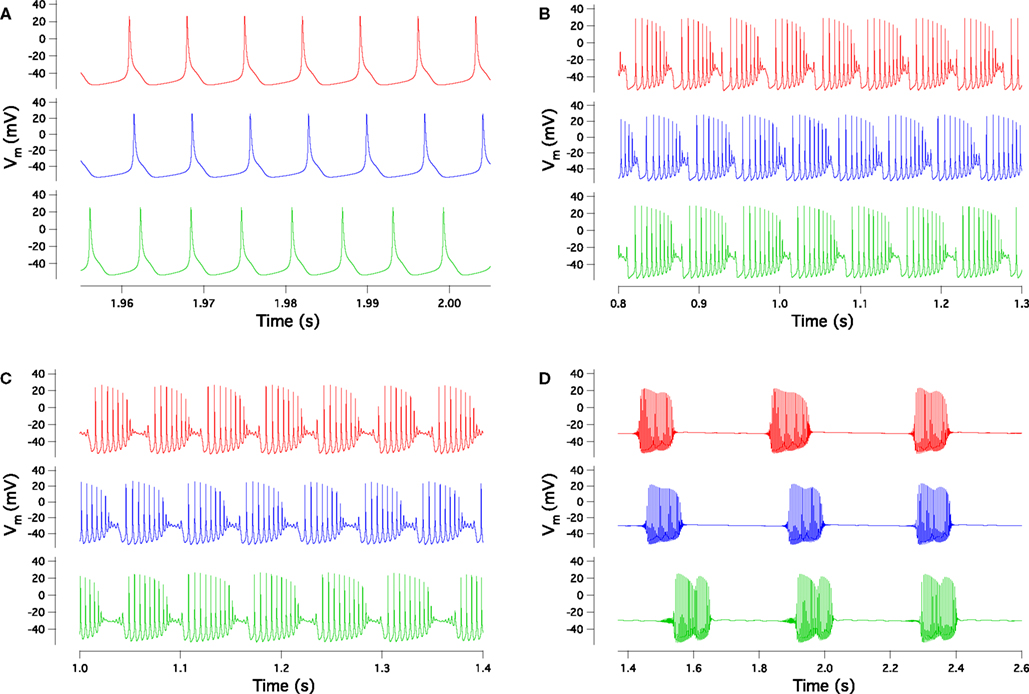
Figure 1. Comparison of somatic membrane voltage of the target model (red) with the best (blue, lowest distance value of 1.3) and worst (green, highest distance value of 3.0) models of our selection. The original activity is nicely reproduced for currents injected into the soma with amplitudes of 0.5 nA (A), 1.5 nA (B), 2 nA (C), 3 nA (D).
The 148 models have very different current combinations, expressed by the large variation of most maximal conductance parameters, as demonstrated in Figure 2
. However, when all the conductance parameters were fixed but one, this one parameter could not be varied over a broad range of values. Hence, many but not any combination of currents can lead to the same activity. This phenomenon was analyzed in detail in our previous study (Achard and De Schutter, 2006
). It is highly related to the intrinsic homeostasis observed in experiments (Marder and Goaillard, 2006
) as evidenced by the large variability of conductances measured in real PCs (Swensen and Bean, 2005
).
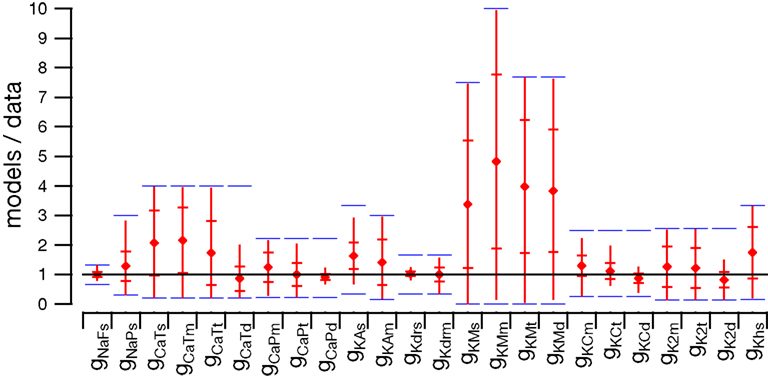
Figure 2. Distribution of the 24 maximal conductance values for the 148 models normalized to the maximal conductances of the target model. For each distribution, the full red bars delimit the whole range covered by the 148 models while the horizontal red lines give the standard deviations and the bullets give the mean values. Blue bars show the range of variation allowed during the search. From left to right, the distributions correspond respectively to the following currents: fast Na+ in the soma, persistent Na+ in the soma, T-type Ca2+ in the soma, main, smooth and spiny dendrites, P-type Ca2+ in the main, smooth and spiny dendrites, A-type K+ in the soma and main dendrite, delayed rectifier K+ in the soma and main dendrite, muscarinic K+ in the soma, main, smooth and spiny dendrites, BK-type Ca2+-activated K+ in the main, smooth and spiny dendrites, K2 Ca2+-activated K+ in the main, smooth and spiny dendrites and h current in the soma (De Schutter and Bower, 1994a
).
Variability of the Calcium Signal in the Soma
By adding excitatory and inhibitory postsynaptic channels to the PC models it was possible to mimic the response of the cell to synaptic input (De Schutter and Bower, 1994b
). Among those, two excitatory inputs have a fundamental role in PC activity (Llinás et al., 2004
). First, about 200,000 parallel fibers (PFs), originating from granule cells, make individual synaptic contact with PCs. Their collective behavior modifies “simple” sodium spiking, which is probably generated for the most part by intrinsic excitability (Shin et al., 2007
). Second, a single climbing fiber (CF) makes approximately 300 synaptic contacts with a PC and its activation triggers a so-called “complex spike” which can roughly be described as a sodium spike followed by a dendritic Ca2+ spike on top of which ride smaller sodium spikelets (Monsivais et al., 2005
). Generating a complex spike is therefore a good case study of voltage-gated Ca2+ activity under physiological conditions. We implemented the same set of synapses in all our 148 models, induced complex spikes with the same input and studied the associated Ca2+ signals.
The first thing to note is the stability of the voltage signal in the soma during the complex spike. Figure 3
A superimposes the voltages traces of the 148 models. The traces are very similar except for a small jitter in the timing of the spikelets. We quantified this stability by measuring the peak value of the somatic membrane voltage during the complex spike. The coefficient of variation (CV) of these peak values, which is their standard deviation divided by their mean, was very low, 0.004. The CV of the surface area under the voltage traces was also very low, 0.001. This result demonstrates the goodness of our method to obtain models having similar electrophysiological outputs to any type of input, including synaptic inputs that were not originally tested.
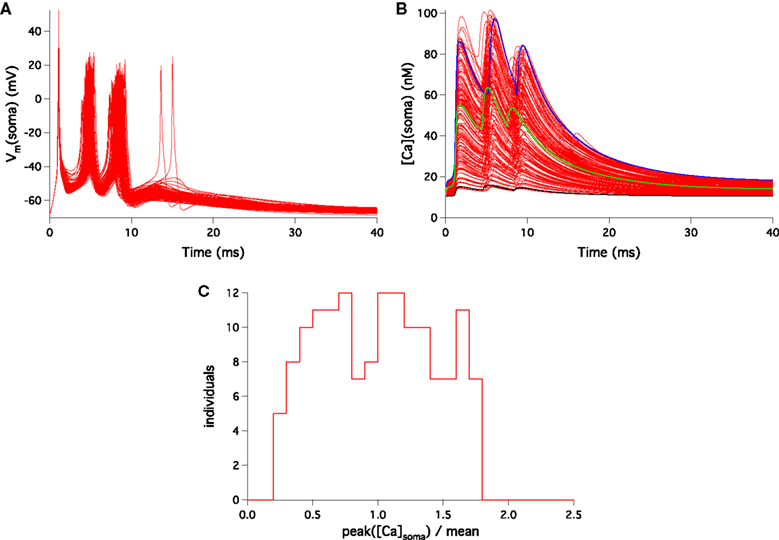
Figure 3. Somatic response to CF activation of the 148 PC models. Membrane voltage traces superimposed (A) show very small variability. Submembrane Ca2+ concentrations ([Ca2+]) traces superimposed (B) display a much larger variation. Blue, green and black traces show three typical models. The distribution of peak submembrane [Ca2+] normalized to the mean (C) reflect the variability.
Figure 3
B shows, for all our models, the submembrane somatic Ca2+ concentration traces during the same complex spike. Clearly these traces were very variable. The peak values of the Ca2+ concentration during the complex spike displayed a wide distribution, shown in Figure 3
C normalized to the mean. The CV of this distribution was equal to 0.44. This variability was not caused by an amplification of small variations of the membrane voltage since there was no linear correlation between the peak voltage signal and the peak calcium signals (correlation coefficient r = 0.06 and probability of null correlation p = 0.43).
Variability of the Calcium Signal in the Main and Smooth Dendrites
The dendritic tree of our PC model is divided in three separate zones, respectively called “main” (or proximal), “smooth” and “spiny” dendrites, each having different values for the ionic channel conductances on their membrane. While parallel fibers make synaptic contacts on spines in the spiny dendrite region, the climbing fiber makes synaptic contact on the main and smooth dendrite regions. Interestingly, a high variability of the Ca2+ signal was also present in the main and smooth dendrites. The distributions of the submembrane peak Ca2+ concentrations are shown in Figure 4 and their coefficients of variation were respectively 0.40 and 0.34 for the main and smooth dendrites.
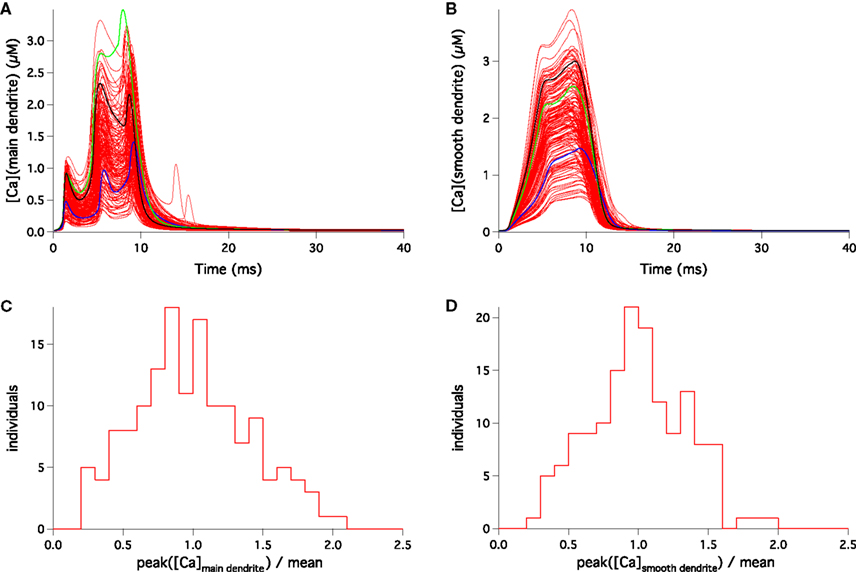
Figure 4. Response to CF activation of the 148 PC models in representative compartments of the main (A,C) and smooth (B,D) dendrites. Submembrane [Ca2+] traces superimposed (A,B) display large variability. Blue, green and black traces show the same models as in Figure 3
B. The distributions of peak submembrane [Ca2+] normalized to their means (C,D) are wide too.
The Ca2+ signals in the soma, main and smooth dendrites were uncorrelated. To illustrate this, we colored the Ca2+ signal of three typical models in Figures 3
B and 4
A,B. The model colored in black had a very low Ca2+ concentration in the soma but was above average in the smooth and spiny dendrites. Oppositely, the model colored blue had high somatic and low dendritic Ca2+ signals. The green one was high in the main dendrite but medium in the soma and the smooth dendrites. For all models, there was no significant correlation between the maximal Ca2+ concentration values in the different locations: r = 0.03 and p = 0.70 for the pair soma-main dendrites, r = 0.06 and p = 0.47 for the pair main-smooth dendrites, r = −0.04 and p = 0.61 for the pair soma-smooth dendrites.
Stability of the Calcium Signal in the Spiny Dendrite
Exactly as in other parts of the cell, the voltage signal recorded during a complex spike in the spiny dendrites was very stable. This is illustrated in Figure 5
A. But, opposite to its variability in the soma, main and smooth dendrites, the Ca2+ concentration profile in the spiny dendrites was very stable during a complex spike. Figure 5
B shows the submembrane Ca2+ signal of the 148 models and their variation was small. Indeed, the distribution of maximal Ca2+ concentrations on the spiny dendrites, shown in Figure 5
C, was much more peaked than the distributions we obtained in the soma (Figure 3
C), the main (Figure 4
C) and the smooth dendrites (Figure 4
D). This is reflected by its CV of 0.11, that was four times smaller than the soma CV.
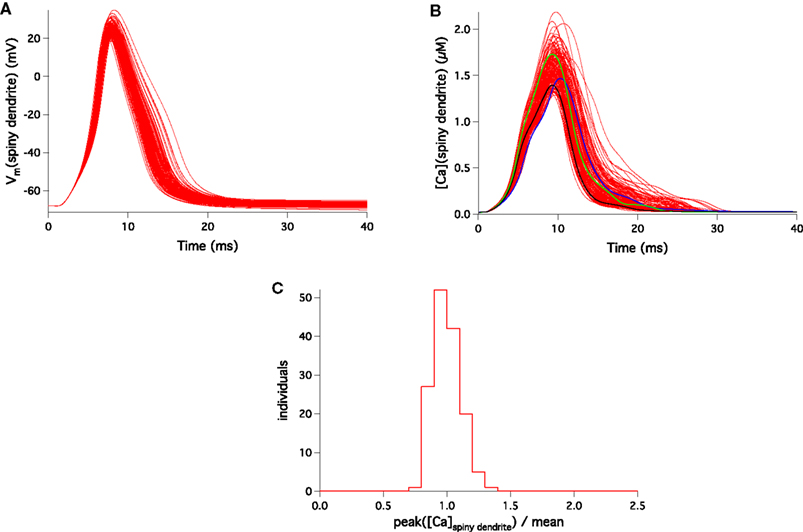
Figure 5. Response to CF activation of the 148 PC models in a representative compartment of the spiny dendrites. Membrane voltage traces superimposed (A) show very small variability. Submembrane [Ca2+] traces superimposed (B) display a much smaller variation than in other parts of the cell. Blue, green and black traces show the same models as in Figure 3
B. The distribution of peak submembrane [Ca2+] normalized to the mean (C) is sharply peaked in the spiny dendrites.
Note that the spiny dendrites were not treated differently during the parameter search and, in fact, no voltage traces from this region were used to tune the 148 models. Therefore, the low variability of Ca2+ concentration in this specific location is an emergent property, solely caused by the intrinsic excitability properties of PCs used to tune the models.
Implication for LTD Induction
Several experiments and computational models have demonstrated the role of Ca2+ in the induction of LTD at the PF-PC synapses (Doi et al., 2005
; Hansel et al., 2006
; Hartell, 2002
; Konnerth et al., 1992
; Miyata et al., 2000
; Tanaka et al., 2007
). It has been demonstrated repeatedly that, while a CF signal alone or a weak PF signal alone are not sufficient to provoke a Ca2+ signal large enough to trigger LTD (Ito, 2001
; Wang et al., 2000
), the conjunction of the two signals, in a limited time window, allows the cell to reach the [Ca2+] threshold necessary to induce synaptic LTD (Tanaka et al., 2007
), probably thanks to additional Ca2+ release from internal stores (Doi et al., 2005
; Finch and Augustine, 1998
; Ito, 2002
; Takechi et al., 1998
; Wang et al., 2000
).
To test whether every Ca2+ signal generated in the spiny dendrites by complex spikes is able to induce such a sustained Ca2+ release, we used an existing kinetic model of the Ca2+ dynamics within a PC spine. This model, designed by Doi et al. (2005)
, includes many pathways that have an effect on the Ca2+ signal, with a particular attention devoted to the release of Ca2+ from endoplasmic reticulum through IP3 receptors (Finch and Augustine, 1998
; Takechi et al., 1998
). It reproduces correctly the different experimental scenarios that lead to LTD (Tanaka et al., 2007
).
We kept the PF signal and PF-CF time interval that Doi et al. use for their standard PF-CF conjunctive input (see Figure 3
A) but, for the CF signal, we replaced their square shaped Ca2+ influx with the 148 complex spike Ca2+ influxes that our models generated in the spiny dendrites (see Materials and Methods). The results of these simulations are shown in Figure 6
. In all of the cases (red lines), the conjunctive PF-CF inputs triggered a sustained Ca2+ release from the endoplastic reticulum, hence providing a sufficient rise of [Ca2+] for LTD induction (using an experimentally determined threshold; Tanaka et al., 2007
, see Materials and Methods).
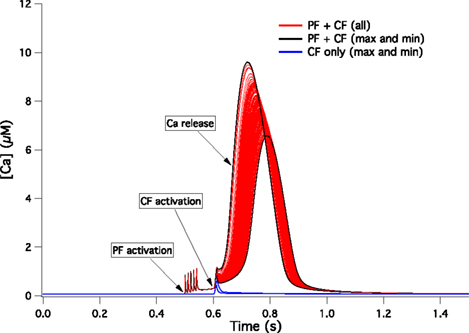
Figure 6. [Ca2+] dynamics within a PC spine obtained from a kinetic model of the Ca2+-activated biochemical pathways (Doi et al., 2005
). The CF signal is obtained from the 148 traces displayed in Figure 5
B. The red lines show the responses to conjunct PF and CF activations for all 148 models while the black lines mark the models giving the highest and lowest responses. The blue lines show the highest and lowest responses to CF activation only.
When the CF signal was provided without a preceding PF signal, the Ca2+ signal remained small, as expected from experiments and from the tests that Doi and colleagues already performed with their model. On Figure 6
, for sake of clarity, we only plotted as blue lines the signal obtained for the maximal and minimal responses to CF input. The small responses that we obtained in all cases to an isolated CF signal were insufficient to induce LTD (Ito, 2002
; Tanaka et al., 2007
).
Failure of LTD Induction for a Higher Variability of the Spiny Calcium Signal
A question arises immediately from the previous results: what would happen if the Ca2+ signals were as variable in the spiny dendrites as they are in other parts of the PC model? To answer this, we scaled the 148 signals so that the distribution of maximal Ca2+ concentrations in the spiny dendrites (Figure 5
C) exactly reproduced that observed in the soma (Figure 3
C). These scaled Ca2+ signals were then plugged into Doi’s model as previously. The results of these simulations are shown on Figure 7
. The black lines show the extreme responses obtained to conjunctive PF-CF activations. In the minimal case, the model clearly failed to evoke a sustained Ca2+ release. This is marked by a decreased maximal Ca2+ concentration, a decreased area below the curve and a delay in the Ca2+ release. Using a Ca2+ threshold based on the quantitative study of Tanaka et al. (2007)
, LTD induction would fail in 37% of the PC models. These models are displayed with gray lines on Figure 7
.
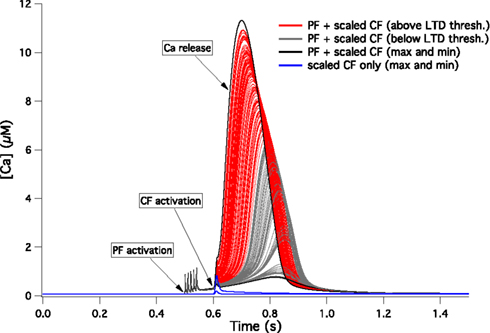
Figure 7. [Ca2+] dynamics within a PC spine obtained from a kinetic model of the Ca2+-activated biochemical pathways (Doi et al., 2005
). The CF signal is obtained from the 148 spiny dendrite traces displayed in Figure 5
B but scaled to reproduce the same variability of peak [Ca2+] as observed in the soma (Figure 3
C). The red lines show the responses to conjunct PF and CF activations for all models with a response above 4 μM for more than 100 ms while the grey lines show the responses of models that fail to evoke such a sustained calcium release. The black lines mark the models giving the highest and lowest responses. The blue lines show the highest and lowest responses to CF activation only.
We used a modeling approach to investigate the parameter space available to mechanisms controlling activity homeostasis in cerebellar PCs. We confirmed that Ca2+ current amplitudes were not constrained in the soma, as was previously reported experimentally (Swensen and Bean, 2005
). We found that while Ca2+ currents were also highly variable in parts of the dendrite contacted by the CF, they were, conversely, tightly controlled in the spiny dendrite that receives PF input. We could demonstrate that the constrained Ca2+ influx in the spiny dendrite supported the induction of LTD of the PF synapse in all physiological models, which would not have been the case with a Ca2+ influx as variable as observed in the soma.
Importance of Multi-Scale Modeling
One particularity of PCs compared to many other neurons is their large spatial extension. The detailed representation of their dendritic arbor in our models allowed us to investigate spatial differences in Ca2+ signaling. The difference observed between somatic, proximal dendritic and spiny dendritic Ca2+ signaling argue for the importance of morphology in electrophysiological activity. This aspect would have been missed by the use of single compartment models.
To demonstrate the stability of LTD induction it was necessary to use models at two different spatial scales: one at the level of the whole cell where electrophysiological activity and ion flows through the membrane could be simulated, and one at the level of single spines to model the biochemical pathways of Ca2+ dynamics. Without the whole cell modeling, it would have been impossible to study the effects of spiny dendritic calcium concentrations on the PC electrophysiology. Without the local Ca2+ dynamics modeling, it would have been impossible to measure the effect of channel distribution on LTD induction. In other words, the results presented here could be hypothesized but not demonstrated from our previous article (Achard and De Schutter, 2006
).
The molecular kinetics model of LTD induction we used (Doi et al., 2005
) is based on the assumption that the IP3 receptor on the endoplasmic reticulum is the coincidence detector (Finch and Augustine, 1998
; Ito, 2002
; Khodakhah and Armstrong, 1997
; Takechi et al., 1998
). While this may not be the only way in which cerebellar LTD can be induced (Narasimhan et al., 1998
), the evidence for a Ca2+ threshold effect, which would be sensitive to increased variability of Ca2+ influx, is very strong (Ito, 2002
; Tanaka et al., 2007
).
Nevertheless our models are not complete. Some aspects of the electrical model (De Schutter and Bower, 1994b
) we used to tune our 148 PC models are not completely in line with current literature (Raman and Bean, 1997
), but these mainly affect the somatic spiking, which is not a focus of this study. Conversely, the P-type calcium current (Mintz et al., 1992
) equations used in our models differ little from those employed in more recent PC models (Khaliq et al., 2003
). In a recent combined modeling and experimental study our reference model (De Schutter and Bower, 1994b
) was shown to correctly predict voltage-gated calcium influx during PF activation (Steuber et al., 2007
). We did not simulate calcium buffering (Schmidt et al., 2003
), ion diffusion or biological variability of channel kinetics. The large and stable Ca2+ concentrations observed in the spiny dendrites could possibly diffuse towards the soma and reduce its variability. But the diffusion coefficient in the spiny dendrite is very low and anomalous (Santamaria et al., 2006
), therefore diffusion would play a very minor role and is not expected to be sufficient to cause stability of Ca2+ signals in the soma. With transgenic mice, Dove et al. (2000) have shown that a lack of transmembrane Ca2+ channels in PCs is compensated for by a reduction of Ca2+ binding proteins and Ca2+ uptake by the endoplastic reticulum. Although these mechanisms preserve the Ca2+ level at rest, the Ca2+ dynamics are severely altered by such modifications leading to differential activation of Ca2+-activated channels. A full analysis of the consequences of such widespread adaptations will require more complex models (Schmidt et al., 2003
).
Finally, our models do not capture the full biological variability (Figure 3
A): the somatic membrane potential waveforms of CSs show more cell-to-cell variability (Monsivais et al., 2005
). This disparity has multiple causes. First, our parameter search method selects models which produce close to identical membrane potential waveforms in response to current injection, limiting the possible variability of CS waveforms. Second, other sources of CS variability were not included: differences in morphology of both the PC and of the CF, or differences in the holding potential.
Ca2+ is Unlikely to be the Sole Global Activity Signal in PC
In our simulations, we demonstrated that it is possible to constrain the electrophysiological activity of PCs without constraining the Ca2+ signal in their soma, main and smooth dendrites (Figures 3 and 4
). This is true during complex spikes but also for any other type of activity since, except for the P-type Ca2+ current (Catterall et al., 2005
) in the spiny dendrites, all the voltage-dependent Ca2+ channels conductances vary a lot from model to model (Figure 2
). This finding is in agreement with experimental results. Indeed, the range of variation in the Ca2+ conductance at the somatic level is of the same order as that observed in acutely dissociated PCs (Swensen and Bean, 2005
). As summarized in their Figure 2
the calcium currents vary between about 10–50 pA/pF during the interspike interval of a burst. This cell-to-cell variability is not due to homeostatic manipulations by the experimenters. However, as in many experiments (Marder and Goaillard, 2006
), this natural variability is believed to be the product of internal homeostatic mechanisms that regulate channel densities from different starting points and different environments to preserve the desired activity.
Our results combined with Swensen’s experiments show that, at least at the somatic and proximal dendritic level, the Ca2+ activity does not reflect the electrical activity: very different Ca2+ concentrations can be associated with the same membrane voltage trace (Figures 3 and 4
). Therefore, the PC Ca2+ concentration seems to be a poor global activity signal to serve as a feedback in an activity homeostasis mechanism.
Most of the activity homeostasis studies studied neurons belonging to central pattern generators (CPGs) (LeMasson et al., 1993
; Liu et al., 1998
; Marder and Goaillard, 2006
; Piedras-Renteria et al., 2004
). These cells are highly specialized and almost nothing is known about long-term plasticity at their synapses. In this matter, PCs are fundamentally different. They play an important role in cerebellar learning, using LTD as the main form of synaptic plasticity (Ito, 2001
, 2006
). As the Ca2+ signal is the principle actor of LTD induction (Hartell, 2002
; Ito, 2001
; Konnerth et al., 1992
; Miyata et al., 2000
; Tanaka et al., 2007
), it would not be surprising that PCs and CPGs use different mechanisms and sensors to achieve activity homeostasis.
Which signals activate homeostasis sensors in PCs remains therefore an unresolved question, but different scenarios can be imagined. Probably multiple signals might exist, each probing a different aspect of the activity, such as spiking and bursting or electrical activity and Ca2+ concentration at rest. These multiple signals can be second-messengers associated with the same primary-messenger but having different dynamics or time-scales (Liu et al., 1998
) or they can be associated with completely different pathways. It is also possible that some of the homeostasis mechanisms occur at a very local scale where Ca2+ signals could be involved. This could depend on regulating the sensitivity of homeostatic mechanisms to different local mean Ca2+ concentrations. More detailed models and new experiments will have to test these hypotheses.
LTD Induction is Strongly Correlated to a Normal Electrophysiological Activity
Figure 2
clearly shows that constraining the input/output firing behavior of the PC constrained the maximum of the conductances of only three currents: the fast sodium current in the soma, the delayed rectifier potassium current in the soma and the P-type Ca2+ current in the spiny dendrites. The first two are responsible for the spike shape (De Schutter and Bower, 1994a
). The latter is strongly involved in the shape of the bursts. Indeed burst are terminated by dendritic calcium spikes (De Schutter and Bower, 1994a
; Womack and Khodakhah, 2004
). As the P-type Ca2+ current contributes approximately 90% of the whole cell Ca2+ current (Mintz et al., 1992
), fitting the burst shape therefore constrained the voltage gated Ca2+ influx in the spiny dendrites.
The other currents, including Ca2+ currents in other parts of the cell, play important roles as well. For most of them, an isolated small change of their conductance caused unphysiological firing patterns in the PC model (Achard and De Schutter, 2006
). But somehow, such a change could be counterbalanced by changes in other currents and therefore their value was less constrained over the population of models.
Interestingly, despite a clear difference in shape between bursts and complex spikes, constraining parameters to obtain the first also confined the second. This suggests that, in the case of PCs, sensors for Ca2+ dynamics homeostasis can be identical to sensors for burst activity.
With the reduced variability of Ca2+ concentration observed in the spiny dendrite, the LTD mechanisms were preserved (Figure 6
) while this would not be the case if the variability was as high as that observed in the soma (Figure 7
). This demonstrates that preserving the electrophysiological activity also preserved synaptic plasticity induction. We recently demonstrated that the effect of LTD on Purkinje cell spiking output also depends on continued normal Ca2+ dynamics in the dendrite (Steuber et al., 2007
). All together, these results show that the ability to induce LTD in PC is deeply correlated with its normal activity and we can view this ability as one of the intrinsic properties of Purkinje cells.
The role of PCs in fine-tuning of motion is largely acknowledged, but they also participate in many other neural functions such as cognition or language (Ramnani, 2006
; Schmahmann and Caplan, 2006
; Schutter and van Honk, 2005
). It is likely that the cerebellum, which has a highly homogeneous structure (Bloedel, 1992
), processes information in the same manner for all these tasks (Ramnani, 2006
). In this “neuronal machine” (Ito, 2006
), LTD at PF-PC synapses plays a crucial role. It is therefore fascinating to see that the capacity for induction of synaptic plasticity, which is functionally very important, is so strongly correlated with the normal electrical activity of the cell.
The authors declare that the research was conducted in the absence of any commercial or financial relationships that could be construed as a potential conflict of interest.
We warmly thank T. Doi, S. Kuroda, T. Michikawa, M. Kawato and I. Ogasawara for the availability of their model and the kind help they provided us in running it. We also thank A. Destexhe, C. R. W. Hansel, E. Marder and K. M. Stiefel for their comments on an earlier version of this manuscript. This work was supported by the University of Antwerp, FWO, HFSP and OISTPC.
Koekkoek, S. K., Yamaguchi, K., Milojkovic, B. A., Dortland, B. R., Ruigrok, T. J., Maex, R., De Graaf, W., Smit, A. E., VanderWerf, F., Bakker, C. E., Willemsen, R., Ikeda, T., Kakizawa, S., Onodera, K., Nelson, D. L., Mientjes, E., Joosten, M., De Schutter, E., Oostra, B. A., Ito, M., and De Zeeuw, C. I. (2005). Deletion of FMR1 in Purkinje cells enhances parallel fiber LTD, enlarges spines, and attenuates cerebellar eyelid conditioning in Fragile X syndrome. Neuron 47, 339–352.