Modeling thalamocortical cell: impact of Ca2+ channel distribution and cell geometry on firing pattern
1
Department of Physics, Laval University, Quebec, Canada
2
The Centre de recherche Université Laval Robert-Giffard (CRULRG), Laval University, Quebec, Canada
3
Department of Anatomy and Physiology, Laval University, Quebec, Canada
The influence of calcium channel distribution and geometry of the thalamocortical cell upon its tonic firing and the low threshold spike (LTS) generation was studied in a 3-compartment model, which represents soma, proximal and distal dendrites as well as in multi-compartment model using the morphology of a real reconstructed neuron. Using an uniform distribution of Ca2+ channels, we determined the minimal number of low threshold voltage-activated calcium channels and their permeability required for the onset of LTS in response to a hyperpolarizing current pulse. In the 3-compartment model, we found that the channel distribution influences the firing pattern only in the range of 3% below the threshold value of total T-channel density. In the multi-compartmental model, the LTS could be generated by only 64% of unequally distributed T-channels compared to the minimal number of equally distributed T-channels. For a given channel density and injected current, the tonic firing frequency was found to be inversely proportional to the size of the cell. However, when the Ca2+ channel density was elevated in soma or proximal dendrites, then the amplitude of LTS response and burst spike frequencies were determined by the ratio of total to threshold number of T-channels in the cell for a specific geometry.
Thalamocortical (TC) neurons at depolarized membrane potential fire in tonic mode, while when released from a hyperpolarizing state and crossing the potential between −65 and −70 mV they generate low-threshold spikes (LTS), accompanied by sodium spikes (Jahnsen and Llinás, 1984a
). During slow-wave sleep, TC neurons are hyperpolarized and fire preferentially LTS accompanied by high-frequency spike-bursts, while during paradoxical sleep and likely other activated brain states they fire mainly in the tonic mode (Hirsch et al., 1983
; Steriade et al., 1993
). Spike-burst elicited during slow-wave sleep precedes and follows a period of at least 100 ms of silence, lasts 5–20 ms and usually consists of three to five action potentials (Domich et al., 1986
). Extracellular unit recordings demonstrated also the presence of high frequency spike-trains during waking states (Bezdudnaya et al., 2006
; Sherman and Guillery, 2002
). Both high frequency spike-trains at depolarized potentials and low-threshold spike-bursts elicited by synaptic volleys can have similar shape despite different underlying mechanisms (Rosanova and Timofeev, 2005
). The low-threshold calcium current (IT) underlies burst generation in TC relay cells and plays a central role in the generation of synchronized sleep oscillations (Destexhe and Sejnowski, 2001
; Steriade and Deschénes, 1984
; Steriade et al., 1993
, 1997
; Timofeev et al., 2001
).
Ascending and descending inputs to thalamic relay cells arrive at different compartments of the dendritic tree (Jones, 1985
) and their integration depends on a large set of intrinsic currents. In order to reproduce correctly synaptic integration, numerical simulations need to incorporate the electrically active properties of the dendritic tree. A multi-compartment model is required to consider the effects of dendritic currents. A first step in this regard was carried out by Destexhe et al. (1998)
who studied relay cell models with a dendritic tree, which incorporated dendritic T-current densities. In that work, a comparison of T-current density recorded from acutely dissociated and relatively intact cells suggested a higher T-current density in the dendrites compared to the soma. In addition, the high distal T-current density predicted in that model led to a number of speculations (Zhan et al., 2000
) on relay cell responses to synaptic inputs arriving to distal dendrites. Fluorescent imaging study (Zhou et al., 1997
) and patch clamp recordings from soma and proximal dendrites (Williams and Stuart, 2000
) suggested a higher density of T-channels on proximal dendrites. However, a high density of T-channels in distal dendrites was not required to reproduce low-threshold spikes in a model (Rhodes and Llinas, 2005
). Previously, both, experimental and modeling studies were not efficient in detecting the presence and the amplitude (value) of T-current in distal dendrites. Thus, the distribution of T-channels in the membrane of TC neurons remains to be elucidated.
Since the active property of the dendrites affects synaptic integration and response of the neuron (De Schutter and Bower, 1994a
,b
; Goldberg et al., 2007
; Koch, 1999
; Mainen and Sejnowski, 1996
), in the present study the pattern of T-channel distribution was investigated in computational experiments. Given the experimental fact that T-channels are distributed unevenly over the TC neuron membrane, we examined different forms of non-uniform distribution in the multi-compartment model in order to find possible effects of channel distribution on the cell response. We started with 3-compartment model and then we extended the model to 1267 compartments with a realistic morphology of the TC cell. We hypothesize that the low-threshold response of a TC neuron can be correctly reproduced in a multi-compartment model with an appropriate distribution of T-channel density. Moreover, we hypothesize that the specific form of channel distribution should have physiological benefits for the cell. Here we show that the number of T-channels in the cell has a prime influence on LTS bursting and that the shape of the distribution becomes important only in a specific range of the total number of T-channels. Since different types of TC cells have different geometrical parameters, we also investigated the influence of the cell geometry on the firing pattern.
Model
The electrophysiological response of a thalamocortical cell can be modeled by a set of coupled differential equations with an appropriate set of parameters (McMullen and Ly, 1988
; Rose and Hindmarsh, 1985
) based on experiments by Jahnsen and Llinás (1984a
,b
). In our simulation, we also used the Hodgkin–Huxley model for the TC cell. In order to reproduce the low-threshold response of the TC neuron, the kinetics of the T-current was taken from voltage clamp experiments (McCormick and Huguenard, 1992
).
The main feature of the electrophysiological response of a TC cell can be reproduced already from a single-compartment model involving Na+, K+ and T-currents in the framework of Hodgkin–Huxley equations. Figure 1
shows the tonic response and the burst spiking of the modeled TC neuron. Above we proposed the hypothesis that all features of rebound spike-burst behavior can be reproduced in a multi-compartment model, if one takes into account the channel distribution in dendrites. The 3-compartment model simulations of TC neuron responses shown in this article have been carried out using the NEURON simulating environment (Hines and Carnevale, 1997
).
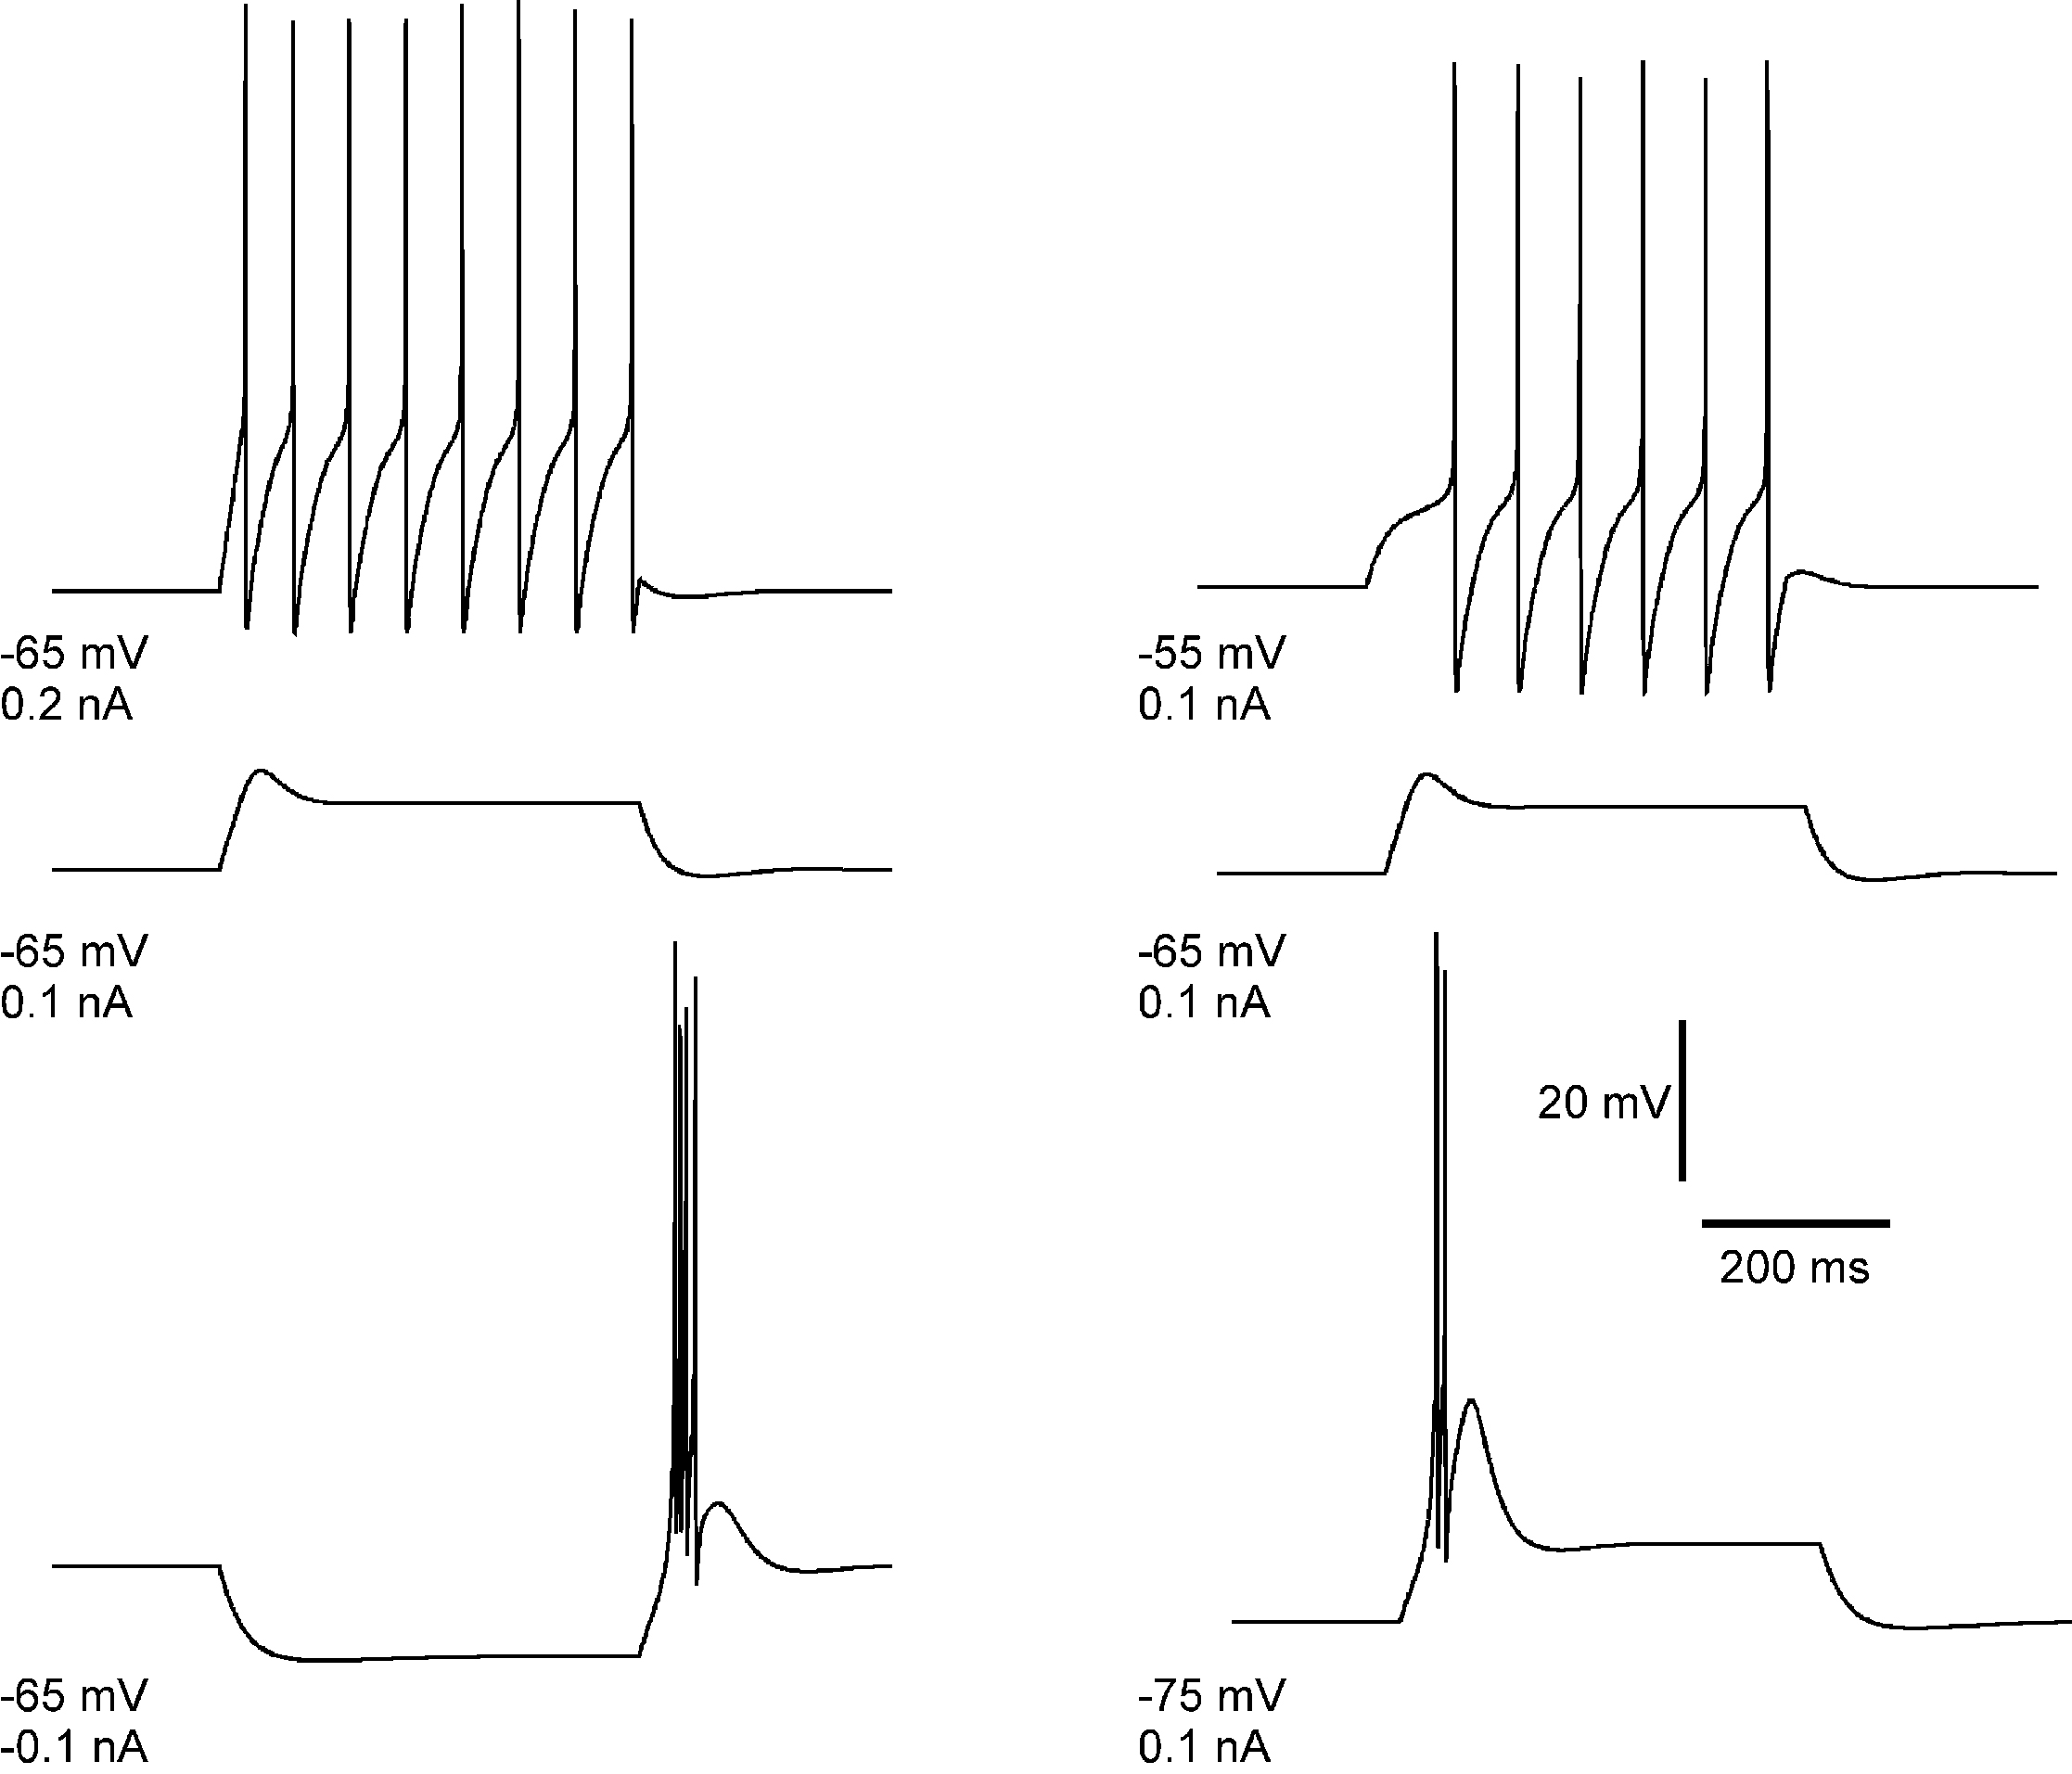
Figure 1. Simulated rebound burst in TC cell from a single-compartment model. The model involves the leak current, fast Na+/K+ currents and the low-threshold Ca2+ current. Left panel: response of cell to different injection currents, at the same level of membrane potential: tonic firing for 0.2 nA (top), passive response for 0.1 nA (middle) and burst firing for −0.1 nA (bottom). Right panel: response of the cell to a depolarizing current (0.1 nA) at different levels of membrane potential: tonic firing for Vm = −55 mV, passive response for Vm = −65 mV and burst firing for Vm = −75 mV.
3-Compartment Model
The ultimate goal of our study is to understand how the T-channel distribution influences the electrophysiological response of real TC neurons. The first steps of the study, however, were carried out using the 3-compartment model, which allows to test parameters with high computational efficiency. Those compartments represent the somatic segment and the dendritic arbor composed of proximal and distal segments. According to a previous study (Destexhe et al., 1998
), the 3-compartment model allows with good precision to reproduce major electrophysiological features of TC cells. In our simulations, the basic (“control”) parameters of the three sections are the following: length (l) and diameters (d): ls = 38.41 μm, ds = 26 μm for soma, lp = 12.49 μm, dp = 10.28 μm for proximal section and ld = 84.67 μm, dd = 8.5 μm for distal section (Figure 2
). We have made the assumption that passive parameters of the cell (e.g. leak conductance, cytoplasmic resistance, and capacitance) are held constant in each compartment. The passive response of the model with a dendritic correction factor, Cd = 7.95 (see Eq. 1) is fitted to the passive response of the cell during voltage-clamp recording. The Hodgkin–Huxley equations for the 3-compartment model are given by
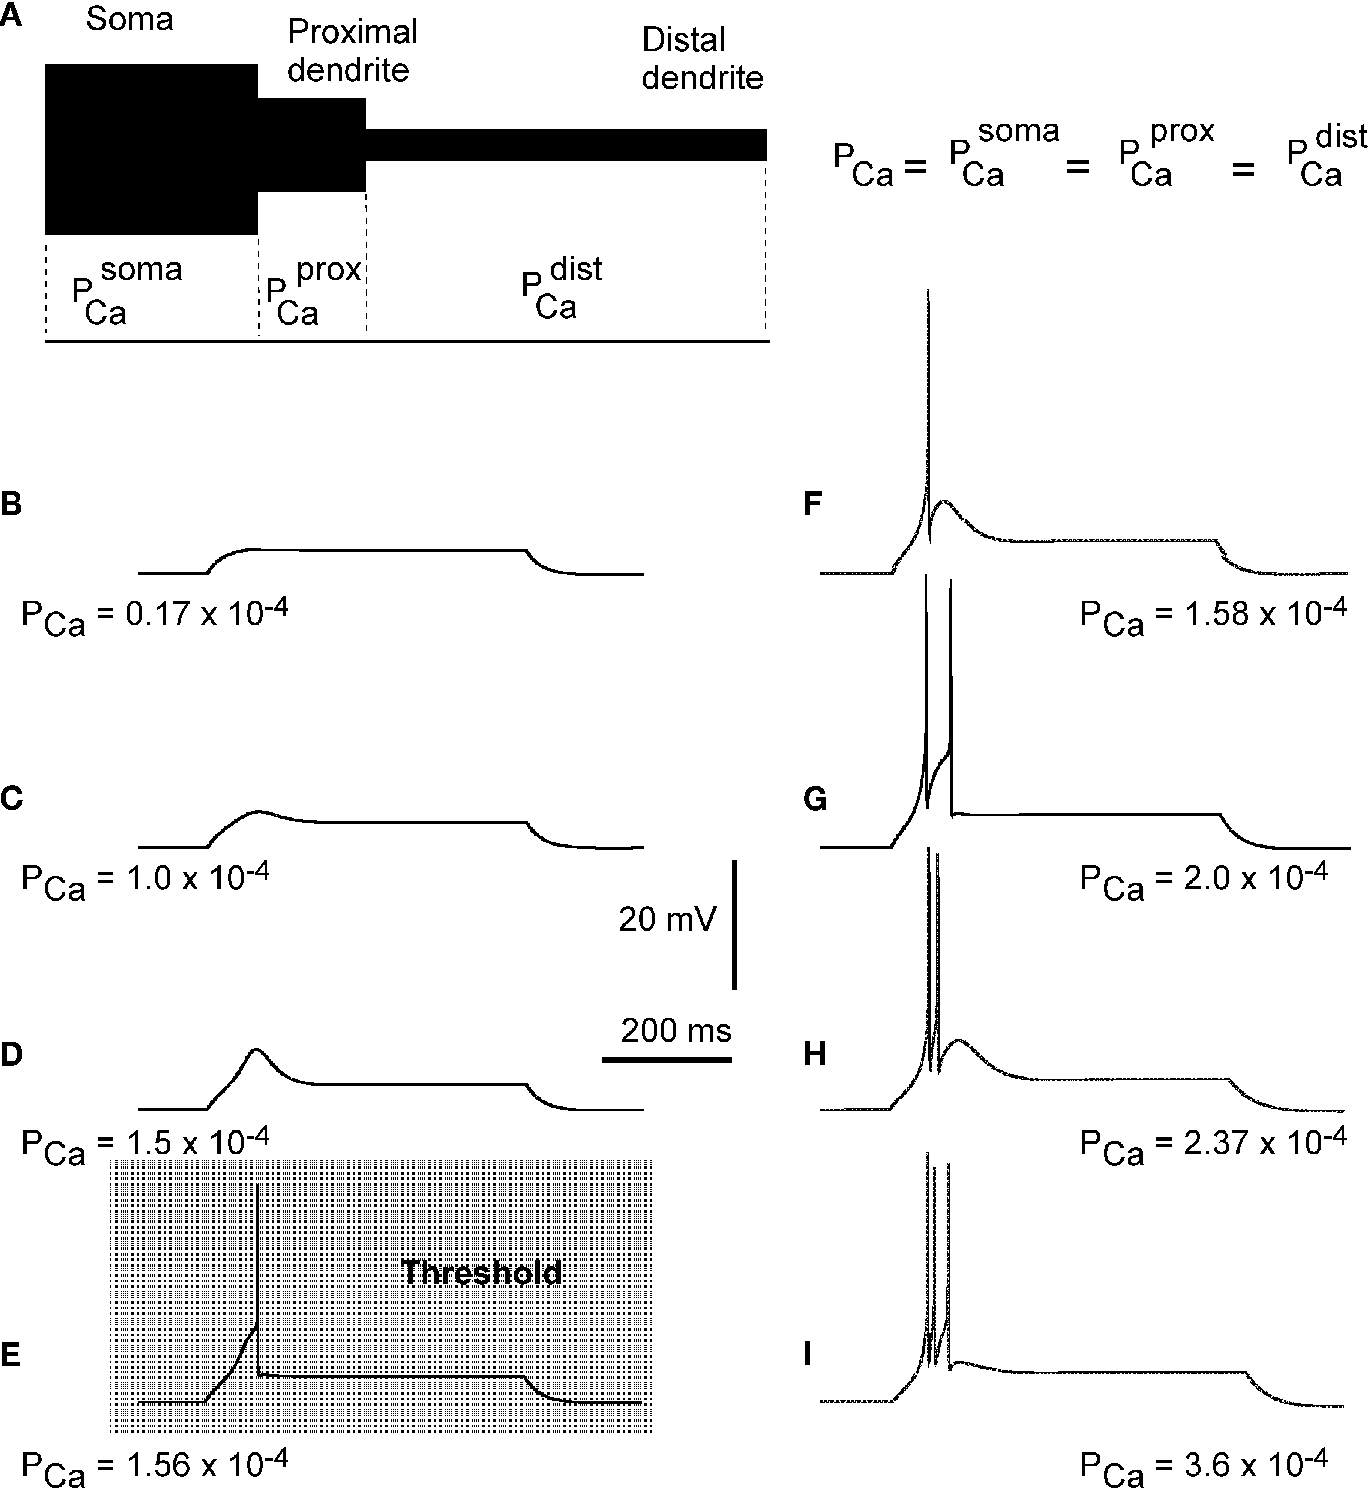
Figure 2. Effects of permeability from Ca2+ increase on generation of LTS response in a 3-compartment model with uniform channel distribution.
(A) schematic representation of 3-compartment model with uniform channel distribution. (B–I) Response of modeled TC neuron (Vm = −75 mV) to depolarizing current pulse (0.1 nA). The permeability for Ca2+ in each compartment increases from (B) to (I) as indicated. With this morphology, channel distribution and membrane potential, the onset of LTS leading to an action potential required the permeability Pca = 1.56 × 10⁻⁴ cm/s.
Here V1, V2, and V3 represent the membrane potential of the soma, proximal and distal compartments, respectively. A1, A2, and A3 denote the area of the compartments. In this model, the membrane capacitance, the leak conductance and the leak reversal potential were set to Cm = 0.878 μF/cm2, gL = 0.0379 mS/cm2, EL = −69.85 mV, respectively. The axial conductance  between compartments depends on the geometry of the compartment and the cytoplasmic resistance (Ra) in the following way:
between compartments depends on the geometry of the compartment and the cytoplasmic resistance (Ra) in the following way:
Thus, the axial conductance in our model takes the following values:  and
and  Voltage-dependent conductances were modeled using a Hodgkin–Huxley type of kinetic model. The kinetics of the Na+ and K+ currents responsible for fast action potentials, were taken from a model of hippocampal pyramidal cells (Traub and Miles, 1991
), assuming a resting potential of VT = −52 mV, maximal conductance
Voltage-dependent conductances were modeled using a Hodgkin–Huxley type of kinetic model. The kinetics of the Na+ and K+ currents responsible for fast action potentials, were taken from a model of hippocampal pyramidal cells (Traub and Miles, 1991
), assuming a resting potential of VT = −52 mV, maximal conductance  and
and  and reversal potentials of ENa = 50 mV and EK = −100 mV. This model has been shown to be adequate to model the repetitive firing within bursts of action potentials (Destexhe et al., 1996
). Because of the nonlinear and far-from-equilibrium behavior of calcium ions to model Ca2+ current we used Goldman–Hodgkin–Katz (GHK) equation (Hille, 2001
):
and reversal potentials of ENa = 50 mV and EK = −100 mV. This model has been shown to be adequate to model the repetitive firing within bursts of action potentials (Destexhe et al., 1996
). Because of the nonlinear and far-from-equilibrium behavior of calcium ions to model Ca2+ current we used Goldman–Hodgkin–Katz (GHK) equation (Hille, 2001
):
and Voltage-dependent conductances were modeled using a Hodgkin–Huxley type of kinetic model. The kinetics of the Na+ and K+ currents responsible for fast action potentials, were taken from a model of hippocampal pyramidal cells (Traub and Miles, 1991
), assuming a resting potential of VT = −52 mV, maximal conductance and and reversal potentials of ENa = 50 mV and EK = −100 mV. This model has been shown to be adequate to model the repetitive firing within bursts of action potentials (Destexhe et al., 1996
). Because of the nonlinear and far-from-equilibrium behavior of calcium ions to model Ca2+ current we used Goldman–Hodgkin–Katz (GHK) equation (Hille, 2001
):
Here PCa denotes the maximum permeability and m, h, denote the activation and inactivation variables, with τm and τh being the corresponding time constants. The kinetic functions are taken from Destexhe et al. (1998
). G (V, Cao, Cai) is a nonlinear function of the potential and ion concentration;

Here Z = 2 denotes the valence of calcium ions, F the Faraday constant, R the gas constant, and T the temperature measured in Kelvin. [Ca]i and [Ca]o represent the intracellular and extracellular Ca2+ concentrations expressed in units of millimolar. The fluctuation of intracellular Ca2+ concentration is denoted by [Ca]i. It is due to Ca2+ pumps and buffers (McCormick and Huguenard, 1992
), and is taken into account by the following differential equation:

Here iCa denotes the current density, d = 0.1 μm the depth of the shell below the membrane, [C]∞ = 240 nM the equilibrium concentration and τ = 5 ms the time constant of decay of [Ca2+], respectively. The parameters were taken from the 3-compartment model by Destexhe et al. (1998
).
The value of permeability PCa in the low-threshold calcium current (Eq. 3) indicates the maximum permeability of the section expressed in units of cm/s. This value represents the permeability of a patch of 1 cm2 of membrane. Therefore, the total permeability of the section is obtained by integration over the entire surface. On the other hand, the total permeability of a section is the product of permeability of a single channel and total number of channels. Thus holds

Here Ntotal,  and A denote the total number of T-channels, the permeability of a single channel and surface of compartment, respectively. For a given section area, increasing the number of channels is equivalent to increasing the permeability of the section. In the following we will refer to the permeability of channels in an area of 1 cm2 of the membrane simply as channel permeability. In the section “Calcium Channel Distribution”, we consider the influence of the number of channels and its distribution on the burst response of TC cell. We also consider in the section “Multi-Compartment Model” the influence of geometrical parameters (e.g. diameter, area) on the response of the cell.
and A denote the total number of T-channels, the permeability of a single channel and surface of compartment, respectively. For a given section area, increasing the number of channels is equivalent to increasing the permeability of the section. In the following we will refer to the permeability of channels in an area of 1 cm2 of the membrane simply as channel permeability. In the section “Calcium Channel Distribution”, we consider the influence of the number of channels and its distribution on the burst response of TC cell. We also consider in the section “Multi-Compartment Model” the influence of geometrical parameters (e.g. diameter, area) on the response of the cell.In order to simplify calculations, we did not take into account the h-current in the model, because this current does not contribute directly to the generation of LTS.
Multi-Compartment Model
We developed a multi-compartment model of the TC cell in order to consider the effects of dendritic currents upon response of the cell with realistic morphology. The simulations were performed based on a TC cell reconstructed using the NeuroLucida digital system. In order to obtain precise morphological features of the TC neuron from the VPL nucleus of thalamus, a retrograde tracer (fluorogold) was iontophoretically applied to the somatosensory area (SI) in adult anesthetized cat in sterile conditions. After a survival period of 2 weeks the cat was deeply anesthetized with thiopental and intracardialy perfused. Stained neurons were revealed using a standard ABC kit. All experimental procedures used in this study were performed in accordance with the Canadian guidelines for animal care and were approved by the committee for animal care of Laval University. The reconstructed cell used for the model included 11 primary branches and 224 segments with a dendritic membrane area of 45 000 × 10−6 m2. Our model contains 1267 compartments, based on the d-lambda rule of NEURON. The simulation of the multi-compartment model took approximately 12 min on a Pentium(R) M with 2.00 GHz processor to run 800 ms of neuronal activity.
Calcium Channel Distribution
In the following simulations, we determined the minimum value (threshold) of the number of T-channels (Nthr) and a corresponding value of permeability (Pthr) in each section, which enables the generation of LTS in the TC cell. The threshold number of T-channels is defined here as the minimal number of T-channels required to produce LTS in the 3-compartment model. This threshold value corresponds to the onset of the first sodium spike generated by LTS in response to a depolarized current of Iinj = 0.1 nA, while the cell is being hyperpolarized to Vm = −75 mV. However, if threshold LTS was obtained under different conditions (e.g., different level of Vm and/or different level of Iinj) it did not affect the results presented in this study.
Results of Numerical Simulations
In the first simulation, based on the 3-compartment model, the calcium channel density was kept equal in each compartment, which means equal permeability for Ca2+ ions in each compartment (Figure 2
A). According to experimental data from dissociated cells (Destexhe et al., 1998
), the permeability in each compartment was set to the value of PCa = 1.7 × 10⁻⁵ cm/s. Using this value in each compartment, the model gives a passive response to a depolarizing injected current (0.1 nA), at a hyperpolarized membrane potential (−75 mV). Parallel increase in permeability in the three compartments by the same amount induced first a sub-threshold response, which grew in amplitude as PCa increased (Figures 2
B–D). When the value of permeability at each compartment reached PCa = 1.56 × 10⁻⁴ cm/s, the modeled cell reproduced the first LTS mediated action potential (Figure 2
E). This permeability was defined as the threshold permeability under conditions of Vm = −75 mV and Iinj = 0.1 nA. The threshold permeability corresponds to the threshold number of Ca2+ channels (Nthr) in the cell necessary to generate the first rebound spike in the model. The total number of T-channels in the cell is proportional to the product of compartment area and permeability of Ca2+ channels in each compartment. The membrane potential fluctuates due to changes in channel permeability. Because the threshold value depends on the level of membrane potential, we used a steady holding current to keep the membrane potential at −75 mV when we changed PCa. In the case of an uniform T-channel distribution further increase in permeability produced LTS of larger amplitude leading to multiple spike generation with increasing intra-burst firing frequency (Figures 2
F–I). Because the experimental data suggest a non-uniform T-channel distribution in TC neurons (Williams and Stuart, 2000
; Zhou et al., 1997
), we examined different shapes of non-uniform distribution of T-channels in the model leading to an LTS response.
The total number of T-channels was kept constant and equal to Nthr, which is the minimum number of T-channels necessary to generate an LTS response in a cell with uniform channel distribution. We explored a variety of T-channel distributions that produced a first LTS mediated action potential in the model. Some examples of permeability distribution and its corresponding channel number in each compartment leading to an action potential are shown in Figure 3
. Both, uniform and non-uniform distributions of T-channels can produce an LTS response with sodium spike in the model cell. This suggests that when the total number of T-channels equals Nthr then the shape of channel distribution does not affect the LTS response of the cell (Figure 4
A). However, if the total number of channels was lowered the response of the cell depended on the shape of channel distribution. Far from the threshold value of the total number of T-channels any form of distribution gave a passive response, but when the total number of T-channels was close to threshold value, the response of the cell depended on the form of channel distribution (Figures 4
B–D).
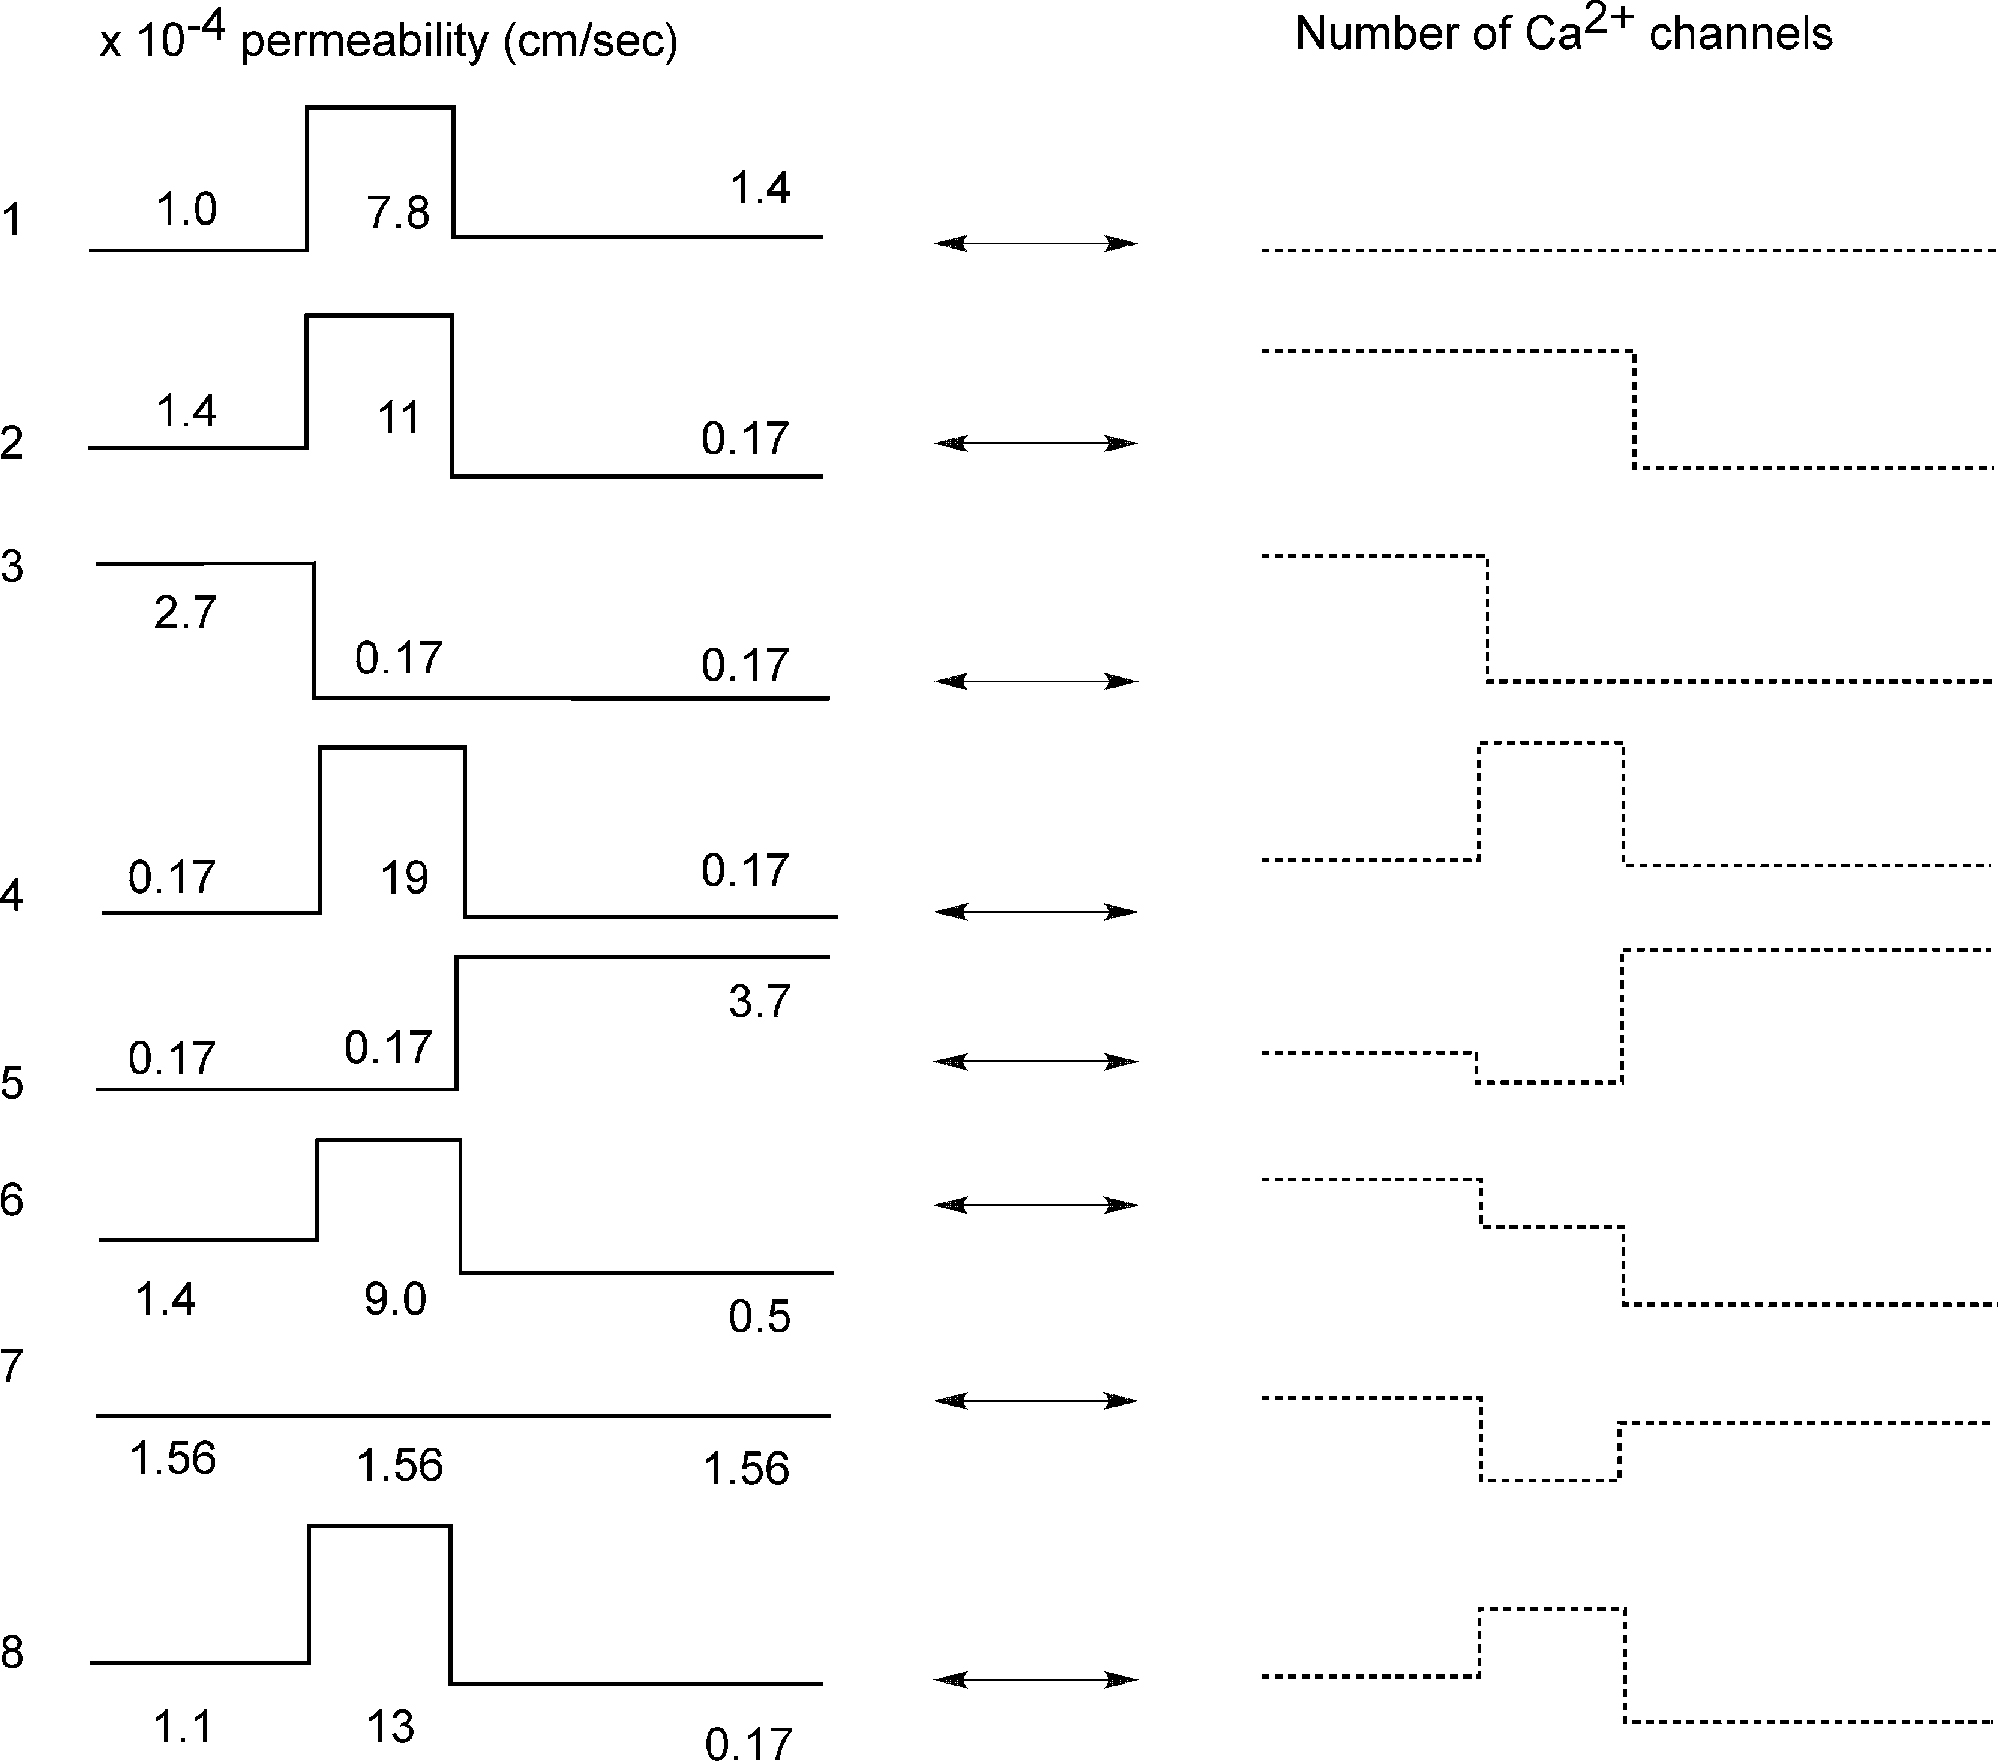
Figure 3. Different shapes of Ca2+ channel distribution can generate LTS spiking. Each line shows schematically the level of permeability in each compartment and its corresponding number of channels, which generate the threshold sodium spike similar to the response in Figure 2
E. The channel number in each section is given by integration over the entire surface of the section. Both uniform and non-uniform distribution of T-channels can produce LTS response in the modeled cell.
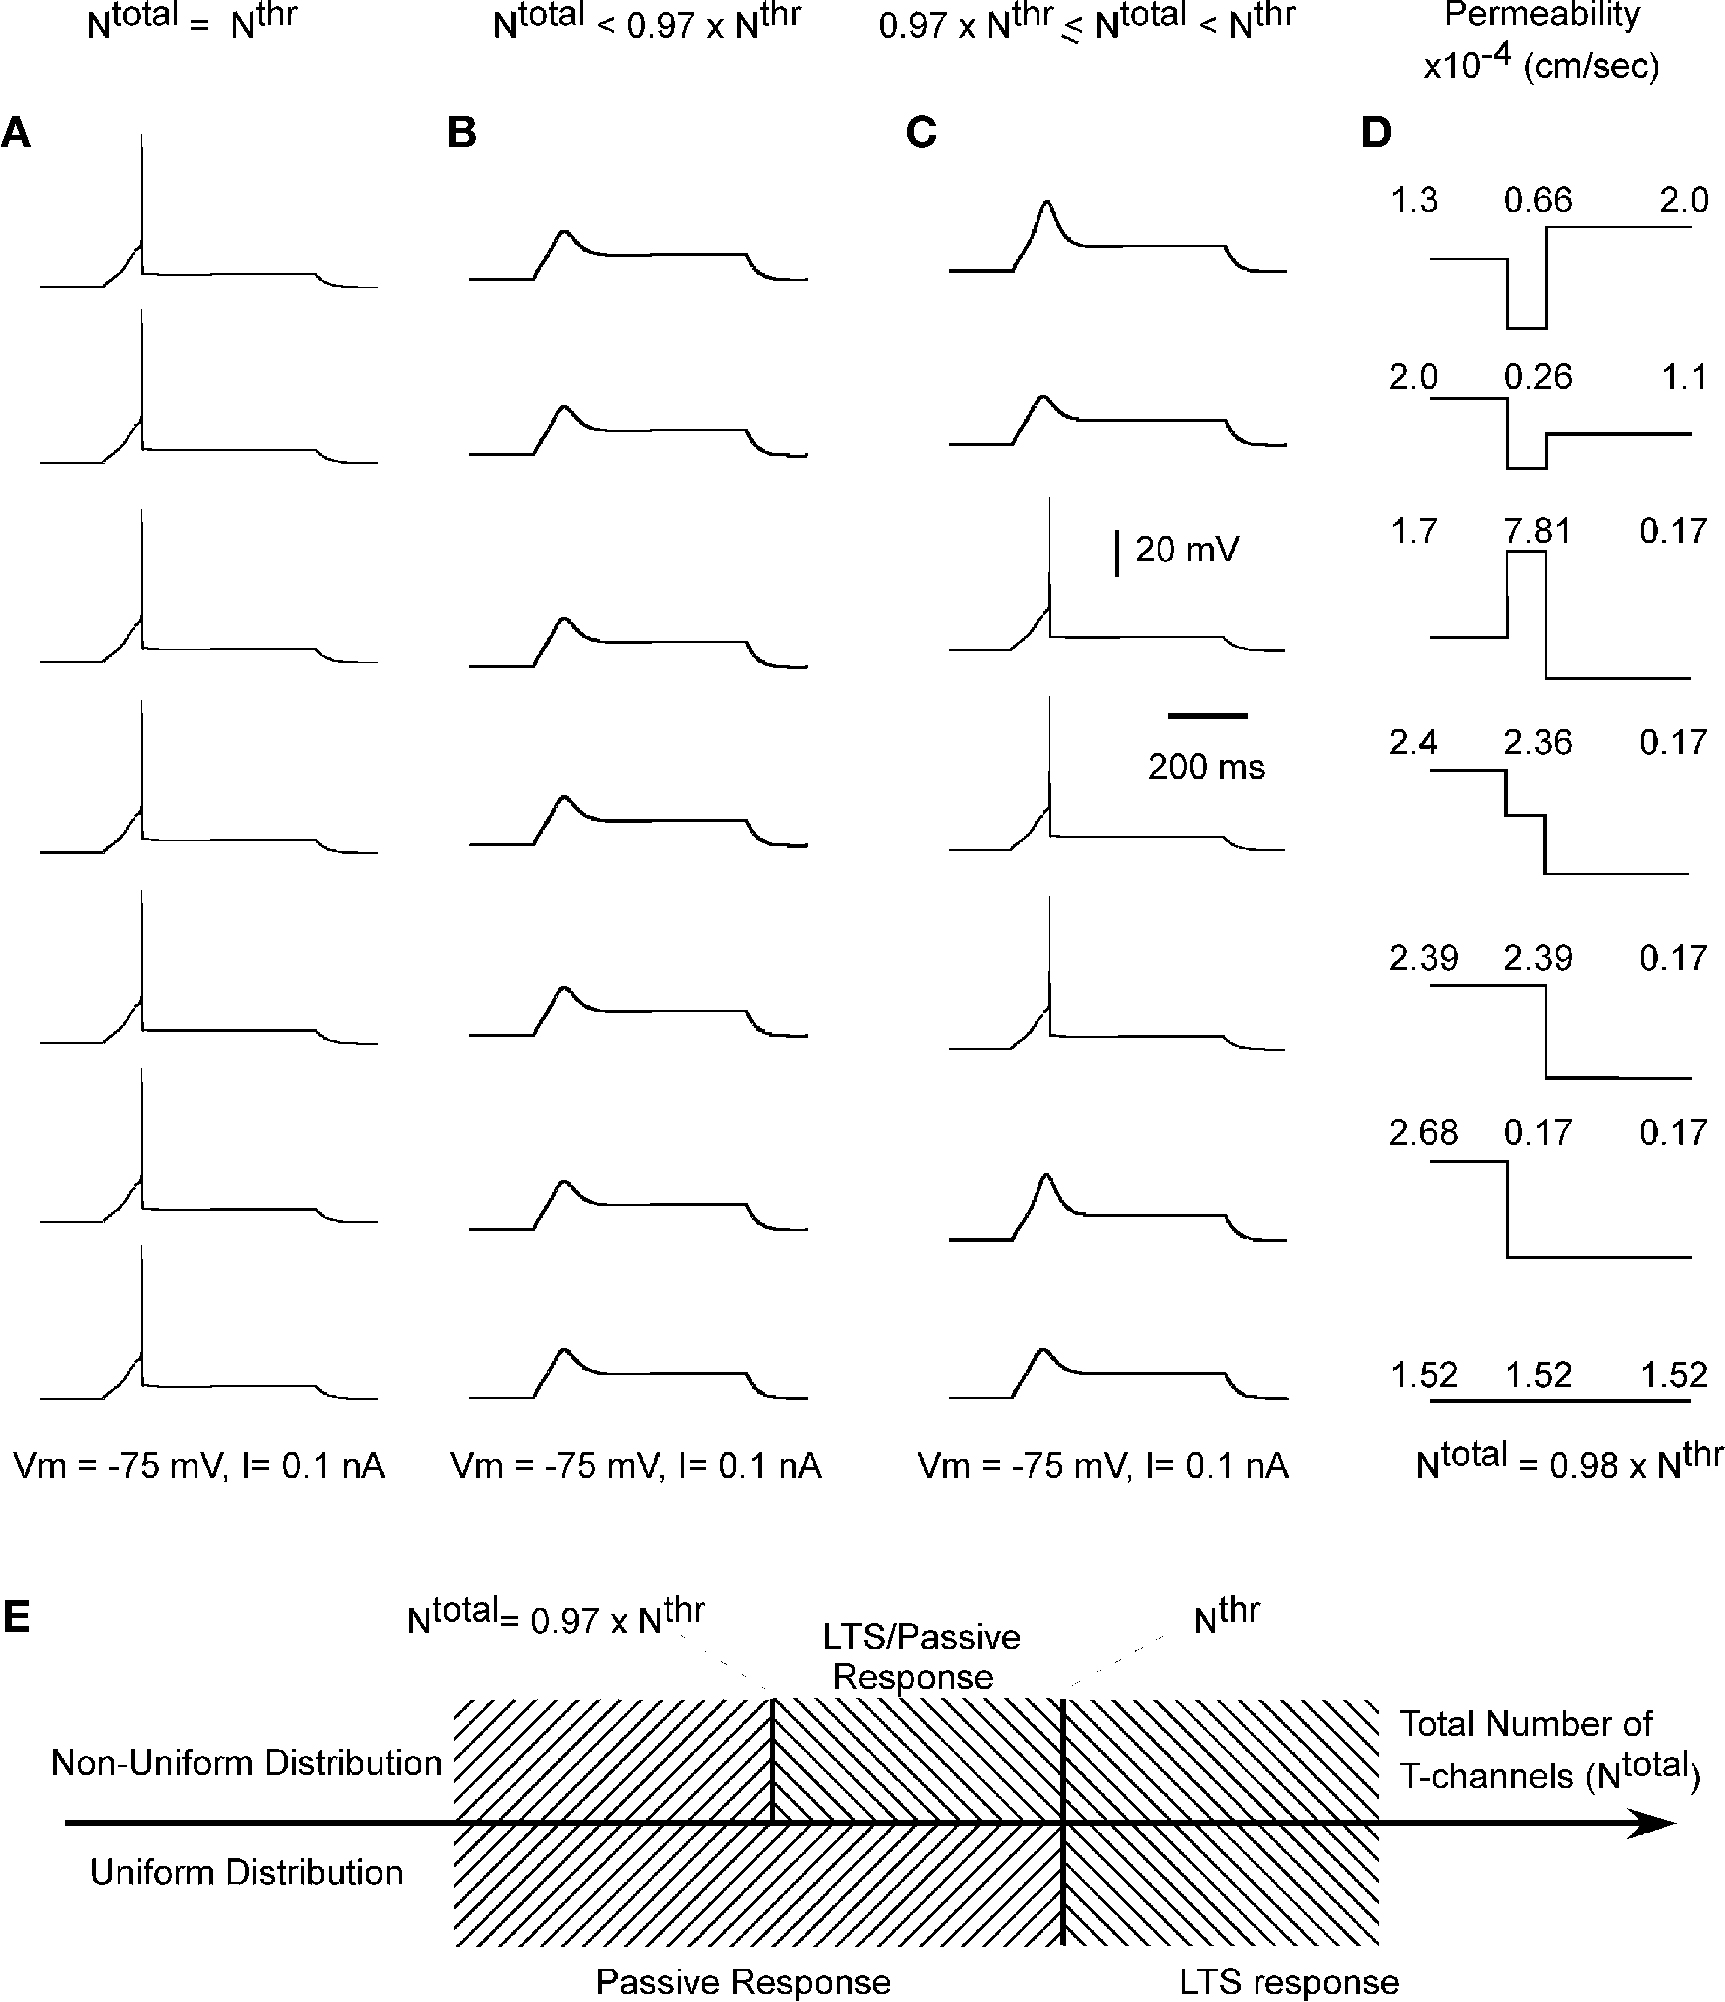
Figure 4. Total number of Ca2+ channels and its distribution determines whether LTS will lead or not to an action potential. (A) When the total number of T-channels was equal to threshold value (Nthr), the model neuron produced an LTS – action potential response with both, non-uniform and uniform channel distribution. (B) When the total number of channels was far from threshold value, the model gave LTS response not accompanied by action potentials. In this 3-compartment model, the response has
no spikes as long as the total number of T-channels was below 0.97 × Nthr.
(C) Between these two limits, the response of the neuron was sensitive to the shape of the T-channel distribution. To illustrate this feature, we set the total number of channels equal to 0.98 × Nthr. (D) Numbers show
T-channel permeability in each compartment for different patterns of
T-channel distribution, when the total number of T-channels was equal to 0.98 × Nthr. (E) A diagram shows a window in which an LTS response accompanied by spikes occurs, when non-uniform distribution of T-channels takes place.
Using small changes in the channel number in the 3-compartment model with non-uniform channel distribution, we found a small window in the total number of channels located below the defined threshold of onset of LTS with spikes which was able to induce an LTS mediated action potential

In such window, the spiking behavior was found to be variable: when the total number of channels was between Nthr and 0.97 × Nthr, a uniform permeability distribution did not generated LTS with sodium spikes, while a non-uniform distribution could generate a full LTS response (Figure 4
E). We also tested extreme cases where the Ca2+ permeability took the value 0 in two out of three compartments, and Ntotal was still 0.97 × Nthr. These results led to the assumption that the modeled cell can generate a rebound burst response for an optimal number of T-channels, which were distributed in a specific non-uniform pattern. We hypothesize that the physiological reason for the existence of such window on one hand may be related to reduced metabolic energy consumption (see Discussion), and on the other hand to the ability of the TC cell to generate a variable response pattern.
Effect of Cell Geometry on Firing Pattern
Firing patterns do not only depend on the channel density and type of current, but also on the geometry of the cell (length, diameter, area, etc.) (Mainen and Sejnowski, 1996
) as well as on the cell topology (symmetry, mean path length, etc.) (van Ooyen et al., 2002
). Here we examined the influence of the cell geometry on the firing pattern in the 3-compartment model of the TC neuron. For this purpose, we changed the diameter of each compartment, while holding constant the diameter of other sections, the channel densities, and the injected current. In addition, we set the total number of channel equal to 0.98 × Nthr where the spiking induced by the LTS response of the cell is sensitive to the shape of distribution of the T-channels. Like in previous simulations, the model includes the Na+/K+ current in soma and the T-current in soma, proximal and distal compartments. First, a non-uniform T-channel distribution has been considered obeying the following relation:

In a control situation, a hyperpolarizing current pulse induced an LTS response accompanied with action potentials and a depolarizing current pulse induced tonic firing with six spikes (Figure 5
A). We kept constant the channel density for different cell geometries. The variation of Ntotal and Nthr altered the response of the cell. With channel density held constant, a decrease in the size of all compartments led to an increase in the input resistance, higher frequency of tonic firing and stronger LTS response (Figure 5
B, I and V). Increasing the size of the cell led to a decrease in input resistance of the cell, and as consequence to lower excitability, expressed as a reduced firing frequency and absence of tonic or LTS response (Figure 5
C, I and V).
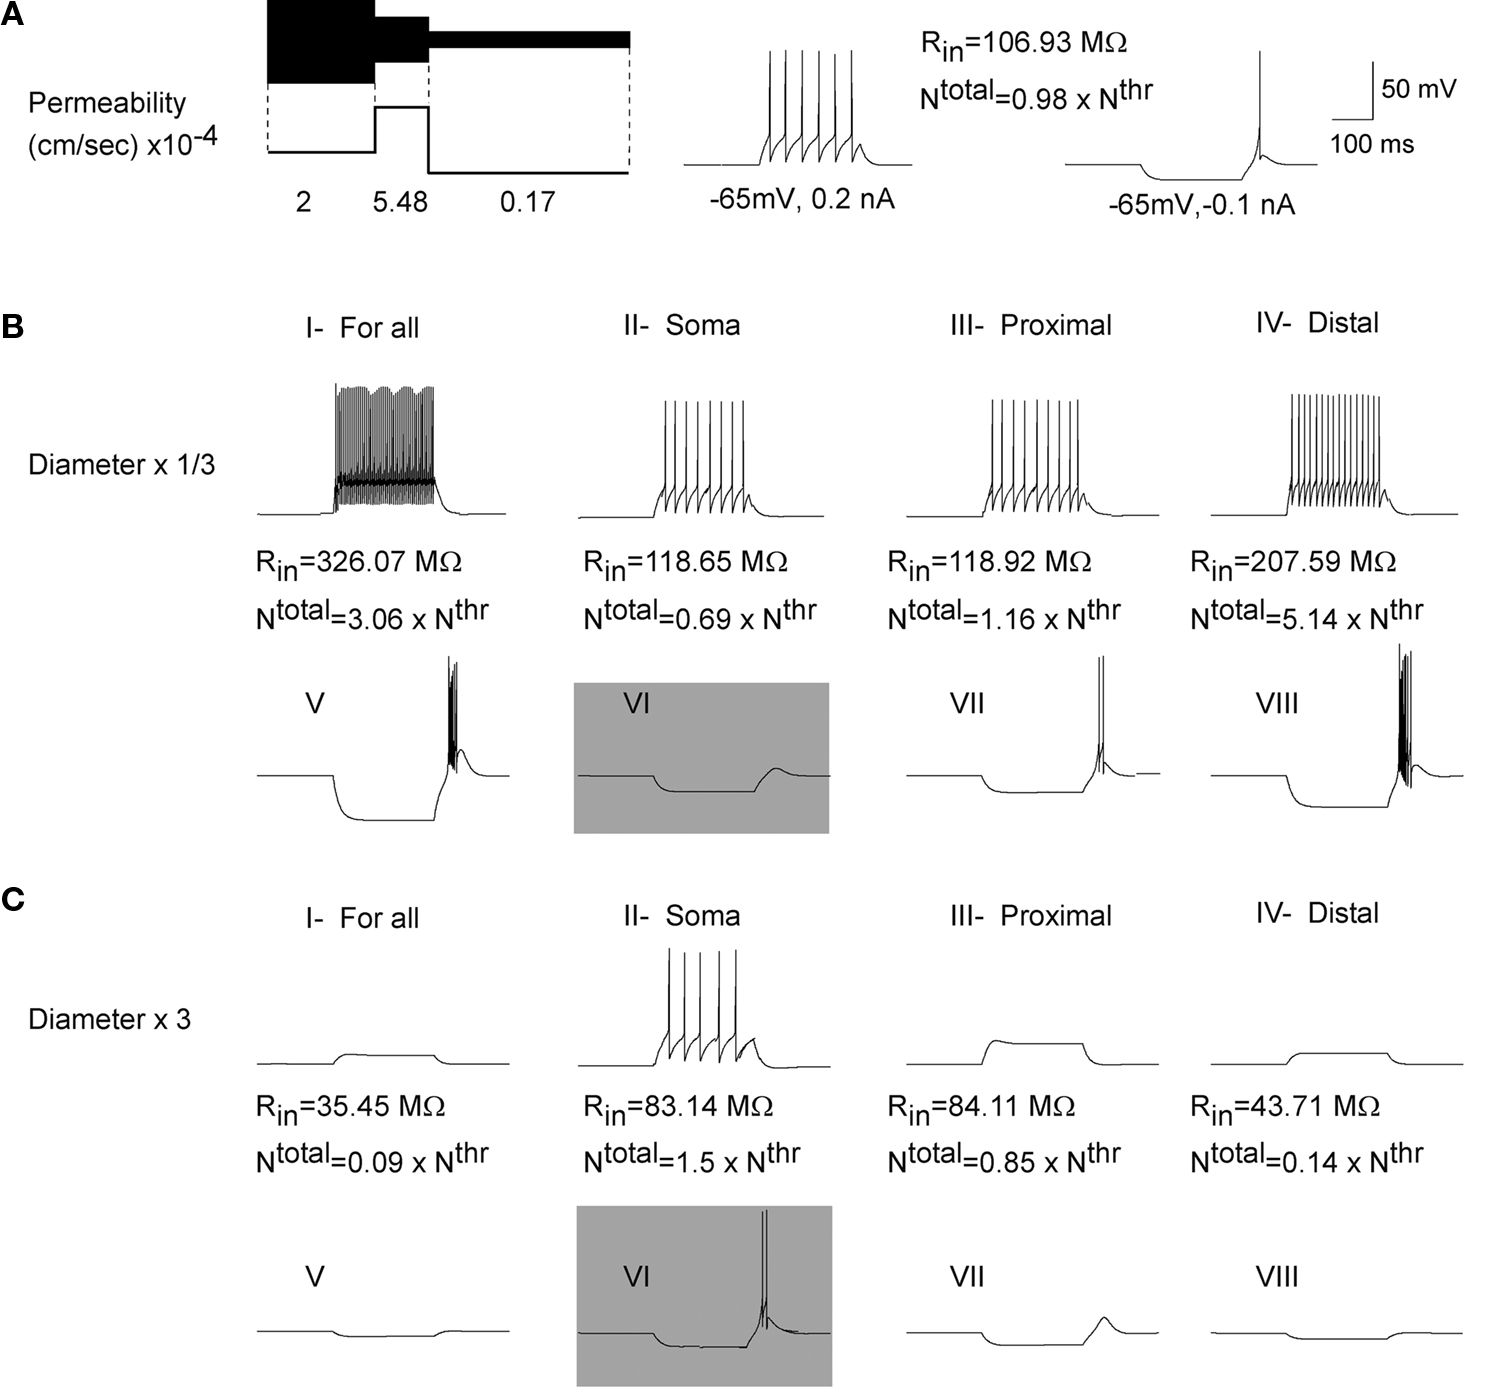
Figure 5. Influence of geometry on the response of cell with a higher
T-channel density in proximal section. (A) In a control situation (Ntotal = 0.98 × Nthr) the model TC cell generates six spikes in response to a 0.2 nA depolarizing current pulse and one rebound spike in response to a −0.1 nA hyperpolarizing current pulse. (B,C;I–IV) Decreasing/increasing the cell size increases/decreases input resistance of the cell. This causes higher/lower frequency of tonic response to a depolarizing current. (B,C;V,VII,VIII). For a constant density of T-channels, reducing/increasing the size of the cell, or reducing/increasing the dendritic area increased/decreased input resistance as well as Ntotal of the cell. This gives more/less sodium spikes induced by LTS.
(B,C;VI) Despite the fact that smaller/larger soma has a higher/lower input resistance, the number of T-channels is also decreased/increased. Therefore, the same hyperpolarized current pulse was found sufficient/insufficient to activate enough T-channels for rebound burst response.
We analyzed the effect of size of the section on the cell responses. A reduction in the size of an individual compartment (soma, proximal or distal denrites) led to an increase in input resistance and frequency of tonic response (Figure 5
B, II–IV). However, the LTS response to a hyperpolarizing current injection was different. When the diameter of soma changed to 1/3 of its initial value, the total number of T-channels reduced to 69% of threshold value, which was far from the lower limit (97%) of total T-channels to generate a rebound burst response (Figure 5
B, VI). When the diameter of proximal or distal dendrite was decreased, then Ntotal decreased. Despite this, such number was higher than the threshold (minimal) number of T-channels required to generate an LTS response. During rebound the neuron fired with large number of action potentials (Figure 5
B, VII–VIII). Increasing the size of the cell reduced input resistance resulting in passive responses in reaction to a depolarized or hyperpolarized current (Figure 5
C, I and V). Smaller soma or dendritic section reduced firing frequency and even prevented induction of action potentials during tonic or LTS response (Figure 5
C, II–V, VII and VIII). Again, for a T-current distribution with higher density in proximal section, an LTS response for a bigger soma does not follow the expected pattern. Increasing the somatic area reduced tonic frequency but generated more sodium spikes during the rebound burst. In this case, the total number of T-channels was 150% of the threshold value. This means that the same hyperpolarized current can activate more T-channels which leads to a larger LTS response with more action potentials (Figure 5
C, VI). These numerical simulations based on a 3-compartment model of TC cell for the case of a higher density of T-channel in proximal dendritic section show that smaller distal dendrites and bigger soma are favorable to generate rebound bursts in the TC neuron.
Further, we investigated the effect of cell size on rebound spike generation when the density of T-current was higher in soma (Figure 6
A) or distal dendrite (Figure 6
B). When a higher density of T-channels was located in the somatic section, increasing/decreasing somatic diameter increased/reduced the input resistance of the cell. Hence, a higher/lower frequency in the response to a depolarizing current pulse was obtained (not shown). When the total number of T-channels exceeded the threshold value in a larger cell, having a lower input resistance, the injected hyperpolarizing current activated a sufficient number of T-channels to generate a rebound burst (Figure 6
A, II and VI). Increasing size of both, the proximal and distal dendritic section, did not shift the ratio of the number of total and threshold T-channels to a specific range which generates a rebound burst response (Figure 6
A, VII and VIII). Decreasing the diameter of dendritic sections provided a higher than threshold value for T-channels which led to more sodium spikes during LTS response (Figure 6
A, I, III and IV). When a higher density of T-channels was located in distal dendrites (Figure 6
B), reducing the size of the cell increased input resistance and Ntotal, causing more sodium spikes during LTS (Figure 6
B, I–IV). With increased cell size and constant channel density, the rebound burst was found absent (Figure 6
B, V–VIII).
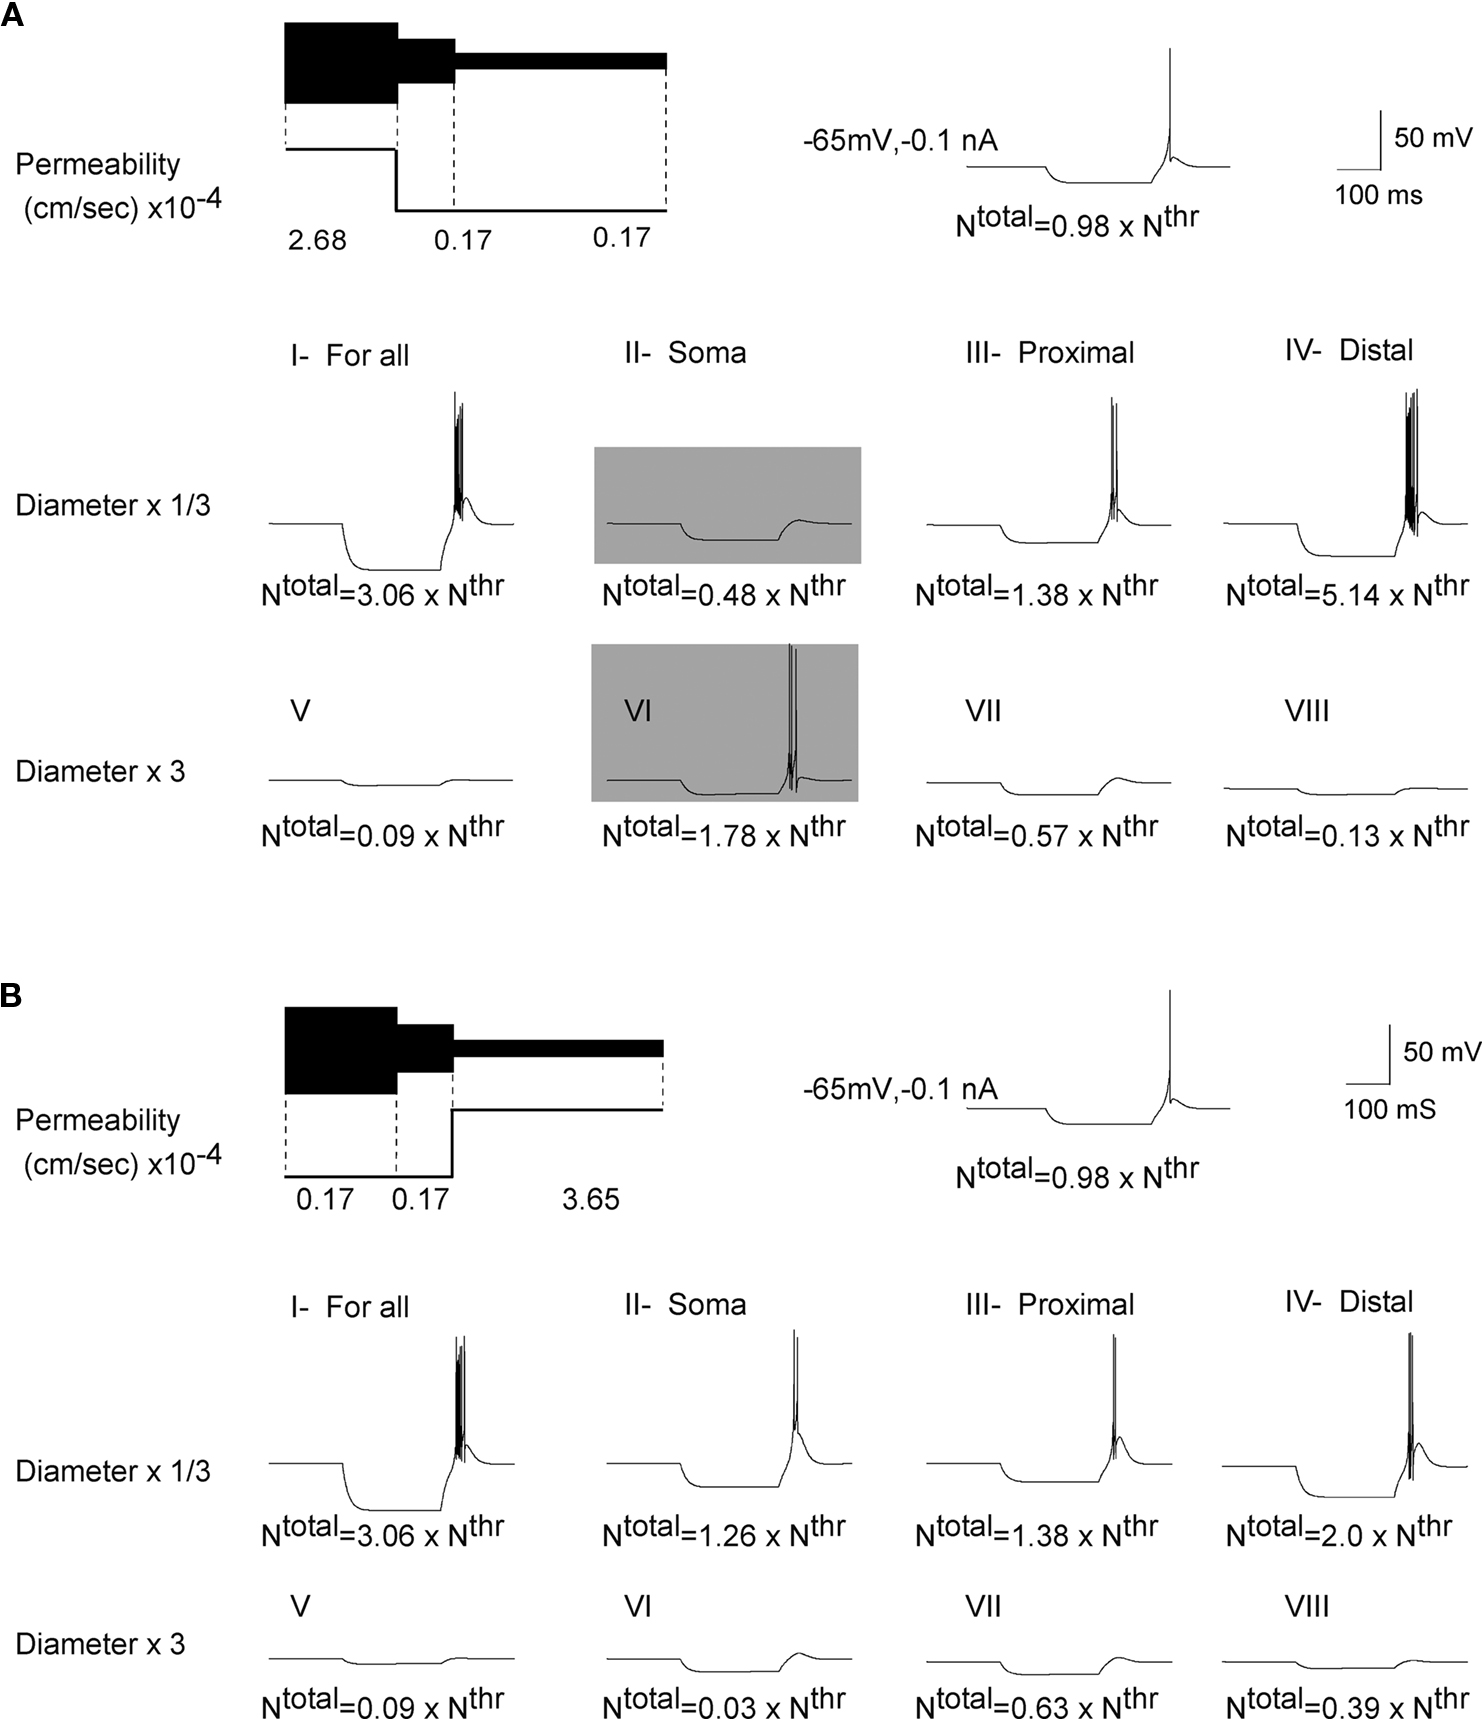
Figure 6. Influence of geometry on the response of cell with a higher
T-channel density in somatic or distal dendritic sections. (A) LTS response with a higher density of T-channels located in soma. (A; I, III and IV) Reducing the size of the cell decreased the total number of T-channels, but still its value was higher than threshold. Thus the model produced an LTS response accompanied with burst firing. (A; V, VII, VIII) Increasing the size of the cell increased the total number of T-channels, which was smaller than threshold. Thus model reproduced a passive response. (A; II) Reducing the size of the soma changes the ratio in the number of total to threshold T-channels to the value of 48%. This was not sufficient to generate LTS. (A; VI) increasing the size of soma changed the ratio in the channel number to 178%, which leads to a rebound burst. (B) The LTS response with a higher density of T-channels located in distal dendrites. (B; I–VIII) Reducing the cell size makes the cell more excitable, which produces a higher frequency for the LTS response. A larger cell has a smaller input resistance and the ratio of Ntotal to Nthr of T-channels was found to lie outside of the range of LTS generation.
Multi-Compartment Model
In a multi-compartment model of the TC cell, reconstructed from fluorogold retrograde staining (Figure 7
, Ferecskó et al., 2007
), we distributed non-uniformly the T-channels throughout the cell. We assumed a Gaussian distribution with specific mean value attributed to a high density of T-channels in the proximal, middle, and distal dendrites. In addition, the width of the Gaussian function, defined by parameter σ was changed to study the effect of local channel density on LTS generation (Figure 8
). Like in the 3-compartment model we defined the minimum number of T-channels in the uniform distribution, as the number sufficient to generate an LTS leading to a single spike in response to a depolarized current of 0.1 nA, at hyperpolarized level of Vm = −75 mV. The numerical simulation of an LTS response in which a non-uniform T-channel distribution was used shows that a smaller number of T-channels was sufficient to generate an LTS response. In all simulations with non-uniform channels distribution, the LTS with a single spike was generated when Ntotal = 0.9 × Nthr for σ = 2, and it was Ntotal = 0.8 × Nthr for σ = 0.5 (Figure 8
). However, when the local T-channel density on proximal dendrites was high (σ = 0.5), the LTS accompanied by action potential was generated with only Ntotal = 0.64 × Nthr (Figure 8
). Thus, our model predicts that a high local channel density on proximal dendrites favors LTS generation with a minimal number of channels.
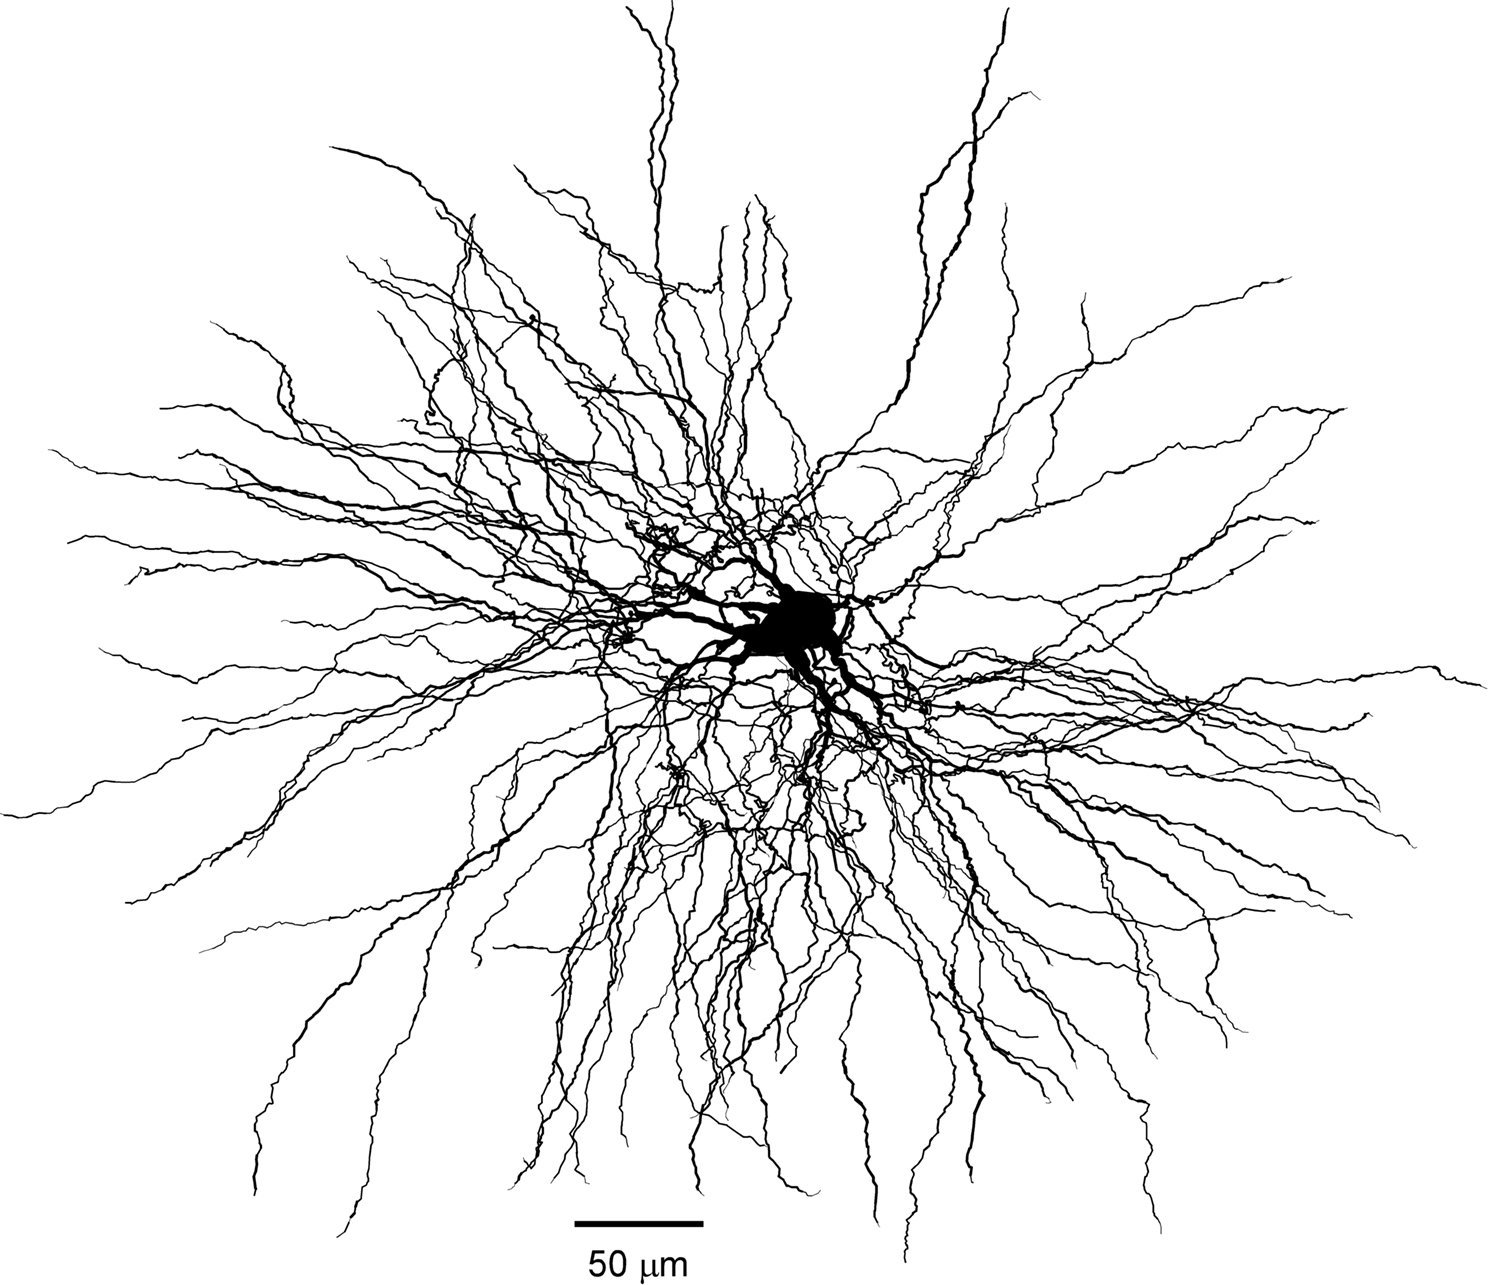
Figure 7. Morphology of reconstructed TC cell. Three-dimensional reconstruction of TC cell from VPL nucleus of adult cat. Retrograde tracer (fluorogold) was injected in somatosensory area SI. The complete dendritic arbor was reconstructed from six serial sections 80 μm each.
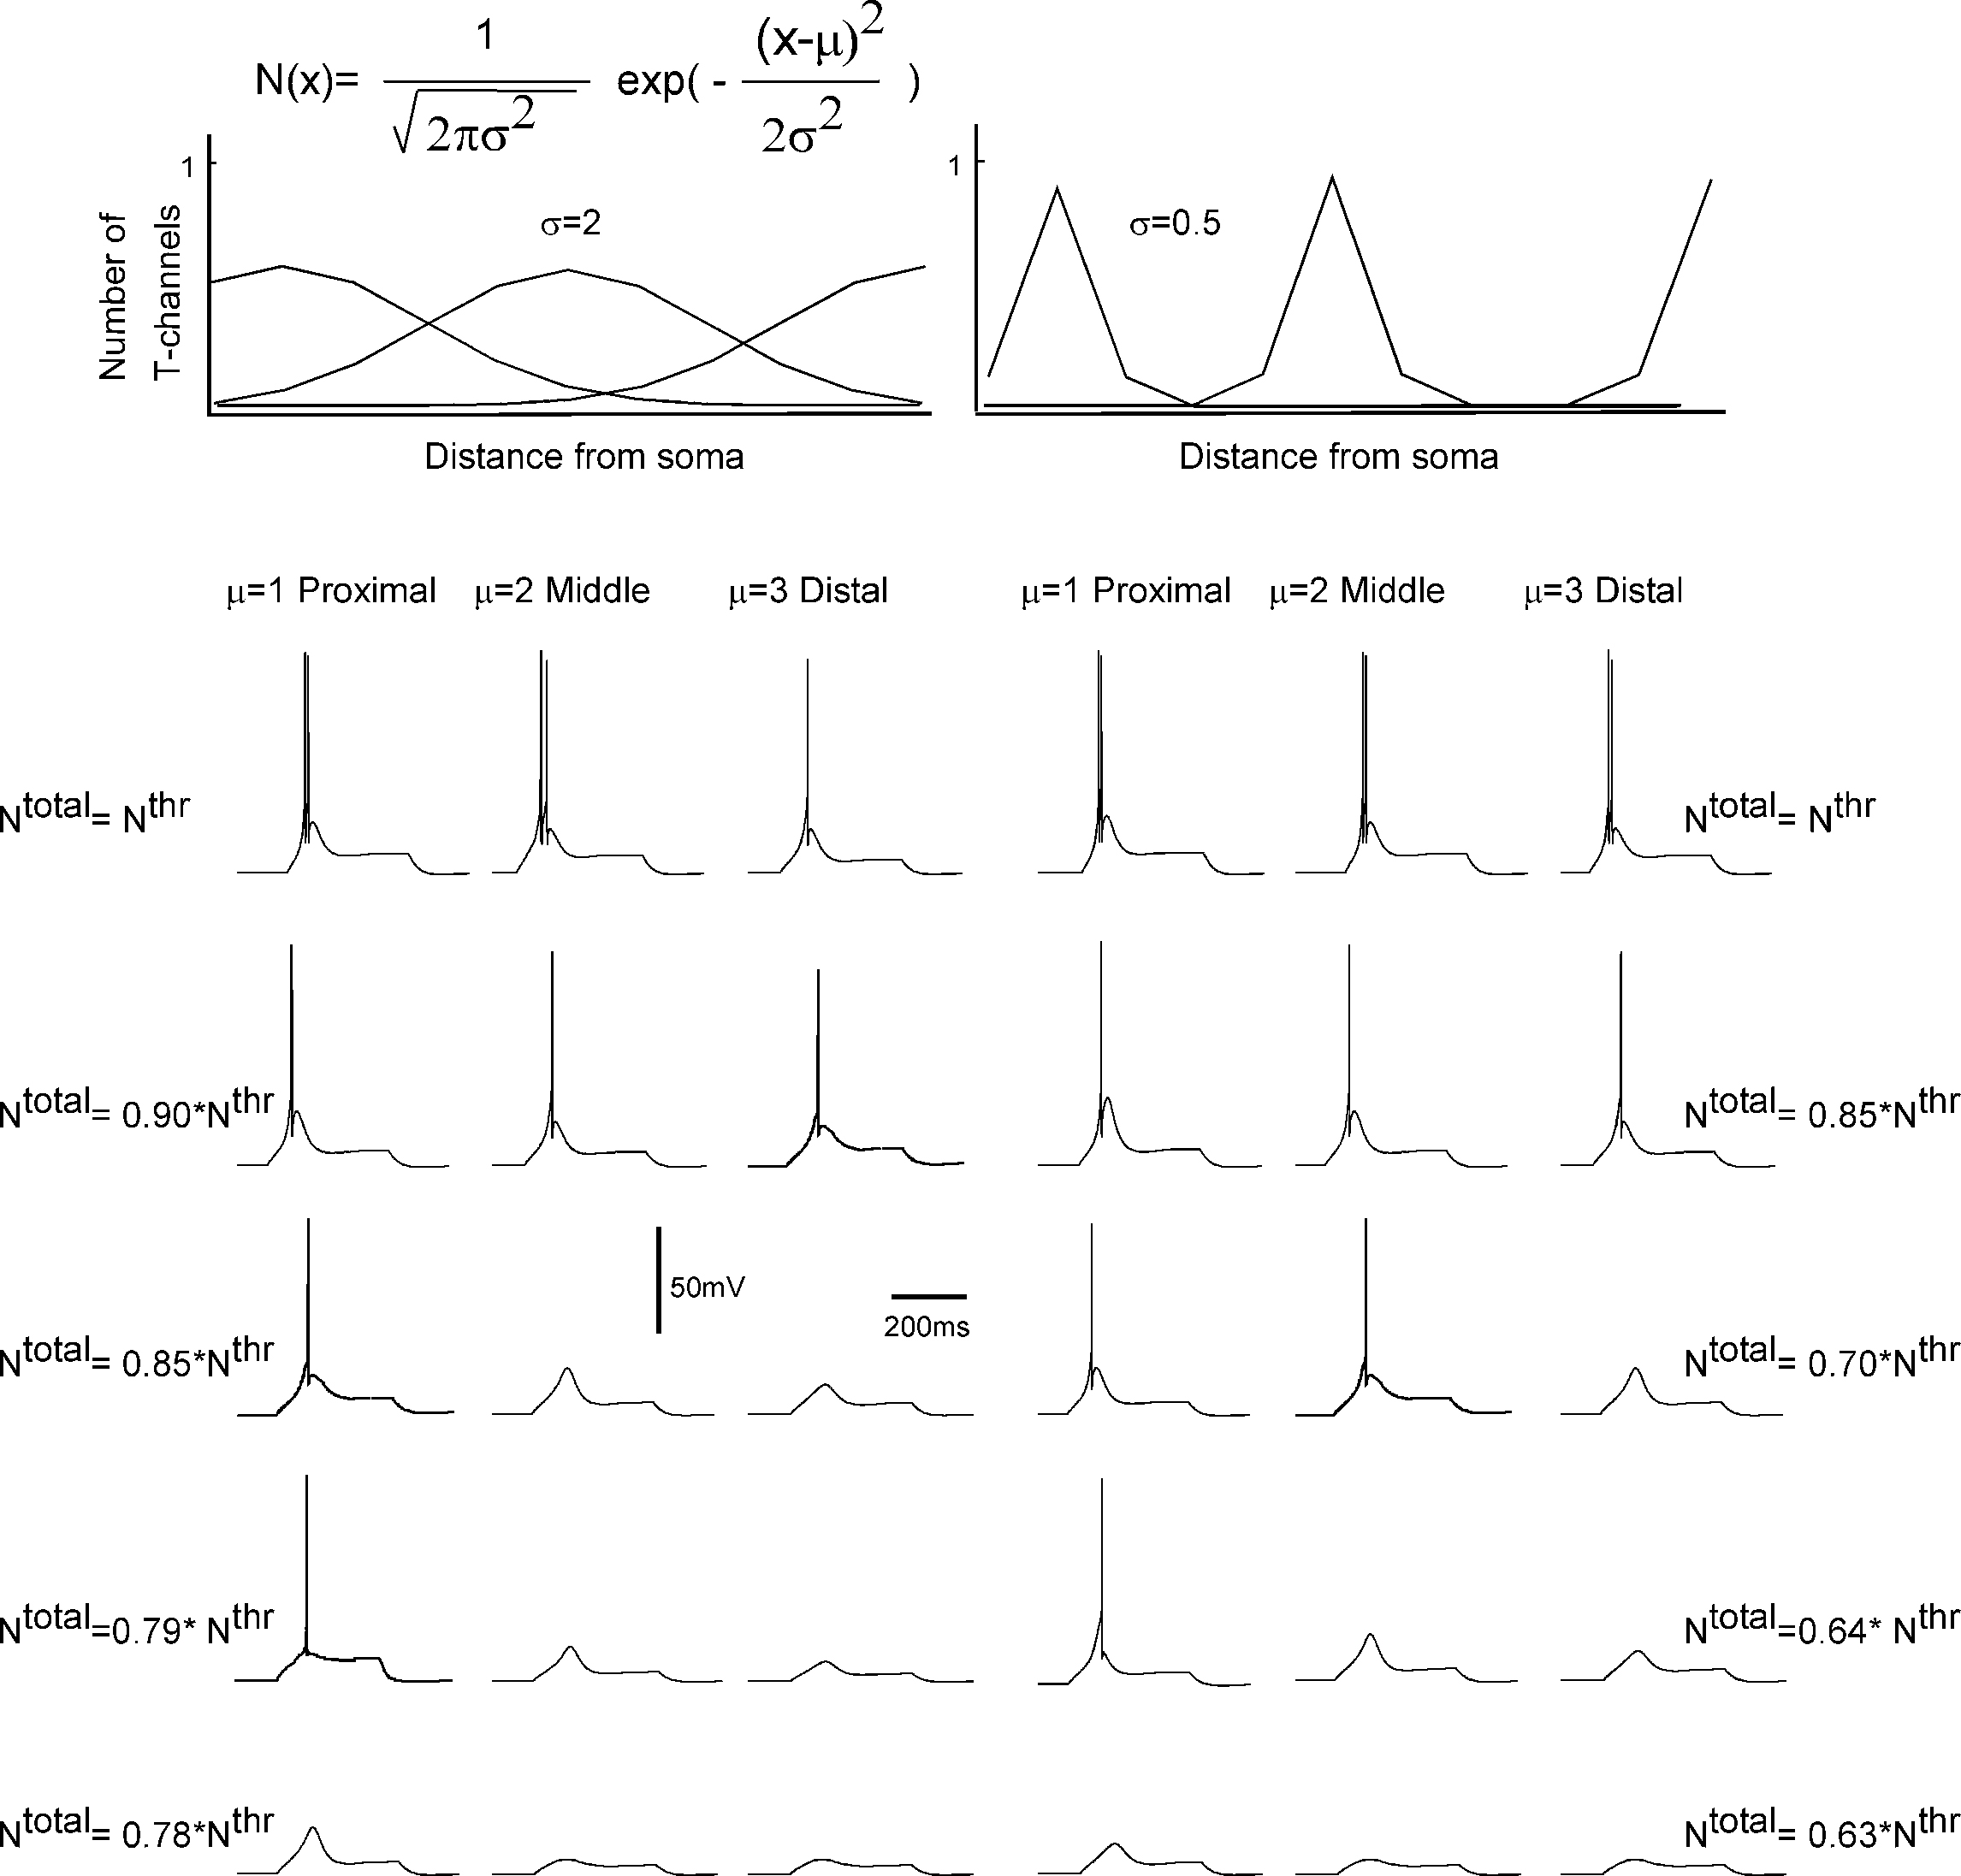
Figure 8. T-channel distribution required for LTS generation with minimal number of channels in multi-compartment model. The upper panel shows the shape of T-channel distribution used in the multi-compartment model. In the left column, the maximal channel density slowly decreases from its maximum value. In the right column, the maximal channel density rapidly decreases from its maximum value. Below examples are given for the response of the modeled neuron kept at −75 mV subject to 0.1 nA square current pulses. Note that the lower number of T-channels necessary to generate LTS occurred when the highest channel density was located in proximal dendrites. In addition, a sharp T-channel distribution leads to LTS generation with fewer channels (bottom, right).
The prime objective of this study was to investigate how different patterns of T-channel distributions influence the LTS response of a TC cell in a 3-compartment and a multi-compartment model. We also investigated the influence of the cell size on the firing pattern. The major findings of this study are: (1) An increase in the value of permeability (number of channels) uniformly in three compartments changed the response of the TC cell from passive to LTS behavior being accompanied by an action potential. (2) The onset of firing does not only depend on the total permeability of T-channels, but also on their distribution. (3) In a 3-compartment model, with a channel number equal or above threshold the TC cell always responded by spiking. If a non-uniform distribution of channels was used, a number of channels smaller than threshold can lead to neuronal firing. (4) In a multi-compartmental model a minimal number of channels required for the generation of LTS with spikes was found to be much lower than in the 3-compartment model. (5) For a high density of T-channels in the soma and proximal section, the frequency of tonic firing was inversely proportional to the diameter of the section, while the low threshold spiking frequency was directly proportional to the diameter of the section. (6) The steepness of channel distribution (higher local density of channels) lowers the required minimal number of T-channels necessary for LTS generation.
Previous modeling studies on the subject compared results obtained in dissociated cells with cells recorded from 200 μm thick slices (Destexhe et al., 1998
). Dissociated cells contained almost no dendrites, while cell recorded from slices contained several truncated dendrites. As we show here, the dendritic arbor of TC cells extends for more than 400 μm (Figure 7
). The study by Destexhe et al. (1998)
demonstrated the presence of significant T-currents in the dendrites. It also demonstrated that the most robust features of LTS can be reproduced in a reduced 3-compartment model. In our numerical simulations, we took a 3-compartment model and demonstrated that in such model the uniform vs. non-uniform channel distribution can influence LTS generation in the range 97–100% of channel number ratio (Figure 4
). However, when we used a morphologically intact cell as basis of our model (Figure 7
), the shape of channel distribution played a major role. If the highest density of T-channels was located on proximal dendrites, the minimal number of T-channels able to generate an LTS-spike response was only 64% of threshold value. Therefore, comparison of our data to the dissociated cells or cells recorded from slices (Destexhe et al., 1998
) provided solid differences, because most of distal dendrites are absent in the cells from slices.
A general principle, which living organisms use to accomplish many functions, is the principle of minimal resourses. The result of our study predicts that similar to sodium channels distribution (Crotty et al., 2006
), the non-uniform distribution of T-channels, could be essential for the generation of LTS using minimal resources. Most of proteins, including T-channels are synthesized in the cell body and transported from there to its destination. Protein synthesis and transport requires energy. In addition, the metabolic energy consumption is proportional to the ionic currents generated in the neuron via ATPpase Na+/K+ or Ca2+/Na+ metabolic exchangers (Dipolo and Beauge, 2006
; Goldberg et al., 2003
; Laughlin et al., 1998
; Lennie, 2003
). Following LTS generation, the intracellular Ca2+ concentration increases, and reestablishing Ca2+ concentration takes additional energy. Thus, optimizing the number of channels would optimize metabolic energy consumption. The closest place for T-channels to be located in the plasma membrane is the cellular body. However, most of inhibitory synapses are formed in the body of TC neurons (Liu et al., 1995a
,b
). Thus, the shunting created by inhibitory activities would prevent generation of LTS even with relatively high density of T-channels. The next closest place being energy efficient for T-channels would be the proximal portion of the dendritic tree. Indirect experimental measures (Williams and Stuart, 2000
; Zhou et al., 1997
), congruent with the current study suggested the presence of high density of T-channels on proximal dendrites of TC cells. Our parallel electron microscopy study using immunogold staining of T-channel subunits in reticular thalamic nucleus demonstrated that in reticular nucleus cells, the T-channels are non-uniformly distributed (Kovács et al., 2007
). The definite conclusion about the exact distribution of T-channels in the TC cytoplasmic membrane may be reached from high-resolution electron microscopy experiments. Optimization of metabolic energy consumption is a decisive factor for the ion channel distribution (Crotty et al., 2006
). Our results from the three- and multi-compartment model predict the existence of such window.
Even if T-channels would be equally distributed over the cytoplasmic membrane, the T-channels could be either in the phosphorylated or de-phosphorylated state. Phosphorylation facilitates the generation of T-current at resting membrane potential (Leresche et al., 2004
). Thus, state dependent changes of the membrane potential could create a non-uniform distribution of phosphorylated T-channels in different compartments of TC neurons and would facilitate the generation of LTS.
We conclude that although different factors could be responsible for a decrease in the availability of T-channels for LTS generation (physical number of channels or ratio of phosphorylated/de-phosphorylated channels), all the factors inducing a non-uniform distribution of T-channels on LTS generation will favor generation of LTS. The effect of non-uniform distribution of T-channels on LTS generation in neurons with realistic (much more complex) dendritic tree was found to be stronger. Neuron Mod files are available on our web site (http://w3.fmed.ulaval.ca/dev/timofeevgroup/
).
The authors declare that the research was conducted in the absence of any commercial or financial relationships that could be construed as a potential conflict of interest.
H.K has been supported by NSERC Canada. I.T has been supported by NSERC Canada, CIHR, and NIH. We are grateful to Alain Destexhe and Maxim Bazhenov for valuable advises that helped to develop our model and K Kovács for help with staining procedure.