Stress and Simulated Environments: Insights From Physiological Marker
 Magnus Liebherr1,2,3*
  Silke M. Mueller1,2
  Stephan Schweig3 Niko Maas3 Dieter Schramm3
  Matthias Brand1,2
- 1Department of General Psychology: Cognition, University of Duisburg-Essen, Duisburg, Germany
- 2Erwin L. Hahn Institute for Magnetic Resonance Imaging, Essen, Germany
- 3Department of Mechatronics, University of Duisburg-Essen, Duisburg, Germany
Driving in a simulator might induce stress because of the confrontation with new environments, dealing with new technologies, and experience with symptoms of simulator sickness, which, in turn, may influence individuals’ driving performance. The present study aims to provide a better understanding of the association between simulated environments and humans’ stress level under consideration of age, simulator adaptation, experience with simulator sickness, and driving performance. Data from 164 participants (M = 61.62 years, SD = 12.66 years, ranging from 25 to 89 years, 42 women) were analyzed in the present study. During three measurement times, participants completed an advance first simulator drive (T0), followed by an online survey, assessing experience with simulator sickness (T1), and a second simulator drive (T2) including pre- and post-cortisol measurements. The hypothesized model shows no correlations of driving performance with experience with simulator sickness or stress level before and after a further simulator drive. Beyond the effect of age, previous experience with simulator sickness does further account for stress-level changes following a simulated drive but current driving performance did not. The present study provides relevant findings for future studies in the field of simulated environments.
Introduction
Stress can negatively affect humans’ behavior, in learning and memory (e.g., Schwabe et al., 2008; Wolf, 2009; Wolf, 2019), decision-making (e.g., Gathmann et al., 2014), and also driving (e.g., Rimini-Doering et al., 2001). In the past, studies frequently highlighted negative effects of stress on driving performance as well as on accident rate (e.g., Matthews, Dorn et al., 1998; Rimini-Doering et al., 2001). While driving is most frequently investigated in simulated environments and previous findings indicate a relation between the usage of new technologies and stress induction (e.g., Thomée et al., 2007), it seems inevitable to consider the possibility of simulator-induced stress. Therefore, the present study aims to provide a better understanding of the relation between simulated environments and the human stress level under consideration of individual factors, simulator adaptation, and previous experience with simulator sickness, within a driving simulator.
Driving a car activates several brain regions, such as the prefrontal cortex (Jäncke et al., 2008) and the basal ganglia (Uchiyama et al., 2003), both of which are affected by a stress-induced increase in the level of catecholamines and/or cortisol (Cohen et al., 2002; Nieoullon, 2002; Ramos and Arnsten, 2007; Cabib and Puglisi-Allegra, 2012). To quantify acute psychophysiological effects of driving, Yamaguchi and Sakakima (2007) measured salivary alpha-amylase prior to and every 3 min during a 21-min simulated drive. Results indicated a significant increase in stress level during the driving period, compared to the baseline measure. Along with the assessment of alterations in endocrine activity, heart rate is frequently used as a biomarker to investigate individuals’ stress level. For example, Ashton et al. (1972) reported a relation between heart rate and difficulty of driving scenarios. Their results are supported by findings from flight simulator studies (e.g., Roscoe, 1992; Ylönen et al., 1997; Lee and Liu, 2003). For example, Lee and Liu (2003) identified an increased heart rate during flight phases with high information load, such as take-off and landing, compared to phases with lower information load.
Comparisons of simulated and real scenarios reported no differences in the ‘Driving Behaviour Inventory’ (Gulian et al., 1989; Matthews et al., 1991; Dorn and Matthews, 1995). In contrast, Engström et al. (2005) identified increased stress reactions in real, compared to simulated driving, quantified by physiological parameters. The authors discussed an indication of increased effort due to a higher risk in real scenarios compared to simulated scenarios as responsible for the effects. Their findings are confirmed by Johnson et al. (2011), who reported significantly higher means of heart rate in on-road vs. simulated driving. However, Reimer and Mehler (2011) showed similar patterns of heart rate and electrodermal arousal with increased cognitive workload in simulated driving compared to on-road driving but with higher absolute levels in the real world.
In addressing the topic of simulator-related stress, the phenomenon of simulator sickness needs to be considered. During recent years, studies showed simulator sickness–related dropout rates between 5 and 30% (Stanney et al., 1998; Cobb et al., 1999; Stanney et al., 2002). Based on previous findings, it can be assumed that the onset of simulator sickness can trigger stress. For example, Eversmann et al. (1978) reported a stimulation of hormone secretion induced by different degrees of motion sickness. Additionally, the authors identified the secretion of antidiuretic hormones as the most sensitive indicator of motion sickness–induced stress. Further evidence for a relation between motion sickness and stress comes not only from the glucocorticoid/symphaticoadrenergic system (Otto et al., 2006) but also from the endocannabinoid system (Choukèr et al., 2010). Furthermore, the sole anticipation of a stressful event induces stress, as indicated by previous stress studies. Here, results show that simply instructing participants to give a public speech is a common method for inducing stress in laboratory investigations (Levenson et al., 1980; Starck et al., 2008), leading to increased anxiety and negative mood (Al’Absi et al., 1997) and increased cortisol level (Dickerson and Kemeny, 2004; Juster et al., 2012). Interestingly, higher anticipatory stress may also be associated with a larger decrease in cortisol level during stress recovery (Juster et al., 2012). Based on these findings, it can be assumed that previous experiences with simulator sickness may influence the stress level before further simulator usages, in terms of anticipatory stress.
Simulator adaptation reflects the process by which drivers adapt their existing driving skills to the simulator (Sahami et al., 2009) and is related to the occurrence of simulator sickness. Domeyer et al. (2013) indicated that using an initial acclimation to the driving simulator reduces symptoms of simulator sickness. Together with findings from simulator/motion sickness studies, it can be hypothesized that a previous adaptation to the simulated environment decreases the stress level before subsequently using a simulator, compared to individuals who did not adapt. This is in line with the allostatic load model—introduced by Sterling and Eyer (1988)—which claims that stress mainly arises from mental and physical adaptation to novel and changing conditions (see also Sterling, 2012). In these situations, allostatic describes the process by which the body maintains its stability through behavioral changes (McEwen, 1998; McEwen, 2010).
A further aspect that should be considered in the present context concerns age-effects. Previous simulator studies indicated decreased driving performance (e.g., Andrews and Westerman, 2012), increased risk of accidents (e.g., Lee et al., 2003b), and increased mental workload (e.g., Cantin et al., 2009) in older compared to younger drivers. While Lee et al. (2003a) demonstrated the comparability of on-road and simulated driving in quantifying older adults driving performance, Matthews et al. (1999) indicated higher stress level in older adults, compared to their younger counterparts during a simulated driving. Reimer et al. (2006) report higher workload impact in older vs. younger drivers during a simulator driving task. A possible explanation comes from Aldwin (1991), who argues that older adults are perceived to have less control over their environment than younger adults and therefore show a higher stress level. Further studies report increased symptoms of simulator sickness (Classen et al., 2011) as well as a decreased simulator adaptation rate (Domeyer et al., 2013) in older compared to younger adults. According to the allostatic load model, increased stress stems from a higher load necessary in order to adapt to a novel environment or changing condition. This might further explain age-related differences in simulator tasks, since older adults report increased problems with new technologies (Kang and Yoon, 2008; Findlater et al., 2013).
With respect to the reported findings, we conducted a hypothetical model, which is the subject of investigation in the study at hand (Figure 1).
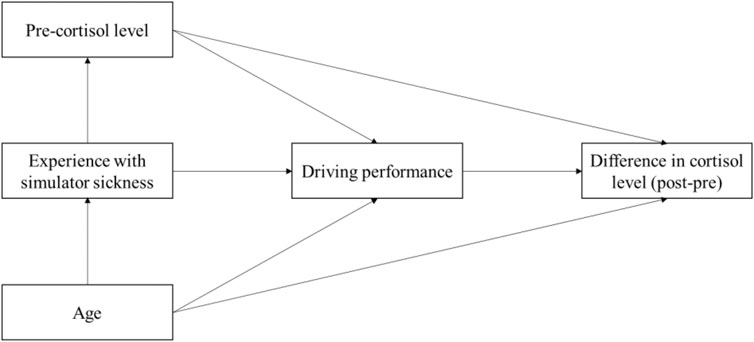
FIGURE 1. The hypothetical model of stress, experience with simulator sickness, and age.
Besides the statistical testing of the hypothetical model, we further aimed at investigating the hypothesis that individuals who had previously adapted to a simulator show lower pre-stress to a subsequent simulator use than individuals who had not adapted.
Methods
Procedure
The present study comprises findings from three measurement times: an advance simulator drive (T0), followed by an online survey assessing symptoms of experienced simulator sickness (T1), and the stress assessment and simulator drive (T2) including a second simulator drive and pre- and post-cortisol measurements. The study at hand is part of a 3-year interdisciplinary research project (ALFASY) funded by the European Regional Development Fund (ERDF.NRW) of the European Union and the State of North Rhine–Westphalia. The project aims to further develop age-based driver assistance systems. The medical check and the baseline investigation (T0) serve for the main project. The current study reports on data that were collected to answer specific research questions, independently of the main project. Further results out of sub-studies from the project are published elsewhere: subjective vs. objective adaptation (Brandtner et al., 2019), driving performance and specific attentional domains (Liebherr et al., 2019), and mental abilities and demographic parameters on simulator adaptation (Liebherr et al., 2020).
Before starting, participants carefully read the instructions and gave written informed consent to participation. Prior to the first simulator drive (T0), participants were medically examined to ensure simulator suitability (e.g., heart rate and assessment of current diseases). After a 10 min break, they received instructions on how to use the simulator. They were informed that they can stop driving at any time in case they feel sick or in case they want to cancel for any other reason. If there were no questions left, participants started the 25-min simulator driving. In order to quantify intensity of simulator sickness symptoms, participants received an e-mail instructing them to conduct an online version of the simulator sickness questionnaire (Brooks et al., 2010). The e-mail was sent 5 days after the first simulator drive (T1), to ensure that symptoms that occur after the experiment are also considered. Completing the questionnaire took about 10 min. Approximately 12 weeks after the first drive, participants visited our laboratory again and completed a further simulator driving task (T2). Before participants entered the driving simulator, a first salivary sample was taken (pre-cortisol measurement). After 20 min of driving, participants had a 5 min break before completing another 20 min of driving in the simulator. Immediately afterward, the second salivary sample was taken (post-cortisol measurement) (see also Figure 2 for a description of the study setup).
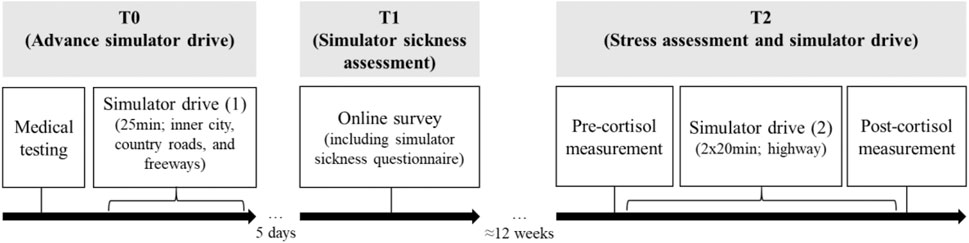
FIGURE 2. Visualization of the experimental setup.
Participants
Originally, 458 individuals (M = 59.45 years, SD = 15.02 years, ranging from 19 to 89 years, 169 women) met the inclusion criteria and took part in T0. Participants reported not to have any neurological or cardiovascular diseases, nor impairments in the abilities to see or hear. Furthermore, individuals did not show any signs of dementia or cognitive decline as indicated by scores below nine in the ‘DemTect-Test’ (Kessler et al., 2000; Kalbe et al., 2004). However, in total 294 participants were excluded from further analyses because they either 1) stopped the baseline testing due to simulator sickness (see Figure 3), 2) did not participate in T1 or T2, or 3) salivary cortisol samples could not be analyzed.
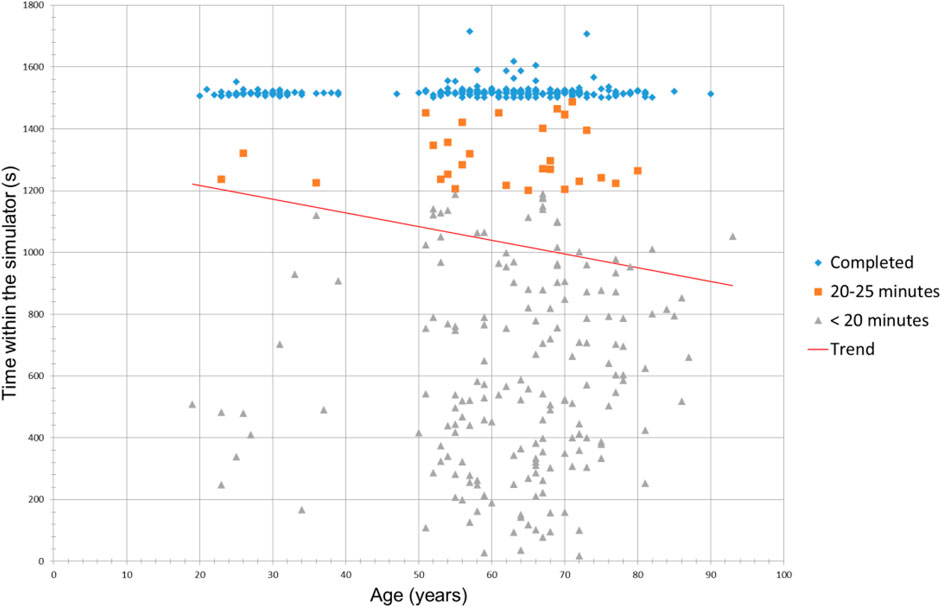
FIGURE 3. Distribution of driving time regarding the age of participants at baseline driving (T0). Those who did not complete the baseline scenario stopped because of symptoms of simulator sickness.
The final sample consisted of 164 participants (M = 61.62 years, SD = 12.66 years, ranging from 25 to 89 years, 42 women). The study was performed in accordance with the ethical standards laid down in the Declaration of Helsinki. A local ethics committee approved the study. All participants provided written informed consent prior to each of the experiments and were informed that they could end participation at any time without reprisal.
Driving Simulator
The simulator consists of a close-to-real vehicle of the compact class, which has been extended by force feedback components for the simulation of forces and torques. The vehicle is positioned in a rectangular ‘cave’ without a movement platform (see Figure 4A for an illustration). The simulated environment is projected on the inner walls of the cave and presented on screens in each of the side mirrors. In addition, behind the rear window of the vehicle, a monitor is placed, which is used for both the rear view and the reflection of the image in the interior mirror. For simulating a realistic driving behavior, the driver inputs are read by means of the vehicle CAN bus and used as inputs of a complete vehicle simulation (cf., Maas et al., 2014). Furthermore, road users are represented in the vehicle environment who interact with the simulated vehicle (see Maas, 2017). The baseline driving scenario (T0) consisted of a 3 × 3 km area with inner-city roads, rural roads, and highways (see Figure 4B for an overview). The total length of 70 km is merged into several loops to provide an infinite scenario without dead ends. The second driving scenario (T2) consisted of the same scenario but limited to the highway only. To ensure a most realistic driving scenario, we did not include any predefined routes or preceding cars which the participants should follow.
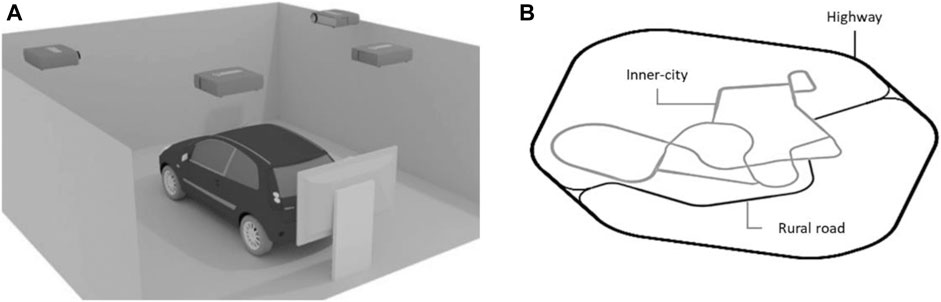
FIGURE 4. (A) Schematic representation of the driving simulator used. The four projectors on the ceiling display the virtual environment on the walls around the vehicle. The monitor behind the vehicle is used for both the rear view and the reflection of the image in the interior mirror. (B) Sketch of the baseline driving scenario consisting of inner-city roads, rural roads, and highways. The driving scenario in T2 used the same scenario but limited to highway only.
Within the baseline scenario (T0), driving performance was quantified only for determining the time of adaptation. While previous simulator studies with mixed road-scenarios (rural roads and freeways) measured driving performance by considering only single driving parameters, we used the index of performance (IOP), calculated by Joshi’s algorithm (Joshi et al., 2017). The IOP contains numerous criteria that provide information on driving performance (steering behavior, activity of the pedals, and lane drifts) which are considered to the same extent. During unconventional driving—such as large steering movements or pushing the accelerator and brake pedals to their end position—the IOP increases. As soon as the participant had adapted to the system, the IOP stagnates or decreases. To identify the time of adaptation, the IOP and its gradient were calculated and graphically displayed using ‘MATLAB’. Figure 5 shows an example of the driving performance (measured by the IOP) of a person who has adapted to the simulator and one who has not. Driving performance at T2 was calculated by using the IOP, but without pedal activity since it is negligible in quantifying driving performance on highways. Therefore, the IOP at T2 (reflecting driving performance at T2) comprised means of steering movements and lane drifts only. It has to be mentioned that a higher IOP indicates worse driving performance.
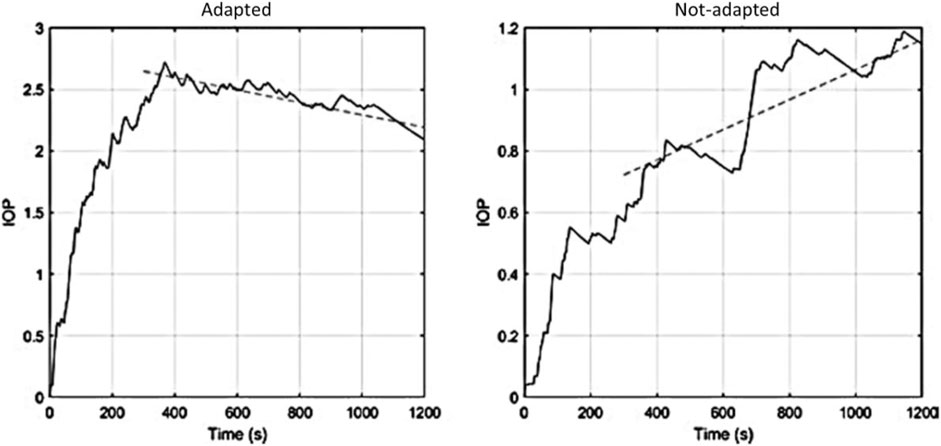
FIGURE 5. Two examples of driving performances measured by individual IOP. Participant in panel (A) adapted to the simulator after about 400 s, whereas panel (B) did not.
Simulator Sickness Questionnaire
In the online survey (T1), we used the Simulator Sickness Questionnaire with a ten-stage intensity scale, ranging from 0 “none” to 10 “severe” (Brooks et al., 2010). In addition to the 16 symptoms comprised in the questionnaire, we added “vomiting” as additional symptom. The questionnaire was used as an online version. The sum score across the intensity of all symptoms was calculated as measure of simulator sickness experience.
Salivary Cortisol
We collected endocrine indicators of stress by sampling salivary cortisol concentrations before and after driving in the simulator a second time (T2). A rise of cortisol concentration indicates the stress response due to HPA axis activity (see Dickerson and Kemeny 2004). Salivary cortisol was assessed by means of unstimulated saliva samples obtained using Salivette collection devices (Sarstedt, Nuembrecht, Germany). The analyses of the individual cortisol levels from the saliva samples were performed by the Genetics Laboratory of the Ruhr-University Bochum (Germany). Interassay and intraassay variations were below 10%. Differences between pre- and post-cortisol levels were calculated by subtracting the first from the second cortisol level, with scores >0 representing an increase and scores <0 representing a decrease of the stress level after simulated driving.
Statistical Analysis
The statistical analyses were carried out by using SPSS 25.0 for Windows (IBM SPSS Statistics). Pearson correlations were calculated to test the bivariate relationships between the variables. We used the Process Macro for SPSS (Hayes, 2017) to test model hypotheses. To test group differences between individuals who had adapted and those who had not adapted in the advance simulator driving scenario, regarding the pre-stress cortisol level before the second driving scenario, we applied a t test for independent samples. The critical level for statistical significance was set to 0.05 for all p values. For the indirect effects, significance was supposed if the 95% confidence interval did not include zero.
Results
Description and Correlations
The mean age, the score of simulator sickness experience, and cortisol levels and their bivariate correlations can be found in Table 1. In contrast to previous findings (e.g., Garcia et al., 2010), we identified no gender differences in symptoms of simulator sickness (men: M = 3.36, SD = 2.65; women: M = 3.16, SD = 2.68; t (162) = 0.42, p = 0.677).
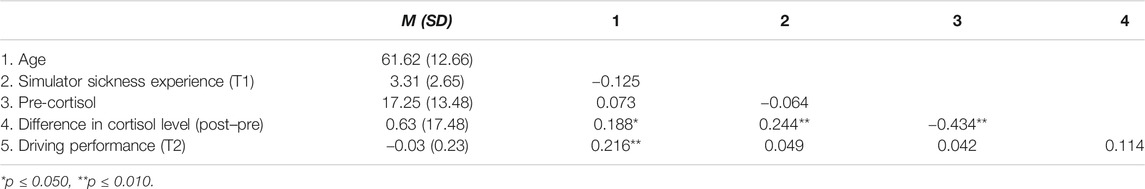
TABLE 1. Descriptive statistics and bivariate correlations between age, simulator sickness experience, pre-cortisol level a difference in cortisol level (post–pre), and driving performance.
Driving performance (T2) correlated with age but not with simulator sickness experience related to T1 nor with measures of stress (T2). Furthermore, simulator sickness experience solely correlated with difference in cortisol level. Therefore, the conditions for testing our originally hypothesized model were not met. We additionally tested correlations with mean driving speed (M = 105.48, SD = 18.94), which is not reflected in the IOP, as this parameter is discussed to decrease in response to internal and external stimuli (Matthews, 1996; Matthews et al., 1999). However, findings are replicated as we identified a significant correlation solely between age and mean driving speed (r = −0.341, p < 0.001).
Based on the theoretical background of the original model, we alternatively tested potential interaction effects between a) age × driving performance and b) age × simulator sickness experience on the difference in stress levels (post–pre cortisol levels). Therefore, we applied two hierarchical moderated regression analyses with age (predictor) in the first step, a) driving performance (IOP) and b) simulator sickness experience (moderators), respectively, in the second step, and the interaction term in the third step; the difference in cortisol level (post–pre) was the dependent variable (all variables are centralized, Cohen et al., 2003).
Hierarchical Moderated Regression Analyses
In the first step, age did lead to a significant explanation of differences in cortisol levels [R2 = 0.029, F (1,162) = 5.914, p = 0.016]. Adding driving performance in the second step did not lead to a significant increase of variance explanation [ΔR2 = 0.006, ΔF (1,161) = 0.954, p = 0.330] and neither did the interaction of age and driving performance in the third step [ΔR2 = 0.003, ΔF (1,160) = 0.474, p = 0.492]. The overall model accounted for 2.6% of the variance in cortisol-level change (F = 2.439, p = 0.492). The second analysis, including simulator sickness experience, revealed a significant additional explanation of variance (beyond the effect of age) in cortisol-level difference of nearly 10% [ΔR2 = 0.073, ΔF (1,161) = 13.097, p < 0.001]. In the third step, the interaction between age and simulator sickness experience was not significant [ΔR2 = 0.014, ΔF (1,160) = 2.470, p = 0.118]. The overall model was significant, accounting for 10.5% of the variance in difference in cortisol level before and after simulator drive (F = 7.366, p < 0.001).
Effects of Previous Simulator Adaptation
Mean pre-cortisol level (second scenario) of participants who had reported previous simulator adaptations (T0) showed slightly decreased pre-cortisol levels (M = 16.55, SD = 11.70) before the second driving scenario (T2) compared to participants who had not adapted previously (M = 17.67, SD = 14.39). However, this difference was not statistically significant [ t (160) = 0.493, p = 0.623].
Discussion
The present study aimed to provide a better understanding of the relations between stress and simulated environments. Although the original hypothetical model could not be confirmed, the present study identified highly relevant findings that can be summarized as follows:
• Driving performance correlates with age but not with stress level nor with previous experience with simulator sickness.
• Age and previous experiences with simulator sickness predict stress-level changes following a simulated drive.
• Beyond the effect of age, driving performance does not further account for stress-level changes following a simulated drive.
• Individuals who had previously adapted to a simulator and those who had not do not differ in pre-cortisol level of a further simulator drive.
The present findings could not confirm any association of previous simulator sickness experience neither with the stress level before a subsequent simulator drive nor with driving performance. This is in accordance with previous findings, showing that cyber sickness does not necessarily cause anxiety or discomfort with virtual realities (Von Mammen et al., 2016). However, Clapp et al. (2011) indicated an interaction effect between self-reported stress history and anxious driving behavior. In addition, Jeon et al. (2011), who tested the effects of specific negative emotions on driving performance, identified more driving errors for anger than for fear. Previous findings on a relation between stress and behavior could not be confirmed in the present context (Westman and Eden, 1996; Struthers et al., 2000; Siu, 2003). However, it is remarkable that pre-stress level did not correlate with driving performance, albeit the pre-cortisol level is similar to those reported after inducing stress by the most commonly used method, the Trier Social Stress Test (Wolf et al., 2001). The missing effect might be explained by the relatively simple driving scenario in T2 (highway-driving with long straights and smooth curves) and therefore a low variance in driving performance. It can be further assumed that more complex scenarios, such as inner-city routes, would increase the effect of stress on driving performance, as reported by Matthews et al. (1998). The authors described effects of stress on driving performance depending not only on the nature of driver’s stress reactions but also on the traffic environment. Furthermore, Hill and Boyle (2007) identified a relation between not only stress and driver characteristics but also the driving environment. The aspect of environmental characteristics together with the fact that participants were able to freely choose how to drive, without a preceding car, might also explain the missing effect between driving performance and the post-/pre-cortisol level difference.
Prior to the study, we assumed that individuals who previously reported a simulator adaption would show lower pre-cortisol levels of a subsequent simulator drive, compared to those who did not adapt. However, the present findings demonstrate no effects. Here, the relatively long time interval between the baseline drive (T0) and the subsequent drive (T2) must be discussed to potentially be responsible for the missing effect. While previous studies with a repeated use of driving simulators used relatively short intervals (Cooper and Strayer, 2008; Thapa et al., 2015; Large et al., 2017), we used a time interval of approximately 12 weeks between the two simulator investigations. The relevance of the time interval between a training session and the later performance is additionally highlighted in studies on cognitive trainings. For example, Arthur et al. (1998) summarized in their meta-analysis a relatively large decrement in performance, 28–90 days after skill or knowledge trainings. In addition, Arthur et al. (2010) reported a significantly improved task-performance from pre- to post-training (56 days after completing the training) solely in the long-period training group, but not in the short-period training group. In accordance with Roenker et al. (2003), who identified no significant effect of a baseline simulator training on an 18 month later testing score, it can be suggested that the time between the baseline measure and the second measure was too long to produce transfer-effects of simulator adaptation.
Accordingly with previous findings we identified a correlation between age and driving performance. These effects are discussed in terms of numerous aspects, such as vision, motor functions, and also cognitive abilities (e.g., Wood, 2002; Anstey et al., 2005). Furthermore, previous findings on differences in stress and related coping strategies in older adults compared to younger were replicated by a direct effect of age on differences in cortisol level (Folkman et al., 1987; Diehl et al., 1996). This can be explained by the allostatic load model and also empirical findings on age-related differences in simulator tasks, who reported increased problems with new technologies in the elderly (Kang and Yoon, 2008; Findlater et al., 2013).
Based on its relevance, future studies should additionally investigate further individual attributes and conditions of the driver such as fatigue, drowsiness, or emotional status (e.g., Thiffault and Bergeron, 2003). In addition, future studies should consider further physiological measures (e.g., heart rate) and also subjective assessments of stress (e.g., questionnaires), to provide a broader insight into the effects of stress.
The fact that we focused exclusively on individuals who completed the baseline scenario, as only these could be invited to the second scenario, constitutes another limitation of the study at hand. Participants who stopped the baseline scenario prematurely (because of simulator sickness) were excluded from the study and thus not included in analyzing stress reactions in subsequently driving in the simulator. Based on the high numbers of simulator sickness induced dropouts (e.g., Stanney et al., 2002), future studies should explicitly focus on this group of individuals. Furthermore, in the study at hand, participants who completed the first drive were asked to evaluate online their symptoms of simulator sickness 5 days after the first simulator drive. This procedure was based on previous findings that identified lasting effects of the symptoms up to one week or longer (Ungs, 1987). However, for future studies, we recommend applying the simulator sickness questionnaire twice (subsequently afterward and a few days later) in order to avoid biases in intensity recall and to make it more comparable to general protocols.
Present findings need to be discussed under consideration of the driving scenario. Here, we used solely a highway scenario for the second testing in the simulator. However, it can be assumed that more complex driving scenarios with different environments such as inner-city roads or rural roads (e.g., Ronen and Yair, 2013) and also different conditions such as day, night, rain, or fog (e.g., Konstantopoulos et al., 2010) would lead to different findings and, therefore, should be tested in future studies.
Despite the limitations and the partially contradictory results, the present study provides relevant findings for future simulator studies. Especially, the findings of a missing relation between previous experience with simulator sickness symptoms (in participants who completed the baseline testing) and further simulator driving performance seems to be relevant for future studies. Accordingly, previous experience with simulator sickness does not need to be an exclusion criterion for participating in future simulator studies as it does not seem to have significant effects on participant’s performance or level of stress. Rather, age can be considered a relevant influencing factor. Among others, this aspect should be considered further with regard to varying time intervals between different measurements as well as regarding participants who do not finish the baseline testing because of simulator sickness.
Data Availability Statement
The raw data supporting the conclusions of this article will be made available by the authors, without undue reservation.
Ethics Statement
The studies involving human participants were reviewed and approved by the ethics committee of the division of Computer Science and Applied Cognitive Sciences at the Faculty of Engineering. The patients/participants provided their written informed consent to participate in this study.
Author Contributions
All authors were equally involved in the conception of the study. DS and MB came up with the project idea and accompanied the study as supervisors. ML and SM were responsible for neuropsychological testing and stress measurement. NM and SS were responsible for the investigations in the simulator. Everyone was equally involved in the writing of the manuscript.
Conflict of Interest
The authors declare that the research was conducted in the absence of any commercial or financial relationships that could be construed as a potential conflict of interest.
References
Aldwin, C. M. (1991). Does age affect the stress and coping process? Implications of age differences in perceived control. J. Gerontol. 46 (4), P174–P180. doi:10.1093/geronj/46.4.p174
Al’Absi, M., Bongard, S., Buchanan, T., Pincomb, G. A., Licinio, J., and Lovallo, W. R. (1997). Cardiovascular and neuroendocrine adjustment to public speaking and mental arithmetic stressors. Psychophysiology 34, 266–275. doi:10.1111/j.1469-8986.1997.tb02397.x
Andrews, E. C., and Westerman, S. J. (2012). Age differences in simulated driving performance: compensatory processes. Accid. Anal. Prev. 45, 660–668. doi:10.1016/j.aap.2011.09.047
Anstey, K. J., Wood, J., Lord, S., and Walker, J. G. (2005). Cognitive, sensory and physical factors enabling driving safety in older adults. Clin. Psychol. Rev. 25 (1), 45–65. doi:10.1016/j.cpr.2004.07.008
Arthur, W., Day, E. A., Villado, A. J., Boatman, P. R., Kowollik, V., Bennett, W., et al. (2010). The effect of distributed practice on immediate posttraining, and long-term performance on a complex command-and-control simulation task. Hum. Perform. 23 (5), 428–445. doi:10.1080/08959285.2010.515277
Arthur, W., Bennett, W., Stanush, P. L., and McNelly, T. L. (1998). Factors that influence skill decay and retention: a quantitative review and analysis. Hum. Perform. 11, 57–101. doi:10.1207/s15327043hup1101_3
Ashton, H., Savage, R. D., Thompson, J. W., and Watson, D. W. (1972). A method for measuring human behavioural and physiological responses at different stress levels in a driving simulator. Br. J. Pharmacol. 45 (3), 532–545. doi:10.1111/j.1476-5381.1972.tb08111.x
Brandtner, A., Liebherr, M., Schweig, S., Maas, N., Schramm, D., and Brand, M. (2019). Subjectively estimated vs. objectively measured adaptation to driving simulators - effects of age, driving experience, and previous simulator adaptation. Transp. Res. Part F Traffic Psychol. Behav. 64, 440–446. doi:10.1016/j.trf.2019.05.019
Brooks, J. O., Goodenough, R. R., Crisler, M. C., Klein, N. D., Alley, R. L., Koon, B. L., et al. (2010). Simulator sickness during driving simulation studies. Accid. Anal. Prev. 42 (3), 788–796. doi:10.1016/j.aap.2009.04.013
Cabib, S., and Puglisi-Allegra, S. (2012). The mesoaccumbens dopamine in coping with stress. Neurosci. Biobehav. Rev. 36 (1), 79–89. doi:10.1016/j.neubiorev.2011.04.012
Cantin, V., Lavallière, M., Simoneau, M., and Teasdale, N. (2009). Mental workload when driving in a simulator: effects of age and driving complexity. Accid. Anal. Prev. 41 (4), 763–771. doi:10.1016/j.aap.2009.03.019
Choukèr, A., Kaufmann, I., Kreth, S., Hauer, D., Feuerecker, M., Thieme, D., et al. (2010). Motion sickness, stress and the endocannabinoid system. PLoS One 5 (5), e10752. doi:10.1371/journal.pone.0010752
Clapp, J. D., Olsen, S. A., Danoff-Burg, S., Hagewood, J. H., Hickling, E. J., Hwang, V. S., et al. (2011). Factors contributing to anxious driving behavior: the role of stress history and accident severity. J. Anxiety Disord. 25 (4), 592–598. doi:10.1016/j.janxdis.2011.01.008
Classen, S., Bewernitz, M., and Shechtman, O. (2011). Driving simulator sickness: an evidence-based review of the literature. Am. J. Occup. Ther. 65 (2), 179–188. doi:10.5014/ajot.2011.000802
Cobb, S. V., Nichols, S., Ramsey, A., and Wilson, J. R. (1999). Virtual reality-induced symptoms and effects (VRISE). Presence Teleoperators Virtual Environ. 8 (2), 169–186. doi:10.1162/105474699566152
Cohen, J. D., Braver, T. S., and Brown, J. W. (2002). Computational perspectives on dopamine function in prefrontal cortex. Curr. Opin. Neurobiol. 12 (2), 223–229. doi:10.1016/s0959-4388(02)00314-8
Cohen, J. D., Cohen, P., West, S. G., and Aiken, L. S. (2003). Applied multiple regression/correlation analysis for the behavioral sciences. Mahwah, NJ: Lawrence Erlbaum.
Cooper, J. M., and Strayer, D. L. (2008). Effects of simulator practice and real-world experience on cell-phone—related driver distraction. Hum. Factors 50 (6), 893–902. doi:10.1518/001872008x374983
Dickerson, S. S., and Kemeny, M. E. (2004). Acute stressors and cortisol responses: a theoretical integration and synthesis of laboratory research. Psychol. Bull. 130 (3), 355–391. doi:10.1037/0033-2909.130.3.355
Diehl, M., Coyle, N., and Labouvie-Vief, G. (1996). Age and sex differences in strategies of coping and defense across the life span. Psychol. Aging 11 (1), 127–139. doi:10.1037/0882-7974.11.1.127
Domeyer, J. E., Cassavaugh, N. D., and Backs, R. W. (2013). The use of adaptation to reduce simulator sickness in driving assessment and research. Accid. Anal. Prev. 53, 127–132. doi:10.1016/j.aap.2012.12.039
Dorn, L., and Matthews, G. (1995). Prediction of mood and risk appraisals from trait measures: two studies of simulated driving. Eur. J. Pers. 9 (1), 25–42. doi:10.1002/per.2410090103
Engström, J., Johansson, E., and Östlund, J. (2005). Effects of visual and cognitive load in real and simulated motorway driving. Transp. Res. Part F Traffic Psychol. Behav. 8 (2), 97–120. doi:10.1016/j.trf.2005.04.012
Eversmann, T., Gottsmann, M., Uhlich, E., Ulbrecht, G., Werder, K. V., and Scriba, P. C. (1978). Increased secretion of growth hormone, prolactin, antidiuretic hormone, and cortisol induced by the stress of motion sickness. Aviat. Space Environ. Med. 49 (1), 53–57. doi:10.5282/ubm/epub.8290
Findlater, L., Froehlich, J. E., Fattal, K., Wobbrock, J. O., and Dastyar, T. (2013). “Age-related differences in performance with touchscreens compared to traditional mouse input,” in Proceedings of the SIGCHI Conference on Human Factors in Computing Systems, Yokohama, Japan, May 8–13, 2021, 343–346.
Folkman, S., Lazarus, R. S., Pimley, S., and Novacek, J. (1987). Age differences in stress and coping processes. Psychol. Aging 2 (2), 171–184. doi:10.1037/0882-7974.2.2.171
Garcia, A., Baldwin, C., and Dworsky, M. (2010). “Gender differences in simulator sickness in fixed- versus rotating-base driving simulator,” in Proceedings of the human factors and ergonomics society annual meeting, Vol. 54, No. 19 (Los Angeles, CA: SAGE Publications), 1551–1555. doi:10.1177/154193121005401941
Gathmann, B., Schulte, F. P., Maderwald, S., Pawlikowski, M., Starcke, K., Schäfer, L. C., et al. (2014). Stress and decision making: neural correlates of the interaction between stress, executive functions, and decision making under risk. Exp. Brain Res. 232 (3), 957–973. doi:10.1007/s00221-013-3808-6
Gulian, E., Matthews, G., Glendon, A. I., Davies, D. R., and Debney, L. M. (1989). Dimensions of driver stress. Ergonomics 32 (6), 585–602. doi:10.1080/00140138908966134
Hayes, A. F. (2017). Introduction to mediation, moderation, and conditional process analysis: a regression-based approach. 2nd Edn. Newyork, NY: Guilford Publications.
Hill, J. D., and Boyle, L. N. (2007). Driver stress as influenced by driving maneuvers and roadway conditions. Transp. Res. Part F Traffic Psychol. Behav. 10 (3), 177–186. doi:10.1016/j.trf.2006.09.002
Jäncke, L., Brunner, B., and Esslen, M. (2008). Brain activation during fast driving in a driving simulator: the role of the lateral prefrontal cortex. Neuroreport 19 (11), 1127–1130. doi:10.1097/wnr.0b013e3283056521
Jeon, M., Yim, J. B., and Walker, B. N. (2011). “An angry driver is not the same as a fearful driver: effects of specific negative emotions on risk perception, driving performance, and workload,” in Proceedings of the 3rd international conference on automotive user interfaces and interactive vehicular applications, Salzburg, Austria, November, 2011. Editors M. Kranz, G. Weinberg, A. Meschtscherjakov, M. Murer, and D. Wilfinger (New York, NY: Association for Computing Machinery), 137–142.
Johnson, M. J., Chahal, T., Stinchcombe, A., Mullen, N., Weaver, B., and Bedard, M. (2011). Physiological responses to simulated and on-road driving. Int. J. Psychophysiol. 81 (3), 203–208. doi:10.1016/j.ijpsycho.2011.06.012
Joshi, S. S., Maas, N., and Schramm, D. (2017). “A vehicle dynamics based algorithm for driver evaluation,” in 11th International conference on intelligent systems and control (ISCO), Coimbatore, India, January 5–6, 2017, 40–44. doi:10.1109/isco.2017.7856028
Juster, R. P., Perna, A., Marin, M. F., Sindi, S., and Lupien, S. J. (2012). Timing is everything: anticipatory stress dynamics among cortisol and blood pressure reactivity and recovery in healthy adults. Stress 15 (6), 569–577. doi:10.3109/10253890.2012.661494
Kalbe, E., Kessler, J., Calabrese, P., Smith, R., Passmore, A. P., Brand, M. A., et al. (2004). DemTect: a new, sensitive cognitive screening test to support the diagnosis of mild cognitive impairment and early dementia. Int. J. Geriatr. Psychiatry 19 (2), 136–143. doi:10.1002/gps.1042
Kang, N. E., and Yoon, W. C. (2008). Age- and experience-related user behavior differences in the use of complicated electronic devices. Int. J. Hum. Comput. Stud. 66 (6), 425–437. doi:10.1016/j.ijhcs.2007.12.003
Kessler, J., Calabrese, P., Kalbe, E., and Berger, F. (2000). DemTect: a new screening method to support diagnosis of dementia. Psycho 26 (6), 343–347. doi:10.1002/gps.1042
Konstantopoulos, P., Chapman, P., and Crundall, D. (2010). Driver’s visual attention as a function of driving experience and visibility. Using a driving simulator to explore drivers’ eye movements in day, night and rain driving. Accid. Anal. Prev. 42 (3), 827–834. doi:10.1016/j.aap.2009.09.022
Large, D. R., Burnett, G., Morris, A., Muthumani, A., and Matthias, R. (2017). “A longitudinal simulator study to explore drivers’ behaviour during highly-automated driving,” in Proceedings of the AHFE 2017 international conference on human factors in transportation, Los Angeles, CA, July 17−21, 2017. Editor N. Stanton (Cham, Switzerland: Springer), 583–594. doi:10.1007/978-3-319-60441-1_57
Lee, H. C., Cameron, D., and Lee, A. H. (2003a). Assessing the driving performance of older adult drivers: on-road versus simulated driving. Accid. Anal. Prev. 35 (5), 797–803. doi:10.1016/s0001-4575(02)00083-0
Lee, H. C., Lee, A. H., Cameron, D., and Li-Tsang, C. (2003b). Using a driving simulator to identify older drivers at inflated risk of motor vehicle crashes. J. Saf. Res. 34 (4), 453–459. doi:10.1016/j.jsr.2003.09.007
Lee, Y. H., and Liu, B. S. (2003). Inflight workload assessment: comparison of subjective and physiological measurements. Aviat. Space Environ. Med. 74 (10), 1078–1084.
Levenson, R. W., Sher, K. J., Grossmann, L. M., Newman, J., and Newlin, D. B. (1980). Alcohol and stress response dampening: pharmacological effects, expectance, and tension reduction. J. Abnormal Psychol. 89, 528–538. doi:10.1037/0021-843x.89.4.528
Liebherr, M., Antons, S., Schweig, S., Maas, N., Schramm, D., and Brand, M. (2019). Driving performance and specific attentional domains. Transp. Res. Interdiscip. Perspect. 3, 100077. doi:10.1016/j.trip.2019.100077
Liebherr, M., Schweig, S., Brandtner, A., Averbeck, H., Maas, N., Schramm, D., et al. (2020). When virtuality becomes real: relevance of mental abilities and age in simulator adaptation and dropouts. Ergonomics, 63, 1271–1280. doi:10.1080/00140139.2020.1778095
Maas, N., Hesse, B., Koppers, M., and Schramm, D. (2014). “Simulator setup according to use case scenarios-a human-oriented method for virtual development,” in 10th International conference on mechatronic and embedded systems and applications, Senigallia, Italy, September 10–12, 2014 (IEEE), 1–6.
Maas, N. (2017). Konzeptionierung, Auslegung und Umsetzung von Assistenzfunktionen für die Übergabe der Fahraufgabe aus hochautomatisiertem Fahrbetrieb. Doctoral dissertation. Duisburg (Germany): Universitätsbibliothek Duisburg-Essen.
Matthews, G. (1996). Individual differences in driver stress and performance. Proc. Hum. Factors Ergon. Soc. Annu. Meet. 40 (12), 579–583. doi:10.1177/154193129604001205
Matthews, G., Dorn, L., and Glendon, A. I. (1991). Personality correlates of driver stress. Pers. Individ. Differ. 12 (6), 535–549. doi:10.1016/0191-8869(91)90248-a
Matthews, G., Dorn, L., Hoyes, T. W., Davies, D. R., Glendon, A. I., and Taylor, R. G. (1998). Driver stress and performance on a driving simulator. Hum. Factors 40 (1), 136–149. doi:10.1518/001872098779480569
Matthews, G., Joyner, L. A., and Newman, R. (1999). Age and gender differences in stress responses during simulated driving. Proc. Hum. Factors Ergon. Soc. Annu. Meet. 43 (18), 1007–1011. doi:10.1177/154193129904301802
McEwen, B. S. (1998). Protective and damaging effects of stress mediators. N. Engl. J. Med. 338 (3), 171–179. doi:10.1056/nejm199801153380307
McEwen, B. S. (2010). Stress, sex, and neural adaptation to a changing environment: mechanisms of neuronal remodeling. Ann. New York Acad. Sci. 1204, 38–59. doi:10.1111/j.1749-6632.2010.05568.x
Nieoullon, A. (2002). Dopamine and the regulation of cognition and attention. Prog. Neurobiol. 67 (1), 53–83. doi:10.1016/s0301-0082(02)00011-4
Otto, B., Riepl, R. L., Klosterhalfen, S., and Enck, P. (2006). Endocrine correlates of acute nausea and vomiting. Auton. Neurosci. 129 (1-2), 17–21. doi:10.1016/j.autneu.2006.07.010
Ramos, B. P., and Arnsten, A. F. (2007). Adrenergic pharmacology and cognition: focus on the prefrontal cortex. Pharmacol. Ther. 113 (3), 523–536. doi:10.1016/j.pharmthera.2006.11.006
Reimer, B., Mehler, B. L., Pohlmeyer, A. E., Coughlin, J. F., and Dusek, J. A. (2006). The use of heart rate in a driving simulator as an indicator of age-related differences in driver workload. Adv. Transp. Stud. Spec. Issue, 9–20.
Reimer, B., and Mehler, B. (2011). The impact of cognitive workload on physiological arousal in young adult drivers: a field study and simulation validation. Ergonomics 54 (10), 932–942. doi:10.1080/00140139.2011.604431
Rimini-Doering, M., Manstetten, D., Altmueller, T., Ladstaetter, U., and Mahler, M. (2001). “Monitoring driver drowsiness and stress in a driving simulator,” in Proceedings of the first international driving symposium on human factors in driver assessment, training and vehicle design, Colorado, United States, August 14–17, 2001, 58–63.
Roenker, D. L., Cissell, G. M., Ball, K. K., Wadley, V. G., and Edwards, J. D. (2003). Speed-of-processing and driving simulator training result in improved driving performance. Hum. Factors 45 (2), 218–233. doi:10.1518/hfes.45.2.218.27241
Ronen, A., and Yair, N. (2013). The adaptation period to a driving simulator. Transp. Res. Part F Traffic Psychol. Behav. 18, 94–106. doi:10.1016/j.trf.2012.12.007
Roscoe, A. H. (1992). Assessing pilot workload. Why measure heart rate, HRV and respiration?. Biol. Psychol. 34 (2–3), 259–287. doi:10.1016/0301-0511(92)90018-p
Sahami, S., Jenkins, J., and Sayed, T. (2009). Methodology to analyze adaptation in driving simulators. Transp. Res. Rec. J. Transp. Res. Board 2138, 94–101. doi:10.3141/2138-13
Schwabe, L., Bohringer, A., Chatterjee, M., and Schachinger, H. (2008). Effects of pre-learning stress on memory for neutral, positive and negative words: different roles of cortisol and autonomic arousal. Neurobiol. Learn. Mem. 90 (1), 44–53. doi:10.1016/j.nlm.2008.02.002
Siu, O. L. (2003). Job stress and job performance among employees in Hong Kong: the role of Chinese work values and organizational commitment. Int. J. Psychol. 38 (6), 337–347. doi:10.1080/00207590344000024
Stanney, K. M., Kingdon, K. S., and Kennedy, R. S. (2002). Dropouts and after effects: examining general accessibility to virtual environment technology. Proc. Hum. Factors Ergon. 46 (26), 2114–2118. doi:10.1177/154193120204602603
Stanney, K. M., Mourant, R. R., and Kennedy, R. S. (1998). Human factors issues in virtual environments: a review of the literature. Presence 7 (4), 327–351. doi:10.1162/105474698565767
Starcke, K., Wolf, O. T., Markowitsch, H. J., and Brand, M. (2008). Anticipatory stress influences decision making under explicit risk conditions. Behav. Neurosci. 122 (6), 1352–1360. doi:10.1037/a0013281
Sterling, P. (2012). Allostasis: a model of predictive regulation. Physiol. Behav. 106 (1), 5–15. doi:10.1016/j.physbeh.2011.06.004
Sterling, P., and Eyer, J. (1988). “Allostasis: a new paradigm to explain arousal pathology,” in Handbook of life stress, cognition and health. Editors K. Fisher, and J. Reason (Oxford, England: John Wiley and Sons), 629–649.
Struthers, C. W., Perry, R. P., and Menec, V. H. (2000). An examination of the relationship among academic stress, coping, motivation, and performance in college. Res. Higher Edu. 41 (5), 581–592. doi:10.1023/a:1007094931292
Thapa, R., Codjoe, J., Ishak, S., and McCarter, K. S. (2015). Post and during event effect of cell phone talking and texting on driving performance-a driving simulator study. Traffic Inj. Prev. 16 (5), 461–467. doi:10.1080/15389588.2014.969803
Thiffault, P., and Bergeron, J. (2003). Monotony of road environment and driver fatigue: a simulator study. Accid. Anal. Prev. 35 (3), 381–391. doi:10.1016/s0001-4575(02)00014-3
Thomée, S., Eklöf, M., Gustafsson, E., Nilsson, R., and Hagberg, M. (2007). Prevalence of perceived stress, symptoms of depression and sleep disturbances in relation to information and communication technology (ICT) use among young adults - an explorative prospective study. Comput. Hum. Behav. 23 (3), 1300–1321. doi:10.1016/j.chb.2004.12.007
Uchiyama, Y., Ebe, K., Kozato, A., Okada, T., and Sadato, N. (2003). The neural substrates of driving at a safe distance: a functional MRI study. Neurosci. Lett. 352 (3), 199–202. doi:10.1016/j.neulet.2003.08.072
Ungs, T. J. (1987). Simulator induced syndrome: evidence for long term simulator aftereffects. Proc. Hum. Factors Soc. Annu. Meet. 31 (5), 505–509. doi:10.1177/154193128703100505
Von Mammen, S., Knote, A., and Edenhofer, S. (2016). “Cyber sick but still having fun,” in Proceedings of the 22nd ACM conference on virtual reality software and technology, Munich, Germany, November, 2016 (New York, NY: Association for Computing Machinery), 325–326. doi:10.1145/2993369.2996349
Westman, M., and Eden, D. (1996). The inverted-U relationship between stress and performance: a field study. Work Stress 10 (2), 165–173. doi:10.1080/02678379608256795
Wolf, O. T., Schommer, N. C., Hellhammer, D. H., McEwen, B. S., and Kirschbaum, C. (2001). The relationship between stress induced cortisol levels and memory differs between men and women. Psychoneuroendocrinology 26 (7), 711–720. doi:10.1016/s0306-4530(01)00025-7
Wolf, O. T. (2009). Stress and memory in humans: twelve years of progress? Brain Res. 1293, 142–154. doi:10.1016/j.brainres.2009.04.013
Wolf, O. T. (2019). “The impact of psychosocial stress on cognition,” in Routledge international handbook of social neuroendocrinology. Editors O. C. Schultheiss, and P. H. Mehta (New York, NY: Routledge), 441–452.
Wood, J. M. (2002). Age and visual impairment decrease driving performance as measured on a closed-road circuit. Hum. Factors 44 (3), 482–494. doi:10.1518/0018720024497664
Yamaguchi, M., and Sakakima, J. (2007). Evaluation of driver stress in a motor-vehicle driving simulator using a biochemical marker. J. Int. Med. Res. 35 (1), 91–100. doi:10.1177/147323000703500109
Keywords: simulator sickness, aging, stress, simulated environment, driving performance
Citation: Liebherr M, Mueller SM, Schweig S, Maas N, Schramm D and Brand M (2021) Stress and Simulated Environments: Insights From Physiological Marker. Front. Virtual Real. 2:618855. doi: 10.3389/frvir.2021.618855
Received: 03 December 2020; Accepted: 15 February 2021;
Published: 21 April 2021.
Edited by:
Michael Madary, University of the Pacific, United StatesReviewed by:
Felix Schoeller, École des Hautes Études en Sciences Sociales, FranceFlorian Daiber, German Research Center for Artificial Intelligence (DFKI), Germany
Copyright © 2021 Liebherr, Mueller, Schweig, Maas, Schramm and Brand. This is an open-access article distributed under the terms of the Creative Commons Attribution License (CC BY). The use, distribution or reproduction in other forums is permitted, provided the original author(s) and the copyright owner(s) are credited and that the original publication in this journal is cited, in accordance with accepted academic practice. No use, distribution or reproduction is permitted which does not comply with these terms.
*Correspondence: Magnus Liebherr, magnus.liebherr@uni-due.de