 Rossana Gómez-Campos1,2
 Rubén Vidal Espinoza3Miguel de Arruda4Enio Ricardo Vaz Ronque5Camilo Urra-Albornoz6Juan Carlos Minango7Fernando Alvear-Vasquez8Christian de la Torre Choque9Luis Felipe Castelli Correia de Campos10
 Jose Sulla Torres11Marco Cossio-Bolaños2,12*
- 1Departamento de Diversidad e Inclusividad Educativa, Universidad Católica del Maule, Talca, Chile
- 2Faculty of Education, Psychology and Sport Sciences, University of Huelva, Huelva, Spain
- 3Universidad Católica Silva Henriquez, Santiago, Chile
- 4Universidad Estadual de Campinas, São Paulo, Brazil
- 5Departamento de Educação Física (DEF), Universidade Estadual de Londrina, Londrina, Brazil
- 6Escuela de Ciencias del Deporte, Facultad de Salud, Universidad Santo Tomás, Santiago, Chile
- 7Instituto Tecnológico Universitario Ruminahui, Sangolqui, Ecuador
- 8Facultad de Educación, Universidad Autónoma de Chile, Talca, Chile
- 9Universidad San Ignacio de Loyola, Lima, Perú
- 10Departamento de Ciencias de la Educación, Facultad de Educación y Humanidades, Universidad del Bio-Bio, Chillán, Chile
- 11Universidad Católica de Santa María, Arequipa, Perú
- 12Departamento de Ciencias de la Actividad Física, Universidad Católica del Maule, Talca, Chile
Introduction: Measurement of hand grip strength (HGS) has been proposed as a key component of frailty and has also been suggested as a central biomarker of healthy aging and a powerful predictor of future morbidity and mortality.
Objectives: (a) To determine whether a nonlinear relationship model could improve the prediction of handgrip strength (HGS) compared to the linear model and (b) to propose percentiles to evaluate HGS according to age and sex for a regional population of Chile from infancy to senescence.
Methods: A cross-sectional descriptive study was developed in a representative sample of the Maule region (Chile). The volunteers amounted to 5,376 participants (2,840 men and 2,536 women), with an age range from 6 to 80 years old. Weight, height, HGS (right and left hand) according to age and sex were evaluated. Percentiles were calculated using the LMS method [(L (Lambda; asymmetry), M (Mu; median), and S (Sigma; coefficient of variation)].
Results and discussion: There were no differences in HGS from 6 to 11 years of age in both sexes; however, from 12 years of age onwards, males presented higher HGS values in both hands (p < 0.05). The linear regression between age with HGS showed values of R2 = 0.07 in males and R2 = 0.02 in females. While in the non-linear model (cubic), the values were: R2 = 0.50 to 0.51 in men and R2 = 0.26 in women. The percentiles constructed by age and sex were: P5, P15, P50, P85, and P95 by age range and sex. This study demonstrated that there is a nonlinear relationship between chronological age with HGS from infancy to senescence. Furthermore, the proposed percentiles can serve as a guide to assess and monitor upper extremity muscle strength levels at all stages of life.
Introduction
Hand grip strength (HGS) is the amount of static force that the hand can generate around the dynamometer. It is defined as the ability of the hand to grasp objects between the thumb and fingers (1). It is characterized by completing a maximal isometric grip strength task, in which individuals squeeze a grip dynamometer with maximal effort for a short period of time and then the contracted musculature is relaxed (2).
Overall muscle strength is conveniently assessed by measuring (HGS) with a hand grip dynamometer (3). This equipment objectively measures upper extremity isometric strength (4) and is considered a prime candidate for use in routine medical examinations given its simplicity and low cost for assessing isometric strength in children, youth and adults (5).
Measurement of HGS has been proposed as a key component of frailty phenotypes and has also been suggested as a central biomarker of healthy aging and a powerful predictor of future morbidity and mortality in both young, as well as older adult populations (6, 7).
Indeed, measures of muscle strength and physical performance are increasingly used for research and practice. It is timely to review and identify appropriate tools for their assessment (8), so norm-referenced percentiles are an alternative to help interpret the performance of an individual compared to a reference population (9).
In that sense, reference ranges for HGS from infancy to senescence have been reported in several studies in high-income countries such as England (10) Canada (11) and the United States (12, 13). These scales are comparable and measurable to aid in interpetation of test results and decision making (13), such as the reference values proposed by the Center for Disease Control and Prevention [CDC] (14), developed from the United States National Health and Nutrition Examination Survey (NHANES).
These references are very scarce in South America, such as the study developed in Colombia (15). However, in Chile, as far as is known, no studies have been identified that cover a wide age range that would allow the assessment of HGS from 6 to 80 years of age, as has been observed in previous studies.
In general, reference values should be interpreted using specific ranges according to geographic region, ethnicity (16), age, sex, height (7). This is due to the fact that, not all country populations present similar characteristics (social, economic, cultural, demographic, nutritional and anthropometric). Therefore, their trajectories usually present varied levels of muscular strength performances, being higher in men in relation to women. These differences appear during the stage of growth and maturation, passing through youth, middle adulthood and old age) (10, 11).
Consequently, studying HGS from infancy to senescence is relevant, due to its ability to predict skeletal muscle strength throughout life, as studies generally use linear regression models to predict HGS (1, 17, 18). However, it is possible that there is a nonlinear relationship between age and HGS, as the cubic model could improve the predictive power of isometric strength when it is intended to be analyzed from infancy to senescence.
Therefore, the objectives of the study were (a) to determine whether a nonlinear relationship model could improve the prediction of HGS compared to the linear model and (b) to propose percentiles to assess HGS according to age and sex for a regional population of Chile from infancy to senescence.
Methodologic
Type of study and sample
A descriptive cross-sectional study was developed in a representative sample of the Maule region (Chile). The details of the sampling process were described in a previous study (19). Sampling was probabilistic (random). The volunteers amounted to 5,376 participants (2,840 males and 2,536 females), with an age range of 6 to 80 years old. They were recruited from public schools (schoolchildren aged 6 to 17 years), public and private universities (aged 18 to 30 years) and middle-aged and older adults from social programs offered by the Municipality of Talca (Maule Region). Maule is located in the seventh region of Chile 230 km south of the capital Santiago and the Development Index (HDI) for 2018 was 0.872, while for the country it was 0.847 (20).
Regarding the socio-demographic indicators of the Maule region (Chile), according to the Ministerio de Desarrollo Social Chile (21), there are small differences in relation to the capital of chile (Santiago). For example, the average years of schooling in the Maule region are around ~9.8 years, the employment rate is 55.7%, unemployment rate 6.9%, state social welfare 55.7%, private social welfare 5.9%. While, in the capital Santiago, the average years of schooling are ~11.6 years, the employment rate is 58.9%, unemployment rate 6.9%, state social security 71.0%, and private social security 21.3%.
All study participants signed the informed consent form, in which they authorized the anthropometric measurements and the assessment of HGS. For those under 18 years of age, it was the parents and/or guardians who signed the informed consent. Participants who were of a nationality other than Chilean were excluded, as well as those who presented some type of physical disability (that prevented them from being able to look after themselves). People who previously reported stroke, spinal cord or brain injury, or upper extremity disabilities were also excluded from the study.
The research was conducted from 2015 to 2018 and was developed according to the Declaration of Helsinki for human beings and had the approval of the University Ethics Committee (UA-238-2014).
Techniques and procedures
A team of 6 evaluators was formed to collect data from the study sample. The anthropometric variables and the HGS were collected in schools, universities, and in the facilities of the social programs of the Municipality of Talca. This procedure was carried out from Monday to Friday from 8:30 am to 12:30 pm. Data such as age and date of birth were collected from the registration forms of each institution.
Anthropometric measurements of weight and height were evaluated according to the recommendations of Ross and Marfell-Jones (22). All participants wore as little clothing as possible (shorts, T-shirt, and bare feet). Body weight (kg) was measured using an electric scale (Tanita, Glasgow, UK, Ltd), accurate to 100g and with a scale from 0 to 150 kg. Height was measured in the standing position and according to the Frankfort plane (23). A portable stadiometer (Seca Gmbh and Co. KG. Hamburg, Germany), with an accuracy of 0.1 mm, and a scale of 0 to 205 cm, was used. Both anthropometric measurements were evaluated 2 times, where the relative technical error of measurement (TEM%) was 1.2%.
The HGS of both hands (right and left) was assessed by dynamometry. A JAMAR hydraulic dynamometer (brand name) (Hydraulic Hand Dynamometer® Model PC-5030 J1, Fred Sammons, Inc., Burr Ridge, IL: USA) was used. This equipment has an accuracy of 0.1 kg and a scale up to 100 kg/f. We used the protocol proposed by Richards et al. (24), where participants were tested one by one in a seated position (standard position in a straight-backed chair). Each subject performed two attempts with each hand and one of the evaluators adjusted the dynameter to the grip size of the equipment. The hands performing the grips were alternated to minimize fatigue effects (1 to 2 min rest between each attempt). The best measurement was recorded for each of the two attempts. The TEM% between the two evaluations ranged from 1.2 to 1.5%.
Statistics
The normality of the distribution of the data (weight, height and HGS) was verified by means of the Kolmogorov-Smirnov test. Descriptive statistics (mean and standard deviation) were calculated by age and sex strata. Significant differences between both sexes were verified by means of the Student's t-test for two samples. Different linear and nonlinear (cubic) regression analysis models were used, being the third degree cubic polynomial model the most adequate for both sexes (between age and HGS): HGS = a + b1(age) + b2(age)2 + b3(age)3, where: a is the intercept, b1, b2 and b3 are regression parameters, estimated from the data. The regression analysis was performed separately for each sex. For significance, p < 0.05 was adopted and calculations were performed in Microsoft Excel spreadsheets, SPSS 16.0 software and R. Percentile curves were created for HGS for both hands (P5, P15, P50, P85, and P9) using the LMS method [L (Lambda; skewness), M (Mu; median) and S (Sigma; coefficient of variation)] proposed by Cole et al. (25). The LMS Chart Maker software version 2.3 (26) was also used.
Results
Table 1 shows the anthropometric characteristics, and HGS values of both sexes by age ranges. The boys categorized from 6 to 11 years of age presented similar values of weight, height, and HGS (right and left arm) in relation to their female counterparts (p > 0.05). On the contrary, in the age ranges (12 to 19 years, 20 to 29 years, 30 to 39 years, 40 to 49 years, 50 to 59 years, 60 to 69 and 70 to 80 years), males presented significant higher values in relation to females (p < 0.05).
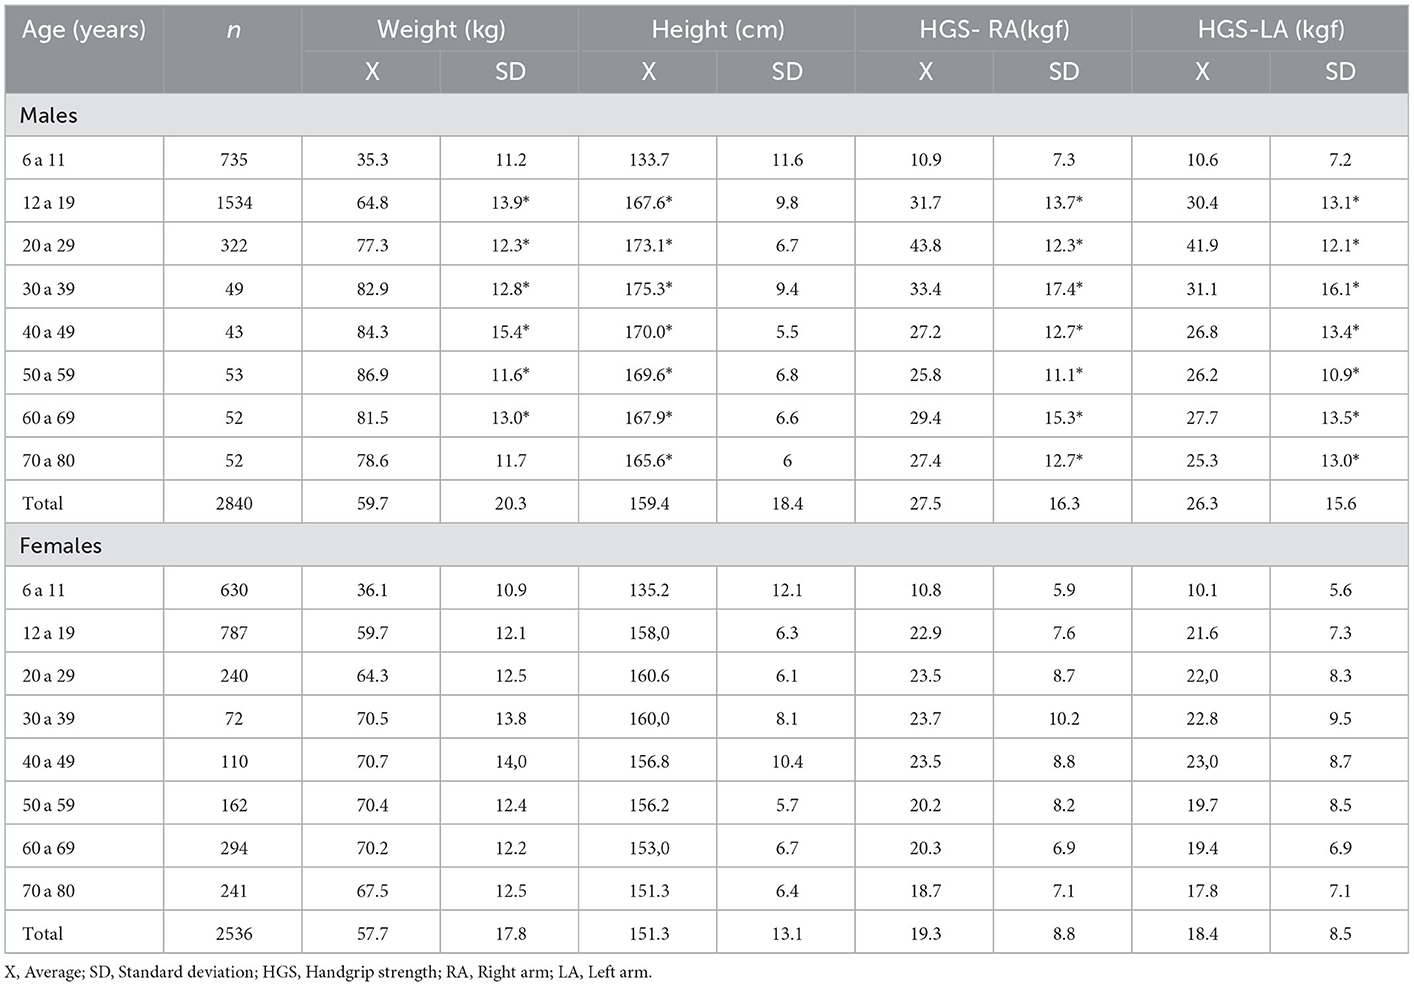
Table 1. Characteristics of the sample studied.
The results of the linear and nonlinear regression between age and HGS can be seen in Figure 1. In the linear relationship, age with HGS showed low explanatory power in both sexes (R2 = 0.07 in men and 0.02 in women). While when analyzed by the cubic (non-linear) model, the explanatory values increased ostensibly (in men up to R2 = 0.50 to 0.51 and in women up to 0.26). In the non-linear model generated, the residual standard error (RSE) reflected adequate fit, for example in males (RSE = 11.48 and 11.05), while in females (RSE = 7.55 and 7.34). In general, Figure 1 shows that the cubic (nonlinear) regression model showed a phase of accelerated increase in HGS in both sexes (during childhood, adolescence and young adulthood). Followed by a plateau around the age of 30 years approximately in both sexes (45 kg in men and 28 kg in women), then after the age of 40 years, men begin to experience an accelerated reduction of HGS up to ~50% at the age of 80 years. While in women a smaller reduction of HGS was observed as age advances (decreasing by ~37%, approximately).
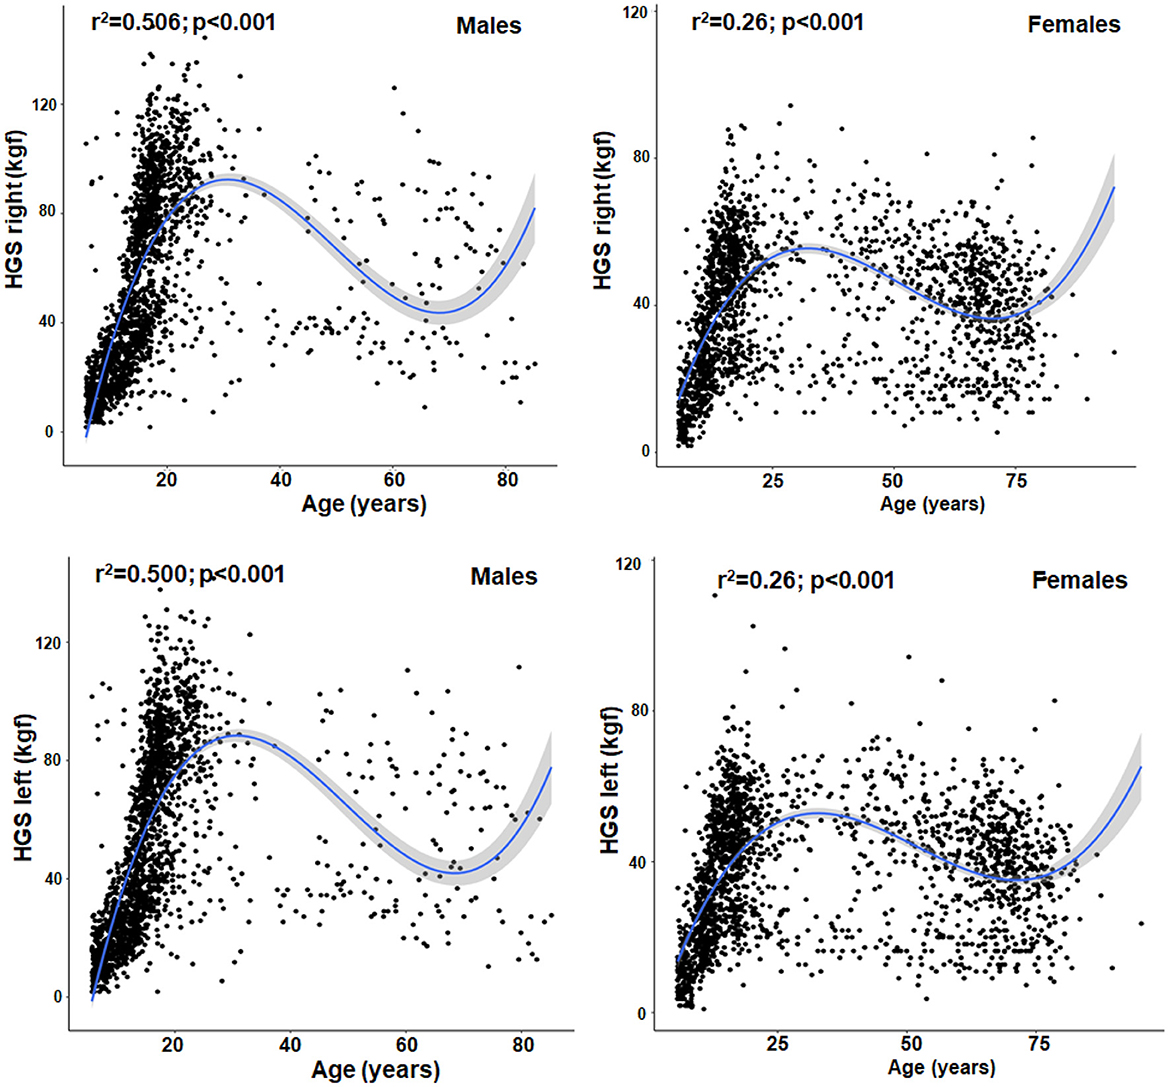
Figure 1. Non-linear relationship (cubic) between chronological age with HGS in both hands and both sexes from 6 to 80 years of age.
The HGS percentiles by chronological age and sex can be seen in Table 2 and Figure 2. The percentile distribution was P5, P15, P50, P85, and P95. These values describe HGS patterns that are similar from age 6 to 12 years in both sexes and both hands. However, from the age of 13 years onwards, males present significantly higher levels of HGS (p < 0.05) than females until older ages.
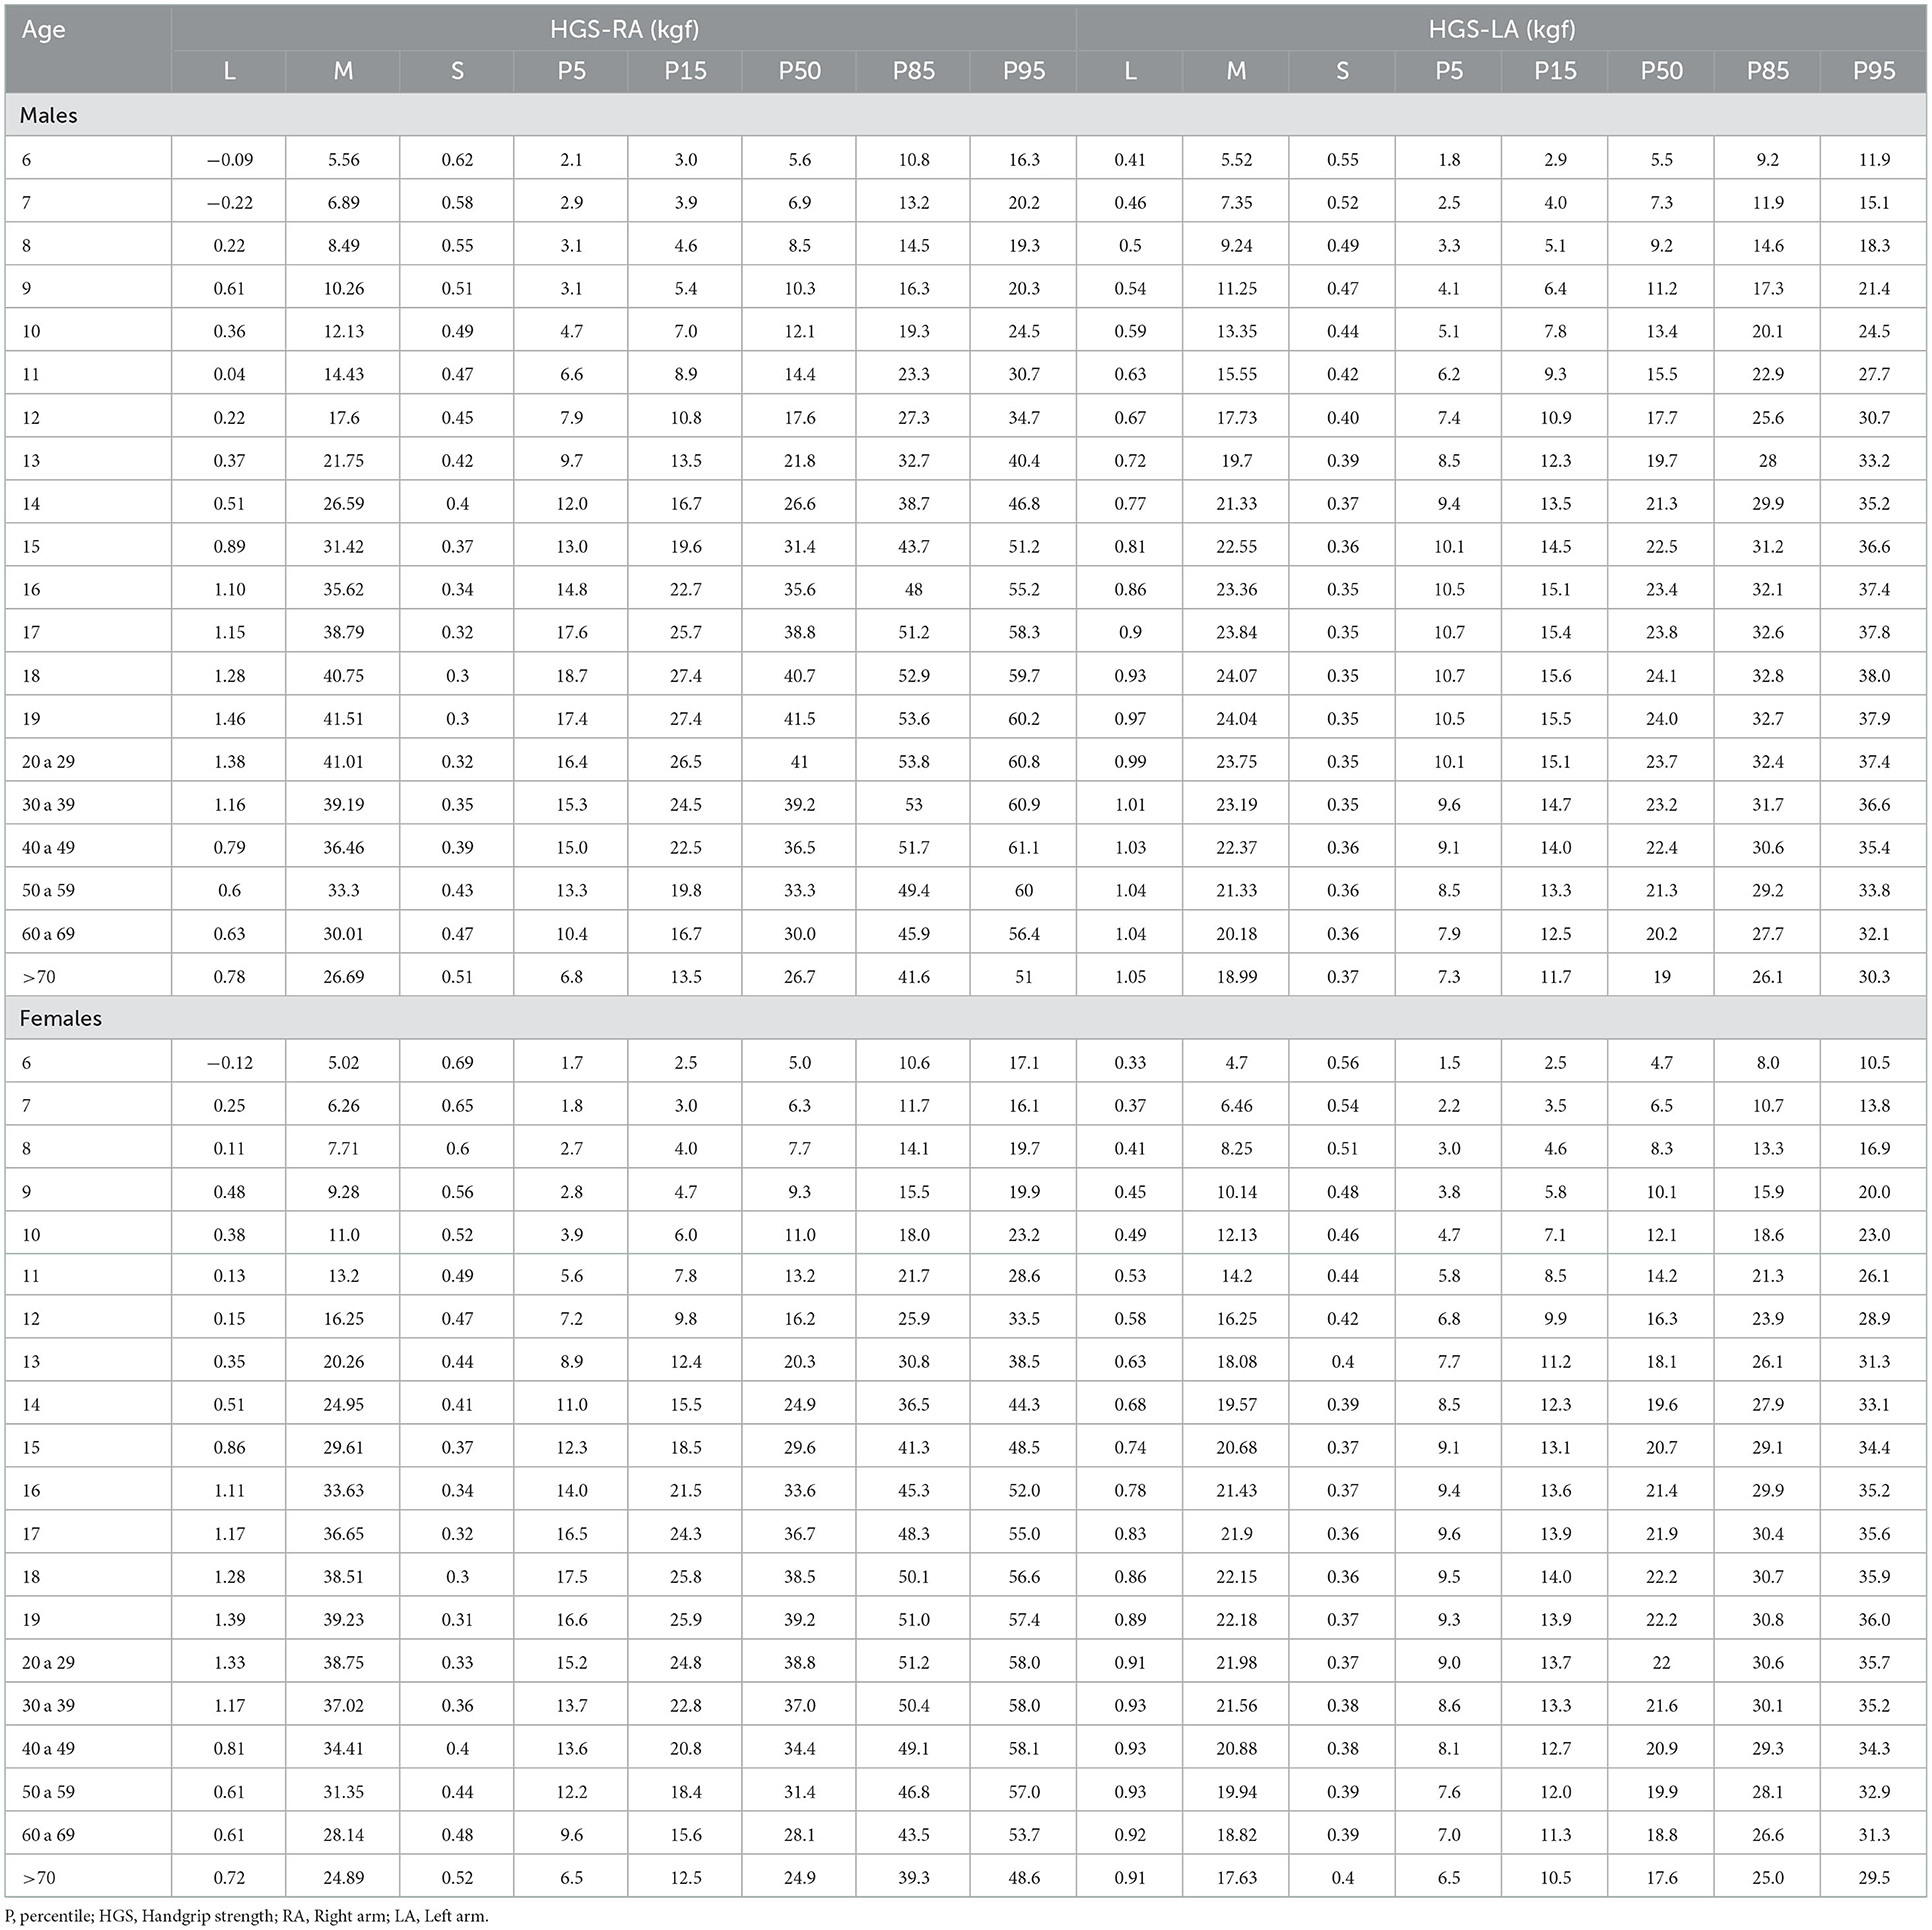
Table 2. Percentiles to evaluate HGS from 5 to 80 years according to age range for both sexes.
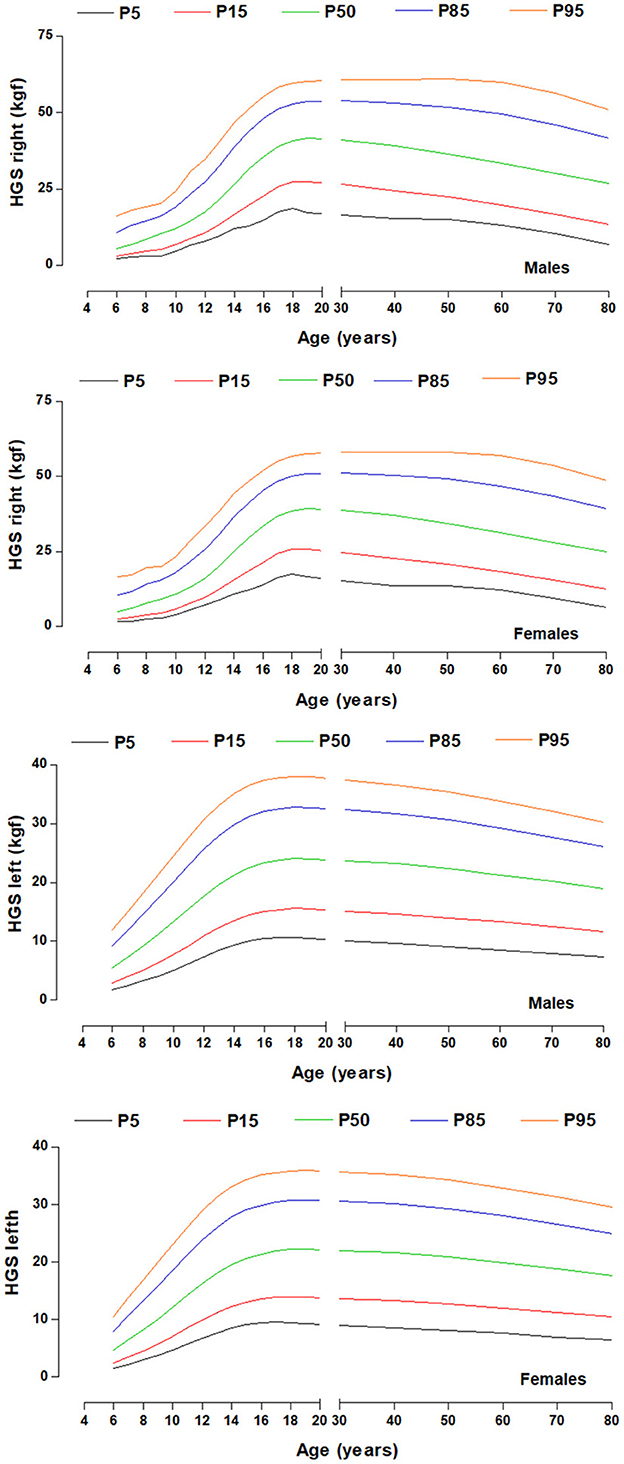
Figure 2. HGS percentiles by chronological age for both sexes and both hands.
Discussion
The first objective of this study was to determine whether a nonlinear relationship model (cubic) could improve the prediction of HGS compared to the linear model by chronological age in a regional population of Chile ranging from 6 to 80 years of age. The results have shown that the nonlinear regression model (cubic) better explains HGS when it is analyzed by chronological age from infancy to senescence.
The cubic relationships observed in this study have evidenced a better explanatory power between age with HGS in both hands and in both sexes (reaching in men up to 51% and in women up to 28%). While, in the linear relationship, the predictive power for both hands showed values of R2 = 0.07 in men and 0.02 in women.
In both cases (for both right and left hand) the curvilinear (i.e., cubic) regression models were superior to linear regression as observed in some recent studies (27, 28). These cubic relationships observed in this study are consistent with the literature, where HGS increases with chronological age during growth and development. HGS reaches a plateau around age thirty (12, 29) and declines after age forty (10, 30) and fifty (28, 29), as age advances.
In essence, the predictive power of HGS improves when analyzed from a nonlinear relationship, as demonstrated in this study. Although several studies have used linear relationships between age and anthropometric parameters with HGS in various populations around the world (31–34). Therefore, future studies should take into account that to analyze HGS across the lifespan should consider that the cubic model can be a valuable tool to analyze upper limb muscle fitness trajectories.
Consequently, given that HGS is an indicator of general strength at all ages and stages of life, this study set out as a second objective to develop referential percentiles according to age and sex ranges.
The HGS percentiles as a function of chronological age proposed in this study should be interpreted using specific reference ranges according to geographic region and ethnicity (16). These proposed tools for the Maule region of Chile can be used to assess and monitor muscle strength from infancy to senescence.
In fact, regardless of the country and/or geographic region, the proposed references serve to identify individuals with low performance, to identify those in need of intervention, to follow up high-performing subjects as part of intervention programs (35). As well as to promote occupational therapy (13), physical education classes (12), and to identify frailty phenotypes and healthy aging across the lifespan (6).
In general, the cut-off points adopted in this study for HGS considered as abnormally low is <p5. These values were suggested by some studies (11, 36) where they highlight an early detection of decreased isometric muscle strength. Percentiles p5 to p15 can be interpreted with a low level of HGS and between p15 to p85 as adequate and >p85 as elevated HGS. Other studies have also pragmatically suggested 2SD below the mean maximum sex value (10, 37).
In general, reference values, by chronological age are a valuable tool to be considered as routine measures, both in clinical and epidemiological contexts. In fact, several international studies have used HGS as a prognostic marker of mortality in children, adolescents (38), in middle-aged people (39), and as indicators of frailty and sarcopenia in older adults (40).
This study has some limitations that have to do with the cross-sectional design used in this study, given that the results obtained preclude inferring causal relationships. In addition, data on muscle pathologies, muscle strength values of the lower extremities, including fat-free mass and bone mineral density values, were not collected. This information would have allowed a broader analysis and discussion of the results. Therefore, future studies should take these aspects into account.
Notwithstanding the above, we emphasize that one of the main strengths of the study is the size of the sample and the probabilistic selection, since the results obtained can be generalized to other geographic regions of Chile. These results can also serve as a baseline for future secular trend studies, as well as for short-term comparisons with other national and international studies. It can also serve professionals and researchers in the area as guidelines for clinical and epidemiological use and decision making. Furthermore, its use and application can enrich the International Classification of Functioning, Disability and Health [ICF] (41) in disciplines and sectors such as education and transportation, health and community services, respectively. Calculations can be made through the following link: http://www.reidebihu.net/hgs_infancy_senesce.php.
Conclusion
In conclusion, this study demonstrated that there is a nonlinear relationship between chronological age and HGS from infancy to senescence. This cubic relationship allows us to observe a phase of accelerated increase in HGS during childhood and adolescence, until reaching a plateau around 30 years of age in both sexes, and consequently, a decrease in HGS from 40 years of age onwards, being more accelerated in men than in women. Furthermore, the proposed percentiles can serve as a guide for assessing and monitoring upper extremity muscle strength levels, as well as for surveillance, and in the planning of intervention programs at all stages of life.
Data availability statement
The original contributions presented in the study are included in the article/supplementary material, further inquiries can be directed to the corresponding author.
Ethics statement
The studies involving human participants were reviewed and approved by the UA 238-2014. Written informed consent to participate in this study was provided by the participants' legal guardian/next of kin.
Author contributions
CU-A, FA-V, LC, and RV collected the data. MC-B, RG-C, MA, and ER participated on the conception and design of the study. MC-B, RG-C, JM, JS, and CT analyzed the data. All authors participated in the interpretation of the results, drafted and revised the manuscript, and approved the final revision of the manuscript.
Conflict of interest
The authors declare that the research was conducted in the absence of any commercial or financial relationships that could be construed as a potential conflict of interest.
Publisher's note
All claims expressed in this article are solely those of the authors and do not necessarily represent those of their affiliated organizations, or those of the publisher, the editors and the reviewers. Any product that may be evaluated in this article, or claim that may be made by its manufacturer, is not guaranteed or endorsed by the publisher.
References
1. Bimali I, Opsana R, Jeebika S. Normative reference values on handgrip strength among healthy adults of Dhulikhel, Nepal: a cross-sectional study. J Family Med Primary Care. (2020) 9:310–4. doi: 10.4103/jfmpc.jfmpc_785_19
2. Carson RG. Get a grip: individual variations in grip strength are a marker of brain health. Neurobiol Aging. (2018) 71:189–222. doi: 10.1016/j.neurobiolaging.2018.07.023
3. Lu ZL, Wang TR, Qiao YQ, Zheng Q, Sun Y, Lu JT, et al. Handgrip strength index predicts nutritional status as a complement to body mass index in Crohn's disease. J Crohns Colitis. (2016) 10:1395–400. doi: 10.1093/ecco-jcc/jjw121
4. Cooper R, Kuh D, Cooper C, Gale CR, Lawlor DA, Matthews F, et al. Objective measures of physical capability and subsequent health: a systematic review. Age Ageing. (2011) 40:14–23. doi: 10.1093/ageing/afq117
5. Leong DP, Teo KK, Rangarajan S, Lopez-Jaramillo P, Avezum A, Orlandini A, et al. Prospective urban rural epidemiology (PURE) study investigators. Prognostic value of grip strength: findings from the Prospective Urban Rural Epidemiology (PURE) study. Lancet. (2015) 386:266–73. doi: 10.1016/S0140-6736(14)62000-6
6. Martin-Ruiz C, Von Zglinicki T. Biomarkers of healthy ageing: expectations and validation. Proc Nutr Soc. (2014) 73:422–9. doi: 10.1017/S0029665114000147
7. Steiber N. Strong or weak handgrip? NORMATIVE reference values for the german population across the life course stratified by sex, age, and body height. PLoS ONE. (2016) 11:e0163917. doi: 10.1371/journal.pone.0163917
8. Beaudart C, Rolland Y, Cruz-Jentoft A, Bauer JM, Sieber C, et al. (2019). Assessment of muscle function and physical performance in daily clinical practice. Calcif Tissue Int. (2019) 105, 1–14. doi: 10.1007/s00223-019-00545-w
9. Hoffmann MD, Colley RC, Doyon CY, Wong SL, Tomkinson GR, Lang JJ, et al. Normative-referenced percentile values for physical fitness among Canadians. Health Rep. (2019) 30:14–22. doi: 10.25318/82-003-x201901000002-eng
10. Dodds RM, Syddall HE, Cooper R, Benzeval M, Deary IJ, Dennison EM, et al. Grip strength across the life course: normative data from twelve British studies. PLoS ONE. (2014) 9:e113637. doi: 10.1371/journal.pone.0113637
11. Wong SL. Grip strength reference values for Canadians aged 6 to 79: Canadian health measures survey, 2007 to 2013. Health Rep19. (2016) 3–10.
12. Perna FM, Coa K, Troiano RP, Lawman HG, Wang CY, Li Y, et al. Muscular grip strength estimates of the u.s. population from the national health and nutrition examination survey 2011-2012. J Strength Cond Res. (2016) 30:867–74. doi: 10.1519/JSC.0000000000001104
13. Bohannon RW, Wang YC, Yen SC, Grogan KA. Handgrip strength: a comparison of values obtained from the NHANES and NIH toolbox studies. Am J Occup Ther. (2019) 73:7302205080p1–9. doi: 10.5014/ajot.2019.029538
14. Centers for Disease Control Prevention. National Health and Nutrition Examination Survey (NHANES): Muscle Strength Procedures Manual. Atlanta. (2011). Available online at: https://wwwn.cdc.gov/nchs/data/nhanes/2011-2012/manuals/Muscle_Strength_Proc_Manual.pdf (accessed September 20, 2022).
15. Ramírez-Vélez R, Rincón-Pabón D, Correa-Bautista JE, García-Hermoso A, Izquierdo M. Handgrip strength: Normative reference values in males and females aged 6-64 Years old in a Colombian population. Clin Nutr ESPEN. (2021) 44:379–86. doi: 10.1016/j.clnesp.2021.05.009
16. Leong DP, Teo KK, Rangarajan S, Kutty VR, Lanas F, Hui C. Reference ranges of handgrip strength from 125, 462. healthy adults in 21 countries: a prospective urban rural epidemiologic (PURE) study. J Cachexia Sarcopenia Muscle. (2016) 7:535–46. doi: 10.1002/jcsm.12112
17. Angst F, Drerup S, Werle S, Herren DB, Simmen BR, Goldhahn J, et al. Prediction of grip and key pinch strength in 978 healthy subjects. BMC Musculoskeletal Disorder. (2010) 11:94. doi: 10.1186/1471-2474-11-94
18. Qiu Z, Wang W, Tan Y, He M, Wang L, Li Y, et al. Associations of grip strength with retinal and choroidal thickness in patients with type 2 diabetes mellitus without retinopathy: a cross-sectional study. BMJ Open. (2020) 19:10.e036782. doi: 10.1136/bmjopen-2020-036782
19. Cossio-Bolaños M, Vidal-Espinoza R, Fuentes-Lopez J, Castelli Correia de Campos LF, Andruske CL, Urra-Albornoz C, et al. Reference values for bone density and bone mineral content from 5 to 80 years old in a province of Chile. PeerJ. (2022) 23:e13092. doi: 10.7717/peerj.13092
20. United Nations Development Programme (UNDP),. Human Development Report 2019. Beyond Income, Beyond Averages, Beyond Today: Inequalities In Human Development in the 21st Century. UNDP (2019). Available online at: http://hdr.undp.org/sites/default/files/hdr2019.pdf (accessed August 20, 2022).
21. Ministerio de DESARROLLO SOCIAL CHILE,. Ministerio de DESARROLLO SOCIAL CHILE (MDS) Informe de Desarrollo Social. (2018). Available online at: http://www.desarrollosocialyfamilia.gob. cl/storage/docs/Informe_de_Desarrollo_Social_2018.pdf (accessed December 18, 2020).
22. Ross WD, Marfell-Jones MJ. Kinanthropometry. In:MacDougall JD, Wenger HA, Geeny HJ, , editor. Physiological Testing of Elite Athlete, Vol 223 (London: Human Kinetics), p. 308–14 (1991).
23. Oh S, Ahn J, Nam KU, Paeng JY, Hong J. Frankfort horizontal plane is an appropriate three-dimensinal reference in the evaluation of clinical and skeletal cant. J Korean Assoc Oral Maxillo Surg. (2013) 39:71–6. doi: 10.5125/jkaoms.2013.39.2.71
24. Richards LG, Olson B, Palmiter-Thomas P. How forearm position affects grip strength. Am J Occup Ther. (1996) 50:133–8. doi: 10.5014/ajot.50.2.133
25. Cole TJ, Bellizzi MC, Flegal KM, Dietz WH. Establishing a standard definition for child overweight and obesity worldwide: international survey. BMJ. (2000) 320:1240–3. doi: 10.1136/bmj.320.7244.1240
26. Pan H, Cole TJ. LMS Chartmaker. (2006). Available online at: http://www.healthforallchildren.co.uk (accessed March 28, 2015).
27. Hwang J, Lee J, Lee KS. A deep learning-based method for grip strength prediction: comparison of multilayer perceptron and polynomial regression approaches. PLoS ONE. (2021) 16:e0246870. doi: 10.1371/journal.pone.0246870
28. Alcazar J, Aagaard P, Haddock B, Kamper RS, Hansen SK, Prescott E, et al. Assessment of functional sit-to-stand muscle power: cross-sectional trajectories across the lifespan. Exp Gerontol. (2021) 152:111448. doi: 10.1016/j.exger.2021.111448
29. Nahhas RW, Choh AC, Lee M, Cameron Chumlea M, Duren DL, Siervogel RM, et al. Bayesian longitudinal plateau model of adult grip strength. Am J Hum Biol. (2010) 22:648–56. doi: 10.1002/ajhb.21057
30. Metter EJ, Conwit R, Tobin J, Fozard JL. Age-associated loss of power and strength in the upper extremities in women and men. J Gerontol A Biol Sci Med Sci. (1997) 52:B267–76. doi: 10.1093/gerona/52A.5.B267
31. Sartorio A, Lafortuna CL, Pogliaghi S, Trecate L. The impact of gender, body dimension and body composition on hand-grip strength in healthy children. J Endocrinol Invest. (2002) 25:431–5. doi: 10.1007/BF03344033
32. Visnapuu M, Jurimae T. Handgrip Strength and Hand Dimensions in Young Handball and Basketball Players. J Strength Condition Res. (2007) 21:923–9. doi: 10.1519/00124278-200708000-00045
33. Chandrasekaran B, Ghosh A, Prasad C, Krishnan K. Age and anthropometric traits predict handgrip strength in healthy normals. J Hand Microsurg. (2010) 2:58–61. doi: 10.1007/s12593-010-0015-6
34. Amaral CA, Amaral T, Monteiro G, Vasconcellos M, Portela MC. Hand grip strength: reference values for adults and elderly people of Rio Branco, Acre, Brazil. PLoS ONE. (2019) 14:e0211452. doi: 10.1371/journal.pone.0211452
35. Hoare DG, Warr CR. Talent identification and women's soccer: an Australian experience. J Sports Sci. (2000) 18:751–8. doi: 10.1080/02640410050120122
36. Spruit MA, Sillen MJ, Groenen MT, Wouters, EF, Franssen FM. New normative values for handgrip strength: Results from the UK Biobank. J Am Med Dir Assoc. (2013) 14:775.e5–11. doi: 10.1016/j.jamda.2013.06.013
37. Cruz-Jentoft AJ, Baeyens JP, Bauer JM, Boirie Y, Cederholm T, Landi F, et al. Sarcopenia: European consensus on definition and diagnosis: report of the european working group on sarcopenia in older people. Age Ageing. (2010) 39:412–23. doi: 10.1093/ageing/afq034
38. Ortega FB, Silventoinen K, Tynelius P, Rasmussen F. Muscular strength in male adolescents and premature death: cohort study of one million participants. BMJ. (2012) 20:345. doi: 10.1136/bmj.e7279
39. Henriksson H, Henriksson P, Tynelius P, Ortega FB. Muscular weakness in adolescence is associated with disability 30 years later: a population-based cohort study of 1, 2 million men. Br J Sports Med. (2019) 53:1221–30. doi: 10.1136/bjsports-2017-098723
40. Ong HL, Abdin E, Chua BY, Zhang Y, Seow E, Vaingankar JA, et al. Hand-grip strength among older adults in Singapore: a comparison with international norms and associative factors. BMC Geriatr. (2017) 17:176. doi: 10.1186/s12877-017-0565-6
Keywords: dynamometer, hand grip strength, percentiles, infancy, senescence
Citation: Gómez-Campos R, Vidal Espinoza R, de Arruda M, Ronque ERV, Urra-Albornoz C, Minango JC, Alvear-Vasquez F, la Torre Choque Cd, Castelli Correia de Campos LF, Sulla Torres J and Cossio-Bolaños M (2023) Relationship between age and handgrip strength: Proposal of reference values from infancy to senescence. Front. Public Health 10:1072684. doi: 10.3389/fpubh.2022.1072684
Received: 18 October 2022; Accepted: 29 December 2022;
Published: 26 January 2023.
Edited by:
Ricardo Aurélio Carvalho Sampaio, Federal University of Sergipe, BrazilReviewed by:
Shirko Ahmadi, Montreal University, CanadaDavid Hollar, Mercer University School of Medicine, United States
Copyright © 2023 Gómez-Campos, Vidal Espinoza, de Arruda, Ronque, Urra-Albornoz, Minango, Alvear-Vasquez, la Torre Choque, Castelli Correia de Campos, Sulla Torres and Cossio-Bolaños. This is an open-access article distributed under the terms of the Creative Commons Attribution License (CC BY). The use, distribution or reproduction in other forums is permitted, provided the original author(s) and the copyright owner(s) are credited and that the original publication in this journal is cited, in accordance with accepted academic practice. No use, distribution or reproduction is permitted which does not comply with these terms.
*Correspondence: Marco Cossio-Bolaños,  bWNvc3NpbzE5NzJAaG90bWFpbC5jb20=