Compartmental distribution of GABAB receptor-mediated currents along the somatodendritic axis of hippocampal principal cells
 Claudius E. Degro
 Akos Kulik
 Sam A. Booker
 Imre Vida
- 1Institute for Integrative Neuroanatomy, Neurocure Cluster of Excellence, Charité Universitätsmedizin, Berlin, Germany
- 2Institute for Physiology II, Bioss Centre for Biological Signalling Studies, University of Freiburg, Freiburg, Germany
Activity of cortical principal cells is controlled by the GABAergic system providing inhibition in a compartmentalized manner along their somatodendritic axis. While GABAAR-mediated inhibitory synaptic transmission has been extensively characterized in hippocampal principal cells, little is known about the distribution of postsynaptic effects of GABABRs. In the present study, we have investigated the functional localization of GABABRs and their effector inwardly rectifying potassium (Kir3) channels by combining electrophysiological recordings in acute rat hippocampal slices, high-resolution immunoelectron microscopic analysis and single cell simulations. Pharmacologically isolated slow inhibitory postsynaptic currents were elicited in the three major hippocampal principal cell types by endogenous GABA released by electrical stimulation, photolysis of caged-GABA, as well as the canonical agonist baclofen, with the highest amplitudes observed in the CA3. Spatially restricted currents were assessed along the axis of principal cells by uncaging GABA in the different hippocampal layers. GABABR-mediated currents were present along the entire somatodendritic axis of principal cells, but non-uniformly distributed: largest currents and the highest conductance densities determined in the simulations were consistently found on the distal apical dendrites. Finally, immunocytochemical localization of GABABRs and Kir3 channels showed that distributions overlap but their densities diverge, particularly on the basal dendrites of pyramidal cells. GABABRs current amplitudes and the conductance densities correlated better with Kir3 density, suggesting a bottlenecking effect defined by the effector channel. These data demonstrate a compartmentalized distribution of the GABABR-Kir3 signaling cascade and suggest differential control of synaptic transmission, dendritic integration and synaptic plasticity at afferent pathways onto hippocampal principal cells.
Introduction
GABAB receptors mediate the slow inhibitory effects of GABA and contribute crucially to the control of network activity and information processing in cortical circuits by regulating neuronal excitability and synaptic transmission (Kohl and Paulsen, 2010; Palmer et al., 2012; Larkum, 2013). On postsynaptic membranes, GABABRs preferentially localize to the extrasynaptic membrane and co-cluster with G-protein coupled inwardly rectifying potassium channels (Kir3 or GIRK) (Kulik et al., 2006). Activation of GABABRs, and subsequent phosphorylation of Gi/o leads to activation of Kir3, which produces a slow hyperpolarizing potassium conductance (Bettler et al., 2004). However, the distribution of the receptor and the effector channel is not homogeneous along the somatodendritic axis (Kulik et al., 2003), indicating that this signaling cascade may control excitability of neuronal membranes in a layer- and compartment-specific manner (Larkum, 2013).
Early electrophysiological studies from hippocampal PCs showed that GABABR-mediated slow postsynaptic inhibitory responses can be elicited in the dendrites, but not the perisomatic domain (Newberry and Nicoll, 1985; Solís and Nicoll, 1992). In good agreement, immunocytochemical studies have generally revealed strong labeling in dendritic layers with the highest intensity observed over the distal apical dendrites in the str. L-M of the CA areas and the outer ML of the DG (Fritschy et al., 1999; Sloviter et al., 1999; Kulik et al., 2003). Similarly, Kir3 channels were found to show stronger immunolabeling over the distal apical dendrites (Ponce et al., 1996; Drake et al., 1997; Kulik et al., 2006). In stark contrast, recent data from the neocortical layer 5 PCs suggest that perisomatic GABABRs activate Kir3 potassium channels, whereas dendritic GABABRs primarily inhibit voltage-sensitive calcium channels (Breton and Stuart, 2012). Whether these contrasting data reflect regional differences in the distribution of GABABRs and their effectors or a divergent coupling of GABABRs to their effectors along the somatodendritic axis remains an open question.
In the present study, we therefore analyzed the distribution of GABAB1 and Kir3.2 subunits and the currents mediated by GABABR-Kir3 signaling cascade along the somatodendritic axis of hippocampal principal cells in a combined neuroanatomical and electrophysiological approach. Whole-cell patch-clamp recordings were performed in vitro from identified principal cells from acute slices and GABABR-Kir3 mediated currents mapped by electrical stimulation, direct pharmacological activation or lamina-specific photolysis of caged-GABA. The distributions of surface membrane localized GABABRs and Kir3 channels were then assessed with SDS-digested freeze-fracture replica immunogold labeling.
Materials and Methods
Acute Slice Preparation
Experiments were performed on 18–26-days-old Wistar rats, expressing Venus/yellow fluorescence protein (YFP) under the vesicular GABA transporter (vGAT) promoter, (Uematsu et al., 2008) in accordance with local (LaGeSo, Berlin, T 0215/11) and national guidelines (German Animal Welfare Act). Transverse hippocampal slices were prepared as previously described (Booker et al., 2013). Briefly, rats were anesthetized with isoflurane, decapitated and the brains rapidly removed into ice-cold carbogenated (95% O2/5% CO2) sucrose-modified artificial cerebrospinal fluid (sucrose-ACSF; in mM: 87 NaCl, 2.5 KCl, 25 NaHCO3, 1.25 NaH2PO4, 25 Glucose, 75 Sucrose, 1 Na2-Pyruvate, 1 Na2-Ascorbate, 7 MgCl2, 0.5 CaCl2). Transverse hippocampal slices (300 μm nominal thickness) were then cut on a Vibratome (VT1200s, Leica, Germany) in ice-cold sucrose-ACSF, transferred to submerged storage chambers containing sucrose-ACSF warmed to 35°C for 30 min and then stored at room temperature (20°C).
Whole-Cell Patch-Clamp Recordings
For electrophysiological recordings, slices were transferred to a submerged recording chamber, and superfused with carbogenated, normal ACSF (in mM: 125 NaCl, 2.5 KCl, 25 NaHCO3, 1.25 NaH2PO4, 25 Glucose, 1 Na2-Pyruvate, 1 Na2-Ascorbate, 1 MgCl2, 2 CaCl2), at 10–12 ml/min for improved oxygenation (Hájos et al., 2009) at a near physiological temperature (32 ± 0.4°C) by an inline heater (SuperTech, Switzerland). Slices were visualized with an upright microscope (BX-50, Olympus, Hamburg, Germany) equipped with a 40x water immersion objective lens (N.A. 0.8) and principal cells selected from the stratum pyramidale or GCL. Whole-cell patch-clamp recordings were accomplished using a Multiclamp 700B amplifier (Molecular Devices, USA). Recording pipettes were pulled from borosilicate glass capillaries (2 mm outer/1 mm inner diameter, Hilgenberg, Germany) on a horizontal electrode puller (P-97, Sutter Instruments, Novato, CA, USA). When filled with intracellular solution (in mM: 130 K-gluconate, 10 KCl, 2 MgCl2, 10 EGTA, 10 HEPES, 2 Na2-ATP, 0.3 Na2-GTP, 1 Na2-creatinine, and 0.1% Biocytin; 290–310 mOsm) the pipettes had a resistance of 3–5 MΩ. Signals were filtered online at 10 kHz using the built in 2-pole Bessel filter of the Multiclamp amplifier, digitized and recorded at 20 kHz (NI USB-6212 BNC, National Instruments, Berkshire, UK), using WinWCP software (courtesy of John Dempster, University of Strathclyde, Glasgow, UK). Data were analyzed offline using the open source Stimfit software package (Guzman et al., 20141).
Characterization of GABABR-Mediated Currents
After achieving whole-cell configuration, intrinsic properties of principal cells were characterized for cell identification. Characterization was performed in current-clamp mode from resting membrane potential (Vm) and cells identified on the basis of the voltage response and the resulting train of APs of the recorded neurons to a family of hyper- to depolarizing current steps (500 ms duration) ranging from –250 to 250 pA, in 50 pA, steps, followed by a final 500 pA step. Cells showing a hyperpolarized membrane potential, large and fast AP kinetics, and an accommodating train of APs at 500 pA depolarization were deemed to be principal cells.
Pharmacologically isolated GABABR-mediated currents were examined in the presence of ionotropic receptor blockers, DNQX (10 μM), DL-APV (50 μM), and gabazine (10 μM) in the perfusing ACSF, under voltage-clamp at –65 mV. Extracellular stimulation was delivered to the apical neuropil via a glass monopolar electrode (patch pipettes filled with 2 M NaCl, pipette resistance = 0.1 MΩ) and GABABR-mediated IPSCs evoked in response to a single stimulus (100 μs duration, 50 V amplitude) or 200 Hz trains of 3, 5, and 10 stimuli. Stimulation electrodes were positioned at the str. radiatum/L-M border for recordings from CA1 and CA3, and in the outer third of the ML for the DG. Kinetic properties of GABABR IPSCs were determined from average traces (minimum eight individual traces), where the IPSC amplitude was greater than 5 pA. To assess the whole-cell contingent of GABABR-mediated currents the canonical agonist baclofen (10 μM) was applied to the bath and 5 min steady state whole-cell current recorded. To confirm that the baclofen-induced current was specific to the GABABR, the potent selective GABABR antagonist CGP 55,845 (CGP, 5 μM) was subsequently applied. The currents produced by baclofen and CGP were measured as the difference in the holding current between the 2 min peak response of each pharmacological epoch and the control level (measured 2 min prior to drug wash-in).
Spatially restricted GABA application was achieved by photolysis of the photolabile caged-GABA compound Rubi-GABA (20 μM) applied to the bath (Rial Verde et al., 2008). Photorelease of GABA was induced by brief flashes (200 ms flash duration, 2 min inter-flash interval) of 470 nm monochromatic light to the tissue (OptiLED, Cairn Scientific, Kent, UK). To assess the spatial distribution of pharmacologically isolated GABABR-mediated currents in hippocampal principal cells, 60 μM wide stripes were exposed to the light flashes in each hippocampal layer, perpendicular to the dendritic axis by fitting a 2 mm slit mask at the level of the stop-filter in the conjugated plan of the epifluorescent tube of the microscope.
Visualization, Imaging, and Reconstruction of the Recorded Neurons
Following completion of the experiments, the outside-out patch configuration was obtained and slices fixed immediately with 4% paraformaldehyde (PFA) in 0.1 M phosphate buffer (PB), overnight at 4°C. Slices were then rinsed repeatedly in PB prior to incubation with Alexa Fluor 647-conjugated streptavidin (1:1000, Invitrogen, Dunfermline, UK), diluted in PB containing 0.1% Triton-X100 and 0.05% NaN3, overnight at 4°C. Slices were then rinsed liberally with PB and mounted on glass slides, containing a 300 μm thick agar spacer to reduce compression and shrinkage of the slices, with a polymerizing mounting medium (Fluoromount-G, Southern Biotech, Birmingham, AL, USA) and coverslipped.
Recorded cells were imaged on a laser scanning confocal microscope (FluoView 1000, Olympus) with either 20x (N.A 0.75) or oil-immersion 60x (N.A 1.3) objective lenses for cell identification and reconstructions, respectively. For 3D reconstruction of imaged cells, image stacks were collected from the Z-axis of the cells (0.5 or 1 μm steps, 4 μs pixel dwell time, 4 megapixel resolution). Z-series images for high magnification reconstruction were deconvolved (AutoQuant X3, Media Cybernetics, USA) and stitched using the FIJI software package2. Neurons were then segmented and reconstructed using a semi-automatic algorithm in a two-step procedure first tracing the skeleton of the neuron and subsequently fitting the diameters of neurites (Simple Neurite Tracer plug-in for FIJI; Longair et al., 2011). The soma shape was reconstructed by defining the longest axis first and measuring diameters along this path. Morphometric parameters, such as dendritic length and surface area values were derived from the vectorial representation of the reconstructed neurons in the Neuron simulation environment (see below) using predefined morphometric functions (arc3d, diam3d, L and area). Dendritic length and membrane surface area within the illuminated regions were estimated by projecting 60 μm horizontal slits onto the reconstructed neurons and summing the length and area of all segments falling into this region. All light slits were positioned relative to the center of the cell soma; thus a good correlation of light slit position and dendritic length could be produced offline. The surface area of the soma was added to the appropriate slit, but its length was not considered.
Single Cell Simulations
The reconstructed neurons were exported from FIJI software using the built in converter to the standard SWC file format for vectorial representation of neuronal structures and imported to the Neuron simulation environment (Hines and Carnevale, 1997; version 7.3 on a Debian Linux PC) using the ‘import3d’ tool package. All neurons were rotated to a vertical position with their somatodendritic axis, to match their orientation during the experiments. Scales were checked and Z axis dimensions corrected by measuring the embedded slice thickness and using a correction factor assuming an original slice thickness of 300 μm. To reduce raggedness of reconstructed neuronal process trajectories, in particular along the Z-axis, a Gaussian spatial filter was applied (five point window, single run in the X–Y plane and 10 iterations for values along the Z-axis). Diameters were checked for non-fitted values which were present in the SWC files and these were substituted by linear interpolation to neighboring points.
The electrical behavior of the neuron was assumed to be passive. The specific membrane capacitance (Cm) was set to 1 μF/cm2, and the axial resistivity (Ri) was 140 Ohm/cm (Baker et al., 2011) for all cells, The resting membrane potential and the reversal of the leak conductance (pas distributed mechanism) were set to –65 mV. Passive membrane resistivity (Rm) in the default model was assumed to be non-uniform for all PCs, with 50% lower values at the distal dendrites along a sigmoidal gradient (Stuart and Spruston, 1998; Golding et al., 2005):
where Dx is the distance of a given point measured from the center of the soma, the gradient midpoint Dhalf was 150 μm from the soma and the steepness factor fsteepness was 50 μm. For granule cells a uniform value was applied to the entire dendritic axis (Schmidt-Hieber et al., 2007). The value of Rm was then individually determined for each cell by matching the measured input resistance.
Spines were not reconstructed but were incorporated in the model as a surface area correction factor: the extra area contributed by the spines was modeled by dividing Rm and multiplying Cm by a dendritic domain specific factor (Stuart and Spruston, 1998; Golding et al., 2005). These correction factors were based on electron microscopic spine density measurements by Megías et al. (2001) and confirmed and derived for simulations in the study by Golding et al. (2005). The correction factors were between 1.0 (soma and proximal dendrites largely lacking spines) and 3.3 (high density spines on thin oblique dendrites in the CA1 str. radiatum). In the modeled CA1 and CA3 PCs spines contributed to an average of 57 and 49% of the total membrane area, respectively. In granule cells spine correction factors approximated the distribution described by Schmidt-Hieber et al. (2007) and had a value of 1.7 for the proximal dendritic segments in the inner ML, 2.1 for those in the middle and 2.3 for segments in the outer ML.
After passive electric properties were applied, segment length was adjusted according to the “d_lambda rule” (Carnevale and Hines, 2009): an alternating current length constant at 1 kHz was calculated for each section, and the number of segments per dendritic section (nseg) was increased until their length was less then 3.3% of this length constant (Schmidt-Hieber et al., 2007). The integration time step was fixed to 12.5 μs. Voltage-clamp recordings were simulated with a VClamp object positioned at the soma, with the electrode resistance set to the value of the uncompensated series resistance during the experiment and the holding potential was –65 mV.
GABAB receptor-mediated synaptic effects were modeled by inserting Exp2Syn point processes into the segments falling into the illumination windows. Peak conductance was calculated by multiplying the assumed current density with the surface area of the corresponding segment located within the illumination window. Kinetic parameters of the conductance were set to the experimentally determined values and the reversal potential was –95 mV (Booker et al., 2013). All instances of the synaptic conductance inserted into a cell were connected to and triggered by an abstract presynaptic NetStim object. For each simulation run the peak amplitude of the somatically measured GABABR-mediated current was measured by recording the current measured by the VClamp object and the conductance density for the illumination window was iteratively adjusted on proportion to the error (the difference between the experimentally measured amplitude and the peak value of the somatic current obtained in a simulation run) until the difference was smaller than 0.01 pA. For each window the conductance density was calculated as the mean of at least three iterative search processes. Initial values were randomly chosen from a uniform distribution with 25% variability around the current density calculated as the ratio of the somatically measured current divided by the driving force and the surface area within a given illumination slit.
SDS-Digested Freeze-Fracture Replica Immunogold Labeling
To assess lamina distribution of the GABAB1 and Kir3.2 subunits SDS-FRL was performed as previously described (Kulik et al., 2006). Transgenic vGAT Venus/YFP mice (30-days-old; n = 3) were lightly anesthetized with isoflurane; followed by terminal anesthesia with ketamine/Domitor (5:3 mix, 6.3 and 0.8 mg/kg respectively, i.p.). The rats were then transcardially perfused with 0.9% NaCl for 1 min, followed by fixative solution containing 2% PFA and 15% saturated picric acid (in PB), for 13 min. Transverse hippocampal sections (90 μm) were cut on a vibratome (VT1000, Leica, Germany) and cryoprotected overnight with 30% glycerol in PB, at 4°C. Blocks containing either CA1 and DG or CA3 were microdissected from the sections and frozen under high-pressure (HPM100, Leica, Germany). Frozen samples were fractured at –130°C and the fractured face coated by deposition of carbon (5 nm), platinum (2 nm) then carbon (18 nm) in a freeze-fracture replica machine (BAF060, BAL-TEC, Lichtenstein). Replicas were digested for 18 hrs at 80°C in a solution containing 2.5% SDS and 20% sucrose diluted in 25 mM Tris buffered saline (TBS), pH 7.4. Following digestion, replicas were washed liberally in replica washing solution, which contained 0.05% bovine serum albumin (BSA) and 0.1% Tween 20, in TBS; then blocked in a solution containing 5% BSA and 0.1% Tween 20 for 1 h at room temperature. Replicas were then incubated with primary antibodies raised against either the GABAB1 subunit (B17, rabbit, 10 μg ml-1; Kulik et al., 2003, 2006; Booker et al., 2013) or Kir3.2 subunit (rabbit, 8 μg ml-1, Alomone Labs, Israel), in a solution containing 1% BSA and 0.1% Tween 20 made up in TBS, overnight at 4°C. The replicas were then washed liberally in TBS, blocked for 30 min and then reacted with 10 nm gold nanoparticles conjugated to goat anti-rabbit secondary antibodies (1:30, Nanoprobes, Yaphank, NY, USA) diluted in a solution containing 1% BSA and 0.1% Tween 20 made up in TBS, either for 3 h at room temperature or overnight at 4°C. Replicas were washed in TBS, then ultrapure water and mounted on 25-mesh grids. For quantitative analysis, replicas were first imaged with light microscopy to determine laminar organization and then images of P-face spiny dendrites or somata were collected from the middle portion of the layers of CA1, CA3, and DG. Immunogold particle density was calculated by analyzing the number of immunogold particles on the total exposed P-face surface of the somatic or dendritic membrane using FIJI/ImageJ software package.
Chemicals and Pharmacological Tools
Chemicals were obtained from either Sigma Aldrich (Munich, Germany) or Carl Roth (Karlsruhe, Germany). Biocytin was obtained from Life Technologies (Dunfermline, UK). Drugs were obtained from Abcam Biochemicals (Cambridge, UK) or Tocris Bioscience (Bristol, UK). Drugs were stored as 1000-fold concentrated stocks at –80°C. Working concentrations were prepared fresh on the day in normal ACSF: DNQX 10 μM, DL-APV 50 μM, gabazine (SR-95531)10 μM, Rubi-GABA 20 μM, CGP-55845 5 μM, and baclofen 10 μM.
Statistical Analysis
Statistical analysis was performed with Graphpad Prism 3.0 (GraphPad Software, La Jolla, CA, USA). Group data were compared with either one-way ANOVA (parametric analysis) or Friedman (non-parametric) tests, respectively combined with Bonferroni or Dunn’s multiple comparison post-test to establish group differences. Analysis of unpaired and paired data was performed with Mann–Whitney or Wilcoxon matched-pairs tests respectively. Data is shown as mean ± SEM throughout. Statistical significance was assumed if P < 0.05.
Results
Postsynaptic GABABR Currents Show Differential Amplitudes in CA1, CA3 PCs, and DGCs
Previously reports have observed a clear laminar staining pattern for the GABAB1 subunit of the obligatory heterodimer receptor and the Kir3.2 channel subunit in the hippocampal neuropil (Fritschy et al., 1999; Sloviter et al., 1999; Kulik et al., 2003, 2006). To confirm the presence of GABABR/Kir3-mediated potassium currents in hippocampal principal cells (Dutar and Nicoll, 1988; Solís and Nicoll, 1992; Lüscher et al., 1997; Mott et al., 1999; Booker et al., 2013) we performed extracellular stimulation of pharmacologically isolated GABABR-mediated slow IPSCs and tested the response of principal cells to the canonical GABABR agonist baclofen. To assess GABABR-mediated responses produced by synaptic release of GABA, we elicited slow IPSCs in the presence of AMPA, NMDA, and GABAA receptors antagonists (DNQX, 10 μM; APV, 50 μM and gabazine, 10 μM). Slow IPSCs were evoked by electrical stimulation to the neuropil surrounding the distal apical dendrites with a single stimulus or trains of five stimuli delivered at 200 Hz (Figure 1A, top). All recorded IPSCs were confirmed to be GABABR-mediated due to their blockade during bath application of the potent and selective GABABR antagonist CGP-55845 (CGP; 5 μM).
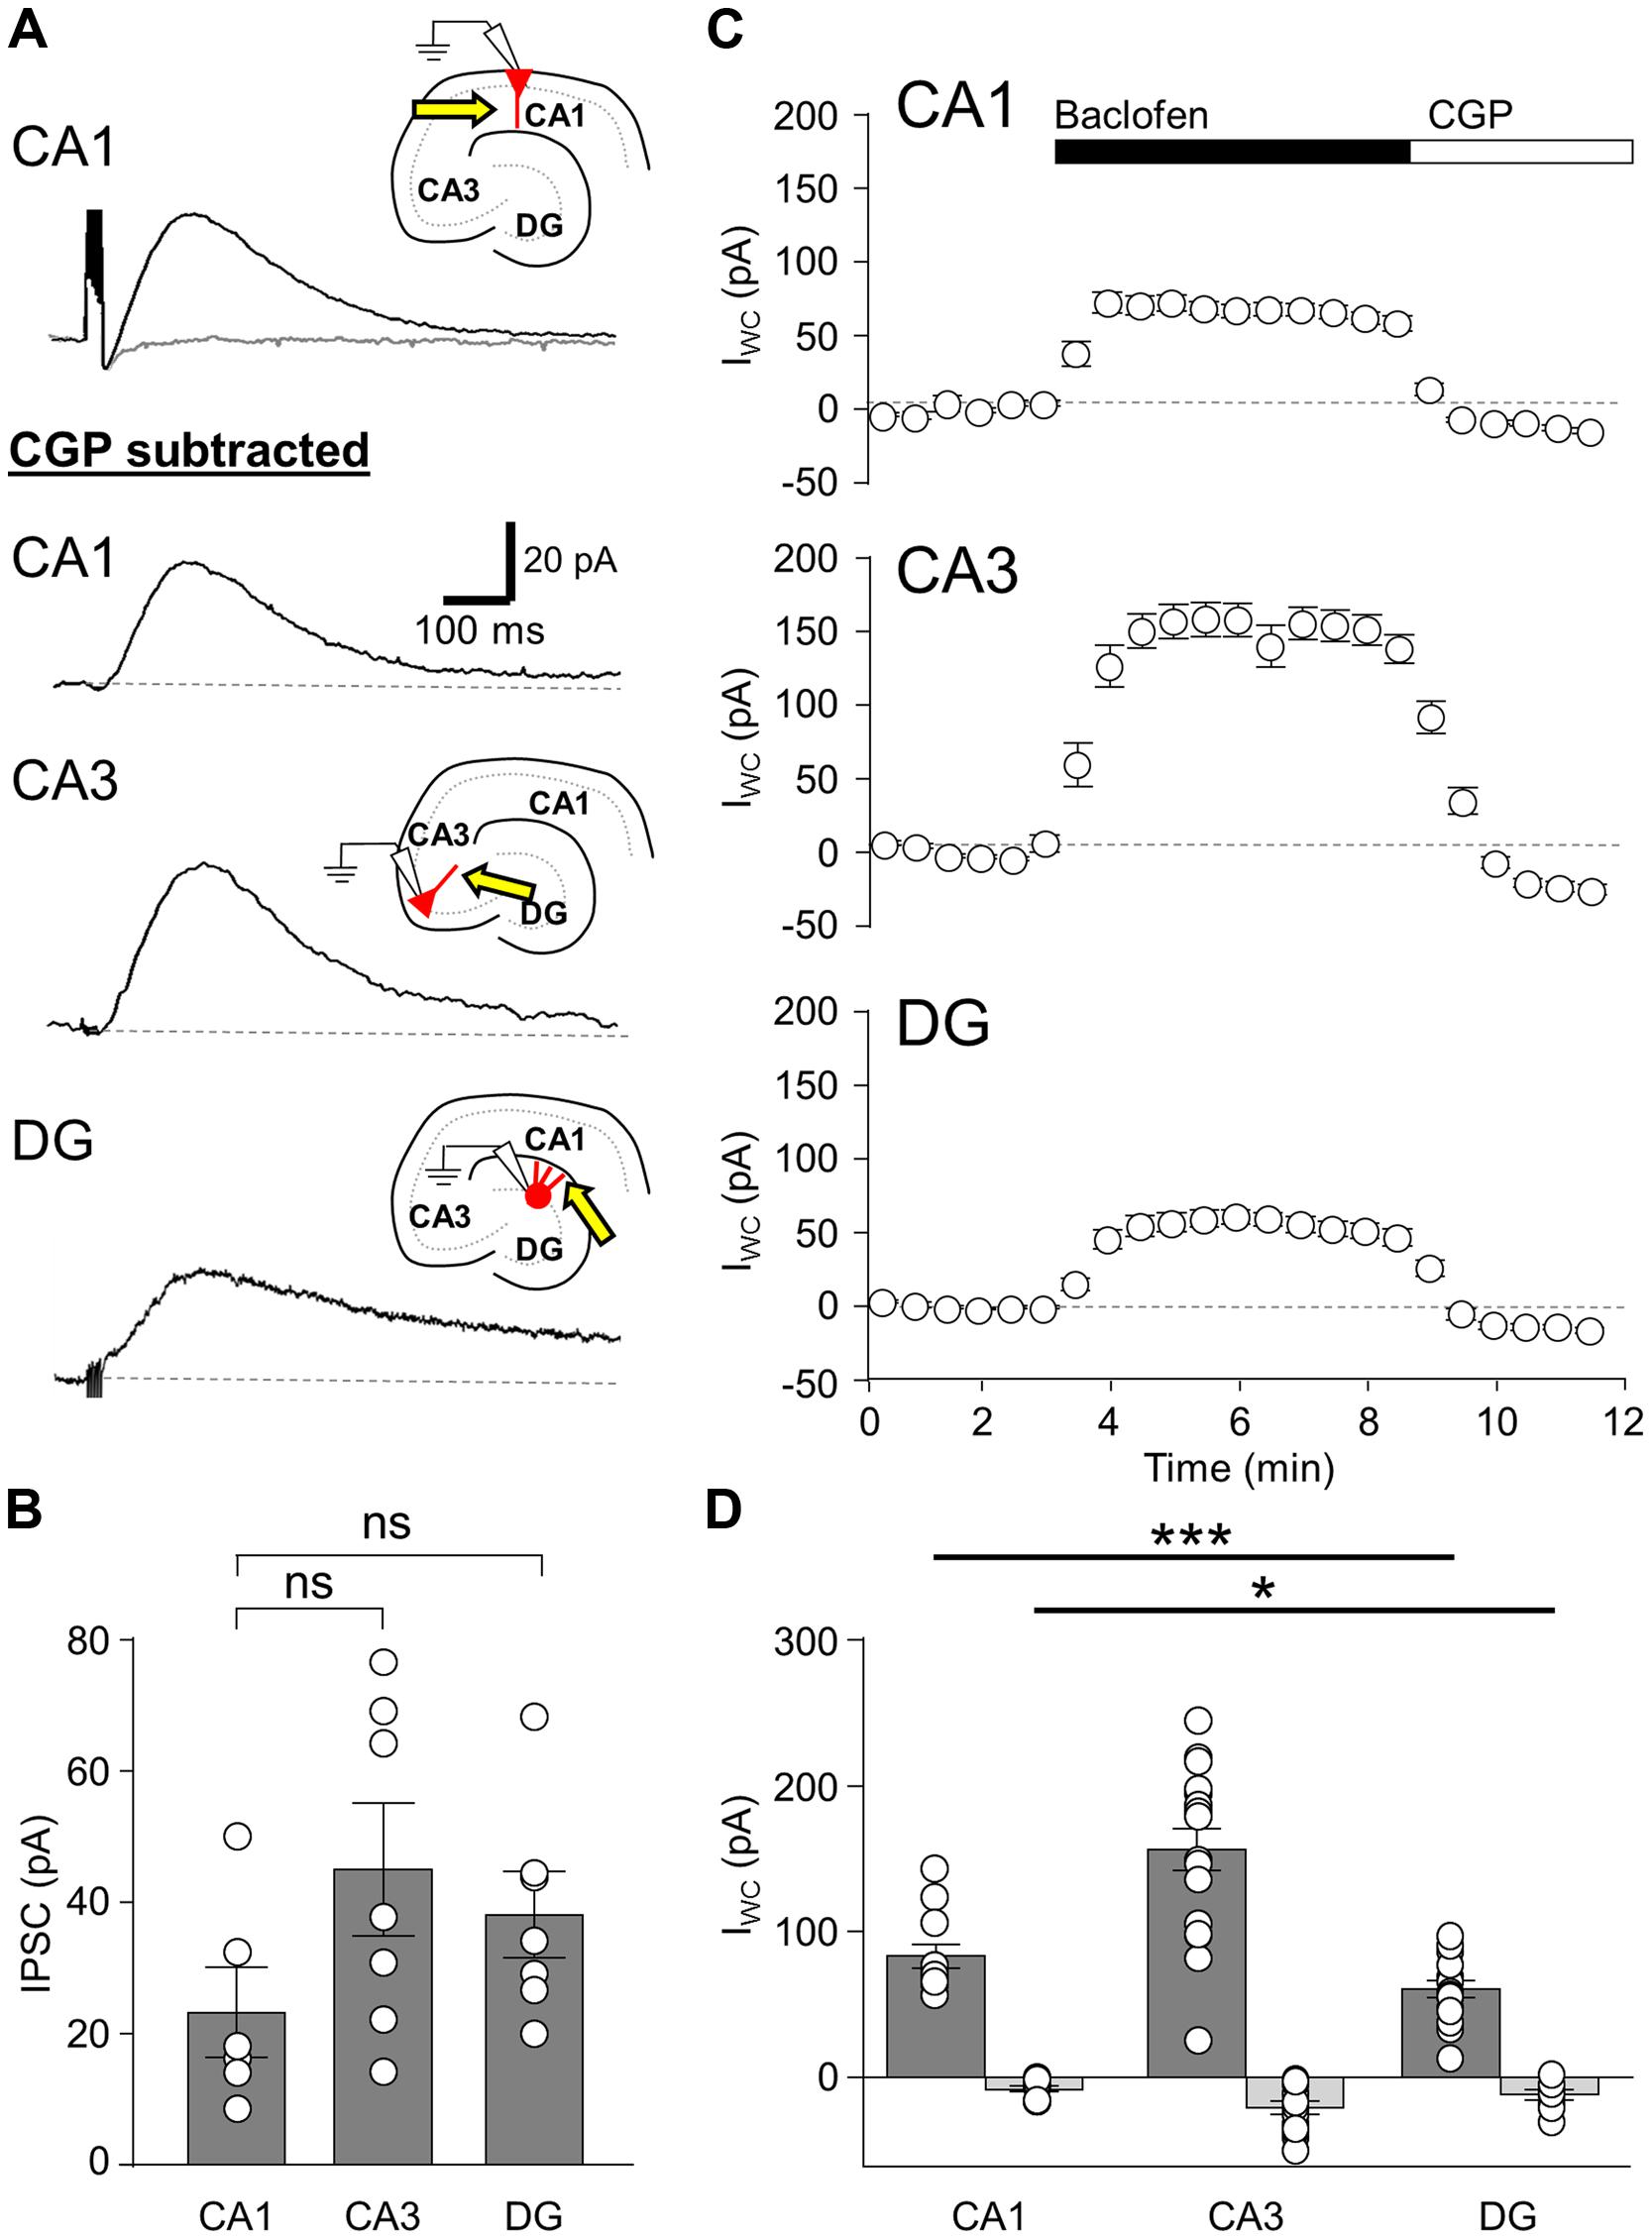
FIGURE 1. Synaptic and agonist-induced GABABR-mediated currents in hippocampal principal cells. (A, upper), IPSCs elicited in a CA1 PC by a train of five stimuli at 200 Hz before (black trace) and after application of the specific GABABR-antagonist CGP-55845 (CGP, 5 μm, gray trace). (A, lower), IPSCs elicited by a train of five stimuli in CA1 PCs (top), CA3 PCs (middle) and DGCs (bottom), following subtraction of the CGP trace. Inset illustrates the arrangement of the recording pipette and the extracellular stimulation site (arrow). (B) Summary bar chart shows the mean amplitudes of GABABR-mediated IPSCs produced by 5-stimuli in CA1 PCs (CA1, n = 6), CA3 PCs (CA3, n = 7), and DGCs (DG, n = 7). (C) Mean change in IWC plotted against time, before and during baclofen and subsequent CGP application (CA1 PCs, n = 5; CA3 PCs, n = 9; DGCs, n = 8). (D) Bar chart of the average peak IWC measured for baclofen (dark gray) and CGP (light gray) in CA1 PCs (baclofen: n = 12, CGP: n = 11), CA3 PCs (baclofen: n = 17, CGP: n = 13), and DGCs (baclofen: n = 15, CGP: n = 9). All average data is overlain by the values from the individual experiments (open circles). Statistics shown: ns = P > 0.05, *P < 0.05, ***P < 0.001; one-way ANOVA.
In CA1 PCs (n = 5 cells), extracellular stimulation of the str. radiatum/L-M border produced IPSCs following a single stimulus with a mean peak amplitude of 7.7 ± 1.2 pA, while trains of the 5-stimuli (applied at 200 Hz) produced IPSCs with a mean amplitude of 26.2 ± 6.8 pA (Figure 1A, top and 1B), consistent with an increased GABA release and therefore greater volume transmission during the trains. In CA3 PCs (n = 7 cells), a single stimulus to the str. radiatum/L-M border produced IPSCs with a mean amplitude of 12.4 ± 0.8 pA, somewhat larger than those observed in CA1 PCs, albeit not significantly so (P = 0.15). The 5 stimulus train elicited IPSCs of 45.0 ± 9.4 pA in CA3 PCs, (Figures 1A, middle and 1B). Finally, slow IPSCs in DGCs (n = 6 cells) had mean amplitudes of 8.1 ± 1.2 pA following single stimuli and 39.6 ± 7.0 pA following the 200 Hz trains of five stimuli. (Figures 1A, bottom, 1B).
The kinetics properties of GABABR-mediated IPSCs, measured from single stimulus responses (>5pA) were mostly comparable for the three principal cell types (Table 1). IPSCs recorded in CA1 PCs (n = 5), CA3 PCs (n = 7), and DGCs (n = 6) showed similar onset latencies and rise times (P > 0.05, one-way ANOVA). Surprisingly however, the decay time-constant of the IPSCs in DGCs was ∼100% longer than either CA1 or CA3 PCs (P = 0.04, one-way ANOVA, with Bonferroni multiple comparisons, Table 1).
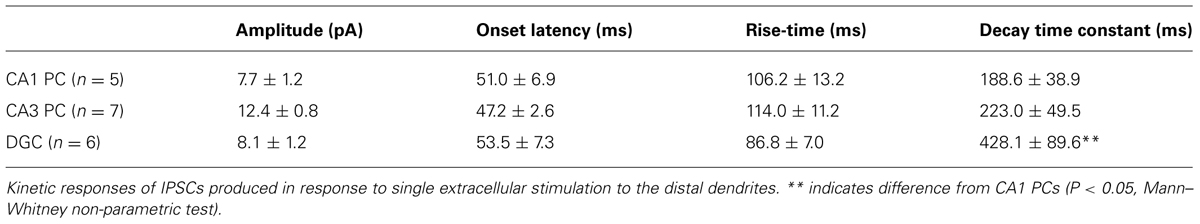
TABLE 1. Amplitude and kinetic properties of GABABR mediated IPSCs.
As extracellular stimulation only activates a subset of GABABRs on the somatodendritic domain of neurons (Lüscher et al., 1997; Mott et al., 1999; Booker et al., 2013), we next bath applied the canonical GABABR agonist baclofen (10 μM) in order to activate the full complement of surface localized functional receptors (in the presence of ionotropic receptor blocker DNQX or NBQX, APV, and gabazine). In CA1 PCs, baclofen application elicited an outward whole-cell current (IWC) of 83.1 ± 7.9 pA (n = 12 cells, Figure 1C, top). In CA3 PCs the observed baclofen-induced peak IWC was substantially larger at 156.3 ± 14.1 pA (n = 17 cells) 188% higher than those in CA1 PCs (P = 0.0007; Figure 1C, middle). In contrast, DGCs responded to bath application of baclofen with a smaller IWC of 60.6 ± 5.9 (n = 15 cells, Figure 1C, bottom). This was 27% lower than the currents recorded in CA1 PCs (P = 0.04) and 61% lower than those in CA3 PCs (P < 0.0001, Figure 1D).
In all tested principal cells the baclofen-induced IWC was fully blocked by subsequent application of CGP (5 μM), confirming the specificity of the baclofen-induced currents. Moreover, the mean IWC during CGP steady state undershot baseline current levels significantly in all cell types (P < 0.01 for all, Figure 1D). The mean amplitude of the overshoot current was 7.5 ± 1.9 pA in CA1 PCs (n = 11), 20.5 ± 4.6 pA in CA3 PCs (n = 13), and 11.7 ± 3.2 pA in DGCs (n = 9; Figures 1C,D). This observation suggests that a small net GABABR tonic current, mediated by either Kir3 channels or inhibition of calcium channels, was present in the slices prior to baclofen application, contrary to previously published literature (Otis and Mody, 1992).
GABAB receptor-mediated postsynaptic currents are predominantly mediated by activation of Kir3 channels (Otis et al., 1993; Sodickson and Bean, 1996; Lüscher et al., 1997; Booker et al., 2013). We have shown previously, under identical experimental conditions (Booker et al., 2013), that GABABR-mediated currents in CA1 PCs and interneurons have a reversal potential close to –100 mV and display inward-rectification, as typical for Kir3 channels. To confirm that the same is true in other principal cells, we tested the reversal potential (EGABAB) of GABABR-mediated IPSPs from current-clamp recordings of DGCs. The observed EGABAB for the GABABR-mediated IPSP was –89.5 ± 3.2 mV (n = 3 cells), close to the predicated potassium EGABAB of –101 mV (data not shown). Furthermore, currents observed in response to voltage-ramps from –20 to –120 mV (1 s duration), ran before and after the application of baclofen, showed a K+ ER of –98.3 ± 5.8 mV with a rectification index of 0.59 (n = 3 cells, data not shown), confirming that baclofen-mediated currents were produced by inwardly rectifying K+-channels in DGCs.
In summary, all hippocampal principal cells express GABABR-mediated slow IPSCs, plausibly by activation of Kir3 channels, albeit with cell-type specific differences in the magnitude of the whole-cell conductance indicating potential differences in the postsynaptic complement of the receptor and effector channels.
Laminar Distribution of Functional GabaBR-Mediated Currents in Hippocampal Principal Cells
To assess the distribution GABABRs over the somatodendritic axis of hippocampal principal cells, we employed photolysis of caged GABA (Rubi-GABA, 20 μM) to map the laminar activation of the receptor-channel complexes (Figure 2). We first confirmed that uncaged Rubi-GABA mediated IPSCs (uIPSC) produced in the presence of NMDA and AMPA and GABAA receptors blockers were mediated by GABABRs. To achieve this, we induced photolysis of Rubi-GABA in the entire visual field over the apical dendrites, which produced large amplitude slow uIPSCs in CA1 and CA3 PCs, as well as DGCs (52.6 ± 11.1, 71.7 ± 9.1, 29.1 ± 5.0 pA, respectively; data not shown). While these amplitudes were smaller than those during pharmacological activation, the differences in their magnitudes from the different cell types corresponded well to those for the baclofen induced currents (P = 0.005, one-way ANOVA). Furthermore, the decay-time constants of the full-field uIPSCs were similar to those elicited by a single extracellular stimulus (P > 0.05 all, Mann–Whitney test). Finally, in three CA1 PCs bath application of CGP reduced the uIPSC amplitude by 97% (data not shown), confirming that pharmacologically isolated slow uIPSCs were produced by the activation of postsynaptic GABABRs.
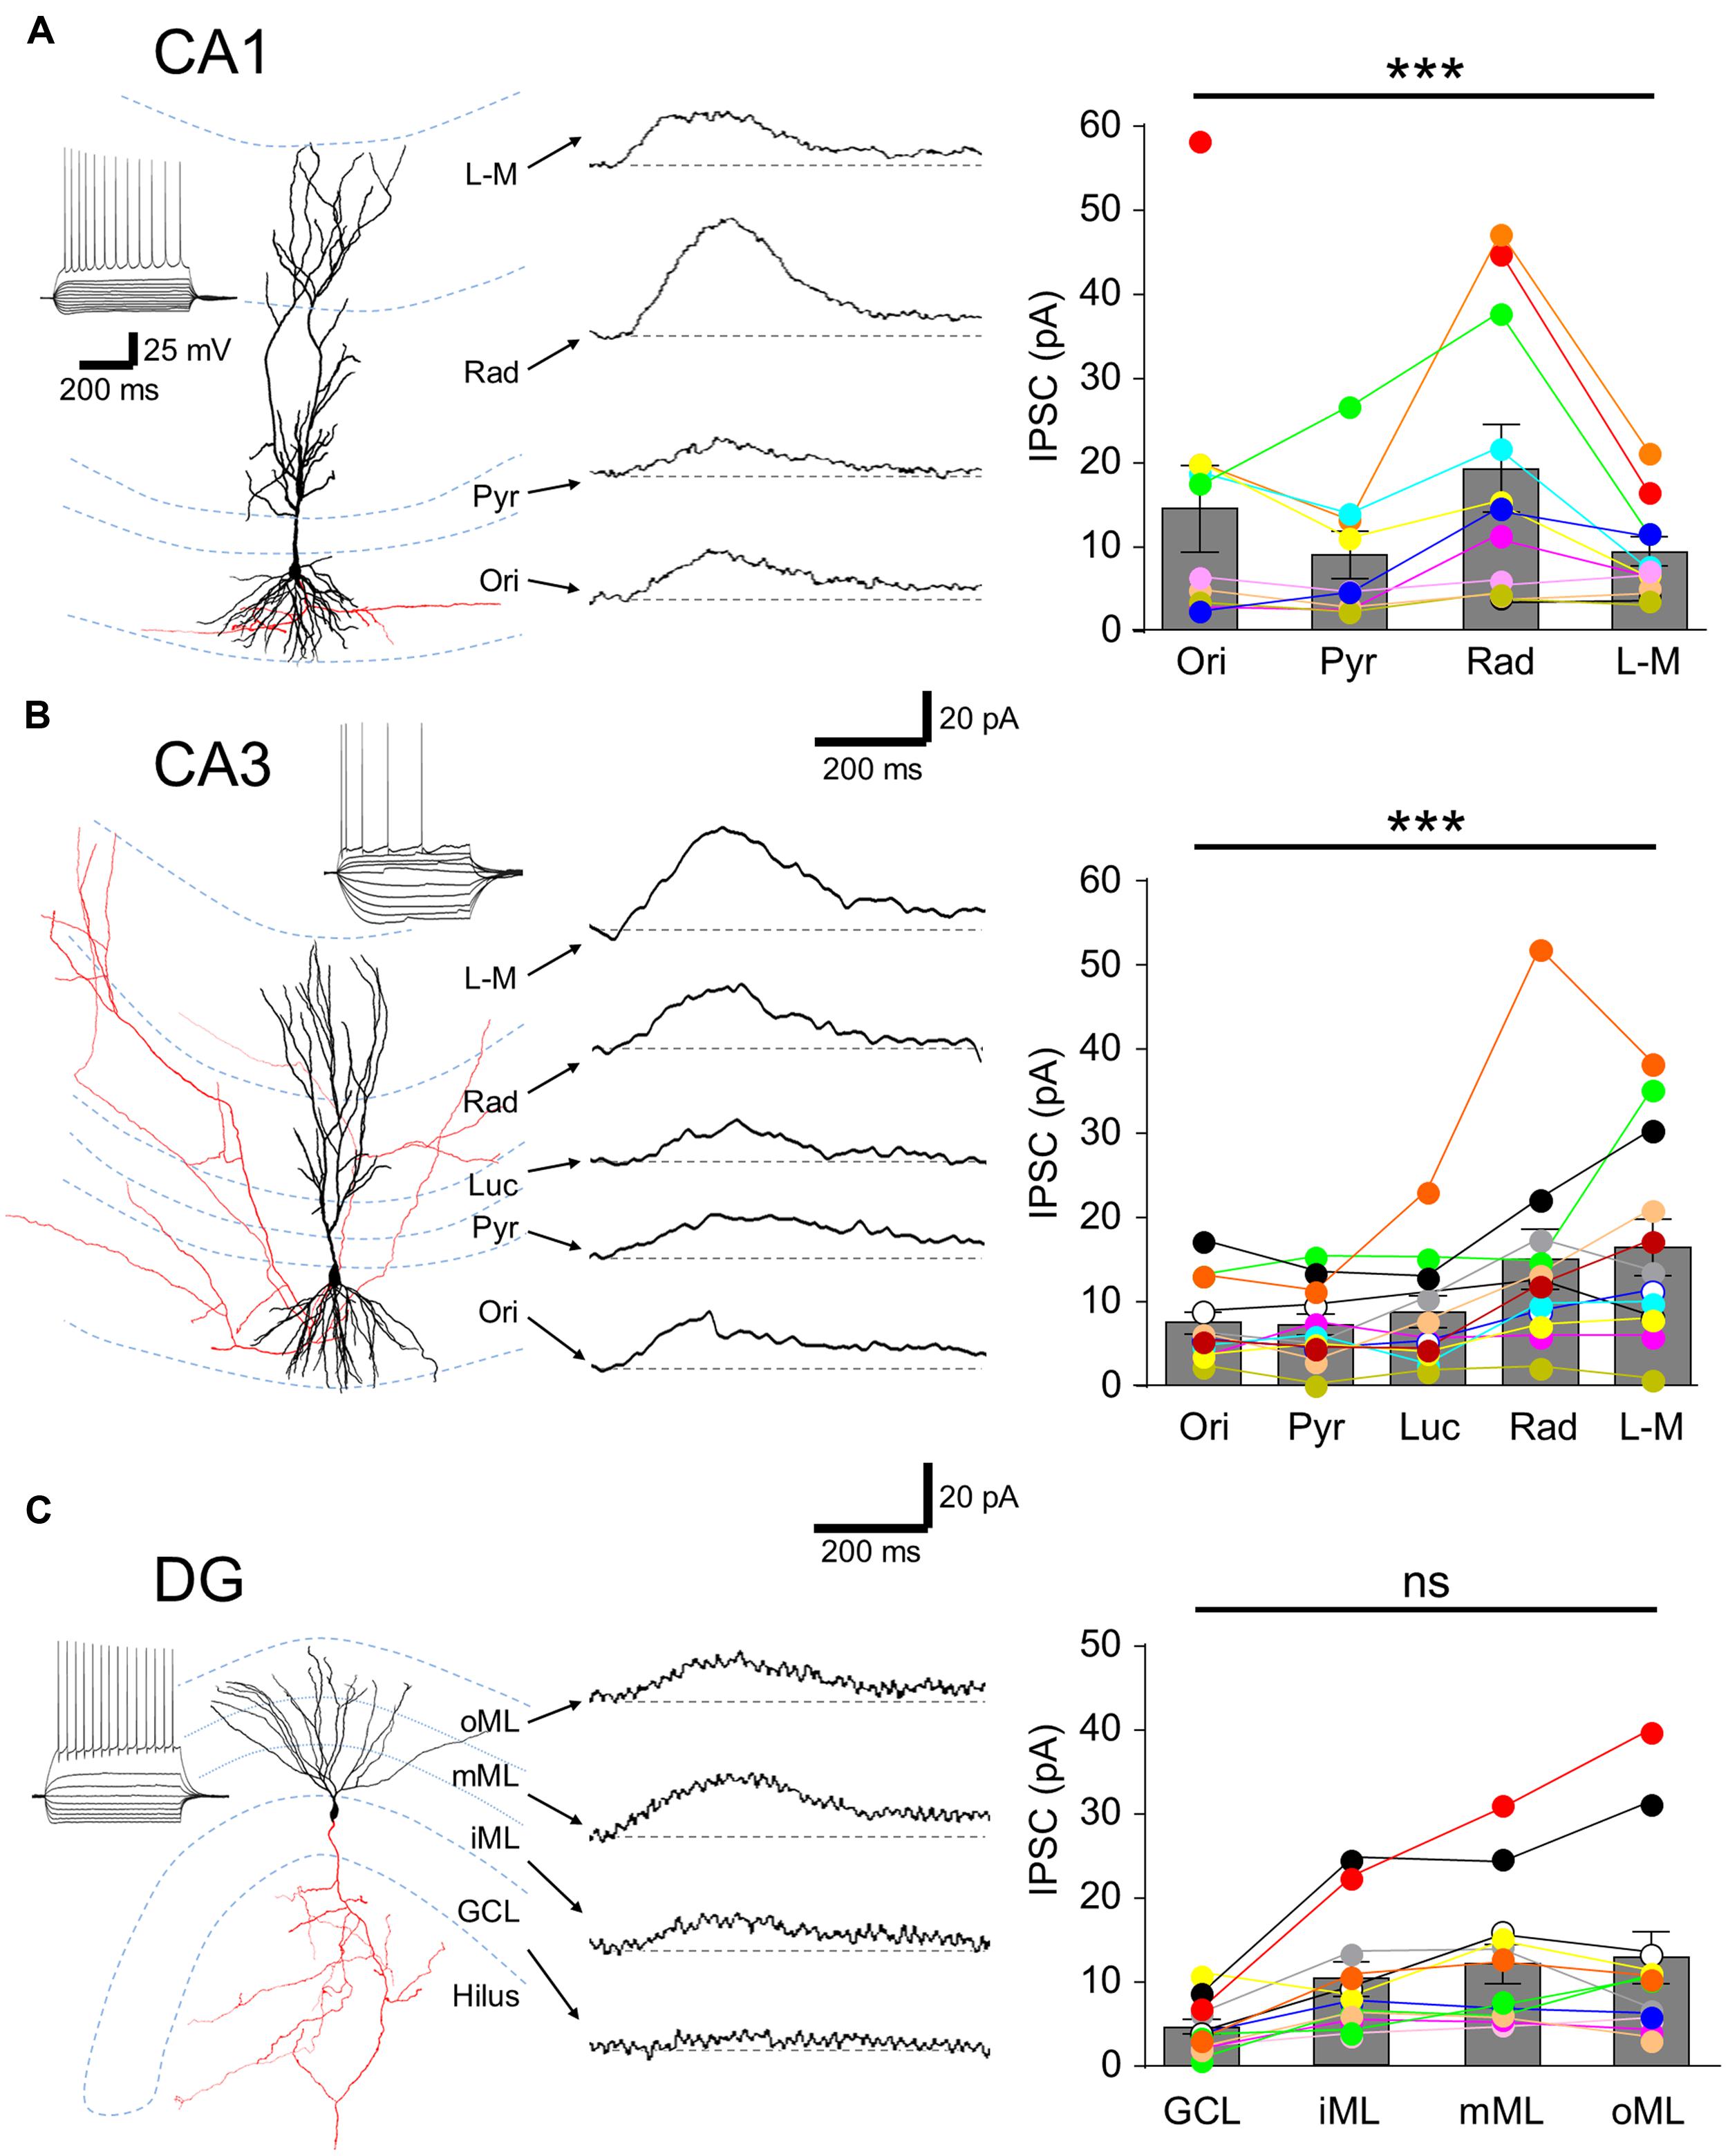
FIGURE 2. Laminar distribution of GABABR-mediated currents in hippocampal principal cells. (A, left) Reconstruction of a CA1 PC. Soma and dendrites are shown in black and the axon in red. Inset, Voltage responses to a family of hyper- to depolarizing current pulses (–250 to +500 pA, 50 pA steps). A train of APs was elicited at the largest step. (A, middle) Representative pharmacologically isolated GABABR-mediated uIPSCs in the different layers (L-M: str. L-M; Rad: str. radiatum; Pyr: str. pyramidale; Ori: str. oriens). Baseline is indicated by a gray dashed line, (A, right) Summary bar chart illustrates the mean uIPSC amplitudes for each layer (n = 11). (B, left) Reconstruction of a CA3 PC with the same layout as in (A) with the inset. (B, middle) GABABR-mediated uIPSCs from a CA3 PC for the various layers (Luc: str. lucidum). (B, right) Summary bar chart of the mean uIPSC amplitudes for CA3 PCs (n = 12). (C, left) A reconstructed DGC, with intrinsic physiological response as inset. (C, middle) Representative GABABR uIPSCs recorded from a DGC evoked in the different layers (GCL; iML, inner ML; mML, medial ML; oML, outer ML). (C, right) Summary bar chart of the mean uIPSC amplitudes for DGCs (n = 12). Bars for the mean values are overlain by data from individual experiments (color coded circles and lines). Statistics shown: ns = P > 0.05, ***P < 0.001; one-way ANOVA.
Spatially restricted uncaging of GABA was achieved by applying flashes of light (200 ms duration) to narrow strips (60 μm) in the different hippocampal layers perpendicular to the somatodendritic axis. In CA1 PCs (n = 11 cells) laminar activation of GABABR produced uIPSCs with the largest amplitude in str. radiatum (19.2 ± 5.0 pA), followed by str. oriens with 14.4 ± 4.9 pA. uIPSCs elicited in the str. L-M and the perisomatic domain in the str. pyramidale had comparable amplitudes (9.3 ± 1.6 vs. 8.9 ± 2.7 pA). The observed differences between the layers were statistically significant (P = 0.0001, one-way ANOVA with Bonferonni multiple comparisons, Figure 2A). To confirm that laminar GABABR-mediated responses were not due to extensive diffusion from the uncaging site, we photoreleased GABA in L6 of the cortex directly below the recorded CA1 PCs, which did not produce any discernible uIPSC (1.4 ± 0.2 pA, P < 0.05 compared to all other lamina).
As with CA1, uIPSCs in CA3 PCs (n = 13 cells) were large in str. radiatum and L-M but in these cells had similar mean amplitudes of 15.0 ± 3.4 and 16.4 ± 3.2 pA, respectively (P < 0.05 all, Figure 2B). uIPSCs in str. oriens, lucidum and pyramidale, were small with comparable amplitudes: 7.3 ± 1.2, 8.7 ± 1.8, and 7.2 ± 1.2 pA respectively (P > 0.05 all, Figure 2B, left); substantially lower than in str. radiatum and L-M (P = 0.0003, one-way ANOVA with Bonferroni multiple comparisons).
In contrast to PCs, lamina specific slow uIPSCs in DGCs (n = 13 cells) showed relatively constant amplitudes along the somatodendritic axis over different subregions of the ML (inner: 10.3 ± 2.0 pA, middle: 12.0 ± 2.2 pA and outer: 12.9 ± 3.0 pA; P > 0.05, Figure 2C), but had markedly lower mean amplitude of 4.6 ± 0.8 pA in the cell body layer (P = 0.0003, one-way ANOVA with Bonferroni multiple comparisons, Figure 2C).
In summary, GABABR-mediated currents were observed in all somatodendritic domains of hippocampal principal cells but substantial differences were present in the laminar distribution of functional GABABR-mediated currents, with high currents measured from the apical dendrites.
Laminar Distribution of GABABR-Mediated Current and Conductance Densities in Hippocampal Principal Cells
The Rubi-GABA uncaging-induced currents measured from the various layers showed large variability, which was at least partially due to differences in (1) the length and surface area of dendrites exposed to the light flash and (2) voltage-clamp errors and loss of currents at dendritic membranes. In order to estimate these factors, we have created 3-D reconstructions of a subset of neurons (five CA1 and five CA3 PCs, and four DGCs, Table 2), quantified dendritic length and surface area, then performed single cell simulations.
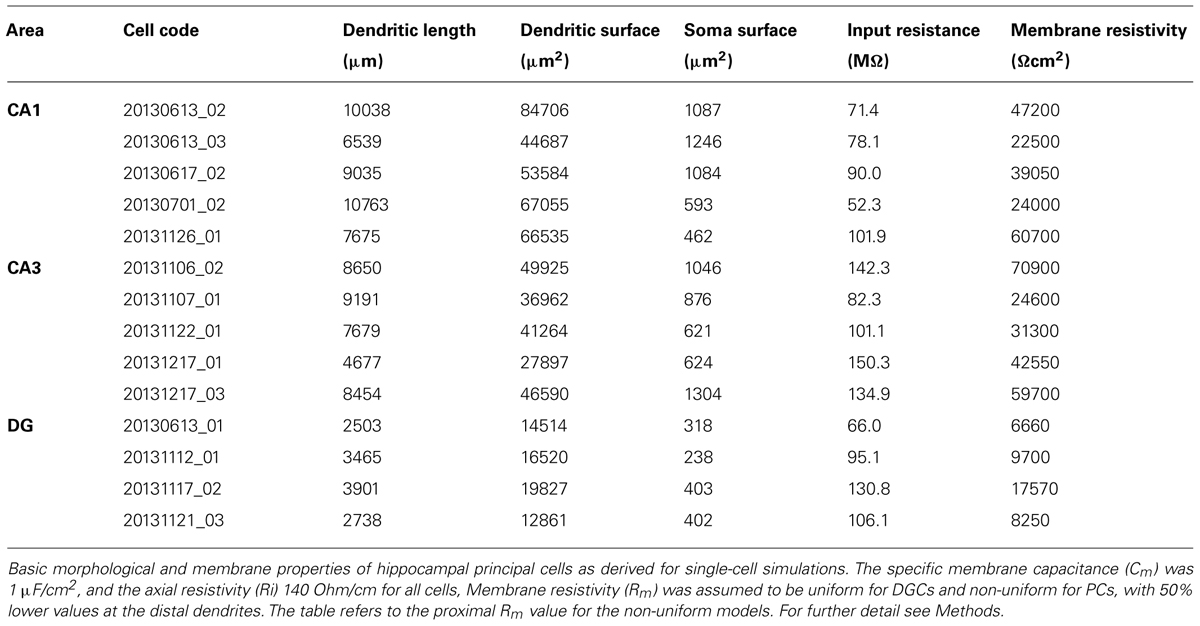
TABLE 2. Morphological and passive electrical properties of hippocampal principal cells used in the simulations.
We first normalized the somatically measured current to the membrane surface area falling into the 60 μm-wide horizontal illumination windows. This normalization indicated that the current density for CA1 PCs was lowest in the perisomatic domain (0.91 ± 0.27 fA/μm2). The current density for the dendrites was moderately higher in the str. oriens (2.22 ± 1.15 fA/μm2) and str. radiatum (1.97 ± 0.94 fA/μm2), and it was the highest in the str. L-M (3.97 ± 0.80 fA/μm2), albeit with considerable cell-to-cell variability for all dendritic layers. In area CA3, the current densities showed a similar distribution with the highest values found at the apical dendrites in the str. L-M (10.3 ± 2.90 fA/μm2). In comparison to CA1 PCs, the normalized current values were approximately 2.5-times higher with the exception of the str. oriens which had the lowest value of all CA3 layers (1.15 ± 0.19 fA/μm2). In DG, the normalized currents were comparably low for the perisomatic domain as well as the proximal and medial dendrites in the inner and the middle ML (2.32–3.05 fA/μm2), but increased markedly for the distal dendrites in the outer ML (7.92 ± 4.71 fA/μm2).
In order to estimate the local GABABR-mediated conductance densities in the different somatodendritic compartments, we next ran single-cell simulations using the reconstructed principal cell models assuming passive membrane properties (Table 2 and Figure 3). As expected, the conductance density for the perisomatic domain of CA1 showed the lowest mean value (GMem = 3.7 ± 1.0 μS/cm2, Figures 3A,B) and the lowest cell-to-cell variability. It was very close to the estimated value (Gest = 3.0 ± 0.8 μS/cm2) obtained from the normalized current density and the driving force, confirming that there was very little loss when measuring the induced GABABR-mediated slow currents in this compartment. For the dendrites in the str. oriens conductance densities (GMem = 9.5 ± 4.9 μS/cm2, Figure 3B) were higher both in absolute value and in comparison to the estimated density from the current densities. Nevertheless, the ratio of simulated and estimated conductance densities (GMem/Gest = 78.3%) indicated only a moderate attenuation along the basal dendrites. By contrast, in str. radiatum and str. L-M, the majority of the dendritic segments were dominated by small caliber oblique and tuft branches, the density values were markedly higher (20.3 ± 15.0 and 64.7 ± 33.8 μS/cm2, respectively) and the attenuation stronger (GMem/Gest = 48.6 and 31.7%, respectively), which was highly significantly different, as shown by a Friedman test (P = 0.006), and also confirmed that str. L-M had a higher conductance density than basal dendrites in the str. oriens (P < 0.05).
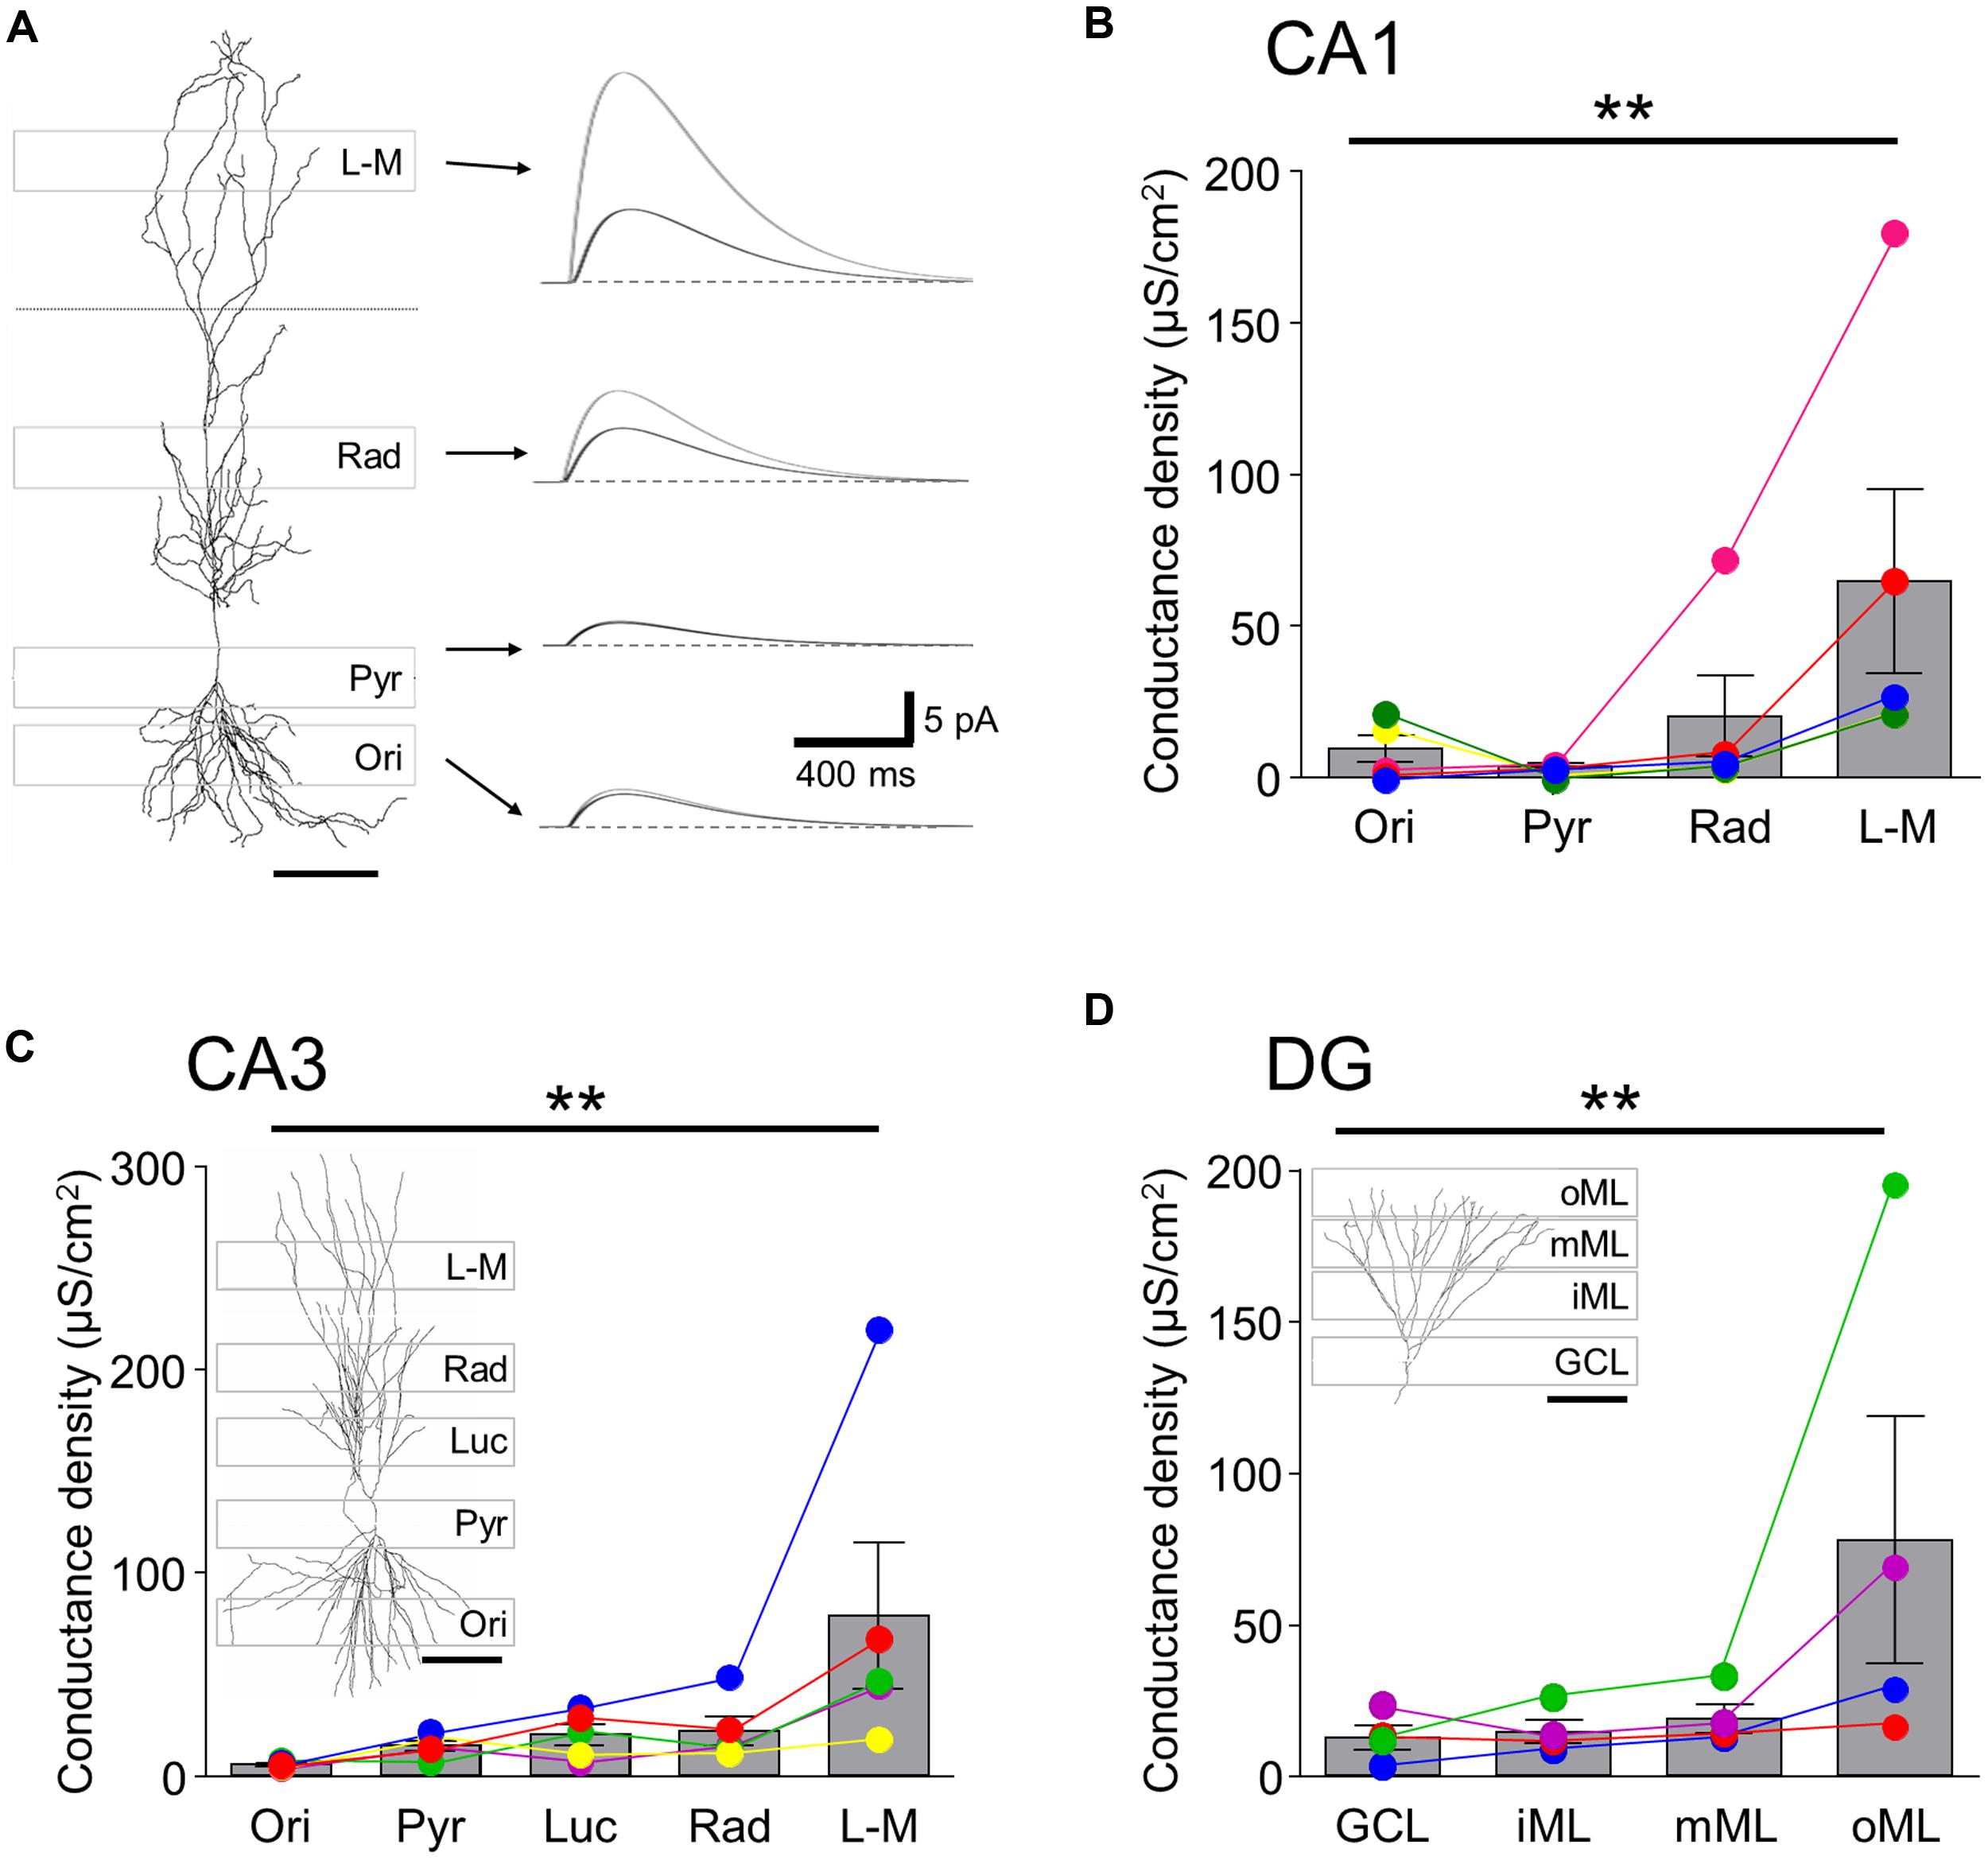
FIGURE 3. Single-cell simulation of GABABR mediated currents and conductance densities in 3-D reconstructed hippocampal neurons.(A, left) 3-D reconstruction of a CA1 PC shown in conjunction with the laminar stripes in which Rubi-GABA was released (gray boxes overlain). (A, right) Simulated GABABR-mediated ISPC pairs at the somatic recording site (black traces) and the illuminated perisomatic or dendritic membranes (gray traces) corresponding to the layer specific photostimulation windows (indicated by the arrows). The dendritic conductances were set so that the somatic IPSC amplitudes match the experimentally observed light induced current amplitudes. Note the difference in the amplitudes of the dendritic and somatic currents. (B) Summary bar chart showing the GABABR-mediated conductance densities for the illumination windows in the different layers of the CA1 area derived in the simulations. Average data is overlain by data from individual experiments (colored circles and lines). Note that the conductance densities were consistently largest in str. L-M. (C,D) Summary bar charts showing the conductance densities for membrane surfaces in the illumination windows in the different layers for CA3 PCs and DGCs, respectively; same format as in (B). Representative cell reconstructions with the illumination windows superimposed are shown as insets. Scale bars: 100 μm. Statistics shown: **P < 0.01, from Friedman’s tests.
In the CA3 region the conductance density was lowest in the str. oriens (5.2 ± 0.7 μS/cm2, Figure 3C), comparable to that of CA1 in terms of both its amplitude and the degree of attenuation. Interestingly, the densities for the perisomatic domain and proximal and middistal dendrites in the str. lucidum and radiatum had similar conductance densities of between 14.5 and 21.8 μS/cm2 (P > 0.05 all, Friedman’s test). The conductance density in CA3 PCs was highest in str. L-M, with a value (78.9 ± 40.3 μS/cm2, P < 0.05) which was slightly larger, but not significantly so to that for CA1 PCs (P = 0.67, Mann–Whitney test). However, the attenuation was less pronounced (GMem/Gest = 54.8%) from the distal apical dendrites of CA3 PCs, explaining the larger observed somatic currents.
Finally, in DGCs the conductance density increased incrementally from the GCL toward the middle ML from 12.1 to 18.6 μS/cm2, whereas it was markedly higher for the distal apical dendrites in the outer ML (77.3 ± 47.0 μS/cm2; P < 0.05 inner vs. outer ML, Figure 3D). Attenuation in the dendrites of GCs was less pronounced than in apical dendrites of CA1 PCs: the GMem/Gest was 82.0% at the perisomatic domain, reflecting minimal attenuation, decreasing consistently toward the distal dendrites of the outer ML (34.9%).
In summary, the morphometric analysis and the single-cell simulations further confirmed that GABABR-mediated currents were observed in all somatodendritic compartments of hippocampal principal cells and revealed that while on the perisomatic domain and the basal dendrites of PCs conductance densities are low, they are high on the distal apical dendrites in the str L-M and in the oML.
Distribution of GABAB1 and Kir3.2 Subunits is Different Between Hippocampal Subfields and Lamina as Shown by SDS-FRL
As previous work (Kulik et al., 2003, 2006) has shown light microscopic differences in laminar expression of GABAB and Kir3 subunits, we asked whether the distribution of GABABR-mediated currents is concordant with GABABR and Kir3 channel expression at the plasma membrane along the somatodendritic axis of hippocampal principal cells. We therefore performed highly sensitive SDS-FRL labeling for these signaling molecules (Hagiwara et al., 2005; Kulik et al., 2006) to allow us to accurately calculate the membrane surface densities of these proteins. Immunogold labeling for GABAB1 and Kir3.2 subunits was achieved from replicas containing all dendritic and somatic layers for each region, so that the laminar distribution could be compared under identical conditions for each hippocampal region. Consistent with previous reports from pre-embedding immunogold labeling (Kulik et al., 2003, 2006; Booker et al., 2013) GABAB1 and Kir3.2 subunits were found at high densities on the postsynaptic membrane of the entire somatodendritic axis of principal cells.
In CA1, spiny dendritic and somatic profiles were collected from all dendritic layers and the str. pyramidale, respectively (Figure 4A). Quantification of immunogold particles for GABAB1 subunit revealed that the labeling intensity varied substantially between the different layers (P = 0.0053, one-way ANOVA, Figure 4B, left). Immunogold particle density was highest in str. L-M and oriens which had a similar density of labeling (36.8 ± 4.9 and 32.1 ± 3.6 particles/μm2, respectively; P > 0.05 one-way ANOVA with Bonferroni multiple comparisons). Dendrites in str. radiatum and somatic membranes of CA1 PCs showed lower labeling with similar levels (19.0 ± 2.3 and 19.6 ± 3.7 particles/μm2, respectively; P = 0.9, one-way ANOVA with Bonferroni multiple comparisons) which was approximately 50% of those found on the basal and distal apical dendrites (Figure 4B, left).
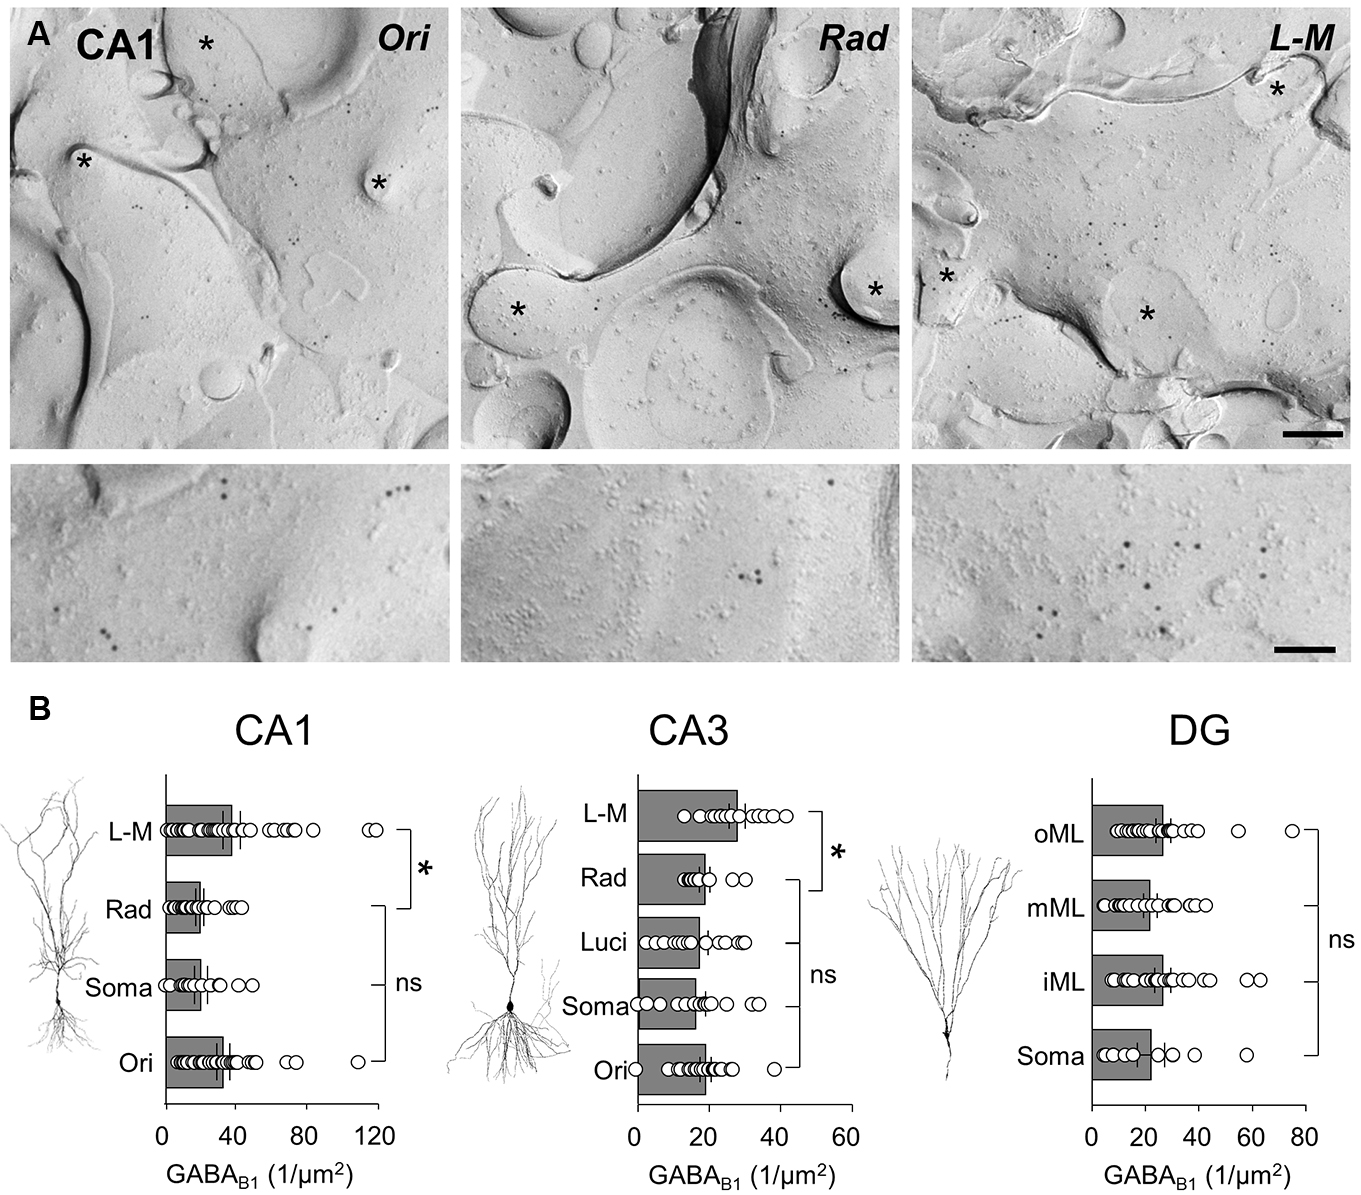
FIGURE 4. GABAB1 receptor subunits are differentially expressed along the somatodendritic axis of hippocampal principal cells. (A) Representative SDS-FRL electron micrographs of spiny dendrites from str. oriens (Ori), str. radiatum (Rad), and stratum L - M (L - M) of the CA1. The putative CA1 PC dendrites show immunogold labeling for GABAB1 receptor subunits (10 nm gold particles). Spines and fractured spine necks are indicated with asterisks (∗). Scale bar: 200 nm (top row), 100 nm (bottom row). (B) Summary bar charts of the GABAB1 subunit surface density from somatodendritic compartments in different layers of CA1 (left), CA3 (middle), and DG (right) are shown alongside representative images of principal cells. Mean surface densities are overlain by density measurements of individual P-face structures. Statistics shown: ns = P > 0.05, *P < 0.05, one-way ANOVA.
In CA3 PCs, immunogold particle density for the GABAB1 subunits was highest on dendrites in the str. L-M (27.9 ± 2.3 particles/μm2, Figure 4B, middle), similar to the CA1. In the other CA3 layers, however, putative PC spiny dendrites as well as somata showed a 30–40% lower, but broadly similar labeling intensities (str. oriens: 19.0 ± 1.6 particles/μm2, CA3 PC somata: 15.9 ± 2.6 particles/μm2, str. lucidum: 17.4 ± 2.4 particles/μm2, str. radiatum: 18.7 ± 1.5 particles/μm2, Figure 4B, middle, P = 0.0019, one-way ANOVA comparison of all layers), Finally, in the DG the membrane surface densities for the GABAB1 subunits were largely constant across the layers (P = 0.59, one-way ANOVA with multiple comparisons, Figure 4B, right), with surface densities of 22.1 ± 5.1 particles/μm2 on somata in the GCL, 26.6 ± 3.1 particles/μm2 on dendrites in the inner ML, 21.9 ± 2.5 particles/μm2 in the middle ML, and finally 26.6 ± 2.8 particles/μm2 in the outer ML.
Localization of the constitutive Kir3 effector channel subunit, Kir3.2, in spiny dendrites and somata of CA1 showed a generally lower, but largely overlapping pattern of labeling, with some notable differences when compared to that of GABAB1. Dendrites in the CA1, str. radiatum and L-M showed a high and relatively constant membrane surface labeling (12.1 ± 1.5 and 12.8 ± 3.2 particles/μm2, respectively, P > 0.05; Figures 5A,B, left). Immunogold particle density was ∼50% lower on dendrites in str. oriens (5.9 ± 1.1 particles/μm2) and ∼80% lower on the somatic membrane in the str. pyramidale (2.6 ± 0.8 particles/μm2), which were significantly different from str. radiatum and L-M, (P = 0.0013, one-way ANOVA with Bonferonni multiple comparisons; Figures 5A,B, left). A similar pattern was observed in CA3 (P < 0.0001, one-way ANOVA, Figure 5B, middle), where Kir3.2 labeling was high in the str. radiatum and L-M (13.4 ± 1.8 and 14.7 ± 1.9 particles/μm2, respectively), 50% lower in the str. oriens (6.8 ± 0.6 particles/μm2) and even lower in dendrites in str. lucidum and on somata in the str. pyramidale (3.0 ± 0.5 and 2.8 ± 0.5 particles/μm2, respectively). Finally, in the DG, the labeling for Kir3.2 in the somatodendritic domain of DGCs showed a gradual increase from the soma to the distal dendrites (P = 0.006, one-way ANOVA, Figure 5B, right), with mean Kir3.2 densities of 7.7 ± 2.3, 14.8 ± 1.9, 19.2 ± 2.2, and 23.8 ± 3.0 particles/μm2 on somata in the GCL, and dendrites in the inner, middle and outer ML, respectively.
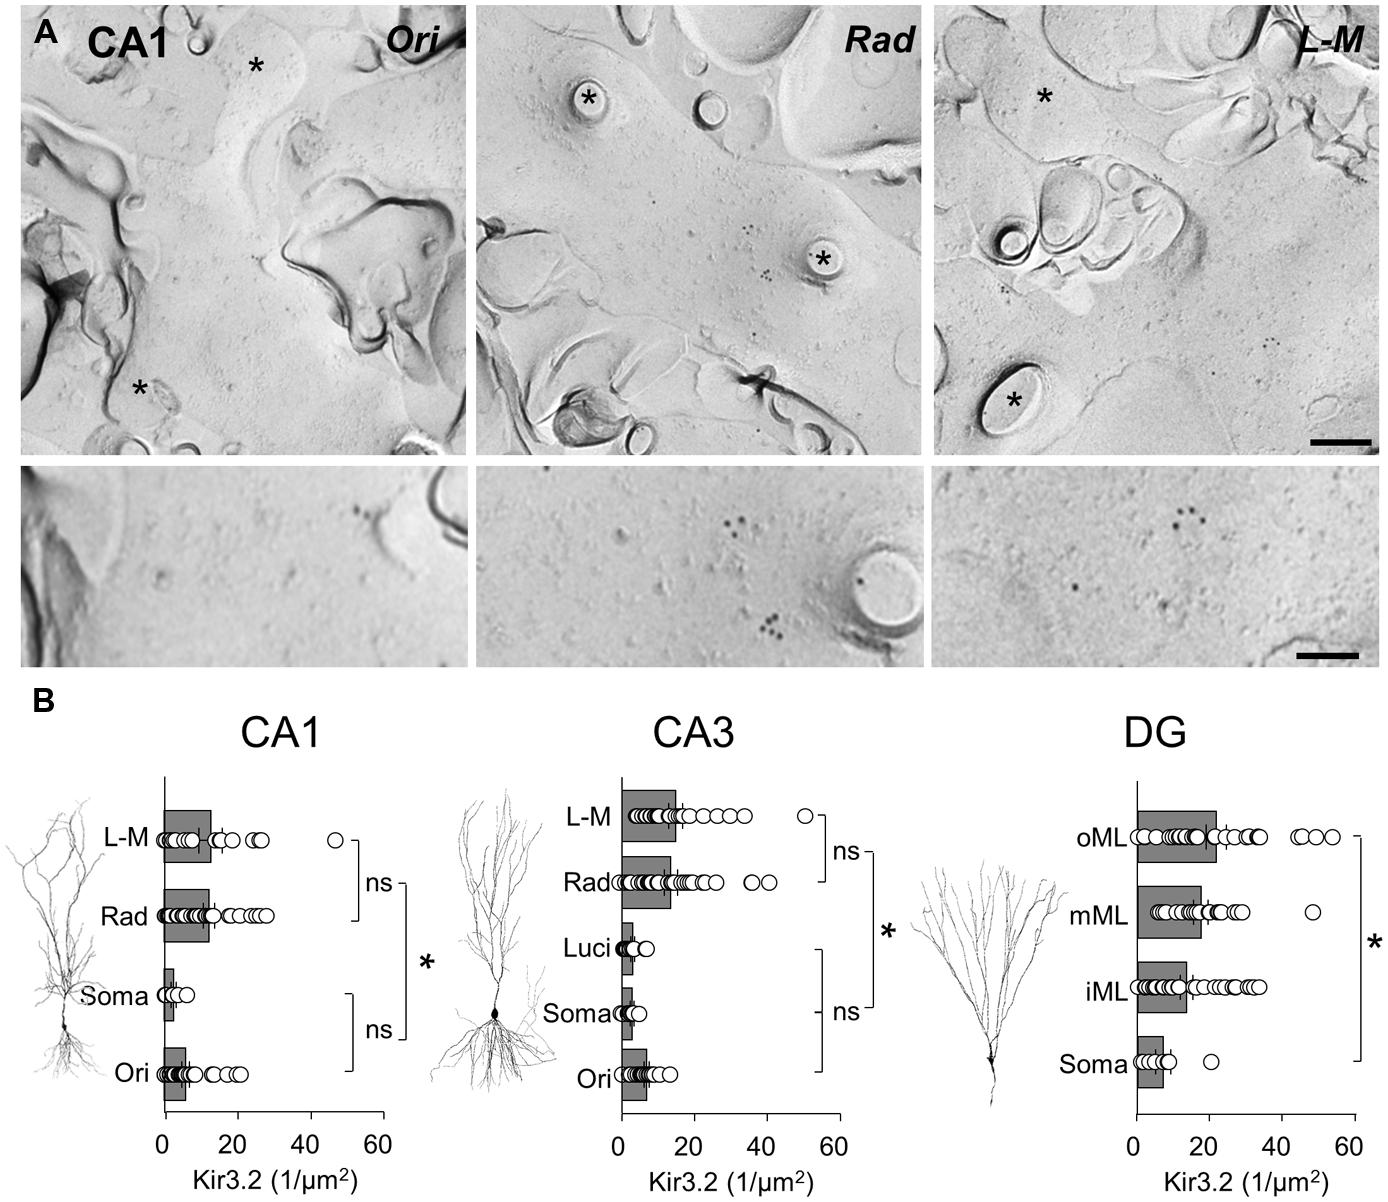
FIGURE 5. The Kir3.2 channel subunit is differentially expressed along the somatodendritic axis of hippocampal principal cells. (A) Representative electron micrographs of spiny dendrites from str. oriens (Ori), radiatum (Rad) and L - M (L - M) of the CA1. Immunogold labeling for the Kir3.2 channel subunit seen as 10 nm gold particles. Spines and fractured spine necks are indicated with asterisks (∗). Scale bar: 200 nm (top row), 100 nm (bottom row). (B) Summary bar charts of the surface density for the Kir3.2 subunit from the different layers of the CA1 (left), CA3 (middle), and DG (right) are shown alongside representative images of principal cells. Mean surface densities are overlain by measurements of individual density values for examined structures. Statistics shown: ns = P > 0.05, *P < 0.05, one-way ANOVA.
In summary, SDS-FRL labeling for GABAB1 and Kir3.2 subunits showed clear lamina- and region-specific differences. GABAB1 displayed higher expression with moderate differences along the somatodendritic axis of principal cells. In contrast, labeling for Kir3.2 had a lower overall level, but the labeling density was consistently higher on distal apical dendrites than on basal, proximal apical dendrites or somata.
Discussion
Our study confirms that the GABABR-Kir3 channel signaling cascade is present along the entire somatodendritic axis of hippocampal principal cells. However, the receptor and effector channel, as well as the resulting conductances are not uniformly distributed, but show region- and layer-specific differences (Figure 6). Receptor and channel distributions are overlapping, but show divergence, whereby the conductance densities and somatic current amplitudes correlate better with Kir3 densities, suggesting that GABABR-mediated currents are primarily determined by an effector-bottlenecking effect.
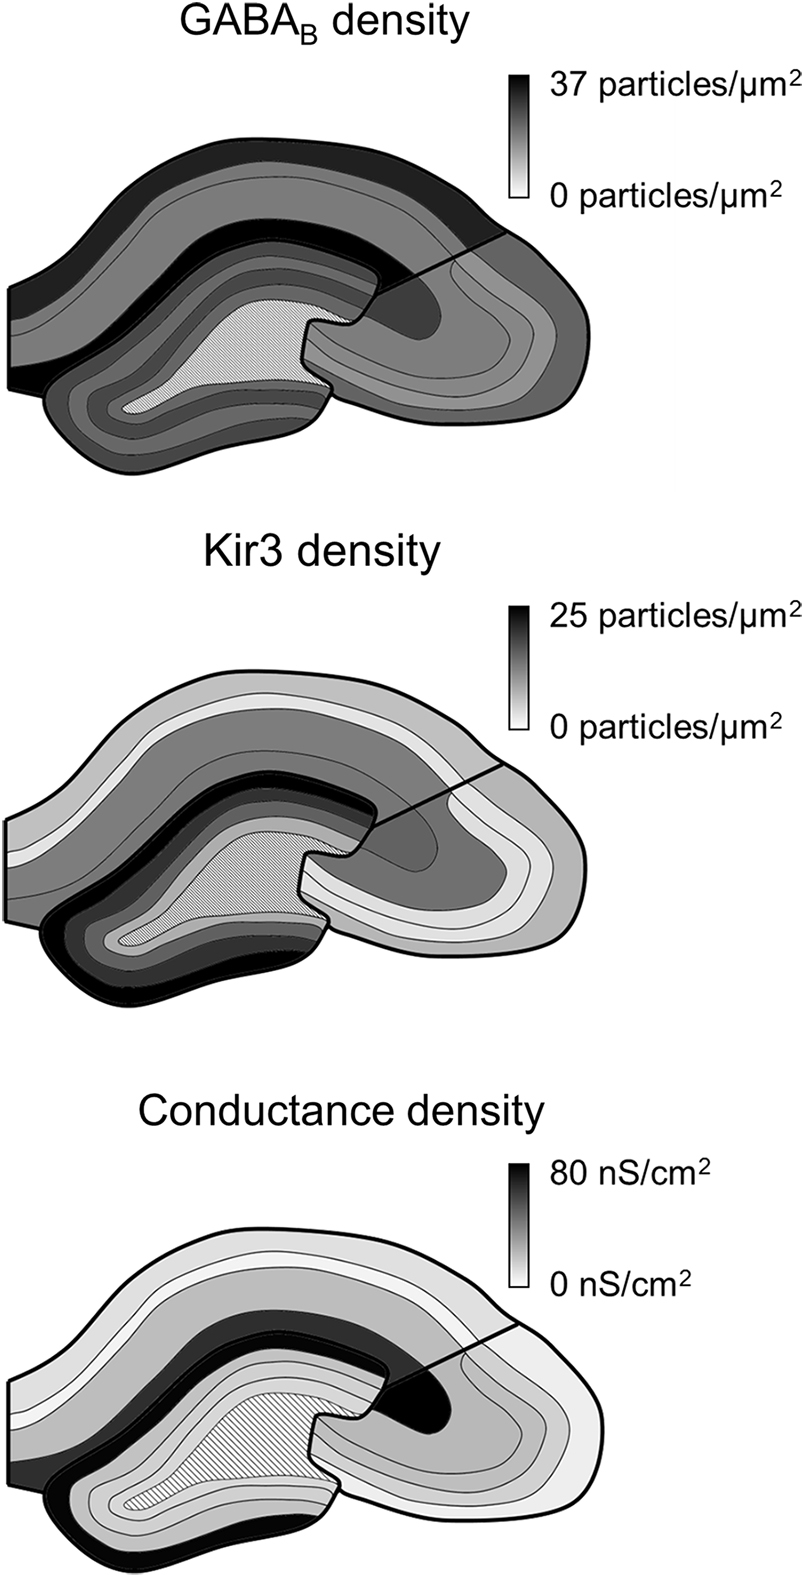
FIGURE 6. Summary of GABAB receptor and Kir3 effector channel and conductance density distributions in the hippocampus. Schematic overviews of the hippocampus show the density of immunogold labeling for GABAB receptor (top) and Kir3 channels (middle) as well as for conductance densities derived in the simulations (bottom). Boundaries of the hippocampal areas CA1, CA3, and DG as well as their layers are delineated in black; dark to light tones correspond to high to low densities (see scale bars to the right).
Regional Differences in GABABR Expression and Currents
The observed GABABR-mediated currents varied between hippocampal regions with the highest currents in CA3 PCs. This difference is consistent with previous light microscopic studies, which showed higher intensity GABABR labeling in the CA3 neuropil (Fritschy et al., 1999; Sloviter et al., 1999; Kulik et al., 2003). However, high-resolution analysis of GABAB1 subunits on dendritic membranes revealed a different relationship whereby CA1 > CA3 > DG. This discrepancy between the whole-cell currents and the immunogold densities in SDS-FRL might be explained by a larger somatodendritic surface of CA3 PCs (Cannon et al., 1999; note however, that in our sample such a trend wasn’t present), divergent GABAB1 splice-variant localization, or variation in immunogold labeling between replicas. Furthermore, amplitudes of GABABR-mediated currents are likely to be limited by Kir3 channel densities, which were comparably low in the two cell types. In good agreement, the low IWC measured in DGCs was consistent with the smaller dendritic arbor and low receptor and channel expression. However, this result is in conflict with the proposition that DGCs receive stronger inhibitory input (Gottlieb and Cowan, 1972; Bekenstein and Lothman, 1991) although GABAA- vs. GABAB-mediated mechanisms may show divergence.
Lamina Specific Differences in GABABR and Kir3 Channel Density
Our data further show that GABABRs, as well as effector Kir3 channels are differentially localized to somatodendritic compartments of hippocampal principal cells (See Figure 6). This is in line with results of previous light microscopic investigations (Fritschy et al., 1999; Sloviter et al., 1999; Kulik et al., 2003). SDS-FRL method enables high-resolution subcellular localization and label a high proportion (>70%) of surface-localized proteins (Tanaka et al., 2005). Therefore, the membrane densities of both GABAB1 and Kir3.2 subunits detected in the electron microscope are a better reflection of their subcellular distributions than light microscopic data. In fact the currents measured for the various layers correlated well with the densities of Kir3.2 in the electron microscope. This result further suggests that coupling efficiency between the receptor and the channel might be spatially uniform but the currents are largely defined by the availability of Kir3.2-containing channels.
Previous work has indicated that GABABR-mediated IPSPs in CA1 are uniform across dendritic layers in terms of amplitudes and kinetics (Pham et al., 1998). Our physiological examination of GABABR-mediated currents evoked by lamina-specific photolysis of caged-GABA now reveals differential expression of the currents in all regions of the rat hippocampus with highest magnitudes on the distal apical dendrites. However, the somatically recorded responses do not account for the electrotonic properties of the neurons (Spruston et al., 1993; Szilágyi and De Schutter, 2004). Indeed, simulations using morphologically detailed single-cell models demonstrate that the somatic voltage-clamp recordings substantially underestimate conductances in distal dendritic compartments.
As our single cell model included several assumptions, we need to exert caution with the interpretation of the quantitative results (Szilágyi and De Schutter, 2004). Nevertheless, the highest conductance densities obtained for the distal apical dendrites (65–80 μS cm-2) suggest that during flash-induced activation 0.02–0.1 channels are open on a 1-μm2 membrane patch (assuming a single-channel conductance between 5 and 31 pS, Takigawa and Alzheimer, 1999; Chen and Johnston, 2005). This number is markedly lower than the density of immunogold particles for both the receptor and effector channel in the same compartments (10–40/μm2) suggesting that less than 1% of the channels are open upon receptor activation. Even if we consider the low open probability of the activated channels (0.119, Chen and Johnston, 2005), the coupling of receptor and channel appears to be inefficient in both interneurons (Booker et al., 2013) and principal cells.
A finding of major interest is the high GABABR/Kir3 conductance density on the distal apical dendrites of hippocampal principal cells. This is at odds with results from layer 5 of the somatosensory cortex (Breton and Stuart, 2012), which suggested that GABABR effects are mediated by inhibition of voltage-sensitive calcium channels, but not Kir3 channels in distal dendrites. Our data show that this hypothesis cannot be extended to the hippocampus, as the highest expression of Kir3 channels, and the largest conductances were detected in the distal apical dendrites. In fact, this canonical postsynaptic signaling cascade was present along the entire somatodendritic axis of hippocampal PCs. However, this finding does not preclude that receptors interact with other effectors. On the contrary, the apparently inefficient coupling of receptor and Kir3 channels could be explained by divergent signaling cascades. Furthermore, it is plausible that activation of Kir3 channels and inhibition of L-type calcium channels act synergistically to control dendritic electrogenesis and plasticity in distal apical dendrites (Palmer et al., 2012; Larkum, 2013; Pérez-Garci et al., 2013).
The current results raise questions about the high membrane expression of GABAB1 in the absence of high Kir3 channel expression, as seen on basal dendrites in str. oriens or the perisomatic domain of CA1 PCs. What the function of this enrichment in GABABR compared to the effector is, remains unclear. The simplest explanation could be that a larger number of GABABRs are needed to ensure high fidelity inhibition. Indeed, on PC dendrites in str. oriens only ∼3% of synaptic contacts are inhibitory (Megías et al., 2001), suggesting a low availability of GABA in the extrasynaptic space. Alternatively, GABABRs may couple to other effector systems, such as calcium channels (Carter and Mynlieff, 2004; Chalifoux and Carter, 2011; Breton and Stuart, 2012). Furthermore, GABABRs have been shown to inhibit NMDA receptor mediated calcium influx (Chalifoux and Carter, 2010) and to enhance activity of group 1 mGluRs (Hirono et al., 2001) and GABAAR (Connelly et al., 2013; Tao et al., 2013); all perhaps explaining the excess of GABABRs in str. oriens. Furthermore, GABABRs have been shown to stimulate the transcription factors CREB2 and ATFx (Nehring et al., 2000; White et al., 2000); this could explain the presence of surface localized somatic GABAB1, but not Kir3.2 in all hippocampal principal cells.
Functional Implications for Laminar Specific Differences in Functional GABABR-Mediated Currents
We have observed GABABR, Kir3 channels and their functional currents in all somatodendritic regions of hippocampal principal cells. This will have substantial repercussions for the activity of the hippocampal microcircuit, by providing slow inhibition which shapes the excitability of dendrites and modulates synaptic plasticity (Kohl and Paulsen, 2010). The presence of large functional currents on distal apical dendrites, which receive input from the perforant path, is particularly pertinent, as this pathway lacks strong presynaptic GABABR-mediated inhibition (Lanthorn and Cotman, 1981). Thus, at distal dendritic locations, GABABR-mediated inhibition mostly arises from postsynaptic receptors. By comparison, the Schaffer collateral pathways are strongly inhibited by GABABR activation (Lanthorn and Cotman, 1981; Ault and Nadler, 1982). Therefore, excitatory transmission in these pathways is subjected to strong pre- and postsynaptic GABABR-mediated inhibition in str. radiatum, whereas in str. oriens presynaptic effects will dominate. In view of the differential affinity of pre- and postsynaptic GABABRs to GABA (Dugladze et al., 2013), differences along the somatodendritic axis have profound effects on synaptic integration and activation of principal cells as a function of GABA levels. Furthermore, synaptic plasticity is likely to be modulated differentially at these inputs by GABABRs, as presynaptic inhibition, postsynaptic membrane hyperpolarization and inhibition of NMDA receptors have negative impact on Hebbian plasticity (Magee and Johnston, 1997). This issue, however, is confounded by disinhibitory effects, produced via GABABR activation in inhibitory interneurons (Buhl et al., 1996; Mott et al., 1999; Booker et al., 2013), which enhances LTP (Mott et al., 1989, 1990; Davies et al., 1991). In good agreement with this proposition, LTP is larger in CA1 str. oriens than in str. radiatum (Haley et al., 1996; Bradshaw et al., 2003).
Finally, the presence of GABABR-mediated currents over the entire somatodendritic axis of hippocampal principal cells suggests that inhibitory interneurons, with axon projecting to any lamina, can contribute to GABABR IPSCs through volume transmission (Isaacson and Nicoll, 1993; Scanziani, 2000; Booker et al., 2013). This conclusion is in conflict with the hypothesis that certain types of interneuron, neurogliaform and ivy cells, are the source of GABABR-mediated inhibition (Williams and Lacaille, 1992; Price et al., 2005, 2008; Olah et al., 2009). Therefore it seems likely, that although interneurons with dense, focal axon among dendrites are capable of producing large GABABR currents, all interneurons could contribute to these responses.
In conclusion, we have shown that the GABABR-Kir3 signaling cascade is present along the entire somatodendritic axis of hippocampal principal cells, but show region- and lamina-specific distributions. These differences will impact dendritic integration, synaptic plasticity and the emerging principal cell activity for inputs from the various afferent pathways during heightened GABAergic activity.
Conflict of Interest Statement
The authors declare that the research was conducted in the absence of any commercial or financial relationships that could be construed as a potential conflict of interest.
Acknowledgments
The authors would like to thank Daniel Althof for preliminary electron microscopic observations in CA1; also both Ina Wolter and Natalie Cailles for their excellent technical support. VGAT-Venus transgenic rats were generated by Drs. Y. Yanagawa, M. Hirabayashi, and Y. Kawaguchi at the National Institute for Physiological Sciences, Okazaki, Japan, using pCS2-Venus provided by Dr. A. Miyawaki. Funding was provided by the Excellence Initiative of the German Research Foundation (Grant #EXC 257 to IV) and BIOSS-2 (Grant #A6 to AK).
Footnotes
References
Ault, B., and Nadler, J. V. (1982). Baclofen selectively inhibits transmission at synapses made by axons of CA3 pyramidal cells in the hippocampal slice. J. Pharmacol. Exp. Ther. 223, 291–297.
Baker, J., Perez-Rosello, T., Migliore, M., Barrionuevo, G. and Ascoli, G. (2011). A computer model of unitary responses from associational/commissural and perforant path synapses in hippocampal CA3 pyramidal cells. J. Comput. Neurosci. 31, 137–158. doi: 10.1007/s10827-010-0304-x
PubMed Abstract | Full Text | CrossRef Full Text | Google Scholar
Bekenstein, J. W., and Lothman, E. W. (1991). A comparison of the ontogeny of excitatory and inhibitory neurotransmission in the CA1 region and dentate gyrus of the rat hippocampal formation. Dev. Brain Res. 63, 237–243. doi: 10.1016/0165-3806(91)90083-U
PubMed Abstract | Full Text | CrossRef Full Text | Google Scholar
Bettler, B., Kaupmann, K., Mosbacher, J., and Gassmann, M. (2004). Molecular structure and physiological functions of GABAB receptors. Physiol. Rev. 84, 835–867. doi: 10.1152/physrev.00036.2003
PubMed Abstract | Full Text | CrossRef Full Text | Google Scholar
Booker, S. A., Gross, A., Althof, D., Shigemoto, R., Bettler, B., Frotscher, M.,et al. (2013). Differential GABAB-receptor-mediated effects in perisomatic- and dendrite-targeting parvalbumin interneurons. J. Neurosci. 33, 7961–7974. doi: 10.1523/JNEUROSCI.1186-12.2013
PubMed Abstract | Full Text | CrossRef Full Text | Google Scholar
Bradshaw, K. D., Emptage, N. J., and Bliss, T. V. P. (2003). A role for dendritic protein synthesis in hippocampal late LTP. Eur. J. Neurosci. 18, 3150–3152. doi: 10.1111/j.1460-9568.2003.03054.x
Breton, J.-D., and Stuart, G. J. (2012). Somatic and dendritic GABAB receptors regulate neuronal excitability via different mechanisms. J. Neurophysiol. 108, 2810–2818. doi: 10.1152/jn.00524.2012
PubMed Abstract | Full Text | CrossRef Full Text | Google Scholar
Buhl, E. H., Szilágyi, T., Halasy, K., and Somogyi, P. (1996). Physiological properties of anatomically identified basket and bistratified cells in the CA1 area of the rat hippocampus in vitro. Hippocampus 6, 294–305. doi: 10.1002/(SICI)1098-1063 (1996)6:3<294::AID-HIPO7>3.0.CO;2-N
PubMed Abstract | Full Text | CrossRef Full Text | Google Scholar
Cannon, R. C., Wheal, H. V., and Turner, D. A. (1999). Dendrites of classes of hippocampal neurons differ in structural complexity and branching patterns. J. Comp. Neurol. 413, 619–633. doi: 10.1002/(SICI)1096-9861(19991101)413:4<619::AID-CNE10>3.0.CO;2-B
PubMed Abstract | Full Text | CrossRef Full Text | Google Scholar
Carter, T. J., and Mynlieff, M. (2004). Gamma-aminobutyric acid type B receptors facilitate L-type and attenuate N-type Ca2+ currents in isolated hippocampal neurons. J. Neurosci. Res. 76, 323–333. doi: 10.1002/jnr.20085
PubMed Abstract | Full Text | CrossRef Full Text | Google Scholar
Chalifoux, J. R., and Carter, A. G. (2010). GABAB receptors modulate NMDA receptor calcium signals in dendritic spines. Neuron 66, 101–113. doi: 10.1016/j.neuron.2010.03.012
PubMed Abstract | Full Text | CrossRef Full Text | Google Scholar
Chalifoux, J. R., and Carter, A. G. (2011). GABAB receptor modulation of voltage-sensitive calcium channels in spines and dendrites. J. Neurosci. 31, 4221–4232. doi: 10.1523/JNEUROSCI.4561-10.2011
PubMed Abstract | Full Text | CrossRef Full Text | Google Scholar
Chen, X., and Johnston, D. (2005). Constitutively active G-protein-gated inwardly rectifying K+ channels in dendrites of hippocampal CA1 pyramidal neurons. J. Neurosci. 25, 3787–3792. doi: 10.1523/JNEUROSCI.5312-04.2005
PubMed Abstract | Full Text | CrossRef Full Text | Google Scholar
Connelly, W. M., Fyson, S. J., Errington, A. C., McCafferty, C. P., Cope, D. W., Di Giovanni, G.,et al. (2013). GABAB receptors regulate extrasynaptic GABAA receptors. J. Neurosci. 33, 3780–3785. doi: 10.1523/JNEUROSCI.4989-12.2013
PubMed Abstract | Full Text | CrossRef Full Text | Google Scholar
Davies, C. H., Starkey, S. J., Pozza, M. F., and Collingridge, G. L. (1991). GABAB autoreceptors regulate the induction of LTP. Nature 349, 609–611. doi: 10.1038/349609a0
PubMed Abstract | Full Text | CrossRef Full Text | Google Scholar
Drake, C. T., Bausch, S. B., Milner, T. A., and Chavkin, C. (1997). GIRK1 immunoreactivity is present predominantly in dendrites, dendritic spines, and somata in the CA1 region of the hippocampus. Proc. Natl. Acad. Sci. U.S.A. 94, 1007–1012. doi: 10.1073/pnas.94.3.1007
PubMed Abstract | Full Text | CrossRef Full Text | Google Scholar
Dugladze, T., Maziashvili, N., Börgers, C., Gurgenidze, S., Häussler, U., Winkelmann, A.,et al. (2013). GABAB autoreceptor-mediated cell type-specific reduction of inhibition in epileptic mice. Proc. Natl. Acad. Sci. U.S.A. 110, 15073–15078. doi: 10.1073/pnas.1313505110
PubMed Abstract | Full Text | CrossRef Full Text | Google Scholar
Dutar, P., and Nicoll, R. A. (1988). Pre- and postsynaptic GABAB receptors in the hippocampus have different pharmacological properties. Neuron 1, 585–591. doi: 10.1016/0896-6273(88)90108-0
Fritschy, J.-M., Meskenaite, V., Weinmann, O., Honer, M., Benke, D., and Mohler, H. (1999). GABAB-receptor splice variants GB1a and GB1b in rat brain: developmental regulation, cellular distribution and extrasynaptic localization. Eur. J. Neurosci. 11, 761–768. doi: 10.1046/j.1460-9568.1999.00481.x
Golding, N. L., Mickus, T. J., Katz, Y., Kath, W. L., and Spruston, N. (2005). Factors mediating powerful voltage attenuation along CA1 pyramidal neuron dendrites. J. Physiol. 568, 69–82. doi: 10.1113/jphysiol.2005.086793
PubMed Abstract | Full Text | CrossRef Full Text | Google Scholar
Gottlieb, D., and Cowan, W. M. (1972). On the distribution of axonal terminals containing spheroidal and flattened synaptic vesicles in the hippocampus and dentate gyrus of the rat and cat. Z. Zellforsch. Mikrosk. Anat. 129, 413–429. doi: 10.1007/BF00307297
PubMed Abstract | Full Text | CrossRef Full Text | Google Scholar
Guzman, S. J., Schlgl, A. and Schmidt-Hieber, C. (2014). Stimfit: quantifying electrophysiological data with Python. Front. Neuroinform. 8:16. doi: 10.3389/fninf.2014.00016
PubMed Abstract | Full Text | CrossRef Full Text | Google Scholar
Hagiwara, A., Fukazawa, Y., Deguchi-Tawarada, M., Ohtsuka, T., and Shigemoto, R. (2005). Differential distribution of release-related proteins in the hippocampal CA3 area as revealed by freeze-fracture replica labeling. J. Comp. Neurol. 489, 195–216. doi: 10.1002/cne.20633
PubMed Abstract | Full Text | CrossRef Full Text | Google Scholar
Hájos, N., Ellender, T. J., Zemankovics, R., Mann, E. O., Exley, R., Cragg, S. J.,et al. (2009). Maintaining network activity in submerged hippocampal slices: importance of oxygen supply. Eur. J. Neurosci. 29, 319–327. doi: 10.1111/j.1460-9568.2008.06577.x
PubMed Abstract | Full Text | CrossRef Full Text | Google Scholar
Haley, J. E., Schaible, E., Pavlidis, P., Murdock, A., and Madison, D. V. (1996). Basal and apical synapses of CA1 pyramidal cells employ different LTP induction mechanisms. Learn. Mem. 3, 289–295. doi: 10.1101/lm.3.4.289
PubMed Abstract | Full Text | CrossRef Full Text | Google Scholar
Hines, M. L. and Carnevale, N. T. (1997). The NEURON simulation environment. Neural. Comput. 9, 1179–1209. doi: 10.1162/neco.1997.9.6.1179
Hirono, M., Yoshioka, T., and Konishi, S. (2001). GABAB receptor activation enhances mGluR-mediated responses at cerebellar excitatory synapses. Nat. Neurosci. 4, 1207–1216. doi: 10.1038/nn764
PubMed Abstract | Full Text | CrossRef Full Text | Google Scholar
Isaacson, J. S., and Nicoll, R. A. (1993). The uptake inhibitor L-trans-PDC enhances responses to glutamate but fails to alter the kinetics of excitatory synaptic currents in the hippocampus. J. Neurophysiol. 70, 2187–2191.
Kohl, M. M., and Paulsen, O. (2010). The roles of GABAB receptors in cortical network activity. Adv. pharmacol. 58, 205–229. doi: 10.1016/S1054-3589(10)58009-8
Kulik, Á., Vida, I., Fukazawa, Y., Guetg, N., Kasugai, Y., Marker, C. L.,et al. (2006). Compartment-dependent colocalization of Kir3.2-containing K+ channels and GABAB receptors in hippocampal pyramidal cells. J. Neurosci. 26, 4289–4297. doi: 10.1523/JNEUROSCI.4178-05.2006
PubMed Abstract | Full Text | CrossRef Full Text | Google Scholar
Kulik,Á., Vida, I., Luján, R., Haas, C. A., López-Bendito, G., Shigemoto, R.,et al. (2003). Subcellular localization of metabotropic GABAB receptor subunits GABAB1a/b and GABAB2 in the rat hippocampus. J. Neurosci. 23, 11026–11035.
Lanthorn, T. H., and Cotman, C. W. (1981). Baclofen selectively inhibits excitatory synaptic transmission in the hippocampus. Brain Res. 225, 171–178. doi: 10.1016/0006-8993(81)90326-7
Larkum, M. (2013). A cellular mechanism for cortical associations: an organizing principle for the cerebral cortex. Trends Neurosci. 36, 141–151. doi: 10.1016/j.tins.2012.11.006
PubMed Abstract | Full Text | CrossRef Full Text | Google Scholar
Longair, M. H., Baker, D. A., and Armstrong, J. D. (2011). Simple Neurite Tracer: open source software for reconstruction, visualization and analysis of neuronal processes. Bioinformatics 27, 2453–2454. doi: 10.1093/bioinformatics/btr390
PubMed Abstract | Full Text | CrossRef Full Text | Google Scholar
Lüscher, C., Jan, L. Y., Stoffel, M., Malenka, R. C., and Nicoll, R. A. (1997). G protein-coupled inwardly rectifying K+ channels (GIRKs) mediate postsynaptic but not presynaptic transmitter actions in hippocampal neurons. Neuron 19, 687–695. doi: 10.1016/S0896-6273(00)80381-5
PubMed Abstract | Full Text | CrossRef Full Text | Google Scholar
Magee, J. C., and Johnston, D. (1997). A synaptically controlled, associative signal for Hebbian plasticity in hippocampal neurons. Science 275, 209–213. doi: 10.1126/science.275.5297.209
PubMed Abstract | Full Text | CrossRef Full Text | Google Scholar
Megías, M., Emri, Z., Freund, T. F., and Gulyás, A. I. (2001). Total number and distribution of inhibitory and excitatory synapses on hippocampal CA1 pyramidal cells. Neuroscience 102, 527–540. doi: 10.1016/S0306-4522(00)00496-6
PubMed Abstract | Full Text | CrossRef Full Text | Google Scholar
Mott, D. D., Bragdon, A. C., Lewis, D. V., and Wilson, W. A. (1989). Baclofen has a proepileptic effect in the rat dentate gyrus. J. Pharmacol. Exp. Ther. 249, 721–725.
Mott, D. D., Lewis, D. V., Ferrari, C. M., Wilson, W. A., and Swartzwelder, H. S. (1990). Baclofen facilitates the development of long-term potentiation in the rat dentate gyrus. Neurosci. Lett. 113, 222–226. doi: 10.1016/0304-3940(90)90307-U
PubMed Abstract | Full Text | CrossRef Full Text | Google Scholar
Mott, D. D., Li, Q., Okazaki, M. M., Turner, D. A., and Lewis, D. V. (1999). GABAB-Receptor-mediated currents in interneurons of the dentate-hilus border. J. Neurophysiol. 82, 1438–1450.
Nehring, R. B., Horikawa, H. P. M., El Far, O., Kneussel, M., Brandstätter, J. H., Stamm, S.,et al. (2000). The metabotropic GABAB receptor directly interacts with the activating transcription factor 4. J. Biol. Chem. 275, 35185–35191. doi: 10.1074/jbc.M002727200
PubMed Abstract | Full Text | CrossRef Full Text | Google Scholar
Newberry, N. R., and Nicoll, R. A. (1985). Comparison of the action of baclofen with gamma-aminobutyric acid on rat hippocampal pyramidal cells in vitro. J. Physiol. 360, 161–185. doi: 10.1113/jphysiol.1985.sp015610
Olah, S., Fule, M., Komlosi, G., Varga, C., Baldi, R., Barzo, P.,et al. (2009). Regulation of cortical microcircuits by unitary GABA-mediated volume transmission. Nature 461, 1278–1281. doi: 10.1038/nature08503
PubMed Abstract | Full Text | CrossRef Full Text | Google Scholar
Otis, T. S., De Koninck, Y., and Mody, I. (1993). Characterization of synaptically elicited GABAB responses using patch-clamp recordings in rat hippocampal slices. J. Physiol. 463, 391–407. doi: 10.1113/jphysiol.1993.sp019600
Otis, T. S., and Mody, I. (1992). Differential activation of GABAA and GABAB receptors by spontaneously released transmitter. J. Neurophysiol. 67, 227–235.
Palmer, L. M., Schulz, J. M., Murphy, S. C., Ledergerber, D., Murayama, M., and Larkum, M. E. (2012). The cellular basis of GABAB-mediated interhemispheric inhibition. Science 335, 989–993. doi: 10.1126/science.1217276
PubMed Abstract | Full Text | CrossRef Full Text | Google Scholar
Pérez-Garci, E., Larkum, M. E. and Nevian, T. (2013). Inhibition of dendritic Ca2+ spikes by GABAB receptors in cortical pyramidal neurons is mediated by a direct Gi/o-βγ-subunit interaction with Cav1 channels. J. Physiol. 591, 1599–1612. doi: 10.1113/jphysiol.2012.245464
PubMed Abstract | Full Text | CrossRef Full Text | Google Scholar
Pham, T. M., Nurse, S., and Lacaille, J.-C. (1998). Distinct GABAB actions via synaptic and extrasynaptic receptors in rat hippocampus in vitro. J. Neurophysiol. 80, 297–308.
Ponce, A., Bueno, E., Kentros, C., Vega-Saenz de Miera, E., Chow, A., Hillman, D.,et al. (1996). G-protein-gated inward rectifier K+ channel proteins (GIRK1) are present in the soma and dendrites as well as in nerve terminals of specific neurons in the brain. J. Neurosci. 16, 1990–2001.
Price, C. J., Cauli, B., Kovacs, E. R., Kulik, A., Lambolez, B., Shigemoto, R.,et al. (2005). Neurogliaform Neurons Form a Novel Inhibitory Network in the Hippocampal CA1 Area. J. Neurosci. 25, 6775–6786. doi: 10.1523/JNEUROSCI.1135-05.2005
PubMed Abstract | Full Text | CrossRef Full Text | Google Scholar
Price, C. J., Scott, R., Rusakov, D. A., and Capogna, M. (2008). GABAB receptor modulation of feedforward inhibition through hippocampal neurogliaform cells. J. Neurosci. 28, 6974–6982. doi: 10.1523/JNEUROSCI.4673-07.2008
PubMed Abstract | Full Text | CrossRef Full Text | Google Scholar
Rial Verde, E., Zayat, L., Etchenique, R., and Yuste, R. (2008). Photorelease of GABA with visible light using an inorganic caging group. Front. Neural Circuits 2:2. doi: 10.3389/neuro.04.002.2008
PubMed Abstract | Full Text | CrossRef Full Text | Google Scholar
Scanziani, M. (2000). GABA spillover activates postsynaptic GABAB receptors to control rhythmic hippocampal activity. Neuron 25, 673–681. doi: 10.1016/S0896-6273(00)81069-7
Schmidt-Hieber, C., Jonas, P., and Bischofberger, J. (2007). Subthreshold dendritic signal processing and coincidence detection in dentate gyrus granule cells. J. Neurosci. 27, 8430–8441. doi: 10.1523/JNEUROSCI.1787-07.2007
PubMed Abstract | Full Text | CrossRef Full Text | Google Scholar
Sloviter, R. S., Ali-Akbarian, L., Elliott, R. C., Bowery, B. J., and Bowery, N. G. (1999). Localization of GABAB (R1) receptors in the rat hippocampus by immunocytochemistry and high resolution autoradiography, with specific reference to its localization in identified hippocampal interneuron subpopulations. Neuropharmacology 38, 1707–1721. doi: 10.1016/S0028-3908(99)00132-X
Sodickson, D. L., and Bean, B. P. (1996). GABAB receptor-activated inwardly rectifying potassium current in dissociated hippocampal CA3 neurons. J. Neurosci. 16, 6374–6385.
Solís, J. M., and Nicoll, R. A. (1992). Pharmacological characterization of GABAB-mediated responses in the CA1 region of the rat hippocampal slice. J. Neurosci. 12, 3466–3472.
Spruston, N., Jaffe, D. B., Williams, S. H., and Johnston, D. (1993). Voltage- and space-clamp errors associated with the measurement of electrotonically remote synaptic events. J. Neurophysiol. 70, 781–802.
Stuart, G., and Spruston, N. (1998). Determinants of voltage attenuation in neocortical pyramidal neuron dendrites. J. Neurosci. 18, 3501–3510.
Szilágyi, T., and De Schutter, E. (2004). Effects of variability in anatomical reconstruction techniques on models of synaptic integration by dendrites: a comparison of three Internet archives. Eur. J. Neurosci. 19, 1257–1266. doi: 10.1111/j.1460-9568.2004.03222.x
PubMed Abstract | Full Text | CrossRef Full Text | Google Scholar
Takigawa, T., and Alzheimer, C. (1999). G protein-activated inwardly rectifying K+ (GIRK) currents in dendrites of rat neocortical pyramidal cells. J. Physiol. 517, 385–390. doi: 10.1111/j.1469-7793.1999.0385t.x
PubMed Abstract | Full Text | CrossRef Full Text | Google Scholar
Tanaka, J., Matsuzaki, M., Tarusawa, E., Momiyama, A., Molnar, E., Kasai, H.,et al. (2005). Number and density of AMPA receptors in single synapses in immature cerebellum. J. Neurosci. 25, 799–807. doi: 10.1523/JNEUROSCI.4256-04.2005
PubMed Abstract | Full Text | CrossRef Full Text | Google Scholar
Tao, W., Higgs, M. H., Spain, W. J., and Ransom, C. B. (2013). Postsynaptic GABAB receptors enhance extrasynaptic GABAA receptor function in dentate gyrus granule cells. J. Neurosci. 33, 3738–3743. doi: 10.1523/JNEUROSCI.4829-12.2013
PubMed Abstract | Full Text | CrossRef Full Text | Google Scholar
Uematsu, M., Hirai, Y., Karube, F., Ebihara, S., Kato, M., Abe, K.,et al. (2008). Quantitative chemical composition of cortical GABAergic neurons revealed in transgenic venus-expressing rats. Cereb. Cortex 18, 315–330. doi: doi: 10.1093/cercor/bhm056
PubMed Abstract | Full Text | CrossRef Full Text | Google Scholar
White, J. H., McIllhinney, R. A. J., Wise, A., Ciruela, F., Chan, W.-Y., Emson, P. C.,et al. (2000). The GABAB receptor interacts directly with the related transcription factors CREB2 and ATFx. Proc. Natl. Acad. Sci. U.S.A. 97, 13967–13972. doi: 10.1073/pnas.240452197
PubMed Abstract | Full Text | CrossRef Full Text | Google Scholar
Williams, S., and Lacaille, J.-C. (1992). GABAB receptor-mediated inhibitory postsynaptic potentials evoked by electrical stimulation and by glutamate stimulation of interneurons in Stratum lacunosum-moleculare in hippocampal CA1 pyramidal cells in vitro. Synapse 11, 249–258. doi: 10.1002/syn.890110309
PubMed Abstract | Full Text | CrossRef Full Text | Google Scholar
Keywords: GABAB-receptor, Kir3-channel, inhibition, hippocampus, principal cells, dendrites
Citation: Degro CE, Kulik A, Booker SA and Vida I (2015) Compartmental distribution of GABAB receptor-mediated currents along the somatodendritic axis of hippocampal principal cells. Front. Synaptic Neurosci. 7:6. doi: 10.3389/fnsyn.2015.00006
Received: 01 September 2014; Accepted: 15 February 2015;
Published online: 23 March 2015.
Edited by:
Lisa Topolnik, Laval University, CanadaReviewed by:
Adolfo E. Talpalar, Karolinska Institutet, SwedenSaobo Lei, University of North Dakota, USA
Copyright © 2015 Degro, Kulik, Booker and Vida. This is an open-access article distributed under the terms of the Creative Commons Attribution License (CC BY). The use, distribution or reproduction in other forums is permitted, provided the original author(s) or licensor are credited and that the original publication in this journal is cited, in accordance with accepted academic practice. No use, distribution or reproduction is permitted which does not comply with these terms.
*Correspondence: Imre Vida, Institute for Integrative Neuroanatomy, NeuroCure Cluster of Excellence, Charité – Universitätsmedizin Berlin, Chariteplatz 1, D-10117 Berlin, Germany e-mail: imre.vida@charite.de; Sam A. Booker, Center for Integrative Physiology, University of Edinburgh, Hugh Robson Building, George Square, EH8 9XE, Edinburgh, UK e-mail: sbooker@staffmail.ed.ac.uk;
†Present address: Sam A. Booker, Center for Integrative Physiology, University of Edinburgh, Hugh Robson Building, George Square, EH8 9XE, Edinburgh, UK