Correspondence between structure and function in the human brain at rest
- 1 Mind Research Network, Albuquerque, NM, USA
- 2 Department of Family and Community Medicine, University of New Mexico, Albuquerque, NM, USA
- 3 Department of Neurosurgery, University of New Mexico, Albuquerque, NM, USA
- 4 Department of Electrical and Computer Engineering, University of New Mexico, Albuquerque, NM, USA
To further understanding of basic and complex cognitive functions, previous connectome research has identified functional and structural connections of the human brain. Functional connectivity is often measured by using resting-state functional magnetic resonance imaging (rs-fMRI) and is generally interpreted as an indirect measure of neuronal activity. Gray matter (GM) primarily consists of neuronal and glia cell bodies; therefore, it is surprising that the majority of connectome research has excluded GM measures. Therefore, we propose that by exploring where GM corresponds to function would aid in the understanding of both structural and functional connectivity and in turn the human connectome. A cohort of 603 healthy participants underwent structural and functional scanning on the same 3 T scanner at the Mind Research Network. To investigate the spatial correspondence between structure and function, spatial independent component analysis (ICA) was applied separately to both GM density (GMD) maps and to rs-fMRI data. ICA of GM delineates structural components based on the covariation of GMD regions among subjects. For the rs-fMRI data, ICA identified spatial patterns with common temporal features. These decomposed structural and functional components were then compared by spatial correlation. Basal ganglia components exhibited the highest structural to resting-state functional spatial correlation (r = 0.59). Cortical components generally show correspondence between a single structural component and several resting-state functional components. We also studied relationships between the weights of different structural components and identified the precuneus as a hub in GMD structural network correlations. In addition, we analyzed relationships between component weights, age, and gender; concluding that age has a significant effect on structural components.
Introduction
A central assumption of systems neuroscience is that the structure of the brain can predict and/or is related to functional connectivity. This belief is derived from basic human anatomy and biomechanics where the structure and form of body parts are directly related to their function. The structure–function relationship is found at different scales in nature, from the molecular composition of enzymes, the morphology of organometallics, to the collective behavior of ant colonies. For the past 20 years, the field of neuroimaging has demonstrated that function and behavior arise from specific regions in the brain. Structural adaptations in the cortex have been found in plasticity studies. For example, people who recently acquired the ability to juggle exhibit changes in gray matter (GM) volumes of the mid-temporal area (MT/V5) and intraparietal sulcus (Draganski et al., 2004), in professional female ballet dancers there are distinct differences in white and gray matter compared to controls (Hanggi et al., 2010), and in musicians, greater cortical thickness is found in superior temporal and dorsolateral frontal regions as well, as increased GM concentration (GMC) in aspects of the Heschl’s gyrus (Bermudez et al., 2009) when compared to non-musicians. These structural alterations reflect subjects’ specialized, and, in some cases, exceptional, functional abilities. However, recent developments in neuroimaging have shifted the structural–functional relationship away from distinct brain regions and toward distributed function, with the view that cognition is the result of the “dynamic interactions of distributed brain areas operating in a large-scale network” (Bressler and Menon, 2010). The concept that the human brain is a complex network of neurons linking physical structure to function (Power et al., 2010) is not new to cognitive science.
In his seminal paper, Sporns coined the term the human connectome, which is, “a comprehensive structural description of the network of elements and connections forming the human brain (Sporns et al., 2005).” Theoretically, by mapping the networks of the human brain, we will strengthen our understanding of how functional brain activity emerges from anatomical structure. This knowledge will provide a more comprehensive model of cognition and produce new insights into how brain functions are affected if there are structural irregularities (Hagmann et al., 2010). Multiple studies of schizophrenia have already identified both structural network abnormalities (Bassett et al., 2008) and functional network connectivity differences (Lynall et al., 2010) when compared to health controls. The majority of current brain network studies tend to focus on one connectome modality, either structural or functional.
A large-scale functional network is defined as a “collection of interconnected brain areas that interact to perform circumscribed functions (Bressler and Menon, 2010).” Functional networks can be identified using electroencephalography (EEG), magnetoencephalography (MEG), and functional magnetic resonance imaging (fMRI). Recent functional network studies have used resting-state fMRI (rs-fMRI), which measures spontaneous, high-amplitude, (mostly) low-frequency (<0.1 Hz) blood-oxygen-level-dependent (BOLD) signal fluctuations in subjects who are at rest. Several different analysis approaches, including seed-based correlation maps (Biswal et al., 1995; Fox et al., 2005) and independent component analysis (ICA; Damoiseaux et al., 2006; Biswal et al., 2010; Allen et al., 2011) have identified from rs-fMRI a large number of functional networks. These networks appear to provide robust measures of the intrinsic functional activity of the brain (Miller et al., 2009) and have been identified both in resting data and data collected during a task (Calhoun et al., 2008). Because these intrinsic networks (INs) exhibit moderately high reliability (Shehzad et al., 2009; Zuo et al.,2010a), interrater and intermethod reliability (Franco et al., 2009; Zuo et al., 2010b), and consistency (Damoiseaux et al., 2006), they provide a framework for studying the functional architecture of the human connectome (Biswal et al., 2010; Allen et al., 2011) and are a key focus of this study.
Structural networks of the human brain have typically been constructed directly using various white matter (WM) connectivity measurements obtained from diffusion weighted imaging (DWI; Bassett and Bullmore, 2009) and constructed using graph theoretical techniques. Indeed, in much of the literature structural connectivity is obtained from diffusion imaging (Honey et al., 2010). DWI can quantify and identify structural connectivity by tracking WM bundle pathways that link to cortical regions (Guye et al., 2008). Structural networks have also been inferred indirectly from the inter-regional covariation of GM volume or cortical thickness and usually measured at the group level (Sporns, 2011). Using covariance measures for specific ROIs, Mechelli et al. (2005a) reported that the “gray matter densities (GMD) of different regions of the human cortex is coordinated within an individual.” Inter-regional covariation of GM volume has also shown differences in network organization between healthy participants and those with schizophrenia (Bassett and Bullmore, 2009). Other studies have examined cortical thickness to construct GM structural networks, for example He et al. (2007) used the inter-regional correlation of cortical thickness measurements to construct structural networks. Additionally, modularity analysis of the relationships between structural cortical networks identified modules similar to known functional domains, such as sensorimotor, visual, auditory/language, strategic/executive, and mnemonic processing (Chen et al., 2008).
These prior studies highlight efforts to separately explore the connections in structural networks or in functional networks. The majority of studies that incorporate both structural and functional imaging to investigate the human brain connectome tend to use rs-fMRI and WM analysis. Several papers have recently reviewed these studies (Rykhlevskaia et al., 2008; Bassett and Bullmore, 2009; Damoiseaux and Greicius, 2009; Honey et al., 2010; Sporns, 2011) and in general, concluded that when structural connectivity is high, functional connectivity tends to be high as well (Koch et al., 2002).
When comparing the relationship between anatomic structure and functional connectivity only a few studies have used GM (Calhoun et al., 2006; Seeley et al., 2009; Michael et al., 2010; Supekar et al., 2010). This is somewhat surprising considering that fMRI is generally interpreted as an indirect measure of neuronal activity and GM primarily consists of neuronal and glia cell bodies (Logothetis, 2002). We propose that exploring where GM corresponds to function would aid in the understanding of both structural and functional connectivity and in turn the human connectome. We will not discuss the current debate about the exact origins of the BOLD response measured through fMRI; however, the relationship between the BOLD signal and the underlying neuronal activation is an area of active debate and should be interpreted carefully when making direct inferences between neuronal activity (Ekstrom, 2010).
This study has three primary aims, centered on the use of GM to assess structural–functional spatial relationships of the human brain. The first aim is to identify GM structural components using GMD measurements and its variation among a large cohort of healthy individuals (n = 603). This will be ascertained with source-based morphometry (SBM; Xu et al., 2009), which applies spatial ICA to find patterns of GMD with common covariation among subjects. In this paper, the term structural components will refer to the components revealed by SBM. Association between age, gender, and the structural components sources will be further assessed. We expect to see a general reduction in GMD as age increases, particularly in regions, such as the parietal and frontal cortex, where reductions in GMD with age have been reported to previously (Sowell et al., 2003).
The second aim is to compare structural components with previously determined rs-functional components and determine their spatial similarity. This will be done by spatially correlating structural components from the SBM analysis with functional components from a group ICA (GICA) of rs-fMRI previously reported by Allen et al. (2011). Both of the structural and functional components were obtained from the same set of subjects. Our hypothesis is that there will be correspondence between structural and functional components, particularly in the precuneus and posterior cingulate cortex (PCC) regions of the default mode network (DMN) given that the linkage between structure and function is particularly strong in these regions (Hagmann et al., 2008; Skudlarski et al., 2008; Honey et al., 2009; van den Heuvel et al., 2009). We also assume that there will not be a complete direct correspondence between structure and function; consequently, we expect to find fewer structural components than functional networks. This is because the presence of functional connectivity has been observed when there are no supportive structural connections, at least as reflected in DTI (Greicius et al., 2009).
The third and final aim is an exploratory investigation of the relationships between the different structural components and for the purpose of this paper, is referred to as structural network correlations (SNC). Specifically, SNC will be performed by investigating the correlations among the structural component loading parameters. Networks and components are often used interchangeably in the literature, although the definitions of networks and components are not always consistent. Therefore, Erhardt et al. (2011) suggested to always define the term network when it is used. Consequently, our usage of networks (SNC) and components are defined in the Section “Materials and Methods.”
Our results, using a novel approach that utilizes regions of covariation, generally show correspondence between structure and function and further elucidate the relationship between function at rest and GM. Additionally, our results corroborate with previous findings on the effects of age on GMD. Lastly, from our findings we suggest structural and functional regions that warrant further investigations.
Materials and Methods
Full details on participants, data collection, and image processing can be found in Allen et al. (2011). For completeness, we briefly provide pertinent information here.
Participants
This analysis combined existing data from 603 healthy participants scanned on the same scanner and spread across 34 studies and 18 principal investigators at the Mind Research Network (MRN). Informed consent was obtained from all subjects according to institutional guidelines at the University of New Mexico (UNM) and all data were anonymized prior to group analysis. The cohort is nearly balanced on gender (305 females) with similar age distributions across genders. Because the sample is overwhelmingly right-handed (46 ambidextrous or left-handed individuals), handedness will not be considered in this study. The age range is 12-71 with a strong right skew (mean = 23.4; SD = 9.2), thus as in Allen et al. (2011) we use the normalizing transformation, log (age), to reduce the leverage of older subjects in correlation and regression analyses.
Data Collection
All MR images were collected on a 3-Tesla Siemens Trio scanner. High-resolution T1-weighted structural images were acquired with a 5-echo multi-echo MPRAGE sequence with TE = 1.64, 3.5, 5.36, 7.22, and 9.08 ms, TR = 2.53 s, TI = 1.2 s, flip angle = 7°, number of excitations = 1, slice thickness = 1 mm, field of view = 256 mm, resolution = 256 × 256. T2*-weighted functional images were acquired using a gradient-echo EPI sequence with TE = 29 ms, TR = 2 s, flip angle = 75°, slice thickness = 3.5 mm, slice gap = 1.05 mm, field of view 240 mm, matrix size = 64 × 64, voxel size = 3.75 mm × 3.75 mm × 4.55 mm. Resting-state scans were a minimum of 5 min, 4 s in duration (truncated to 152 volumes for all subjects). Participants were instructed to keep their eyes open during the scan and stare passively at a presented fixation cross.
Image Preprocessing
The structural data the T1 images were preprocessed through an automated pipeline developed at MRN (Bockholt et al., 2010). First the images were resliced to 2 mm × 2 mm × 2 mm voxels. Tissue classification, bias correction, image registration, and spatial normalization were automatically performed using voxel-based morphometry (VBM) in SPM51, wherein the above steps are integrated into a unified model (Ashburner and Friston, 2005). Unmodulated GM segmentations, which produce an estimation of local GMD, were smoothed using a Gaussian kernel with a full-width at half-maximum (FWHM) of 10 mm (Figure 1; step 1, left side). The smoothed GMD images were then correlated to an a priori GM template to access segmentation outliers. Those GMD images that were not highly correlated to the Montreal Neurological Institute (MNI) template in SPM5 where manually adjusted to the AC–PC line and rerun through our automated pipeline, where they were segmented and smoothed again. GMD is the probability distribution of the GM proportion of a voxel and the term is synonymous with GMC, whereby concentration and density are used interchangeably in neuroimaging literature. The relative density or concentration of GM, from non-modulated VBM, is the proportion of GM relative to other tissue types (WM, cerebrospinal fluid) within a region (Mechelli et al., 2005b). As a caveat, GMD is sensitive in detecting some local GM structural properties, but lacks some specificity for particular structural properties.
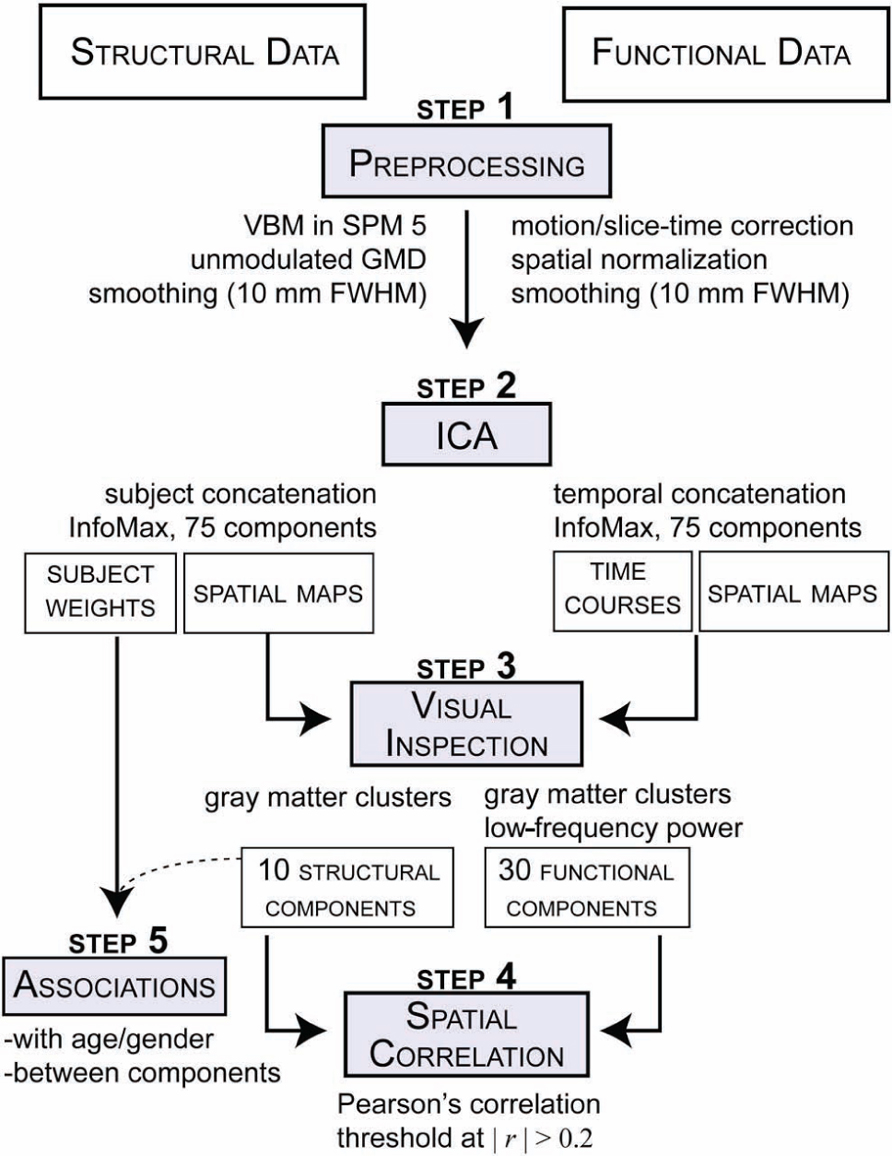
FIGURE 1. Schematic of preprocessing and analyses for both structural GMD images and rs-functional images.
The fMRI data underwent typical preprocessing of realignment, slice-timing correction, spatial normalization to a template in standard MNI space, reslicing (3 mm × 3 mm × 3 mm voxels) and spatial smoothing (FWHM = 10 mm; Figure 1; step 1, right side). The spatial maps were evaluated for outliers and if possible were corrected using the same realignment procedure that was used for the GM segmentations. Subsequent to automated preprocessing, the data were intensity normalized to improve the accuracy and test–retest reliability of the ICA output.
Source-Based Morphometry
Source-based morphometry is a multivariate analysis, similar to VBM, used to examine the relationships between GMD regions (see Xu et al., 2009 for further details). GMD images from each subject were flattened into row vectors and stacked to form the subjects-by-voxel matrix upon which spatial ICA was applied (Calhoun et al., 2001). ICA linearly decomposed the GMD matrix into a mixing matrix (subjects-by-components) that represents the relative strength (weight) of components for each subject and the source matrix (voxels-by-components) that represents the maximally spatially independent GMD sources. ICA was performed with the GIFT toolbox2 using the infomax algorithm (Figure 1; step 2, left side). We evaluated GM maps decomposed at several different model orders (number of components). The model orders investigated were 20, 40, 60, 75, 80, and 100. We found similar components at the different model orders and ultimately used the high model order of 75 components to match the number of components used in the rs-fMRI analysis, as discussed in the next section. Briefly, model orders 60 and 80 yielded comparable components as the model order of 75, which was validated by correlational analyses and visual inspection. For the purpose of this paper, sources of GM covariation obtained from this the SBM analysis will be referred to in this paper as structural components.
Group Independent Component Analysis of fMRI Data
Resting-state data were decomposed into components using spatial ICA to identify temporally coherent networks and their associated time courses by estimating maximally independent spatial sources from their linearly mixed fMRI signals. For this study, spatial sources obtained from the resting-state data will be referred to as rs-functional components. GICA was also performed using the GIFT toolbox with a model order ICA of 75 components (Figure 1; step 2, right side). This model order has been noted in the literature to yield refined components that correspond to known anatomical and functional segmentations (Kiviniemi et al., 2009; Smith et al., 2009; Abou-Elseoud et al., 2010; Ystad et al., 2010). See Allen et al. (2011) for a complete treatment of the GICA implementation. For the purpose of this study the functional components were resliced to 2 × 2 × 2 to match the dimensions of the structural components.
Feature Identification
All 75 structural components were visually inspected by three reviewers and the GM composition of each component was evaluated (Figure 1; step 3, left side). We excluded structural components that had significant spatial overlap with ventricles, WM, large vasculature, and the brainstem, or were located at the boundaries between these regions and GM. These criteria were designed to exclude any component that were of possible mixed tissue sources, such that structural components for subsequent analysis only included GM. Of the 10 structural components that met the inclusion criteria, eight comparable components were identified in each of the model orders mentioned previously. The two remaining components were only not observed in the lower model orders of 20 and 40, but were found in the other model orders. For the rs-functional components, we followed guidelines similar to those used by Allen et al. (2011) to select a subset of functional components; however, we were slightly less stringent and included two additional subcortical and cerebellar components that were excluded from prior analyses (for further details on rs-functional component selection, please see Allen et al., 2011).
Statistical Analysis
To assess spatial correspondence between structural and rs-functional components, we calculated all pair-wise Pearson correlations between the selected structural and functional component spatial maps, yielding a n-by-m correlation matrix, where n is the number of selected structural components and m is the number of selected rs-functional components (Figure 1; step 4).
Structural component loading parameters, representing the contribution of each component to a given subject, were also used in additional association analyses (Figure 1; step 5). Pearson correlations were computed between the structural loading parameters and the log-transformed (age). Finally, all pair-wise correlations between the structural loading parameters of the selected structural components were computed (SNC). Here, we also used partial correlations to remove the possible effect of age on between-component associations.
Results
Structural–Functional Component Correlations
Of 75 structural components, n = 10 met the inclusion criteria; for rs-functional components, m = 30 were selected for analysis. Out of the 10-by-30 structural and rs-functional component comparisons, 24 structural–functional component pairs were above the determined correlation coefficient threshold of |r| > 0.20. Note that this threshold also conservatively represents a significance level of p < 0.005, corrected. Accounting for spatial smoothness in the spatial maps and assuming, as in Smith et al. (2009), roughly 500 degrees of freedom, a correlation of r = 0.2 has a p-value of 6 × 10⁻⁶ , which when Bonferroni correcting for 300 tests is 0.002. The 24 structural-functional component pairs are presented in order of decreasing correlation coefficient magnitude and divided into groups with similar spatial topography (see Figures 2–4).
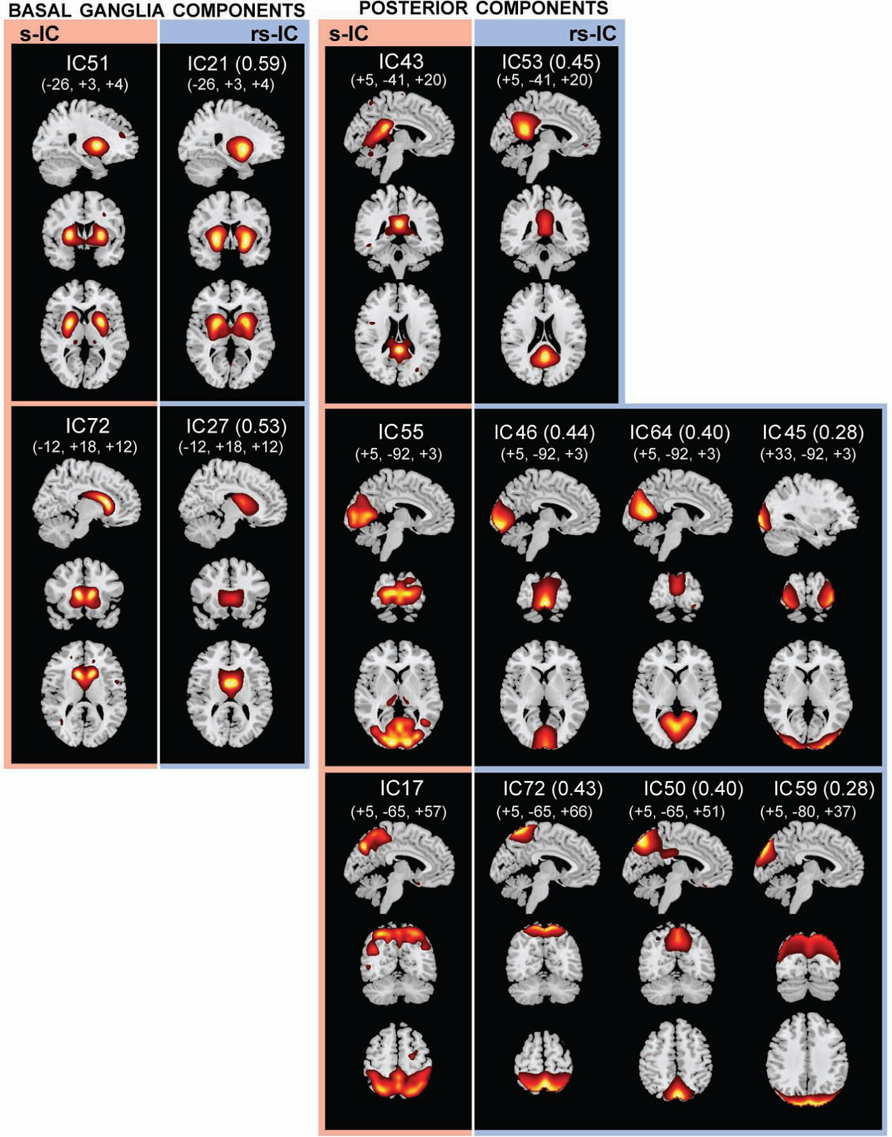
FIGURE 2. The structural (sMRI) components (red) and corresponding rs-fMRI components (blue). The spatial correlation between component pairs is indicated adjacent to the functional component number. Both sMRI and fMRI aggregate components were converted to z-scores and thresholded at Z > 2. Structural components are displayed at the slices with peak activation, indicated as (x, y, z) coordinates in MNI space. When structural components are paired with a single functional component, the functional component is displayed at the same slices. If a structural component corresponds to several fMRI components, functional components may be displayed at different coordinates that best represent their activation.
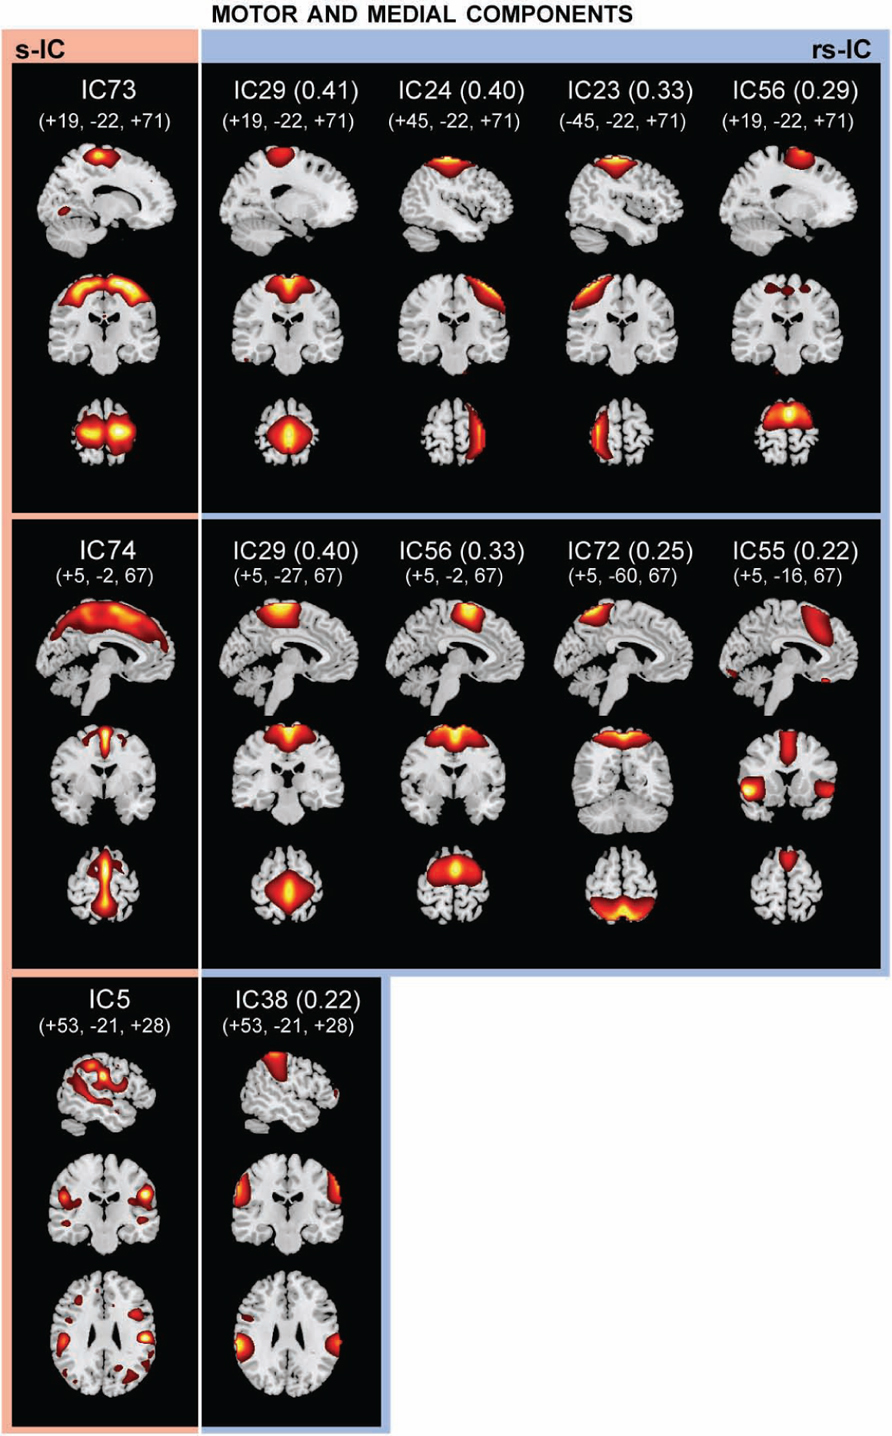
FIGURE 3. The structural (sMRI) components (red) and corresponding rs-fMRI components (blue). The spatial correlation between component pairs is indicated adjacent to the functional component number. Both sMRI and fMRI aggregate components were converted to z-scores and thresholded at Z > 2. Structural components are displayed at the slices with peak activation, indicated as (x, y, z) coordinates in MNI space. When structural components are paired with a single functional component, the functional component is displayed at the same slices. If a structural component corresponds to several fMRI components, functional components may be displayed at different coordinates that best represent their activation.
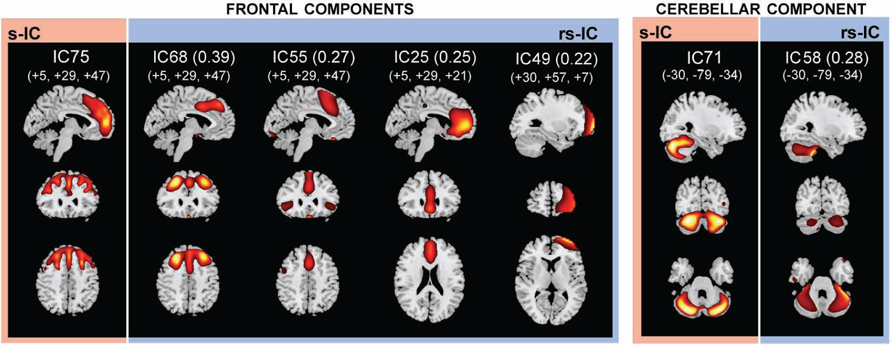
FIGURE 4. The structural (sMRI) components (red) and corresponding rs-fMRI components (blue). The spatial correlation between component pairs is indicated adjacent to the functional component number. Both sMRI and fMRI aggregate components were converted to z-scores and thresholded at Z > 2. Structural components are displayed at the slices with peak activation, indicated as (x, y, z) coordinates in MNI space. When structural components are paired with a single functional component, the functional component is displayed at the same slices. If a structural component corresponds to several fMRI components, functional components may be displayed at different coordinates that best represent their activation.
Basal Ganglia Components
Subcortical structures comprising the basal ganglia had the highest structural-rs-functional component correlations (0.59 and 053). Structural components, s-IC51 and s-IC72, were respectively comprised of the bilateral putamen and the bilateral caudate. They corresponded to rs-functional components, rs-IC21 and rs-IC27, which were primarily composed of the left and right putamen and the bilateral caudate, respectively (see Figure 2; Table 1 ). In both the structural and rs-functional components, there was only one component meeting the correlation threshold for each of these respective structures, i.e., the pairings were distinct and unique.
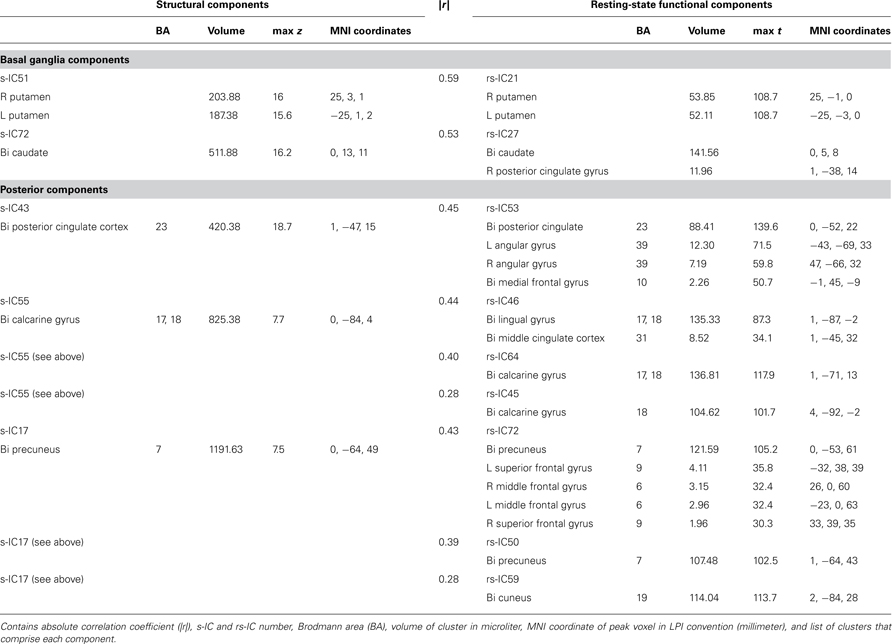
Table 1. Structural and corresponding rs-functional components representing basal ganglia and posterior components.
Posterior Components
Posterior components showed the second highest set of correlations (see Figure 2; Table 1 ). Component s-IC43, primarily comprised of the PCC, is correlated to rs-IC53, which is comprised of the PCC, the L/R angular gyri and the medial frontal gyrus (MFG). Component s-IC55, which contains voxels spanning much of the occipital cortex, is correlated to three rs-functional components. In order of correlation magnitude they are rs-IC46, rs-IC64, and rs-IC45, which represent aspects of the medial and lateral visual cortex. Component s-IC17, which peaks at the precuneus and extends laterally, is also correlated to three rs-functional components. In order of correlation magnitude these are rs-IC72 and rs-IC50 which also largely cover the precuneus, and rs-IC59, which represents more posterior activation over the bilateral cuneus.
Motor and Medial Components
Notably, structural components determined to be motor and medial components are related to multiple functional components (Figure 3; Table 2). A large component, s-IC73, spanning the supplementary motor areas (SMA) and bilateral pre- and post-central gyri correlates to four rs-functional components. These are rs-IC29, with peaks at the bilateral paracentral lobule and left insula, rs-IC24 and rs-IC23, which represent lateralized aspects of the motor system, and rs-IC56, which is centered at the SMA. A second structural component, s-IC74, is also quite large and extends over much of the medial surface, particularly in the MFG. Component s-IC74 is correlated to three rs-functional components, two of which are also correlated to s-IC73 and one of which is correlated to s-IC17. In order of correlation magnitude these are rs-IC29, rs-IC56, rs-IC72, and rs-IC55, which represents the bilateral cingulate gyrus, the left and right insula, and the bilateral MFG. A third structural component, s-IC5, largely comprised of the bilateral supramarginal gyrus (SMG), is weakly correlated to rs-IC38, which represents activations over similar regions.
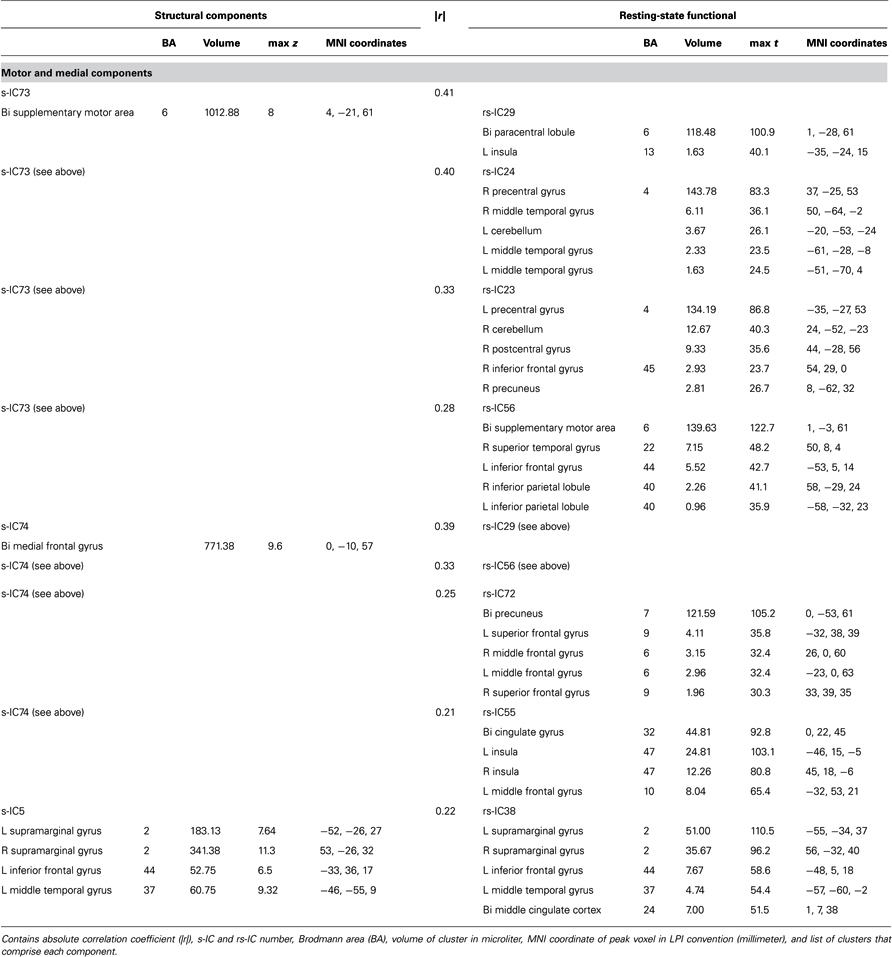
Table 2. Structural and corresponding rs-functional components representing motor and medial components.
Frontal and Cerebellar Components
The frontal component, s-IC75, which is primarily comprised of the left MFG and the right SFG is correlated to four rs-functional components. These rs-functional components in order of correlation magnitude are rs-IC68, rs-IC55, and rs-IC2, which are primarily comprised of the MFG, the cingulate gyrus, the insula, and the anterior cingulate cortex. Lastly, s-IC71 is correlated with functional component, rs-IC58. Both components largely represent cerebellar cortex (Figure 4; Table 3).
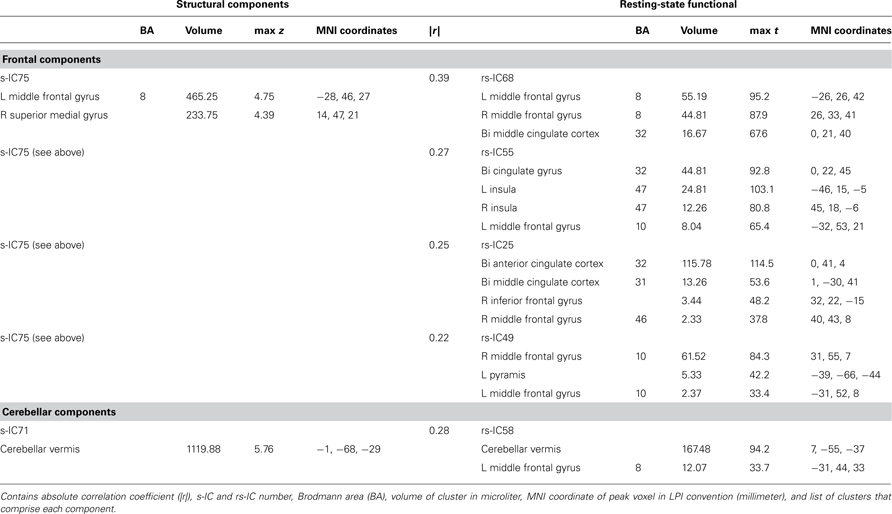
Table 3. Structural and corresponding rs-functional components representing frontal and cerebellar components.
Structural Components Age and Gender Correlations
Pearson correlations between log(age) and the structural component loading parameters are uniformly negative (Figure 5A). Figure 5B shows an example of this negative correlation, with a scatter-plot of the loading parameters for component 17 (precuneus) as a function of age for all 603 subjects. The trend predicts almost a 50% decrease in component weights from adolescence (~12 years age) to the age of retirement (~65–70 years). We found no significant correlations between gender and the structural loading parameters.
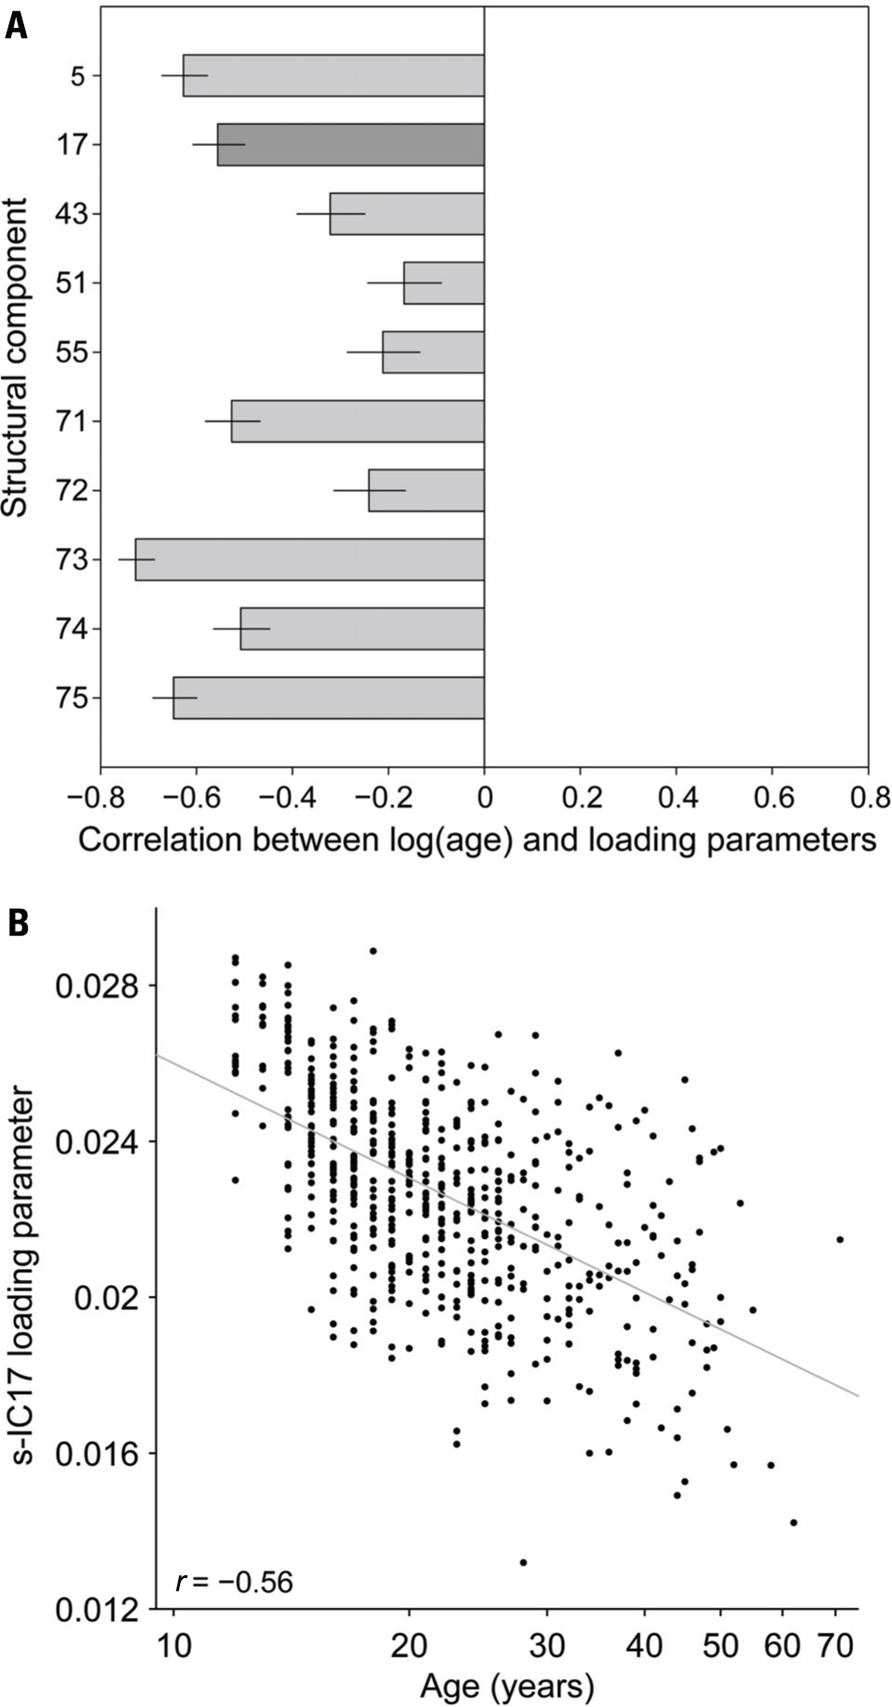
FIGURE 5. (A) Structural components correlated to the log(age) for the 10 selected s-IC. Dark gray bar corresponds to s-IC17. In general, structural components are negatively correlated with age. Ninety-five percent confidence intervals are reported. (B) Correlation of the age (years) and loading parameter for all 603 subjects using s-IC17, which is primarily comprised of the precuneus, as an example. Where r = -0.56.
Structural Network Correlations
The cross-correlation matrix between the structural loading parameters is shown in the top half of the correlation matrix in Figure 6A, wherein the majority of correlation coefficients are above values of r = 0.2. Because we found associations between age and loading parameters for all components, we also performed a correlation analysis after adjusting for age (bottom half of correlation matrix; Figure 6A). Partialling out variance due to age weakened all the correlations; however, a few structural component loading parameter pairs stayed significantly correlated after age adjustment. An example of this is in Figure 6B, which shows the relationship between loading parameters of s-IC17 and s-IC73 before (r = 0.68) and after (r = 0.48) adjusting for age. Figure 6C shows an example of the relationship between components largely due to age: the correlation between s-IC5 and s-IC73 loading parameters falls from r = 0.58 to 0.24 after adjusting for age.
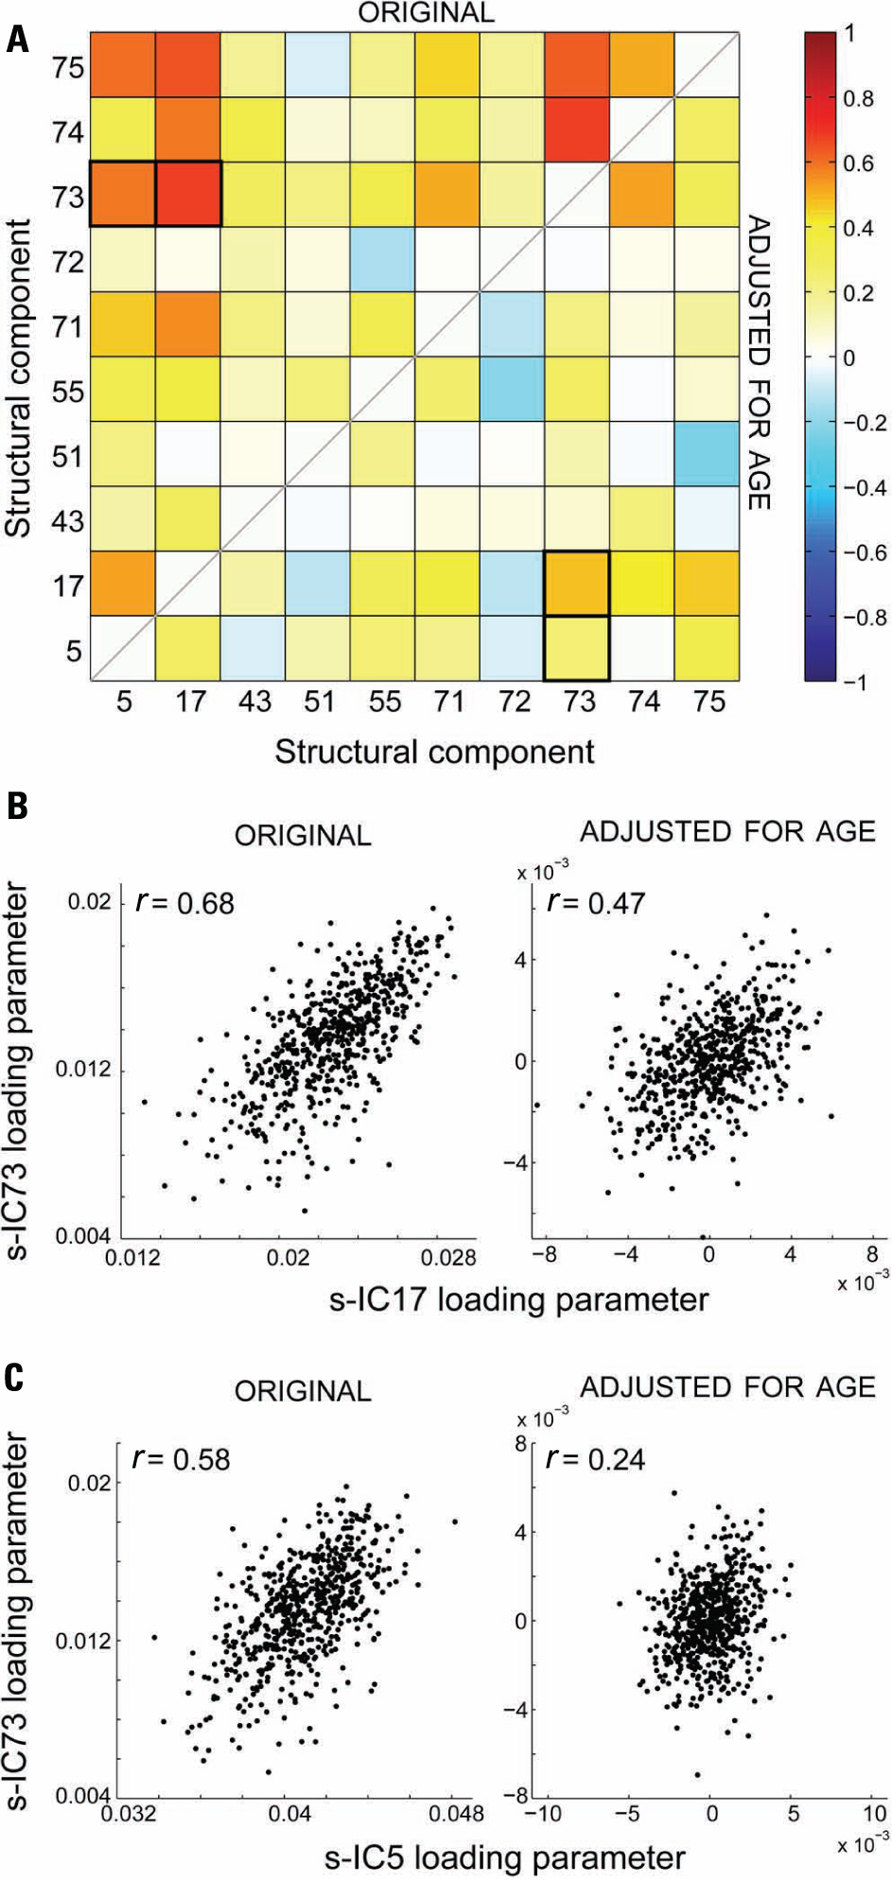
FIGURE 6. (A) Structural network correlations (SNC) of the 10 selected structural components. The top half of the matrix is without age adjustment (original) and the bottom half is after age adjustment. (B) An example of the effect of adjusting for age, where the adjustment does not remove the significant correlation between the components for s-IC73 and s-IC17. (C) An example of the effect of adjusting for age, where the adjustment does remove the significant correlation between the components for s-IC73 and s-IC5.
We can also create a graph of the correlations to elucidate the more complex relationships (beyond pair-wise) between structural components. Here, we used a conservative threshold of r > 0.4 to create a graph, as shown in Figure 7. Based on the original correlation values, this yields 13 “edges” between 6 component “nodes.” Using the age-corrected correlations, we find a graph with four “edges” between four “nodes.” In both the original and age-corrected correlations, component s-IC17 (the precuneus) is identified as a “hub,” for it was the component with the greatest number of correlations.
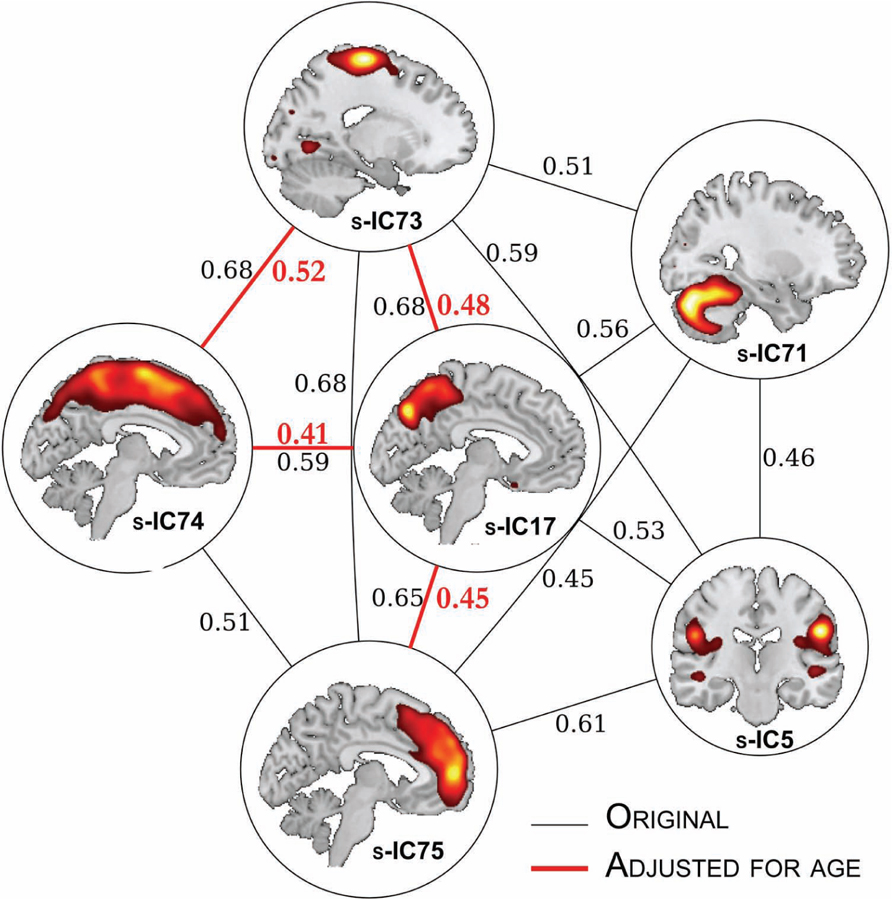
FIGURE 7. Structural network correlations. The SNC results for component pairs that are r < 0.4. The edges in red refer to components pairs that survived age adjustment. The correlation coefficient values are adjacent to the edges.
Discussion
Investigating GM structural networks is a crucial next step in mapping the correspondence between structure and function in the human brain. To our knowledge, this is the first study to link GM structure and function using spatial components, obtained from high model order spatial ICA, and from GM structural and rs-fMRI. We have also developed a framework for processing and analyzing GM structure and function in the same large cohort of healthy individuals. Our overall goal was to assess structural–functional relationships of the human brain and we found several GM structural components that spatially corresponded to rs-functional components. We used spatial component correspondence as our framework for investing how structure relates to function, but if we had a single functional parameter instead of group obtained functional components then we could have delved deeper into the covariation of structural–functional correspondence across individual subjects. An example of a single functional parameter for future investigation is the amplitude of low-frequency fluctuation (ALFF) of the rs-fMRI signal, because the literature suggests that ALFFs reflect the intensity of regional spontaneous brain activity (Yang et al., 2007). Using ALFFs, GMD, and parallel ICA (Calhoun et al., 2009) would be a good next direction for future studies.
The basal ganglia components are the most spatially correlated structural–functional components. Additionally, it is one of only a few structural components in which the component was comprised of only one source, which indicates how different the GMD is in the basal ganglia compared to other regions in the brain. As seen in Tables 1–3, the majority of the components are composed of several GM sources. This component could have also been so clearly identified because the GMD of the basal ganglia is so different compared to the surround WM. This structure– function pairing is also unique because it is one of only four pairs (out of the 24 structural–functional pairs) that has a direct one-to-one correspondence to a rs-functional component. Another structural–functional component pair where this is seen in the cerebellar component; however, the cerebellar correlation value, though significant, is the weakest of the entire structure– function analysis – nearly half the strength as in the basal ganglia components. In similar structural network studies the focus tends to be on the cortex, consequently, paying less attention to subcortical regions, such as the basal ganglia (Robinson et al., 2009; Bressler and Menon, 2010). Our finding further promotes the basal ganglia as a viable and interesting region that should be addressed in further structure–function studies.
Another directly correlated structure–functional pair is found in the components that are primarily comprised of the SMG. Results from lesion studies of aphasic stroke patients have found that the left SMG plays a role in acoustic-phonetic processing, which is an example of how structural abnormalities directly relate to functional processing (Caplan et al., 1995).
The remaining structural–functional pair with direct correspondence is found in the posterior component, specifically comprised of the PCC. This PCC is commonly seen at rest and is considered part of the DMN (Buckner et al., 2008). The DMN is a particular grouping of brain regions that are consistently found to be active during the resting-state (Raichle et al., 2001; Raichle and Snyder, 2007; Buckner et al., 2008). The precuneus, also considered part of the DMN, is seen in our structural–functional component correlations. Although, unlike the PCC, it is correlated to several functional components, which is consistent with the precuneus having many functional roles in addition to its role in the DMN. The precuneus exhibits functional connectivity in several highly integrated tasks, such as episodic memory retrieval, self-referential processing and visuo-spatial imagery (Cavanna and Trimble, 2006). The precuneus along with the PCC have also been identified as part of structural core in a graph study of diffusion imaging data (Hagmann et al., 2008). Prior structural connectivity studies have reflected the functional connectivity of the DMN (Greicius et al., 2009; Skudlarski et al., 2010) and as hypothesized, our study is another example of how structure corresponds to function in the DMN. Additionally, the DMN regions have shown a high degree of heritability (Glahn et al., 2010) and alterations in the DMN have been found in many neurological and psychiatric disorders (Garrity et al., 2007; Greicius, 2008; Paakki et al., 2010; Weng et al., 2010).
The remaining structural–functional component correlations are comprised of one structural components that corresponds to several functional components. Typically, the structural component is a broad region of GM, while the functional components are broken up into smaller and sometimes lateralized components. This type of structural–functional correspondence is found in the frontal, SMA, and visual regions. The structural components comprised of the frontal and SMA are correlated to some of the same functional components. These frontal networks are associated with strategic and executive functions (Duncan and Owen, 2000) and the SMA networks are primarily associated with sensorimotor/spatial functions. Unlike, the frontal and SMA components, the functional components comprising a visual network do not correspond to any other structural components, besides s-IC55, which is mainly composed of the calcarine gyrus.
Interestingly, we found similar spatial overlap between function and structure as Chen et al. (2008) which found that the cortex was organized into six topological modules. The lack of more direct correspondence between structure and function was not surprising to us. Recent studies have shown that structural changes in cortical thickness believed to be induced by activity are not found in the same regions where there are functional connectivity changes (Haier et al., 2009).
The field of human connectome research could benefit from examining the similarities that exist between patterns of GM covariation and functional connectivity in healthy individuals, for these patterns may be a foundation for future research on both healthy connectivity and changes associated with neurodegenerative disorders. A previous study found using GM volume measures and ICA on rs-fMRI that, “normal intrinsic connectivity and structural covariance patterns mirrored each other and reflected, with high fidelity, those regions that codegenerate in distinct human neurodegenerative syndromes (Seeley et al., 2009).” This study differed from ours in several ways, mainly that the GM regions selected were those associated with neurodegenerative syndromes. Indeed, both in Seeley et al. (2009) and in our study, GM structure is directly observed to be associated with function; however, the exact mechanism is still unclear. A study on the developing brain demonstrated that different GM structural covariance networks exist at various developmental stages and as children aged their GM covariance topology eventually resembled an adults intrinsic connectivity network (Zielinski et al., 2010). Zielinski et al. (2010) findings suggest that GM structural covariance networks may mature after functional coactivation. Perhaps aging and the effects of neurodegenerative syndromes are possible mechanisms as to how structural GM covariation occurs. The normal aging process in healthy controls could also explain our results of structure–function correlations.
As predicted age had a strong affect on the structural components, for decreases in GM volume are thought to be both from maturational and degenerative changes (Taki et al., 2011) and this study age range spanned from adolescence to later adulthood (12–71 years). After adjusting for age, the strength of our between-component correlations was not significantly mitigated for all of the structural component pairs. Future studies should evaluate structural components for distinct age groups to determine age specific structural covariance patterns. Surprisingly, we did not find significant associations with gender and structural loading parameters. There are inconsistencies in the literature regarding sex differences and GM (Sowell et al., 2007), which could be attributed to the differences in methods used to obtain GM measurements. Our study was comprised of a large age rage of males and females and that may be why we did not find a main effect of gender.
The SNC analysis revealed several structural components that were highly covariant and similar to regions that were found in other structural–functional correspondence studies. Specifically, the precuneus was linked to frontal, cerebral, parietal, and motor areas. This relationship with the precuneus and the other structural components survives after adjusting for age, which is a possible indicator that the precuneus might play a role of a structural “hub” in the SNC. The finding of a precuneus “hub” is consistent with a previous study, which through mapping structural cortico-cortical pathways identified the precuneus as one of the hubs of the structural core of the human cortex (Hagmann et al., 2008). The subcortical components were not as strongly correlated to the other cortical components, which could be caused by differences in types of GM.
The findings from our structural–functional analysis are relevant to human connectome research, for the correspondence between structural and functional covariations provides us with information about brain connectivity. A meta-analysis by Smith et al. (2009) demonstrated that covariation of functional networks, from over 1,600 functional neuroimaging studies, are similar to the functional networks found at rest. Therefore, INs can be identified from inter-subject covariation. Additionally, a recent ICA paper showed that estimates of functional activity can be accurately predicted from covariation analysis, which again provides us with information that functional covariation is directly related to connectivity (Calhoun and Allen, in press). This current paper is extending this work further, by identifying both structural covariation components and components where structural–functional covariations correspond. Regions where we have identified correspondence are perhaps highly dependent on structure. The regions where we have not shown structural–functional correspondence are also of interest. For instance, we did not find any structural or functional covariations in regions such as the prefrontal cortex, which are associated with higher cognitive functions (Jung and Haier, 2007).
There are several limitations to this study, the first being the investigation of structural networks using GMD. GMD only provides indirect measurements of structural networks; therefore, since we do not use DWI and directly evaluate WM tract involvement we are unable to make direct statements about anatomical connectivity (Stam, 2010). Yet, as identified in a primate study, the number of neurons differ depending if the GM is gyral or not (Hilgetag and Barbas, 2005). Therefore, it is no longer as straightforward to infer that the underlying anatomical connectivity corresponds to GM measures, such as cortical thickness. Future work should incorporate all three measures (fMRI, structural MRI, and DWI). The methods we used were to describe the relationship between structure and function at the group level, consequently the next step would be to investigate this relationship at the individual level. To further substantiate our findings of structural–functional correspondence, future studies should also investigate structural and functional covariations between structural–functional pairs at the subject level to ensure the findings are replicable and reliable.
Additionally, we conducted a very constrained analysis that investigated a limited number of components. We decided to use a strict feature selection criteria to limit our analysis and results to components that were explicitly within GM. We do not find it surprising that we eliminated 65 components, for SBM is most likely demonstrating that the brain is comprised of complex morphometry that cannot be easily characterized by a voxel-wise map. The observed SBM findings of the separate components identified for the basal ganglia and in the cerebellum are interesting, for those regions have well known stereotypical anatomical architectures. These findings provide additional evidence that GMD covariation detects regions of the brain that share similar anatomical architectures. Our study was also comprised from healthy individuals over a wide age range and future studies could explore how these structural–functional relationship manifest at different age stages.
Conclusion
The use of non-invasive neuroimaging provides the ability to describe and find structural and functional networks, fostering opportunities to further understand the complexity of the human brain. Using the multivariate approach, SBM, we found GM structural relationship patterns and several areas in the brain where structure and function correspond. More importantly, we also demonstrated that GM structural components are directly associated with functional components.
Conflict of Interest Statement
The authors declare that the research was conducted in the absence of any commercial or financial relationships that could be construed as a potential conflict of interest.
Acknowledgments
The authors would like to thank Sergey Plis and Eswar Damarju with their help generating figures and tables. This research was supported by NIH 1R01-EB006841, NIH 1R01-EB005846, NIH 2R01-EB000840, NIH 1 P20 RR021938-01, and DOE DE-FG02-08ER64581 (PI: Calhoun). Support for data collection by NIMH 1R01-MH072681-01 (PI: Kiehl); John Templeton Foundation Grant #12456 (PI: Jung); NRC Bilatgrunn (PI: Eichele); NIH 1P20 AA017068 (PI: Kodituwakku); NIH R21NS064464, NIH 1 R03 DA022435-01A1, and NIH 1 R03 DA024212-01A1 (PI: Mayer); NIH KO1-DA021632-02 (PI: Filbey).
Footnotes
References
Abou-Elseoud, A., Starck, T., Remes, J., Nikkinen, J., Tervonen, O., and Kiviniemi, V. (2010). The effect of model order selection in group PICA. Hum. Brain Mapp. 31, 1207–1216.
Allen, E. A., Erhardt, E. B., Damaraju, E., Gruner, W., Segall, J. M., Silva, R. F., Havlicek, M., Rachakonda, S., Fries, J., Kalyanam, R., Michael, A. M., Caprihan, A., Turner, J. A., Eichele, T., Adelsheim, S., Bryan, A. D., Bustillo, J., Clark, V. P., Feldstein Ewing, S. W., Filbey, F., Ford, C. C., Hutchison, K., Jung, R. E., Kiehl, K. A., Kodituwakku, P., Komesu, Y. M., Mayer, A. R., Pearlson, G. D., Phillips, J. P., Sadek, J. R., Stevens, M., Teuscher, U., Thoma, R. J., and Calhoun, V. D. (2011). A baseline for the multivariate comparison of resting-state networks. Front. Syst. Neurosci. 5:2. doi: 10.3389/fnsys.2011.00002
Bassett, D. S., Bullmore, E., Verchinski, B. A., Mattay, V. S., Weinberger, D. R., and Meyer-Lindenberg, A. (2008). Hierarchical organization of human cortical networks in health and schizophrenia. J. Neurosci. 28, 9239–9248.
Bassett, D. S., and Bullmore, E. T. (2009). Human brain networks in health and disease. Curr. Opin. Neurol. 22, 340–347.
Bermudez, P., Lerch, J. P., Evans, A. C., and Zatorre, R. J. (2009). Neuroanatomical correlates of musicianship as revealed by cortical thickness and voxel-based morphometry. Cereb. Cortex 19, 1583–1596.
Biswal, B., Yetkin, F. Z., Haughton, V. M., and Hyde, J. S. (1995). Functional connectivity in the motor cortex of resting human brain using echo-planar MRI. Magn. Reson. Med. 34, 537–541.
Biswal, B. B., Mennes, M., Zuo, X.-N., Gohel, S., Kelly, C., Smith, S. M., Beckmann, C. F., Adelstein, J. S., Buckner, R. L., Colcombe, S., Dogonowski, A.-M., Ernst, M., Fair, D., Hampson, M., Hoptman, M. J., Hyde, J. S., Kiviniemi, V. J., Kötter, R., Li, S.-J., Lin, C.-P., Lowe, M. J., Mackay, C., Madden, D. J., Madsen, K. H., Margulies, D. S., Mayberg, H. S., Mcmahon, K., Monk, C. S., Mostofsky, S. H., Nagel, B. J., Pekar, J. J., Peltier, S. J., Petersen, S. E., Riedl, V., Rombouts, S. A., Rypma, B., Schlaggar, B. L., Schmidt, S., Seidler, R. D., Siegle, G. J., Sorg, C., Teng, G.-J., Veijola, J., Villringer, A., Walter, M., Wang, L., Weng, X.-C., Whitfield-Gabrieli, S., Williamson, P., Windischberger, C., Zang, Y.-F., Zhang, H.-Y., Castellanos, F. X., and Milham, M. P.(2010). Toward discovery science of human brain function. Proc. Natl. Acad. Sci. U.S.A. 107, 4734–4739.
Bockholt, H. J., Scully, M., Courtney, W., Rachakonda, S., Scott, A., Caprihan, A., Fries, J., Kalyanam, R., Segall, J. M., De La Garza, R., Lane, S., and Calhoun, V. D. (2010). Mining the mind research network: a novel framework for exploring large scale, heterogeneous translational neuroscience research data sources. Front. Neuroinform. 3:36. doi: 10.3389/neuro.11.036.2009
Bressler, S. L., and Menon, V. (2010). Large-scale brain networks in cognition: emerging methods and principles. Trends Cogn. Sci. 14, 277–290.
Buckner, R. L., Andrews-Hanna, J. R., and Schacter, D. L. (2008). The brain’s default network: anatomy, function, and relevance to disease. Ann. N. Y. Acad. Sci. 1124, 1–38.
Calhoun, V. D., Adali, T., Giuliani, N. R., Pekar, J. J., Kiehl, K. A., and Pearlson, G.D.(2006). Method for multimodal analysis of independent source differences in schizophrenia: combining gray matter structural and auditory oddball functional data. Hum. Brain Mapp. 27, 47–62.
Calhoun, V. D., Adali, T., Pearlson, G. D., and Pekar, J. J. (2001). A method for making group inferences from functional MRI data using independent component analysis. Hum. Brain Mapp. 14, 140–151.
Calhoun, V. D., and Allen, E. A. (in press). Extracting intrinsic functional networks with feature-based group independent component analysis. Psychometrika.
Calhoun, V. D., Kiehl, K. A., and Pearlson, G. D. (2008). Modulation of temporally coherent brain networks estimated using ICA at rest and during cognitive tasks. Hum. Brain Mapp. 29, 828–838.
Calhoun, V. D., Liu, J., and Adali, T. (2009). A review of group ICA for fMRI data and ICA for joint inference of imaging, genetic, and ERP data. Neuroimage 45, S163–S172.
Caplan, D., Gow, D., and Makris, N. (1995). Analysis of lesions by MRI in stroke patients with acoustic-phonetic processing deficits. Neurology 45, 293–298.
Cavanna, A. E., and Trimble, M. R. (2006). The precuneus: a review of its functional anatomy and behavioural correlates. Brain 129, 564–583.
Chen, Z. J., He, Y., Rosa-Neto, P., Germann, J., and Evans, A. C. (2008). Revealing modular architecture of human brain structural networks by using cortical thickness from MRI. Cereb. Cortex 18, 2374–2381.
Damoiseaux, J. S., and Greicius, M. D. (2009). Greater than the sum of its parts: a review of studies combining structural connectivity and resting-state functional connectivity. Brain Struct. Funct. 213, 525–533.
Damoiseaux, J. S., Rombouts, S. A., Barkhof, F., Scheltens, P., Stam, C. J., Smith, S. M., and Beckmann, C. F. (2006). Consistent resting-state networks across healthy subjects. Proc. Natl. Acad. Sci. U.S.A. 103, 13848–13853.
Draganski, B., Gaser, C., Busch, V., Schuierer, G., Bogdahn, U., and May, A. (2004). Neuroplasticity: changes in grey matter induced by training. Nature 427, 311–312.
Duncan, J., and Owen, A. M. (2000). Common regions of the human frontal lobe recruited by diverse cognitive demands. Trends Neurosci. 23, 475–483.
Ekstrom, A. (2010). How and when the fMRI BOLD signal relates to underlying neural activity: the danger in dissociation. Brain Res. Rev. 62, 233–244.
Erhardt, E. B., Allen, E. A., Damaraju, E., and Calhoun, V. D. (2011). On network derivation, classification, and visualization: a response to Habeck and Moeller. Brain Connect. 1, 1–19.
Fox, M. D., Snyder, A. Z., Vincent, J. L., Corbetta, M., Van Essen, D. C., and Raichle, M. E. (2005). The human brain is intrinsically organized into dynamic, anticorrelated functional networks. Proc. Natl. Acad. Sci. U.S.A. 102, 9673–9678.
Franco, A. R., Pritchard, A., Calhoun, V. D., and Mayer, A. R. (2009). Interrater and intermethod reliability of default mode network selection. Hum. Brain Mapp. 30, 2293–2303.
Garrity, A. G., Pearlson, G. D., Mckiernan, K., Lloyd, D., Kiehl, K. A., and Calhoun, V. D. (2007). Aberrant “default mode” functional connectivity in schizophrenia. Am. J. Psychiatry 164, 450–457.
Glahn, D. C., Winkler, A. M., Kochunov, P., Almasy, L., Duggirala, R., Carless, M. A., Curran, J. C., Olvera, R. L., Laird, A. R., Smith, S. M., Beckmann, C. F., Fox, P. T., and Blangero, J. (2010). Genetic control over the resting brain. Proc. Natl. Acad. Sci. U.S.A. 107, 1223–1228.
Greicius, M. (2008). Resting-state functional connectivity in neuropsychiatric disorders. Curr. Opin. Neurol. 21, 424–430.
Greicius, M. D., Supekar, K., Menon, V., and Dougherty, R. F. (2009). Resting-state functional connectivity reflects structural connectivity in the default mode network. Cereb. Cortex 19, 72–78.
Guye, M., Bartolomei, F., and Ranjeva, J. P. (2008). Imaging structural and functional connectivity: towards a unified definition of human brain organization? Curr. Opin. Neurol. 21, 393–403.
Hagmann, P., Cammoun, L., Gigandet, X., Gerhard, S., Ellen Grant, P., Wedeen, V., Meuli, R., Thiran, J. P., Honey, C. J., and Sporns, O. (2010). MR connectomics: principles and challenges. J. Neurosci. Methods 194, 34–45.
Hagmann, P., Cammoun, L., Gigandet, X., Meuli, R., Honey, C. J., Wedeen, V. J., and Sporns, O. (2008). Mapping the structural core of human cerebral cortex. PLoS Biol. 6, e159. doi: 10.1371/journal.pbio.0060159
Haier, R. J., Karama, S., Leyba, L., and Jung, R. E. (2009). MRI assessment of cortical thickness and functional activity changes in adolescent girls following three months of practice on a visual–spatial task. BMC Res. Notes 2, 174. doi: 10.1186/1756-0500-2-174
Hanggi, J., Koeneke, S., Bezzola, L., and Jancke, L. (2010). Structural neuroplasticity in the sensorimotor network of professional female ballet dancers. Hum. Brain Mapp. 31, 1196–1206.
He, Y., Chen, Z. J., and Evans, A. C. (2007). Small-world anatomical networks in the human brain revealed by cortical thickness from MRI. Cereb. Cortex 17, 2407–2419.
Hilgetag, C. C., and Barbas, H. (2005). Developmental mechanics of the primate cerebral cortex. Anat. Embryol. 210, 411–417.
Honey, C. J., Sporns, O., Cammoun, L., Gigandet, X., Thiran, J. P., Meuli, R., and Hagmann, P. (2009). Predicting human resting-state functional connectivity from structural connectivity. Proc. Natl. Acad. Sci. U.S.A. 106, 2035–2040.
Honey, C. J., Thivierge, J. P., and Sporns, O. (2010). Can structure predict function in the human brain? Neuroimage 52, 766–776.
Jung, R. E., and Haier, R. J. (2007). The Parieto-Frontal Integration Theory (P-FIT) of intelligence: converging neuroimaging evidence. Behav. Brain Sci. 30, 135–154; discussion 154–187.
Kiviniemi, V., Starck, T., Remes, J., Long, X., Nikkinen, J., Haapea, M., Veijola, J., Moilanen, I., Isohanni, M., Zang, Y. F., and Tervonen, O. (2009). Functional segmentation of the brain cortex using high model order group PICA. Hum. Brain Mapp. 30, 3865–3886.
Koch, M. A., Norris, D. G., and Hund-Georgiadis, M. (2002). An investigation of functional and anatomical connectivity using magnetic resonance imaging. Neuroimage 16, 241–250.
Logothetis, N. K. (2002). The neural basis of the blood-oxygen-level-dependent functional magnetic resonance imaging signal. Philos. Trans. R. Soc. Lond. B Biol. Sci. 357, 1003–1037.
Lynall, M. E., Bassett, D. S., Kerwin, R., Mckenna, P. J., Kitzbichler, M., Muller, U., and Bullmore, E. (2010). Functional connectivity and brain networks in schizophrenia. J. Neurosci. 30, 9477–9487.
Mechelli, A., Friston, K. J., Frackowiak, R. S., and Price, C. J. (2005a). Structural covariance in the human cortex. J. Neurosci. 25, 8303–8310.
Mechelli, A., Price, C. J., Friston, K. J., and Ashburner, J. (2005b). Voxel-based morphometry of the human brain: methods and applications. Curr. Med. Imaging Rev. 1, 105–113.
Michael, A. M., Baum, S. A., White, T., Demirci, O., Andreasen, N. C., Segall, J. M., Jung, R. E., Pearlson, G., Clark, V. P., Gollub, R. L., Schulz, S. C., Roffman, J. L., Lim, K. O., Ho, B. C., Bockholt, H. J., and Calhoun, V. D. (2010). Does function follow form?: methods to fuse structural and functional brain images show decreased linkage in schizophrenia. Neuroimage 49, 2626–2637.
Miller, K. J., Weaver, K. E., and Ojemann, J. G. (2009). Direct electrophysiological measurement of human default network areas. Proc. Natl. Acad. Sci. U.S.A. 106, 12174–12177.
Paakki, J. J., Rahko, J., Long, X., Moilanen, I., Tervonen, O., Nikkinen, J., Starck, T., Remes, J., Hurtig, T., Haapsamo, H., Jussila, K., Kuusikko-Gauffin, S., Mattila, M. L., Zang, Y., and Kiviniemi, V. (2010). Alterations in regional homogeneity of resting-state brain activity in autism spectrum disorders. Brain Res. 1321, 169–179.
Power, J. D., Fair, D. A., Schlaggar, B. L., and Petersen, S. E. (2010). The development of human functional brain networks. Neuron 67, 735–748.
Raichle, M. E., Macleod, A. M., Snyder, A. Z., Powers, W. J., Gusnard, D. A., and Shulman, G. L. (2001). A default mode of brain function. Proc. Natl. Acad. Sci. U.S.A. 98, 676–682.
Raichle, M. E., and Snyder, A. Z. (2007). A default mode of brain function: a brief history of an evolving idea. Neuroimage 37, 1083–1090; discussion 1097–1099.
Robinson, S., Basso, G., Soldati, N., Sailer, U., Jovicich, J., Bruzzone, L., Kryspin-Exner, I., Bauer, H., and Moser, E. (2009). A resting state network in the motor control circuit of the basal ganglia. BMC Neurosci. 10, 137. doi: 10.1186/1471-2202-10-137
Rykhlevskaia, E., Gratton, G., and Fabiani, M.(2008). Combining structural and functional neuroimaging data for studying brain connectivity: a review. Psychophysiology 45, 173–187.
Seeley, W. W., Crawford, R. K., Zhou, J., Miller, B. L., and Greicius, M. D. (2009). Neurodegenerative diseases target large-scale human brain networks. Neuron 62, 42–52.
Shehzad, Z., Kelly, A. M., Reiss, P. T., Gee, D. G., Gotimer, K., Uddin, L. Q., Lee, S. H., Margulies, D. S., Roy, A. K., Biswal, B. B., Petkova, E., Castellanos, F. X., and Milham, M. P. (2009). The resting brain: unconstrained yet reliable. Cereb. Cortex 19, 2209–2229.
Skudlarski, P., Jagannathan, K., Anderson, K., Stevens, M. C., Calhoun, V. D., Skudlarska, B. A., and Pearlson, G. (2010). Brain connectivity is not only lower but different in schizophrenia: a combined anatomical and functional approach. Biol. Psychiatry 68, 61–69.
Skudlarski, P., Jagannathan, K., Calhoun, V. D., Hampson, M., Skudlarska, B. A., and Pearlson, G. (2008). Measuring brain connectivity: diffusion tensor imaging validates resting state temporal correlations. Neuroimage 43, 554–561.
Smith, S. M., Fox, P. T., Miller, K. L., Glahn, D. C., Fox, P. M., Mackay, C. E., Filippini, N., Watkins, K. E., Toro, R., Laird, A. R., and Beckmann, C. F. (2009). Correspondence of the brain’s functional architecture during activation and rest. Proc. Natl. Acad. Sci. U.S.A. 106, 13040–13045.
Sowell, E. R., Peterson, B. S., Kan, E., Woods, R. P., Yoshii, J., Bansal, R., Xu, D., Zhu, H., Thompson, P. M., and Toga, A. W. (2007). Sex differences in cortical thickness mapped in 176 healthy individuals between 7 and 87 years of age. Cereb. Cortex 17, 1550–1560.
Sowell, E. R., Peterson, B. S., Thompson, P. M., Welcome, S. E., Henkenius, A. L., and Toga, A. W. (2003). Mapping cortical change across the human life span. Nat. Neurosci. 6, 309–315.
Sporns, O., Tononi, G., and Kotter, R. (2005). The human connectome: a structural description of the human brain. PLoS Comput. Biol. 1, e42. doi: 10.1371/journal.pcbi.0010042
Stam, C. J. (2010). Characterization of anatomical and functional connectivity in the brain: a complex networks perspective. Int. J. Psychophysiol. 77, 186–194.
Supekar, K., Uddin, L. Q., Prater, K., Amin, H., Greicius, M. D., and Menon, V. (2010). Development of functional and structural connectivity within the default mode network in young children. Neuroimage 52, 290–301.
Taki, Y., Thyreau, B., Kinomura, S., Sato, K., Goto, R., Kawashima, R., and Fukuda, H. (2011). Correlations among brain gray matter volumes, age, gender, and hemisphere in healthy individuals. PLoS ONE 6, e22734. doi: 10.1371/journal.pone. 0022734
van den Heuvel, M. P., Mandl, R. C., Kahn, R. S., and Hulshoff Pol, H. E. (2009). Functionally linked resting-state networks reflect the underlying structural connectivity architecture of the human brain. Hum. Brain Mapp. 30, 3127–3141.
Weng, S. J., Wiggins, J. L., Peltier, S. J., Carrasco, M., Risi, S., Lord, C., and Monk, C. S. (2010). Alterations of resting state functional connectivity in the default network in adolescents with autism spectrum disorders. Brain Res. 1313, 202–214.
Xu, L., Groth, K. M., Pearlson, G., Schretlen, D. J., and Calhoun, V. D. (2009). Source-based morphometry: the use of independent component analysis to identify gray matter differences with application to schizophrenia. Hum. Brain Mapp. 30, 711–724.
Yang, H., Long, X. Y., Yang, Y., Yan, H., Zhu, C. Z., Zhou, X. P., Zang, Y. F., and Gong, Q. Y. (2007). Amplitude of low frequency fluctuation within visual areas revealed by resting-state functional MRI. Neuroimage 36, 144–152.
Ystad, M., Eichele, T., Lundervold, A. J., and Lundervold, A. (2010). Subcortical functional connectivity and verbal episodic memory in healthy elderly – a resting state fMRI study. Neuroimage 52, 379–388.
Zielinski, B. A., Gennatas, E. D., Zhou, J., and Seeley, W. W. (2010). Network-level structural covariance in the developing brain. Proc. Natl. Acad. Sci. U.S.A. 107, 18191–18196.
Zuo, X. N., Di Martino, A., Kelly, C., Shehzad, Z. E., Gee, D. G., Klein, D. F., Castellanos, F. X., Biswal, B. B., and Milham, M. P. (2010a). The oscillating brain: complex and reliable. Neuroimage 49, 1432–1445.
Keywords: structural, functional, networks, source-based morphometry, independent component analysis, resting-state, gray matter density
Citation: Segall JM, Allen EA, Jung RE, Erhardt EB, Arja SK, Kiehl K and Calhoun VD (2012) Correspondence between structure and function in the human brain at rest. Front. Neuroinform. 6:10. doi: 10.3389/fninf.2012.00010
Received: 24 May 2011; Accepted: 12 March 2012;
Published online: 27 March 2012.
Edited by:
Claus Hilgetag, Jacobs University Bremen, GermanyReviewed by:
Trygve B. Leergaard, University of Oslo, NorwayThomas R. Knösche, Max Planck Institute for Human Cognitive and Brain Sciences, Germany
Copyright: © 2012 Segall, Allen, Jung, Erhardt, Arja, Kiehl and Calhoun. This is an open-access article distributed under the terms of the Creative Commons Attribution Non Commercial License, which permits non-commercial use, distribution, and reproduction in other forums, provided the original authors and source are credited.
*Correspondence: Judith M. Segall, Mind Research Network, 1101 Yale Boulevard NE, Albuquerque, NM 87106, USA. e-mail: jsegall@mrn.org