 Tamlin Jefferson
 Maria L. D. Palomares
 Carolyn J. Lundquist
- 1Institute of Marine Science, The University of Auckland, Auckland, New Zealand
- 2Sea Around Us, Institute for the Oceans and Fisheries, University of British Columbia, Vancouver, BC, Canada
- 3National Institute of Water and Atmospheric Research, Hamilton, New Zealand
- 4School of Environment, The University of Auckland, Auckland, New Zealand
The ocean contains an abundance of biodiversity that is vital to global food security. However, marine biodiversity is declining. Marine protected areas and marine reserves have been used to protect biodiversity, conserve threatened species and rebuild exploited species, but are perceived as restrictive to fishing, which has slowed progress towards ocean protection targets. Here, we perform a spatial prioritisation of the ocean to protect biodiversity, threatened species and food security. Food security was quantified using catch in tonnes per km2, per 0.5-degree cell of the ocean, using data from the Sea Around Us, a global database of industrial, artisanal, subsistence, and recreational fishing catches. Using Representative Biodiversity Areas [RBAs (the top 30% of the ocean based on holistic measures of biodiversity)], maps of 974 threatened species, and catch data for 2,170 exploited species, we find that these multiple, competing objectives are achievable with minimal compromise. Protecting 30% of the ocean using a multi-objective solution could protect 89% of RBAs, 89% of threatened species and maintain access to fishing grounds that provide 89% of global catch. Even when prioritising food security above conservation objectives we find significant protection for biodiversity and threatened species (85% RBAs, 73% threatened species). We highlight four exploited species for improved management, as they are consistently caught in areas of high conservation importance (skipjack tuna, Katsuwonus pelamis; yellowfin tuna, Thunnus albacares; Atlantic cod, Gadus morhua; Chilean jack mackerel, Trachurus murphyi). We show that a globally coordinated approach to marine conservation and food security is necessary, as regional scale strategies are shown to be less efficient and may result in conflict between food security and conservation objectives. Our results add support for calls to protect 30% of the ocean by 2030, and show where protection would best protect food security and conserve biodiversity and threatened species.
Introduction
Covering two thirds of the planet, the marine realm supports the abundance and diversity of all life on Earth. The world’s oceans help regulate the temperature of the planet (Costanza, 1999; Griffis and Howard, 2013), sequester an estimated 2.4 billion of tonnes of atmospheric carbon each year (Watson et al., 2020), and provide a myriad of provisions, services and cultural benefits vital to human health (Barbier, 2017; Lillebø et al., 2017; Townsend et al., 2018). Perhaps the most important are fisheries, which are integral to global food security, nutrition and economic well-being (Hicks et al., 2019; FAO, 2020). However, global catch peaked in 1996 and overfishing continues throughout the world’s oceans (Costello et al., 2016; Pauly and Zeller, 2016; Froese et al., 2018; Watson and Tidd, 2018; FAO, 2020; Britten et al., 2021).
Due to the overexploitation of marine resources, predominantly from fishing, marine biodiversity is declining, negatively affecting trophic structures, ecosystems and the ecosystem services necessary for human health (McCauley et al., 2015; Duarte et al., 2020). The decline of marine species and habitats has led to large reductions in species populations, and many species that were once numerous are now threatened with extinction (Baum and Myers, 2004; Lotze and Worm, 2009; McCauley et al., 2015; Young and Carlson, 2020; Yan et al., 2021).
To help turn the tide, Marine Protected Areas (MPAs) and Marine Reserves (MRs) have been designated to conserve and restore species populations, habitats and ecosystem functioning and services (Selig and Bruno, 2010; Leleu et al., 2012; Friedlander et al., 2017; Sala and Giakoumi, 2018). Used successfully as conservation tools, they have proven effective within fisheries management, increasing fisheries recruitment and sustainability, safeguarding against stock collapse, and recovering overexploited fish stocks (Yamasaki, 2002; Abesamis et al., 2006; Kerwath et al., 2013; Le Port et al., 2017; Lynham et al., 2020; Lenihan et al., 2021).
In 2010, participatory countries agreed to The Convention on Biological Diversity [CBD] (2010) Aichi Targets. Aichi target six committed to managing and sustainably harvesting all fish, invertebrate stocks and aquatic plants to avoid overfishing, while also ensuring that fisheries had no significant adverse impacts on threatened species and vulnerable ecosystems. Additionally, Aichi target 11 committed to the conservation of at least 10% of coastal and marine areas in protected areas, especially those areas that provide important ecosystem services. In spite of the success of MPAs and MRs and agreements by CBD countries, to date only 8% of the global ocean is in designated protected areas (Marine Conservation Institute, 2021). It is also widely acknowledged that protecting 10% of the oceans will be insufficient to achieve ecological and economic targets (World Parks Congress, 2014; IUCN, 2016; O’Leary et al., 2016; Link and Watson, 2019; Jones et al., 2020). As such, it is expected that the upcoming 15th meeting of the Conference of the Parties to the Convention on Biological Diversity will aim to protect at least 30% of the marine environment by 2030, a call echoed by the IUCN World Conservation Congress (Roberts et al., 2020; Sala et al., 2021).
Previous research has sought to identify conservation priorities for marine protection based on varying measures of biodiversity, including species richness, IUCN threat status, endemism, functional and evolutionary uniqueness and the distribution of human threats (e.g., Roberts et al., 2002; Worm et al., 2005; Tittensor et al., 2010; Pompa et al., 2011; Selig et al., 2014; Klein et al., 2015; Jenkins and Van Houtan, 2016; O’Hara et al., 2019; Zhao et al., 2020; Jefferson et al., 2021). Such studies provide an ecological solution to addressing global marine biodiversity loss, but prioritising areas based primarily on ecological criteria is problematic. Fishing occurs throughout the world’s oceans, heavily influences MPA and MR design and implementation, and is vital to global food security (Helson et al., 2010; Rieser et al., 2013; Devillers et al., 2015; FAO, 2020). Considering the importance of ecological criteria alongside ecosystem services, Visalli et al. (2020) prioritised areas based on species richness, extinction risk, habitat, and fishing effort, but their study was limited to the High Seas [areas beyond the 200 nautical mile limit of each nation’s Exclusive Economic Zone (EEZ), also called Areas Beyond National Jurisdiction]. The first global scale analysis was by Sala et al. (2021), which provided a multi-objective solution to biodiversity protection, food provisioning and carbon storage. They used 4,242 species distributions for biodiversity analyses and 1,150 commercially exploited marine stocks, accounting for roughly half of global catch by weight (Sala et al., 2021). Their results showed that achieving multiple objectives was possible, dependent on the assumption that prioritised areas would improve fisheries yields in areas of overfishing through stock recovery.
Based on a precautionary approach, we investigate whether assuring food security, conserving biodiversity and protecting threatened species is possible without stock recovery assumptions. As such, our approach favours the minimal displacement of fishing catch from current locations of high fisheries productivity. We build on the work of Zhao et al. (2020) which considered 24,904 species distributions in its biodiversity analyses, and Jefferson et al. (2021) which determined conservation priority areas by incorporating the work of Zhao et al. (2020) with the distribution data of 974 threatened species. We provide a multi-objective analysis, analysing biodiversity, threatened species and food security to determine the most effective solution to spatially managing the marine environment. Our objectives were to: (1) determine optimal solutions for scenarios that firstly prioritise food security above conservation; (2) balance both food security and conservation objectives; (3) incorporate regional balancing to compare global and regional scale trade-off efficiencies; and (4) determine the conservation potential of protecting the High Seas and compare this with protecting EEZs.
Materials and Methods
Biodiversity and Threatened Species Data
We included the spatial data layer of Representative Biodiversity Areas (RBAs) from Zhao et al. (2020), to define biodiversity priorities within the world’s oceans. Zhao et al. (2020) quantitatively prioritised the top 30% of the marine environment using seven ecosystems, four biomes, seabed rugosity and species richness within each biogeographic realm (using AquaMaps species distribution maps of 24,904 species). To represent the distribution of threatened species, we used the combined database of threatened species ranges from Jefferson et al. (2021), which used both AquaMaps and IUCN species range maps of 974 species from 19 taxonomic classes.
Fishing Catch Data
Catch in tonnes per km2 per 0.5-degree cell of the ocean globe (approx. 55 × 55 km2 at the equator) was compiled using data from the Sea Around Us (Pauly et al., 2020). The Sea Around Us provide a global database of fisheries catches by all maritime countries from 1950–2018. Their records are based on reported landings data from the Food and Agriculture Organisation (FAO), as well as reconstructed estimates of unreported catches (e.g., often unreported subsistence and recreational fisheries) and major discards. The data account for catch from all countries and all fishing sectors, industrial, artisanal, subsistence and recreational, and have been used widely in numerous publications (e.g., Sumaila et al., 2006, 2015; Worm et al., 2006; Swartz et al., 2010; Christensen et al., 2014; Sala et al., 2018a; Schiller et al., 2018; Tickler et al., 2018; Greer et al., 2019; Palomares et al., 2020). Catch records of all exploited species and exploited species groups were combined in R (version 3.6.0) for the last 10 years of available data, 2009–2018 (Figure 1). As our research was concerned with food security from all wild capture fisheries, the total weight of catch (tonnes) was used. Catch was then mapped in ArcMap (version 10.6.1) at a scale of 0.5-degrees.
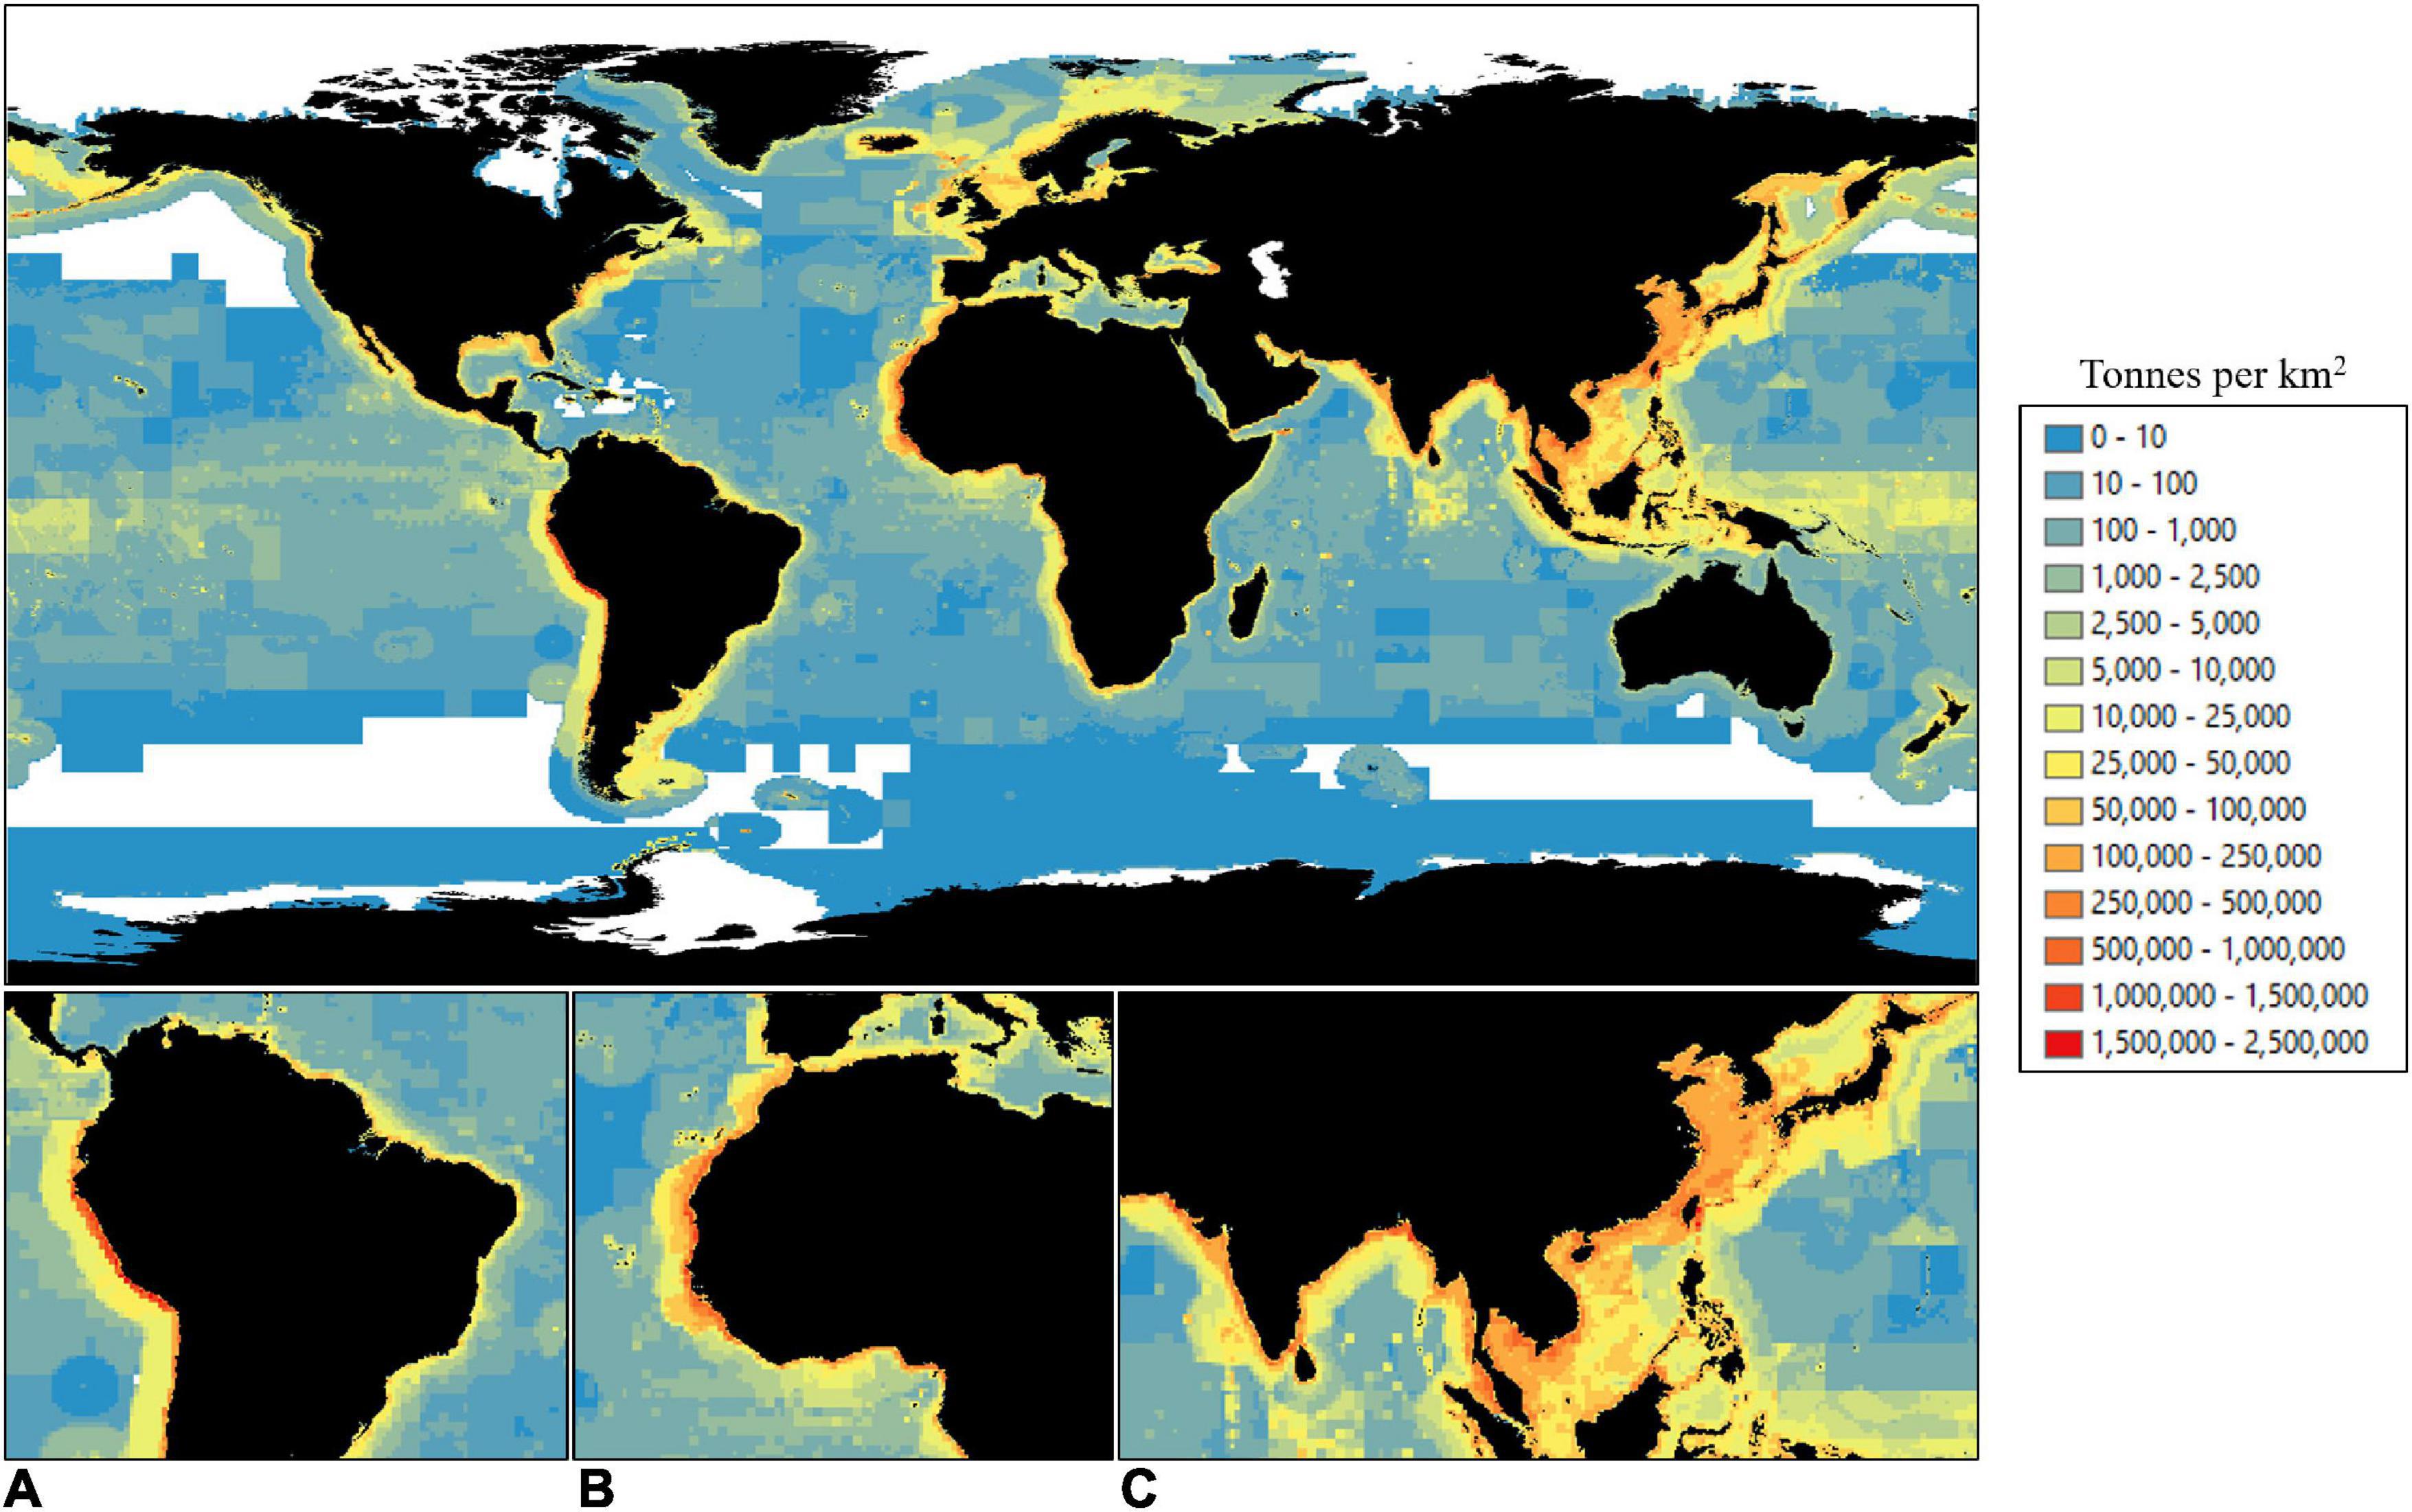
Figure 1. Total summed catch (2009–2018) in tonnes per 0.5-degree cell [approx. 55 × 55 km2 at the equator (data from the Sea Around Us, Pauly et al., 2020)]. Red: highest values; blue: lowest values; white: no data. Panel (A–C) insets denote areas of highest catch for (A) South America west coast, (B) West Africa, and (C) South and East Asia.
Preliminary Analyses
Using the ArcGIS local tool, “Combine,” and the extraction tool, “Sample,” we compared the overlap of global catch with two different biodiversity prioritisations from previous research, RBAs from Zhao et al. (2020) and areas of highest ecological importance (RBAs and 30% of each threatened species range) from Jefferson et al. (2021). These analyses showed that places of highest importance to biodiversity overlapped with areas that provide almost two thirds of catch by weight (62.0%), and that areas important to both threatened species and biodiversity account for 87.2% of catch. Our analyses also found that 70% of catch came from 3% of the ocean, 80% came from 4% of the ocean, and 90% of catch came from 7% of the ocean (Supplementary Figure 1). EEZs accounted for 97.5% of catch with the remaining 2.5% caught in the High Seas. As important areas for marine biodiversity, threatened species and catch spatially coincide, these analyses showed that protecting biodiversity and food security targets would require trade-offs between ecological and ecosystem service objectives through spatial planning.
Spatial Planning Scenarios
To identify optimal areas for hypothetical marine protection we used the decision-support software Zonation. Zonation is specifically designed to achieve spatial efficiency as a spatial prioritisation tool and has been used extensively in terrestrial and marine spatial management at national, regional and global scales (Delavenne et al., 2012; Veloz et al., 2015; Brum et al., 2017; Dias et al., 2017; Asaad et al., 2018; Duan et al., 2019; Rowden et al., 2019; Stralberg et al., 2020; Zhao et al., 2020; Jefferson et al., 2021; Stephenson et al., 2021). Zonation prioritises areas using a stepwise algorithm that assumes that the analysis area is fully protected, and then progressively identifies and removes cells that contribute the smallest marginal losses in the representation of specified biodiversity features (Moilanen et al., 2005, 2009, 2011, 2014; Lehtomäki and Moilanen, 2013).
All data layers used in Zonation analyses were converted to a 360 × 720 grid-cell raster file with a total of 259,200 global cells at a resolution of 0.5-degrees, ranging from 90°N to –90°S and –180°W to 180°E. In line with Jefferson et al. (2021), terrestrial cells were masked using the Natural Earth 10 m Ocean polygon (version 4.1.0, Natural Earth, 2019). As all data layers were projected by equal degrees, cells at high latitudes were slightly distorted and smaller than those at the equator. However, RBAs, threatened species ranges and catch data all had limited distributions in polar and high latitude regions, thus any cell distortion did not significantly affect Zonation results. Due to the scale of our study, cells in coastal areas which were predominantly terrestrial, but contained catch data, were excluded from our analyses. All Zonation results were limited to the highest scoring cells that covered 30% of global ocean area, in line with predicted increased ocean protection targets (World Parks Congress, 2014; IUCN, 2016; Sala et al., 2021). As shown by Jefferson et al. (2021), the current distribution of MPAs are not placed efficiently to protect biodiversity or threatened species. Therefore we opted not to force inclusion of these cells as priorities for protection in our analysis.
The fishing cost, i.e., the displaced catch per Zonation scenario, was determined by summing the catch from each 0.5-degree cell that would be lost if it was protected from fishing. Displaced catch was determined for all exploited species combined and for each individual exploited species. All calculations were completed in R.
Scenario 1, Prioritising Food Security Above Conservation
In Scenario 1, food security was prioritised above conservation objectives by masking the minimum ocean area that provided at least 90% of catch (that is, the least number of 0.5-degree cells that when summed equal ≥ 90% of fishing catch by weight, Supplementary Figure 1). Zonation’s mask function allows the scoring of cells to define the sequence of cell removal. Hence, all cells which equalled at least 90% of catch were given a hierarchical score of “0.” Ocean with lower or no catch was scored as “1,” and all remaining RBAs were scored as “2.” Consequently, during Zonation processing, the cells with the lowest mask levels (0) were removed first from the spatial prioritisation. As RBAs were scored as “2” they were retained during Zonation processing, ensuring such places were included as highest priority in any outputs. All other ocean areas were scored equally to allow optimal Zonation processing.
All threatened species ranges were used as biodiversity feature layers during Zonation analysis. The cell removal rule was set to “Target Based Function” with a target of 30%. This ensured a minimum of 30% of each threatened species range was included in any Zonation results. We included a target of 30% in keeping with recent calls to protect 30% of the global ocean. Should this be achieved, the maximum range conserved of circum-global species such as Balaenoptera musculus (blue whale) and Physeter macrocephalus (sperm whale) would be approximately 30%. In the interest of protecting all threatened species equally, this was used as a minimum target for all threatened species.
Scenario 2, Protecting Food Security, Biodiversity and Threatened Species
Scenario 2 used a multi-objective approach to balance food security with biodiversity and threatened species conservation. In this scenario, we used Zonation to perform a trade-off analysis to determine an optimal solution that addressed multiple conflicting objectives. Catch data was normalised from 0 to 1, as using the raw catch by weight per 0.5-degree cell resulted in skewed Zonation outputs due to orders of magnitude differences in catch in high productivity regions, e.g., southeast Pacific (see Supplementary Material for the normalisation technique used). The cell removal rule “Core Area Zonation” was used as it enabled data layers to be weighted during Zonation analysis. As weighting layers in Zonation is a subjective process, we used numerous trial runs (iterations) to determine the optimum weightings that maximised objectives. This iterative weighting approach was used to balance contributions to the prioritisation from each category of layer, similar to the “aggregate weighting” of Virtanen et al. (2018). After numerous iterations to ensure efficiency, the RBA layer was weighted “575,” the catch layer was weighted “–83” and each threatened species range layer was weighted as “1.”
Scenario 3, Balancing Objectives While Addressing Spatial Bias Using Administrative Regions
As Scenarios 1 and 2 provide Zonation solutions that rely on the global representation of feature layers and may be biased toward areas of high importance for biodiversity and threatened species (e.g., the Caribbean, The Coral Triangle, and Australia), Scenario 3 used administrative units to provide regional scale balancing of multi-objectives. Administrative units of the global ocean were defined using FAO Major Fishing Areas, which were then subdivided by EEZ or High Seas, resulting in 37 administrative regions (Figure 2). FAO Major Fishing Areas and EEZ maritime boundaries were downloaded from Marine Regions on the 18th of November 2020 (Flanders Marine Institute, 2019)]. In our analysis, the Mediterranean Sea was considered as a single, entirely EEZ administrative region, in line with previous research (Jenkins and Van Houtan, 2016; Visalli et al., 2020). If cells covered multiple FAO areas or EEZs, cells were allocated based on which FAO area or EEZ covered the majority of the cell.
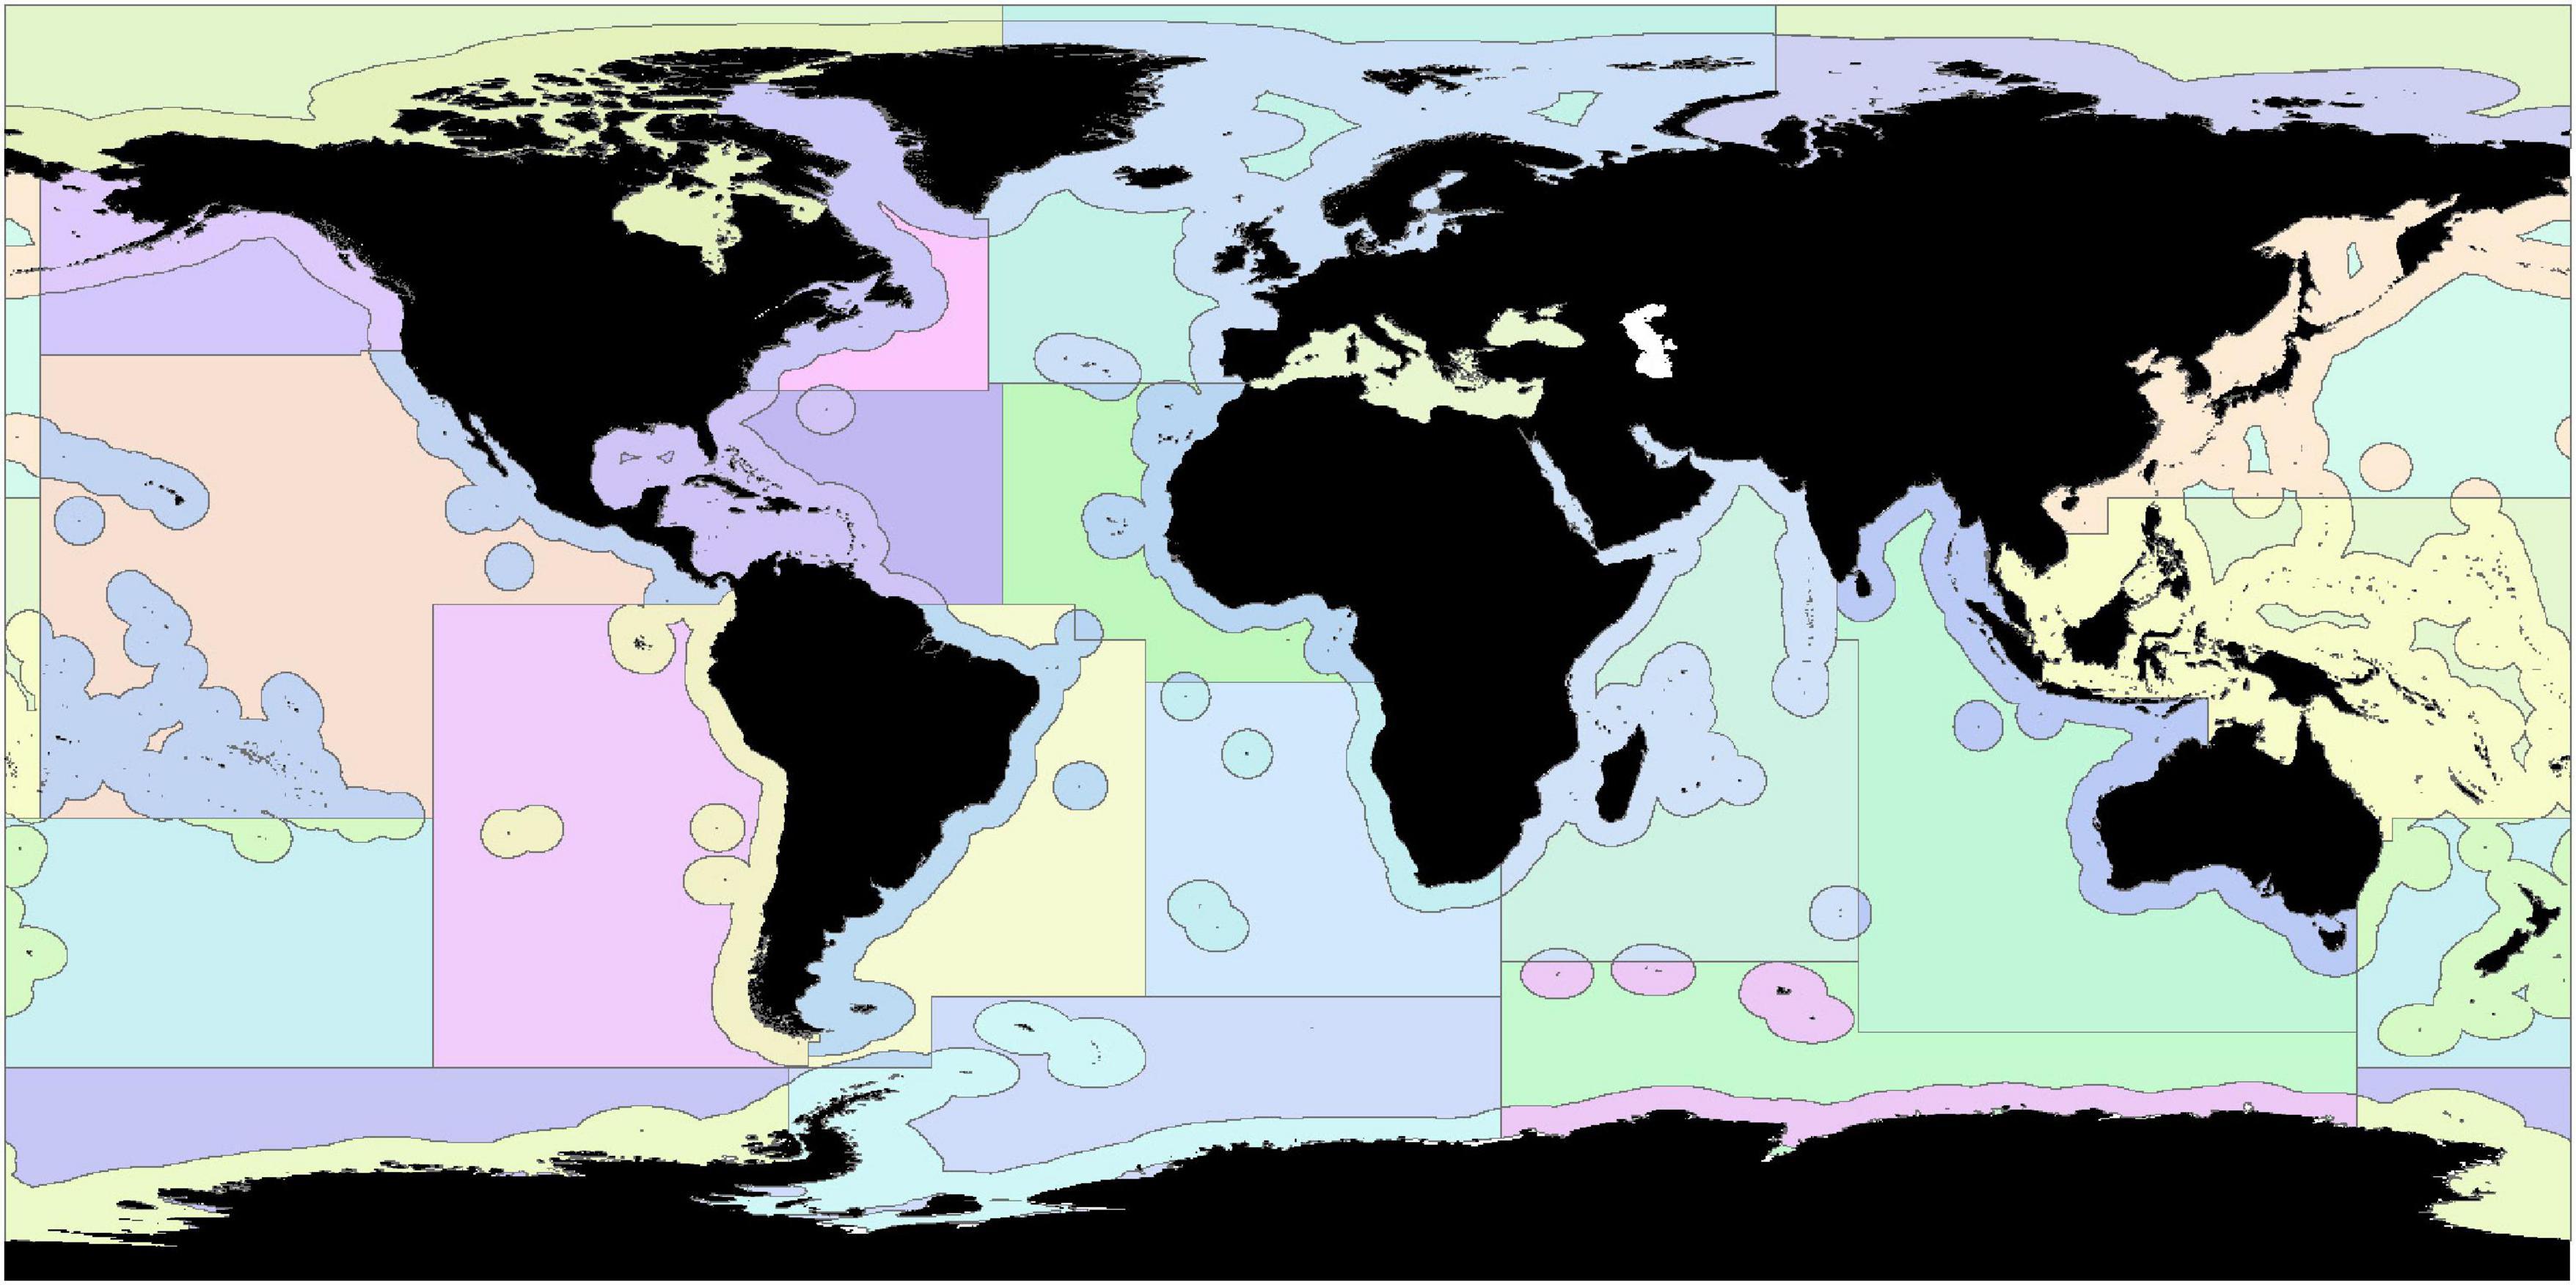
Figure 2. Each FAO Major Fishing Area was split into areas within EEZs and areas within the High Seas, resulting in 37 administrative regions.
We used the cell removal rule “Core Area Zonation” in Scenario 3, and catch data was normalised from 0 to 1. The Zonation setting, Administrative mode “2,” was used to ensure the representation of all features within each administrative region with the setting Mode 2 global weight set to “0.5.” This analysis assumes that all regionally occurring biodiversity features must be represented locally, but also allows global considerations to influence local priorities, ensuring that conservation value is aggregated globally and locally for each administrative region (Moilanen et al., 2014). Following Scenario 2, we used an iterative weighting approach to determine the optimum weightings that best balanced the three objectives (food security, RBAs and threatened species ranges). As such, the RBA layer was weighted “800,” the catch layer was weighted “–720” and each threatened species range layer was weighted as “1.”
Scenarios 4 and 5, Protecting Biodiversity and Threatened Species in the High Seas vs. Exclusive Economic Zones
Scenarios 4 and 5 determined the maximum number of threatened species ranges that can be protected by a minimum of 30%, and the proportion of all RBAs that can be conserved, by prioritising areas within the High Seas, and for comparison, within EEZs. In Scenario 4, ocean cells within the High Seas were scored as “1” and cells within EEZs were scored as “0.” This ensured that all RBAs and the entire range of each threatened species were included in the Zonation analysis area, but that ocean areas outside the desired processing extent, those scored as “0,” were removed first from the spatial prioritisation. Scenario 5 followed the same method as Scenario 4, but conversely, ocean cells within EEZs were scored as “1” and cells within the High Seas were scored as “0.” Balancing food security against conservation objectives was not considered in Scenarios 4 or 5, as the vast majority of catch comes from within EEZs (Sumaila et al., 2015).
A table of Zonation weightings for all scenarios is included in the Supplementary Material (Supplementary Table 1).
Results
Food Security, Biodiversity and Threatened Species Priority Areas
Our results show that even when strategically placing protection to avoid areas that constitute 90% of catch (Scenario 1), significant benefits to the conservation of biodiversity and threatened species are obtained (Figures 3A, 4A and Supplementary Table 2). Implementing Scenario 1 would maintain 95% of catch, while protecting 85% of biodiversity (RBAs) and 73% of threatened species (n = 704) by at least 30% of their range, with an average range protected of 48%. The results display only the highest scoring cells (top 30% prioritised cells) in line with recent calls for 30% ocean protection (Figure 3). As Scenario 1 prioritises food security based on catch, the results show large areas of unselected ocean in west South America, northern Europe, west Africa and south and east Asia (Figure 3A). Important areas for food security and catch are also visible as a coastal margin of unselected ocean in many areas, including west North America and east Africa (white regions, Figure 3A). Conversely, ocean surrounding the Caribbean, Australia, the Red Sea, and various islands in the western Pacific were almost entirely prioritised, due to their global importance to biodiversity and threatened species.
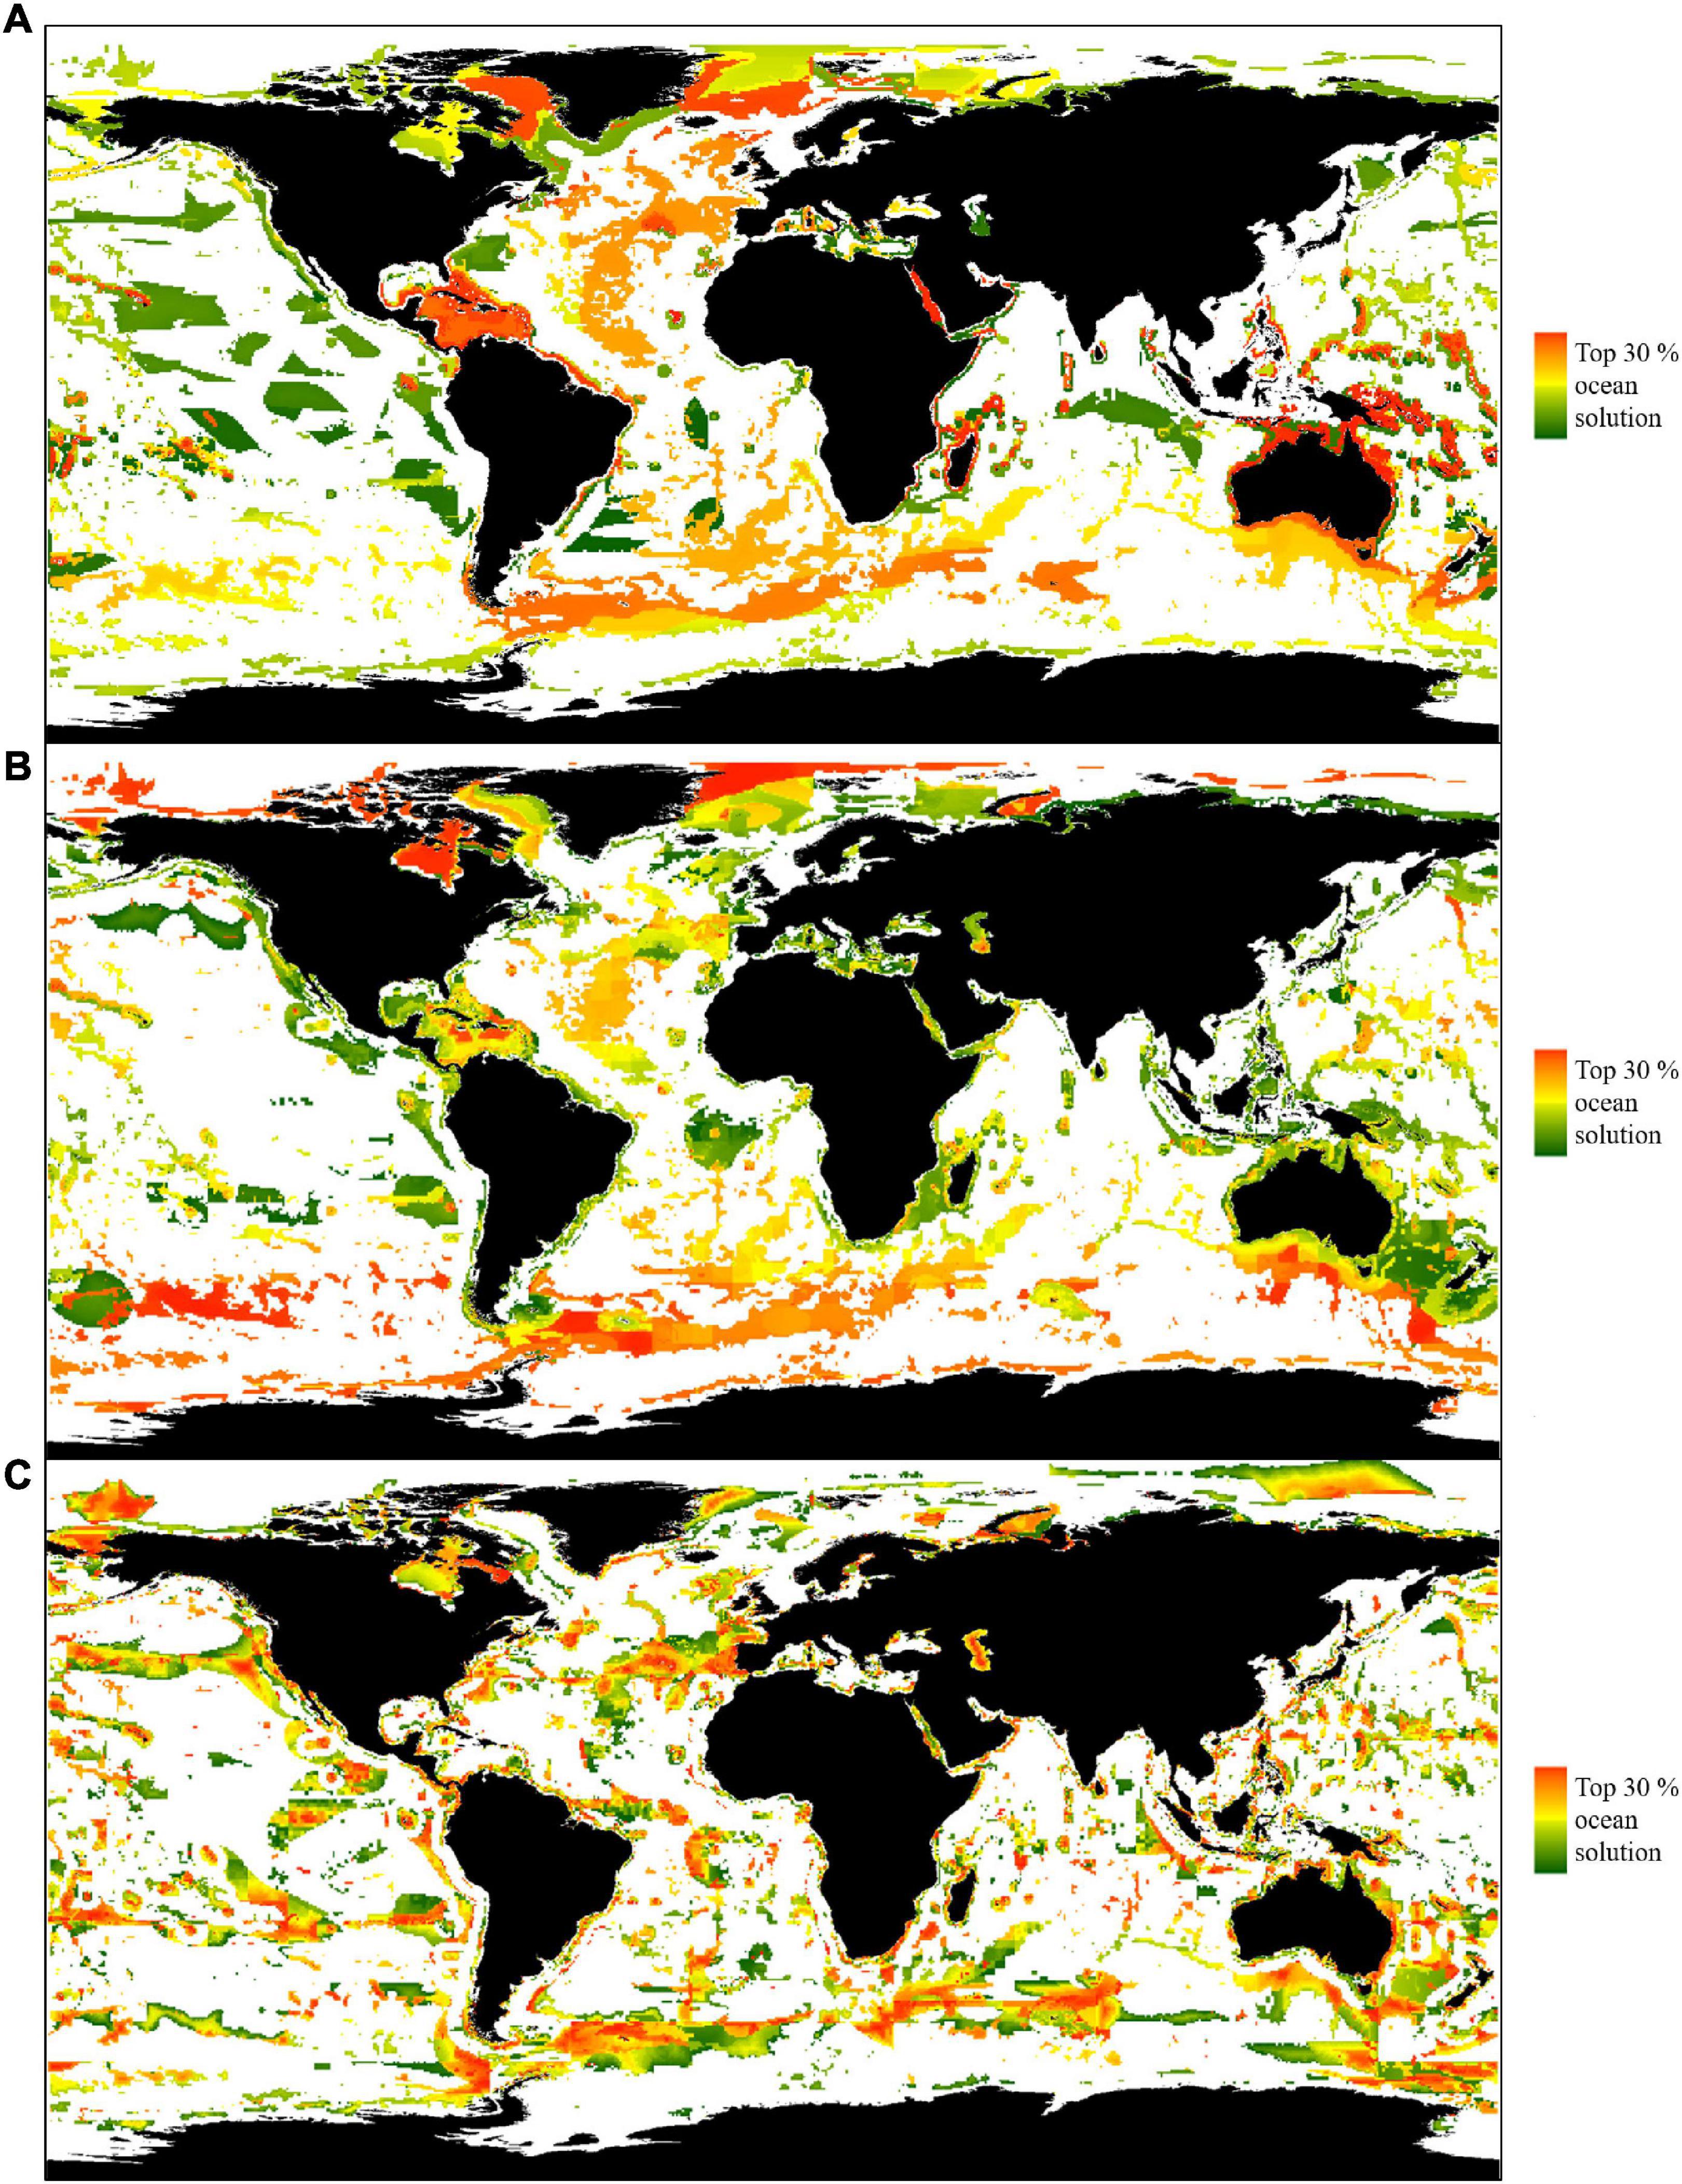
Figure 3. Priority areas for protection covering 30% of the ocean. Colour bars show areas of increasing priority per scenario (green to red), white cells were not selected as priority areas. All displayed priority areas within each scenario were required for protection to achieve any associated benefits. Panel (A–C) denotes Zonation scenario (A) Scenario 1, prioritising food security above conservation, (B) Scenario 2, protecting food security, biodiversity and threatened species, (C) Scenario 3, balancing objectives while addressing spatial bias using administrative regions.
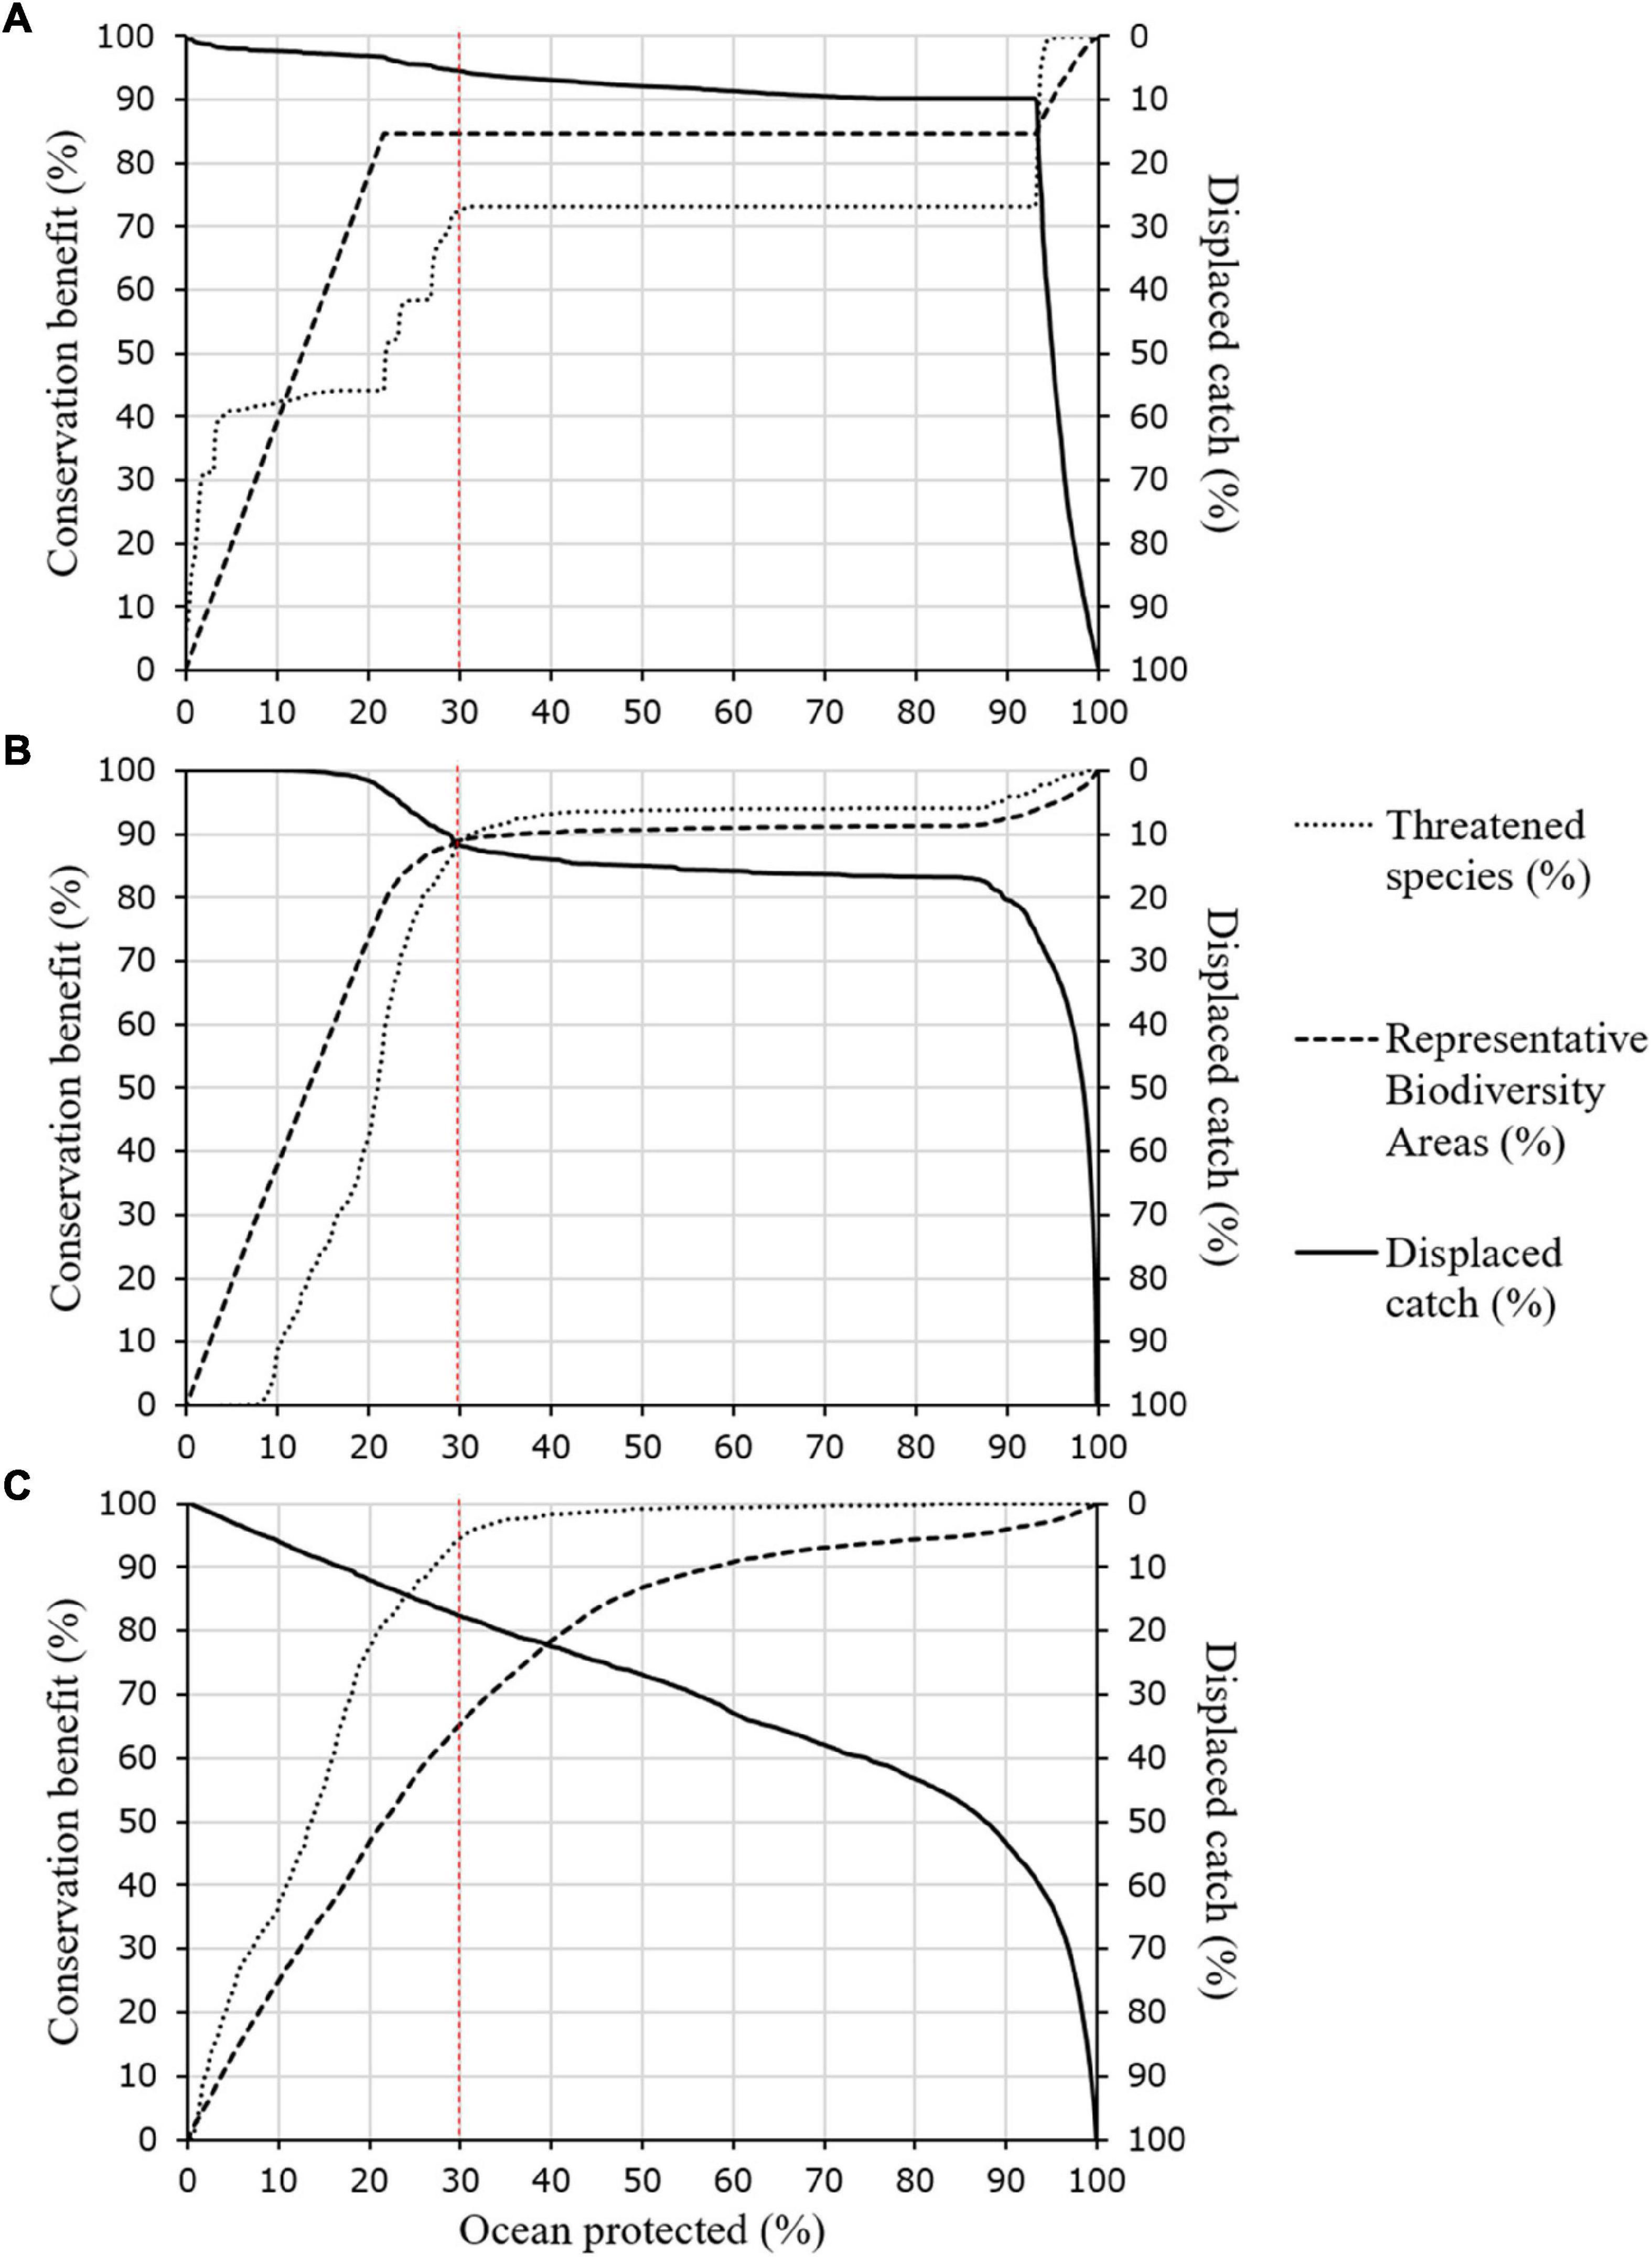
Figure 4. Each Zonation scenario resulted in trade-offs between objectives as ocean protection increased. Dashed red line shows 30% ocean protection. Panel (A–C) denotes Zonation scenario (A) Scenario 1, prioritising food security above conservation, (B) Scenario 2, protecting food security, biodiversity and threatened species, (C) Scenario 3, balancing objectives while addressing spatial bias using administrative regions.
The multi-objective solution of Scenario 2 provided the most balanced prioritisation of protected areas, which if implemented would maintain 89% of catch, protect 89% of biodiversity and conserve 89% of threatened species (n = 860), with an average range protected of 64% (Figures 3B, 4B and Supplementary Table 2). Highest scoring cells (limited to the top 30% prioritized cells) were located in similar areas to Scenario 1, with unselected areas in regions of high catch. However, Scenario 2 prioritized an increased number of areas in the Gulf of Mexico, the Mediterranean Sea, the Mozambique Channel, the Coral Triangle and the Tasman Sea, and a decreased number of areas in the Pacific. In contrast to Scenario 1, the highest priority cells (red) were located in places with lower current catch, such as areas in polar regions, so the score of these cells reflects their low “cost” to fishing and food security, rather than their ecological importance (Figure 3B). Scenarios 1 and 2 prioritise areas for protection with consideration of the global representation of biodiversity and threatened species. Consequently, Scenario 2 almost entirely prioritises the waters of the Caribbean, Australia, the Red Sea, and various islands in the western Pacific, balancing the loss of catch in these high value areas for biodiversity and threatened species against the high catch from unselected areas in west South America, west Africa, the north east Atlantic, south and south east Asia and the Yellow Sea (Figure 3B).
The regionally balanced prioritized areas of Scenario 3 were in contrast to the global solutions presented by Scenarios 1 and 2 (Figures 3C, 4C and Supplementary Table 2). If implemented, Scenario 3 would maintain 83% of catch, protect 65% of biodiversity and conserve 95% of threatened species (n = 916), with an average range protected of 63%. This scenario provided lower protection of biodiversity than the previous results (Figures 4A,B), but provided improved fishing access within each administrative area for the majority of regional coastlines, for example in the Caribbean, Madagascar and Australia (Figure 3). Highest scoring cells (limited to the top 30% prioritized cells) in Scenario 3 were generally more fragmented than prior scenarios. Scenarios 1, 2, and 3 shared common patterns of prioritized areas along mid ocean ridges, seamounts, and areas of high biodiversity, due to the distribution of RBAs, as per Zhao et al. (2020).
The Displacement of Catch From Exploited Species Important to Food Security
The cost, in displaced catch, for each exploited species was determined for Scenarios 1, 2, and 3 (Figure 5 and Supplementary Table 3). Scenario 1 displaced less catch on average than Scenarios 2 and 3 (Figure 5). However, the outliers in Scenario 1 show that catch was displaced disproportionately for some exploited species, Gadus morhua (Atlantic cod), Trachurus murphyi (Chilean jack mackerel), Katsuwonus pelamis (skipjack tuna), and Thunnus albacares (yellowfin tuna). There was increased variation between exploited species and larger average displaced catch in Scenario 3 (Figure 5). Of the 38 exploited species that constituted the majority of global catch by weight (50.1%), four had more than a 10% average displacement across Scenarios 1, 2, and 3; Thunnus albacares (yellowfin tuna): 25%; Gadus morhua (Atlantic cod): 25%; Katsuwonus pelamis (skipjack tuna): 23%; and Trachurus murphyi (Chilean jack mackerel): 14% (Supplementary Table 3). Additionally, five exploited species had more than a 5% average displacement in catch; Clupea harengus (Atlantic herring): 8%; Clupeidae (unspecified clupeoids): 12%; Engraulis encrasicolus (European anchovy): 9%; Oncorhynchus gorbuscha (pink salmon): 9%; and Teuthida (unspecified squid): 13% (Supplementary Table 3).
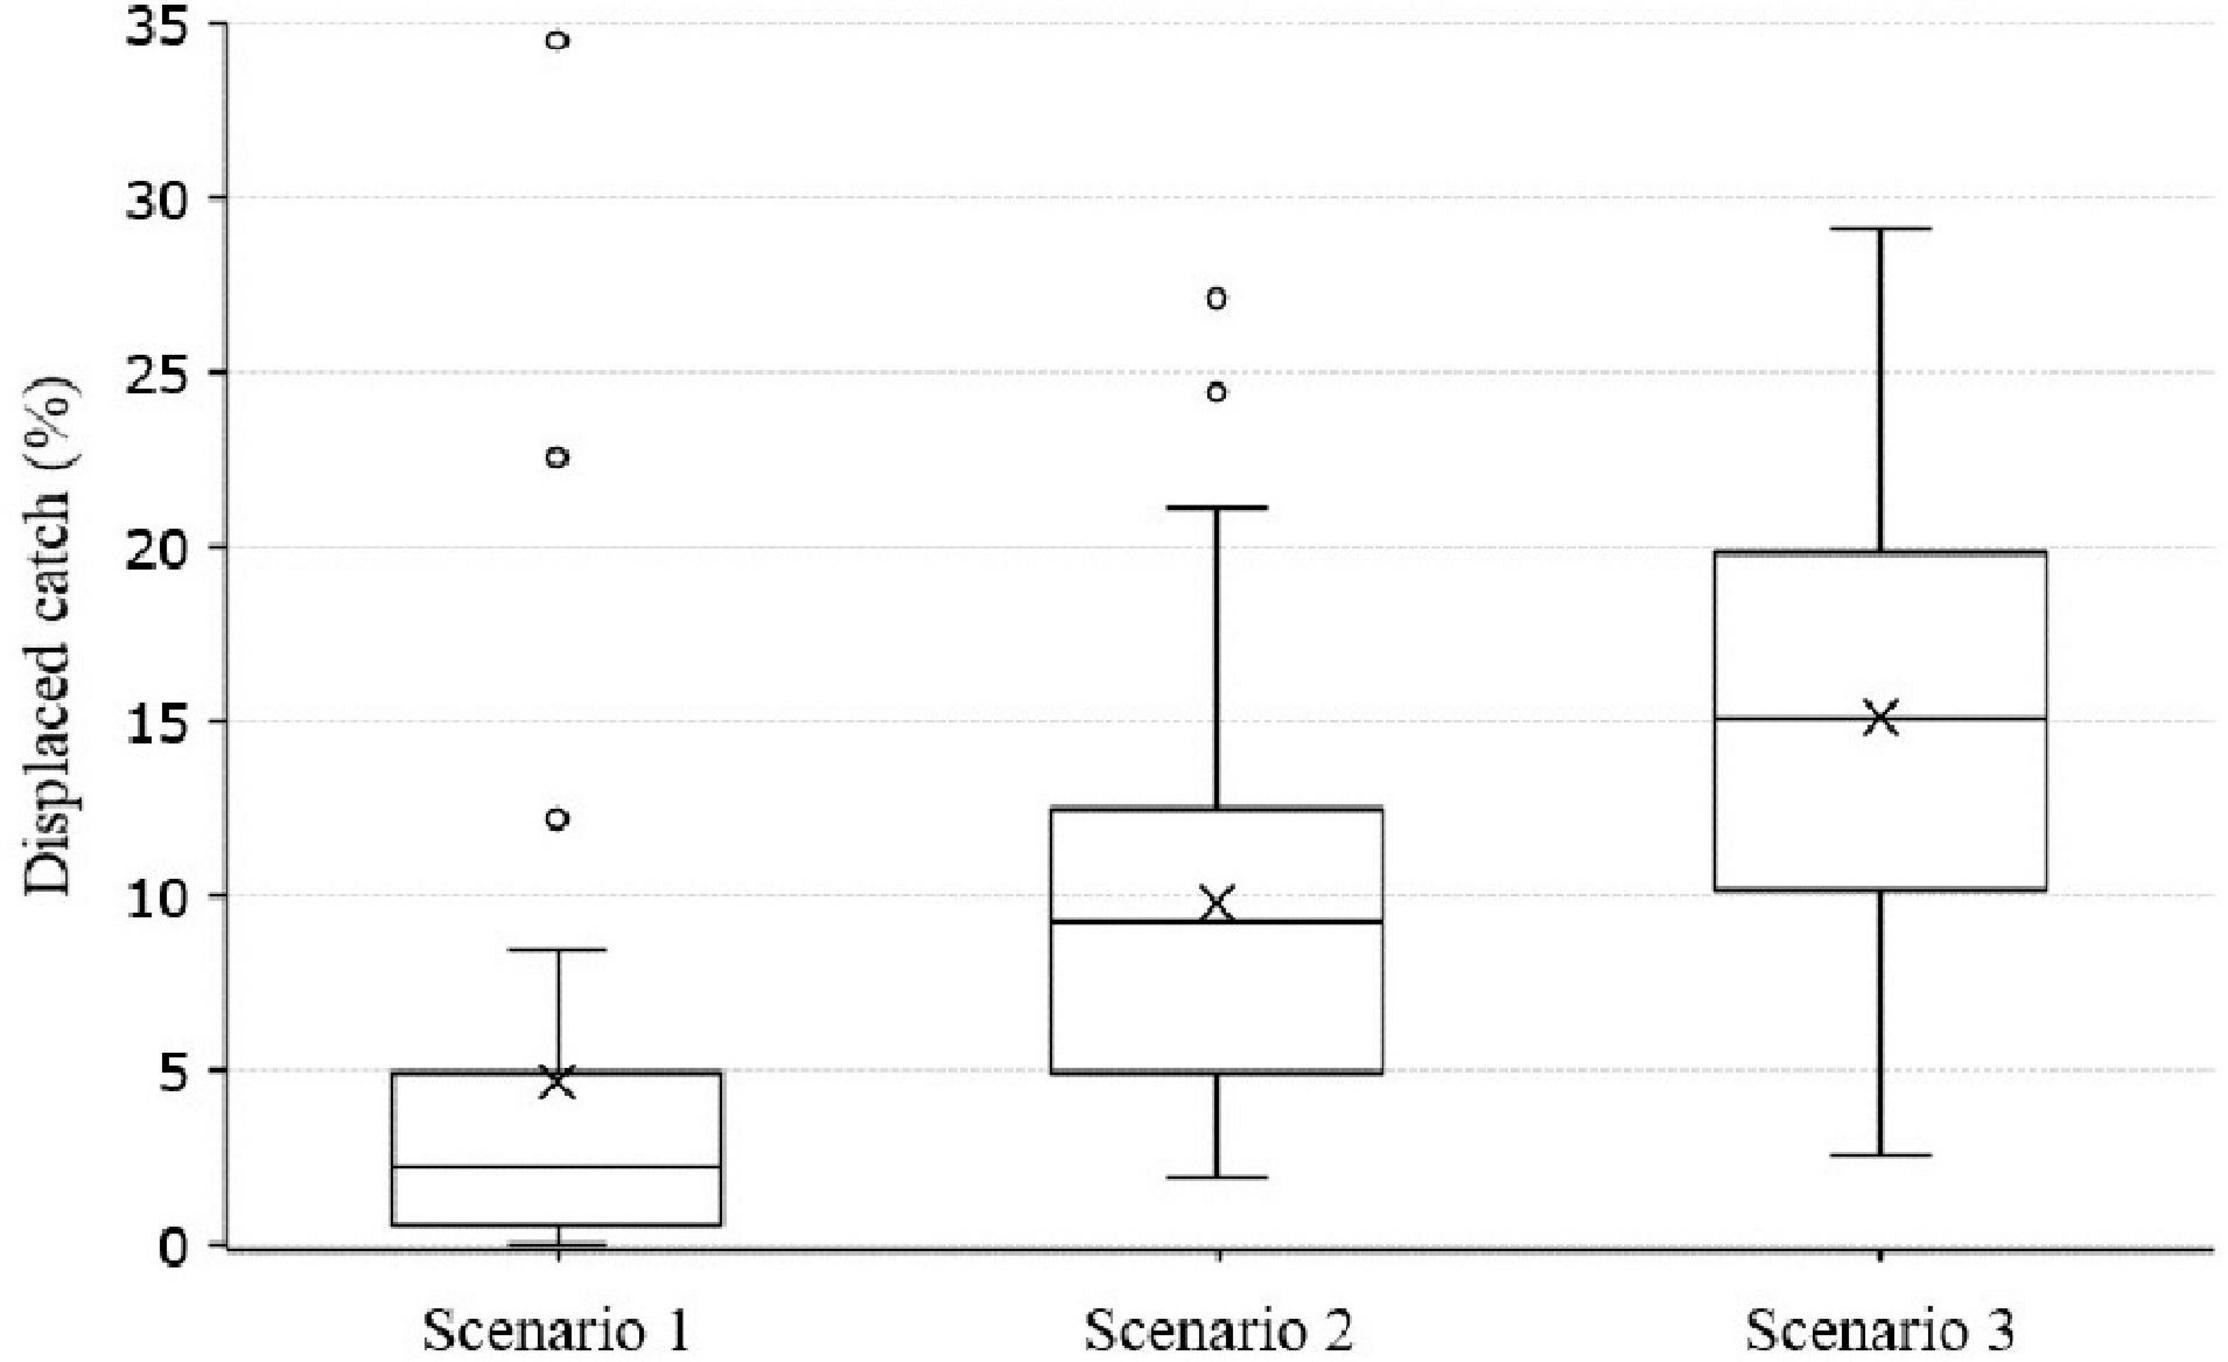
Figure 5. Displaced catch per Zonation scenario at 30% ocean protection. Only exploited species that form the majority of global catch were included due to their importance to food security (50.1% of catch by weight, 38 of 2165 exploited species). Mean displaced catch in Scenario 1, 4.6%; Scenario 2, 9.8%; Scenario 3, 15.1%.
Across Scenarios 1, 2, and 3, a number of exploited species showed high variation in displaced catch (>20%), due to differences in prioritised areas between scenarios, these included Sardinops sagax (South American pilchard), Engraulis japonicus (Japanese anchovy), Gadus morhua (Atlantic cod), and Sardinella longiceps [Indian oil sardine (Supplementary Table 3)].
Protecting Biodiversity and Threatened Species in the High Seas vs. Exclusive Economic Zones
Restricting Zonation analyses to the High Seas, Scenario 4, provided limited benefits to biodiversity and threatened species (Figure 6). Protecting 30% of the global ocean within the High Seas (53% of the High Seas) conserved 9% of threatened species by a minimum of 30% of their range (n = 86) and 38% of RBAs (Figure 6A). Protecting more than 30% of the global ocean within the High Seas protected one additional threatened species (Ursus maritimus, polar bear) and no additional RBAs, requiring a further 3% ocean protection (59% of the High Seas). Only 32 threatened species had ≥ 70% of their range distributed solely within the High Seas, which included 31 threatened seabirds and Thunnus maccoyii (southern bluefin tuna). As our analyses aimed to determine the importance of the High Seas to biodiversity and threatened species, catch and food security was not prioritised as a trade-off during Scenario 4. Nonetheless, an overlap analysis showed that protecting the prioritised High Seas areas shown in Figure 6A would “cost” 2% of catch.
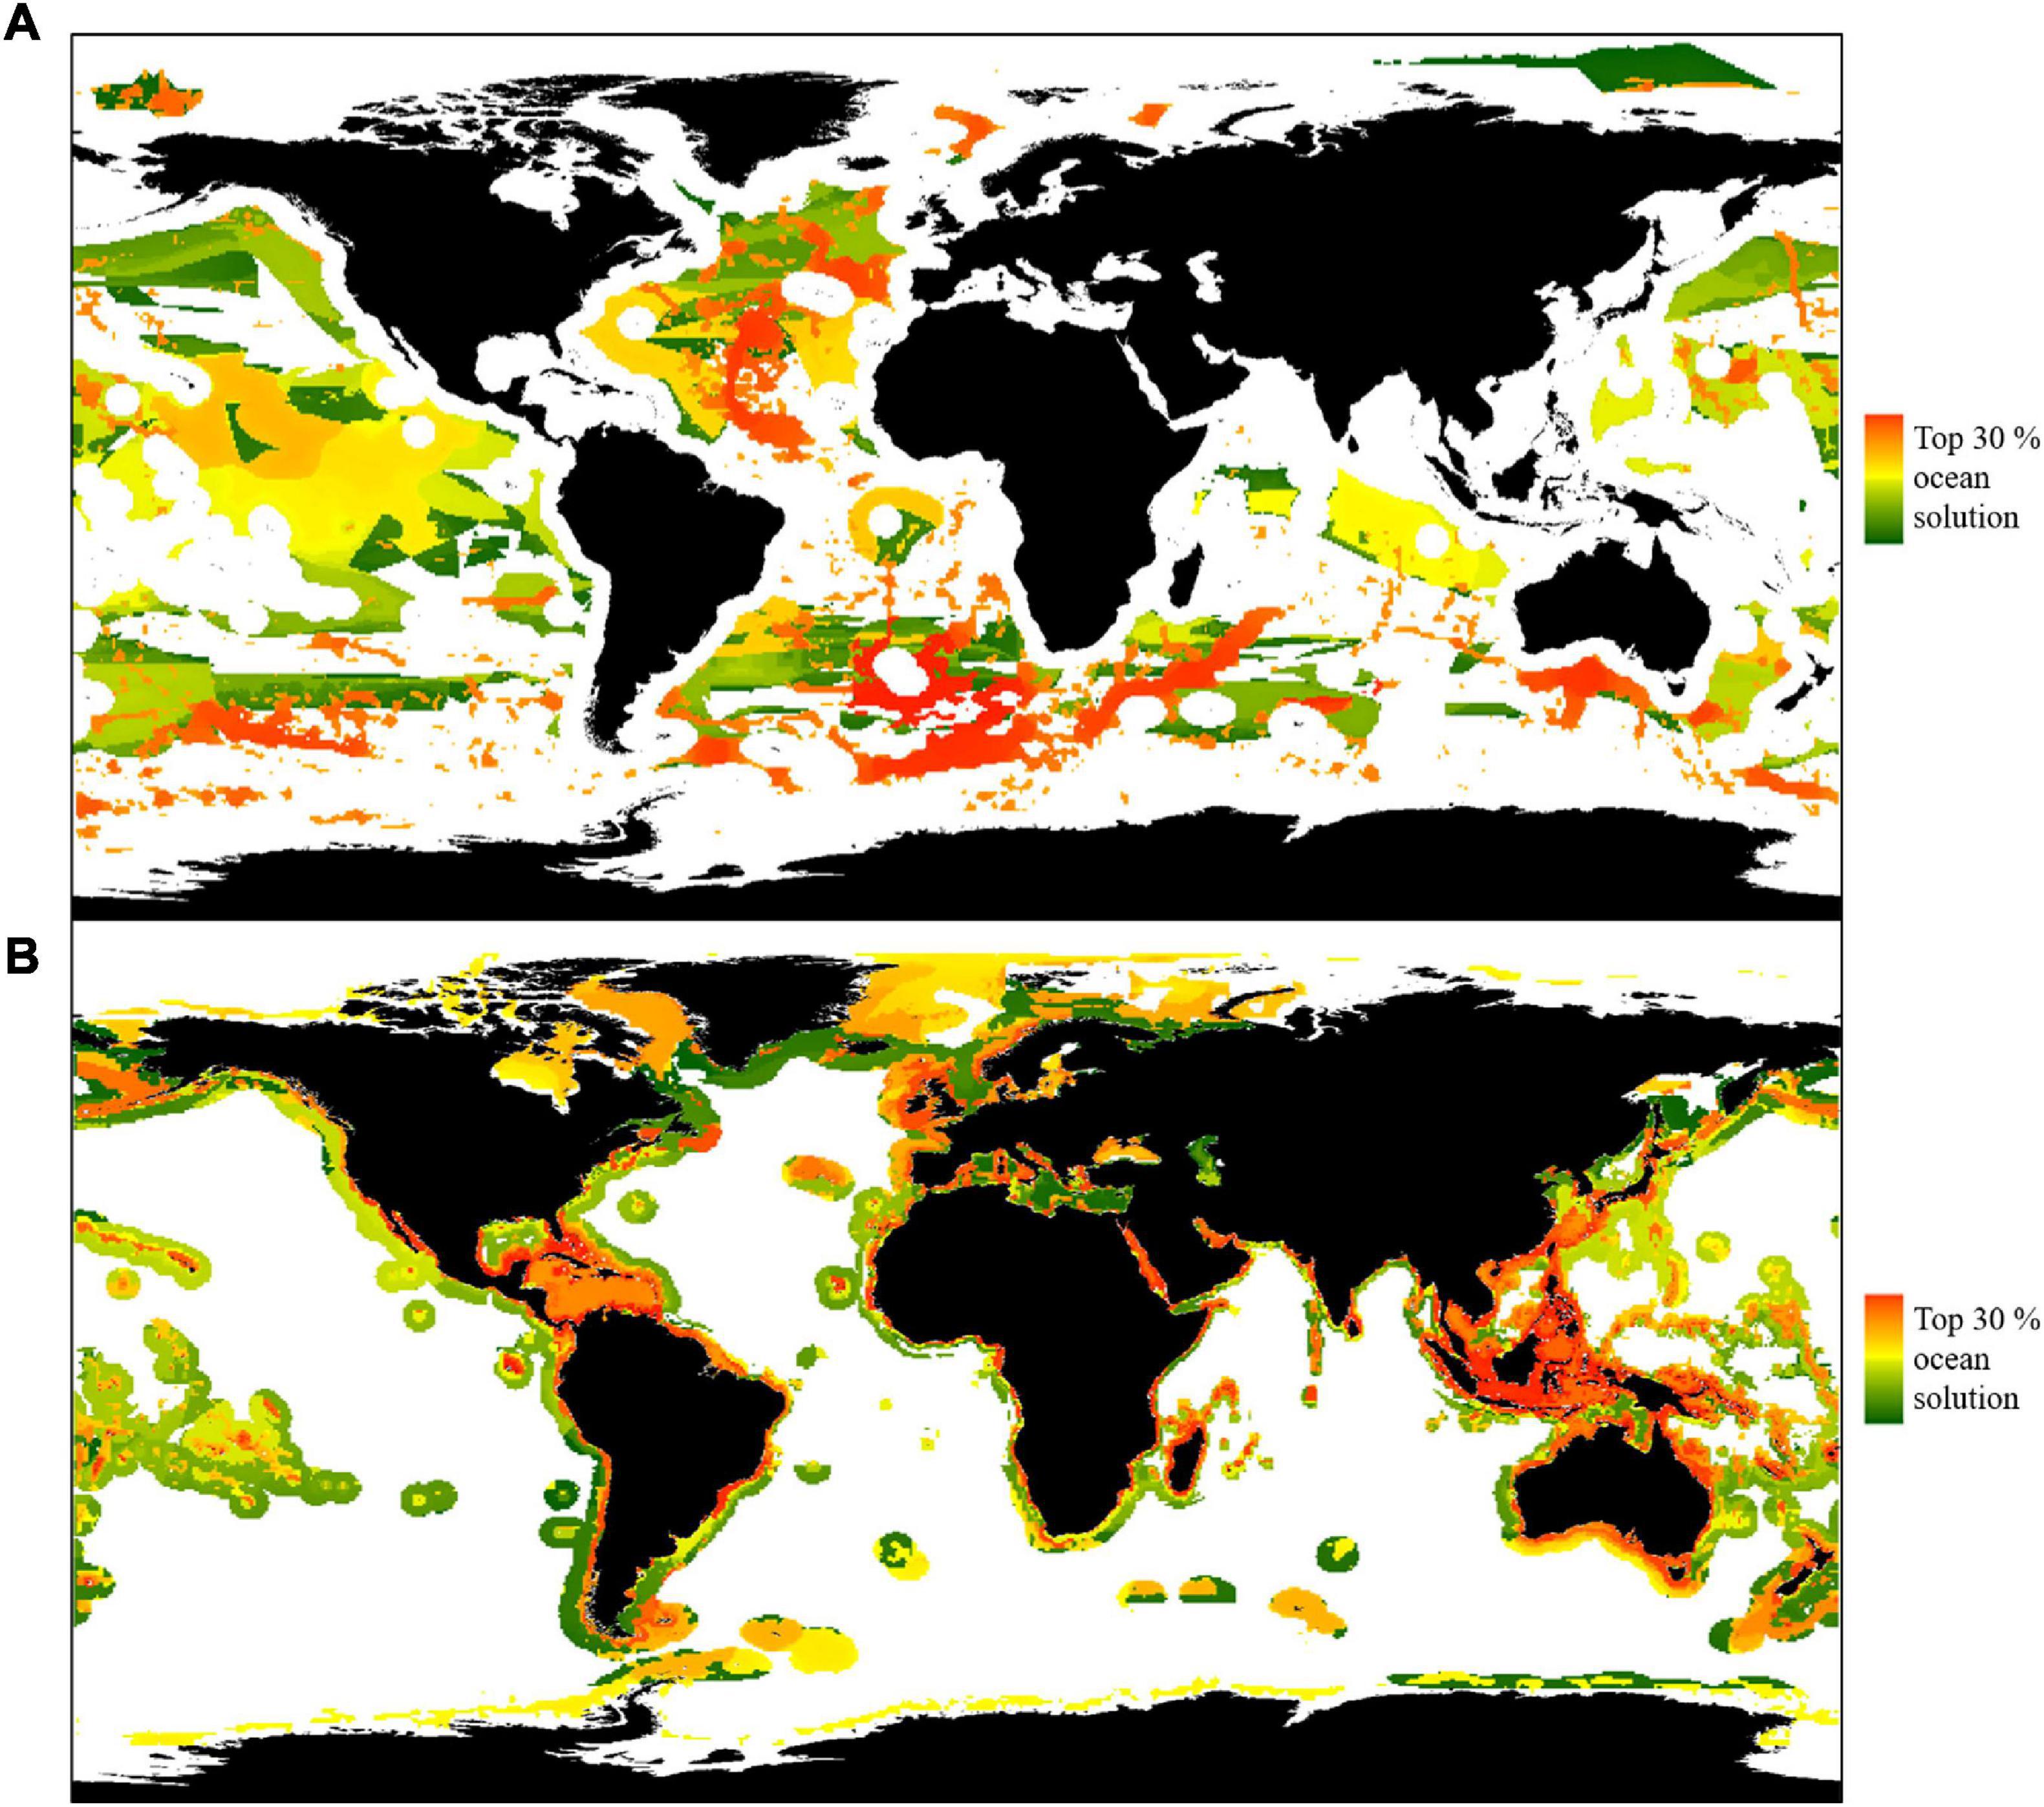
Figure 6. Priority areas for protection covering 30% of the ocean in the High Seas and EEZs. Colour bars show areas of increasing priority per scenario (green to red). Panel (A,B) denotes (A) Scenario 4, protecting biodiversity and threatened species in the High Seas, and (B) Scenario 5, in EEZs.
For comparison with the High Seas, Scenario 5 was limited to the protection of 30% of the global ocean within EEZs (71% of EEZs). Scenario 5 conserved 97% of threatened species (n = 940) by a minimum of 30% of their range and 62% of RBAs (Figure 6B). Two threatened species, Ursus maritimus (polar bear) and Thunnus obesus, (bigeye tuna), had sufficient range within EEZs (≥30%) to enable protection, but required a further 1% of ocean coverage (74% of EEZs). No additional RBAs could be protected by increasing protection within EEZs. As per Scenario 4, catch and food security was not prioritised as a trade-off during Scenario 5. However, protecting the prioritised EEZ areas shown in Figure 6B would “cost” 88% of catch (Figure 6B).
Discussion
Our analyses considered food security, biodiversity protection (RBAs) and threatened species conservation as contrasting objectives. Yet, our results show that when using a global approach to marine spatial management (Scenarios 1 and 2), all objectives are achievable without significant compromise (Figures 3A,B). Using such an approach, conservation and food security objectives are only conflicting when protecting more than 85% of the ocean, due to current distribution patterns of biodiversity, threatened species and catch. Thus, expanding marine protection to 30% of the global ocean could provide a win-win for multiple marine management objectives (Figures 4A,B).
In line with recent calls for increased marine protection, our models suggest that protecting 30% of the ocean will not lead to food insecurity, as the majority of catch can be maintained alongside marine conservation, 95% in Scenario 1 and 89% in Scenario 2 (World Parks Congress, 2014; IUCN, 2016; O’Leary et al., 2016; Sala et al., 2021). Moreover, given that global catch peaked in 1996 and has continuously declined since by 1.2 million tonnes per year, and a third of fisheries are overexploited, future catch reductions are inevitable (Pauly and Zeller, 2016; FAO, 2020; Palomares et al., 2020). Any short-term losses caused by catch reductions may serve to provide long-term benefits, as research has shown that catch restrictions will likely result in reduced fishing effort and increased catch volumes, making fishing more profitable and sustainable (Smith et al., 2011; Pikitch et al., 2014; Costello et al., 2016; Froese et al., 2016).
Our multi-objective solution (Scenario 2), which achieves 89% of each objective, provides a broad proposal of where marine protection should be prioritised, and is of particular importance as fisheries sustainability hinges upon maintaining the biodiversity of our oceans, a key objective of Scenario 2. While Scenario 2 uses a global approach to ocean management, it still accounts for resource access for small-scale fisheries due to global patterns of catch. Since 2009, more than 90% of catch has come from inshore and continental shelf areas (Supplementary Figure 1). Such areas are crucial to food security and were largely unselected as conservation priorities in our results. Continued access for small-scale fisheries is vital as they are typically more sustainable than larger fishing operations, use less destructive and energy-intensive fishing gear, use less fuel as they fish closer to shore, and discard less fish (Jacquet and Pauly, 2008; Carvalho et al., 2011). Additionally, small-scale fisheries account for around half of all wild capture seafood and employ 90% of fishers and fishworkers (Westlund and Zelasney, 2019).
Scenarios 1 and 2 provide less favourable outcomes for nations with exceptional biodiversity or high numbers of threatened species throughout their waters, as to achieve conservation objectives fishing must be displaced from such places. Our research assumes that all fishing, regardless of gear type, would have the same detrimental effect on biodiversity and threatened species. In practice, more sustainable fishing methods with high selectivity, or those that avoid benthic habitat damage such as pole-and-line or trolling, may allow continued access for neighbouring communities dependent on fishing for their economic wellbeing. However, it is unlikely to result in long-term food security benefits (as shown by Rife et al., 2013), as sustainable fisheries ultimately rely on healthy, complex and productive trophic structures and biodiversity (Hiddink et al., 2008; Zhou et al., 2010; Thrush et al., 2016). Further research incorporating the economic value of catch alongside food security and conservation objectives may provide an interesting comparison with our study, though such data is not yet available.
Balancing objectives between food security and marine conservation is more challenging at regional scales, as shown in Scenario 3, when attempting to ensure access to fisheries in areas of conservation importance (Figure 3C, 4C). The Caribbean, the Coral Triangle and Australia are among the most important places for biodiversity and threatened species. Consequently, safeguarding regional access to fishing in these areas comes at a disproportionate cost to conservation objectives (Figure 4C). Likewise, in areas of high catch, such as Peru, safeguarding biodiversity and threatened species comes at a disproportionate cost to food security (Scenario 3, Figure 3C). The inefficient prioritization of marine areas at smaller scales has also been noted by Sala et al. (2021), who used an alternative method, but found that a globally coordinated approach was almost twice as efficient as national-level conservation planning. This is highlighted in our study by higher displaced catch in Scenario 3 compared with Scenarios 1 and 2 (Figures 4, 5).
Our most efficient spatial solution (Scenario 2) showed similarities with the recent work of Visalli et al. (2020). They found that protecting key biodiversity in the High Seas required 24% High Seas protection, which compared closely with the 22% prioritised by our multi-objective solution (Scenario 2). Unlike Visalli et al. (2020), we did not consider future climatic influences on species distributions. Nonetheless, our spatial solution showed congruence with their priority areas within the Atlantic and Pacific Oceans, and high similarity in the Southern Ocean and parts of the Indian Ocean. Results showed few contrasting areas, with minor differences in areas prioritised along mid ocean ridges, off the west coast of Africa and in the northern Indian Ocean. Due to similarities between our High Seas prioritised areas and those of Visalli et al. (2020), many areas included in Scenario 2 may remain important marine management areas, even in the face of future climate changes. Our results also provide an interesting comparison with the work of Sala et al. (2021) who considered biodiversity protection, carbon storage and food provisioning, quantified using assumptions of recovery of exploited species following protection. Though we measured food security by summing the “cost” in displaced catch of ocean protection, complementary priority areas were visible throughout all oceans, but particularly in the Arctic and Southern Oceans, the west coasts of the Americas, the central North Atlantic, the Mediterranean Sea, southeast Africa, the Red Sea, the Tasman Sea, and the waters surrounding tropical and sub-tropical Pacific islands. Protecting these areas of overlap may achieve more than our primary objectives, as such places may contribute towards increased fish stocks and carbon sequestration. Areas not included in our solution but incorporated by Sala et al. (2021), such as the North Pacific, may allow our study to more effectively prioritise places preferable for conservation purposes, due to the higher number of species considered in our analysis.
Scenarios 1, 2, and 3 showed that catch from a number of exploited species was consistently displaced (Supplementary Table 3 and Figure 5). Skipjack tuna (Katsuwonus pelamis), yellowfin tuna (Thunnus albacares), Atlantic cod (Gadus morhua), and Chilean jack mackerel (Trachurus murphyi) are of critical importance to global food security, accounting for 6% of caught fish, but they also show the largest displacements in catch across scenarios, indicating that their respective large and small-scale fisheries are in important conservation areas. As designating and implementing ocean protection has proved time intensive (Lindegren et al., 2018; Sala et al., 2018b; Marine Conservation Institute, 2021), in the interim, such important exploited species and fishing grounds must be managed carefully to minimise negative effects on biodiversity and threatened species.
Fishing is increasing in the High Seas and expanding research has served to highlight the importance of the High Seas to biodiversity conservation (Tickler et al., 2018; Visalli et al., 2020; Wagner et al., 2020). Here, our analysis compared the effectiveness of protecting threatened species and biodiversity in the High Seas with EEZs (Figure 6). While 888 threatened species have ≥ 30% of their range only within EEZs, a further 32 threatened species had at least 70% of their range only within the High Seas. These High Seas threatened species primarily include seabirds, which nest on land, but their foraging grounds extend far offshore where they are vulnerable to bycatch and compete with fisheries for food sources (Lewison et al., 2014; Paleczny et al., 2015; Grémillet et al., 2018). Thus, extending marine protection and fisheries management in the High Seas is imperative to threatened seabird survival. The survival of another High Seas threatened species, the Endangered southern bluefin tuna, may also be bolstered by increasing protection within their High Seas range. The distribution of RBAs and threatened species in the High Seas, as well as the negligible catch (2.5%) and low profitability of High Seas fisheries (Sumaila et al., 2010; Sala et al., 2018a), supports research that calls for the closure of the High Seas to fishing (White and Costello, 2014; Sumaila et al., 2015).
The spatial solutions presented here could only be successful if those who currently fish in areas prioritised for conservation could find alternative sources of food and income. While adapting global import and export markets to provide food security to those who depend on locally caught seafood could be actioned, it is also worthwhile considering that any apparent loss of food security to coastal communities may be lower than our results indicate. Many nearshore areas, which provide a combined 5% of catch by weight, were not included in our analysis, as due to the scale of our study (55 km × 55 km2), cells in such areas were often predominantly terrestrial. Consequently, they were excluded from the Zonation analysis extent and were not prioritised as closed areas (areas with no fishing). Further research using finer-scale analysis would better incorporate such areas, but due to the available scale of other data layers used here, was beyond the scope of this study.
Our analyses assumed that closing areas of the ocean to fishing would not increase food provisions, as our aim was to determine overlaps and co-benefits across multiple objectives including minimising displacement of fisheries from their current distributions. Consequently, our results provide a conservative estimate of food security benefits. Research has shown MPAs can make fishing more sustainable through the recovery of fish stocks, as well as associated benefits from spillover and reproduction (Yamasaki, 2002; Vandeperre et al., 2011; Harrison et al., 2012; Le Port et al., 2017; Lynham et al., 2020; Lenihan et al., 2021). Hence, any displaced catch in Scenarios 1, 2, and 3 may represent a short-term cost for long-term fisheries sustainability. We also assumed that protecting threatened species by 30% of their range would be sufficient for their survival. In reality, some species may require increased range protection or the conservation of areas important for their life history stages to safeguard their survival. Finally, we assumed there would be no changes in species distributions due to climate change for exploited species, threatened species, or other aspects of biodiversity. Though species distributions are likely to change due to climate-related environmental impacts, there are many uncertainties in both climate projections for our oceans, as well as what species responses will be.
The accuracy of Zonation results is limited by input data, in this instance, by the number of species assessed by the IUCN Red List of Threatened Species. To date, 6% of known marine species have been assessed (Horton et al., 2021; IUCN, 2021), but there are known biases across species groups [e.g., 99% of mammals and birds have been assessed, compared with around 50% of fish (Meiri and Chapple, 2016; Miqueleiz et al., 2020)]. Likewise, the AquaMaps species distribution maps used by Zhao et al. (2020) to define RBAs consist mainly of fish species. As more species are assessed by the IUCN and spatial data created for species ranges, the accuracy of these datasets will improve and taxonomic biases will be reduced, but their inclusion in our assessment is warranted as they represent the best available data.
Protected areas face multiple challenges if they are to be implemented successfully and achieve conservation objectives (Edgar et al., 2014; Davies et al., 2018). As well as optimising the design of MPAs for biodiversity protection, of crucial importance to conservation success are enforcement and stakeholder engagement, support and acceptance, particularly from local fishing communities (Russ and Alcala, 1999; Beger et al., 2004; Di Franco et al., 2016; Ulate et al., 2018). Catch from illegal, unreported and unregulated (IUU) fishing is estimated at 8–14 million tonnes annually (Sumaila et al., 2020), but community supported protected areas have shown increased compliance, reduced poaching, and thus have a higher chance of success (Pollnac et al., 2010; Giakoumi et al., 2018). Therefore, the expansion of protected areas we recommend should focus on locally designed and implemented protection, in addition to well-enforced larger, more isolated MPAs and MRs.
Conclusion
To date, only 11% of our multi-objective solution (Scenario 2) is under some form of ocean protection (UNEP-WCMC and IUCN, 2021). Due to the overlap of important areas for biodiversity, threatened species and food security, increasing the use of sustainable fishing practices that mitigate bycatch is an urgent priority, along with expanding the current MPA network to better represent and conserve biodiversity and threatened species. Our results add further support for calls to protect 30% of the world’s oceans by 2030, and show where protection could be best placed to conserve marine biodiversity, avoid species extinctions and maintain food security from wild capture fisheries.
Data Availability Statement
Publicly available datasets were analyzed in this study. This data can be found here: https://www.seaaroundus.org/, https://www.sciencedirect.com/science/article/pii/S0006320719312182#, https://www.aquamaps.org/, and https://www.iucnredlist.org/.
Author Contributions
TJ and CL conceived the idea for the study, defined the methodology, and consulted on the analysis. TJ and MP acquired the data used. TJ curated the data, created the models, and prepared the initial draft. CL and MP contributed to the writing, review, and editing. CL supervised all research. All authors contributed to the article and approved the submitted version.
Funding
TJ is very grateful to be the recipient of a Commonwealth Scholarship, a Stanley Wishart Low Memorial Scholarship in Marine Science, and a Graduate Scholarship from the National Institute of Water and Atmospheric Research (NIWA), New Zealand. We also acknowledge funding from the NIWA Coasts and Oceans Programme, Strategic Science Investment Fund (New Zealand Ministry for Business, Innovation and Employment), Project #COME2203 “Biodiversity, Connectivity and Health.” MP is a member of the Sea Around Us, a research initiative supported by the David and Lucille Packard Foundation, Marisla Foundation, MAVA Foundation, Minderoo Foundation, Oak Foundation, Oceana, Paul M. Angell Family Foundation, Pew Charitable Trusts, and RARE.
Conflict of Interest
The authors declare that the research was conducted in the absence of any commercial or financial relationships that could be construed as a potential conflict of interest.
Publisher’s Note
All claims expressed in this article are solely those of the authors and do not necessarily represent those of their affiliated organizations, or those of the publisher, the editors and the reviewers. Any product that may be evaluated in this article, or claim that may be made by its manufacturer, is not guaranteed or endorsed by the publisher.
Acknowledgments
We acknowledge the work of Qianshuo Zhao for creating the Representative Biodiversity Areas data layer used here. We also acknowledge the continuing work of those at AquaMaps and the IUCN Red List of Threatened Species in providing species distribution data. We thank Jenny Hillman for their comments and guidance and would like to thank Mark Costello and Ian Tuck for helpful discussion during the conception of this research.
Supplementary Material
The Supplementary Material for this article can be found online at: https://www.frontiersin.org/articles/10.3389/fmars.2022.826587/full#supplementary-material
References
Abesamis, R. A., Alcala, A. C., and Russ, G. R. (2006). How much does the fishery at Apo Island benefit from spillover of adult fish from the adjacent marine reserve? Fish. Bull. 104, 360–375.
Asaad, I., Lundquist, C. J., Erdmann, M. V., and Costello, M. J. (2018). Delineating priority areas for marine biodiversity conservation in the Coral Triangle. Biol. Conserv. 222, 198–211. doi: 10.3390/ijerph120201069
Baum, J. K., and Myers, R. A. (2004). Shifting baselines and the decline of pelagic sharks in the Gulf of Mexico. Ecol. Lett. 7, 135–145.
Beger, M., Harborne, A. R., Dacles, T. P., Solandt, J. L., and Ledesma, G. L. (2004). A framework of lessons learned from community-based marine reserves and its effectiveness in guiding a new coastal management initiative in the Philippines. Environ. Manag. 34, 786–801. doi: 10.1007/s00267-004-0149-z
Britten, G. L., Duarte, C. M., and Worm, B. (2021). Recovery of assessed global fish stocks remains uncertain. Proc. Natl. Acad. Sci. 118:e2108532118. doi: 10.1073/pnas.2108532118
Brum, F. T., Graham, C. H., Costa, G. C., Hedges, S. B., Penone, C., Radeloff, V. C., et al. (2017). Global priorities for conservation across multiple dimensions of mammalian diversity. Proc. Natl. Acad. Sci. 114, 7641–7646. doi: 10.1073/pnas.1706461114
Carvalho, N., Edwards-Jones, G., and Isidro, E. (2011). Defining scale in fisheries: small versus large-scale fishing operations in the Azores. Fish. Res. 109, 360–369.
Christensen, V., Coll, M., Piroddi, C., Steenbeek, J., Buszowski, J., and Pauly, D. (2014). A century of fish biomass decline in the ocean. Mar. Ecol. Progr. Ser. 512, 155–166.
Convention on Biological Diversity [CBD] (2010). 2010 Biodiversity Target. Available online at: https://www.cbd.int/2010-target [Accessed February 02, 2020]
Costanza, R. (1999). The ecological, economic, and social importance of the oceans. Ecol. Econom. 31, 199–213.
Costello, C., Ovando, D., Clavelle, T., Strauss, C. K., Hilborn, R., Melnychuk, M. C., et al. (2016). Global fishery prospects under contrasting management regimes. Proc. Natl. Acad. Sci. 113, 5125–5129. doi: 10.1073/pnas.1520420113
Davies, K., Murchie, A. A., Kerr, V., and Lundquist, C. J. (2018). The evolution of marine protected area planning in Aotearoa New Zealand: reflections on participation and process. Mar. Policy 93, 113–127. doi: 10.1016/j.marpol.2018.03.025
Delavenne, J., Metcalfe, K., Smith, R. J., Vaz, S., Martin, C. S., Dupuis, L., et al. (2012). Systematic conservation planning in the eastern English Channel: comparing the Marxan and Zonation decision-support tools. ICES J. Mar. Sci. 69, 75–83. doi: 10.1093/icesjms/fsr180
Devillers, R., Pressey, R. L., Grech, A., Kittinger, J. N., Edgar, G. J., Ward, T., et al. (2015). Reinventing residual reserves in the sea: are we favouring ease of establishment over need for protection? Aquat. Conserv. Mar. Freshw. Ecosyst. 25, 480–504. doi: 10.1002/aqc.2445
Di Franco, A., Thiriet, P., Di Carlo, G., Dimitriadis, C., Francour, P., Gutiérrez, N. L., et al. (2016). Five key attributes can increase marine protected areas performance for small-scale fisheries management. Sci. Rep. 6, 1–9. doi: 10.1038/srep38135
Dias, M. P., Oppel, S., Bond, A. L., Carneiro, A. P., Cuthbert, R. J., González-Solís, J., et al. (2017). Using globally threatened pelagic birds to identify priority sites for marine conservation in the South Atlantic Ocean. Biol. Conserv. 211, 76–84. doi: 10.1016/j.biocon.2017.05.009
Duan, H., Xia, S., Hou, X., Liu, Y., and Yu, X. (2019). Conservation planning following reclamation of intertidal areas throughout the Yellow and Bohai Seas, China. Biodivers. Conserv. 28, 3787–3801.
Duarte, C. M., Agusti, S., Barbier, E., Britten, G. L., Castilla, J. C., Gattuso, J. P., et al. (2020). Rebuilding marine life. Nature 580, 39–51.
Edgar, G. J., Stuart-Smith, R. D., Willis, T. J., Kininmonth, S., Baker, S. C., Banks, S., et al. (2014). Global conservation outcomes depend on marine protected areas with five key features. Nature 506, 216–220. doi: 10.1038/nature13022
Flanders Marine Institute (2019). Maritime Boundaries Geodatabase: maritime Boundaries and Exclusive Economic Zones (200NM), Version 11. Available online at: https://www.marineregions.org/. [Accessed November 18, 2020]
Friedlander, A. M., Golbuu, Y., Ballesteros, E., Caselle, J. E., Gouezo, M., Olsudong, D., et al. (2017). Size, age, and habitat determine effectiveness of Palau’s Marine Protected Areas. PLoS One 12:e0174787. doi: 10.1371/journal.pone.0174787
Froese, R., Winker, H., Coro, G., Demirel, N., Tsikliras, A. C., Dimarchopoulou, D., et al. (2018). Status and rebuilding of European fisheries. Mar. Policy 93, 159–170. doi: 10.1016/j.marpol.2018.04.018
Froese, R., Winker, H., Gascuel, D., Sumaila, U. R., and Pauly, D. (2016). Minimizing the impact of fishing. Fish Fish. 17, 785–802.
Giakoumi, S., McGowan, J., Mills, M., Beger, M., Bustamante, R., Charles, A., et al. (2018). Revisiting “success” and “failure” of marine protected areas: a conservation scientist perspective. Front. Mar. Sci. 5:223. doi: 10.3389/fmars.2018.00223
Greer, K., Zeller, D., Woroniak, J., Coulter, A., Winchester, M., Palomares, M. D., et al. (2019). Global trends in carbon dioxide (CO2) emissions from fuel combustion in marine fisheries from 1950 to 2016. Mar. Policy 107:103382. doi: 10.1016/j.marpol.2018.12.001
Grémillet, D., Ponchon, A., Paleczny, M., Palomares, M. L. D., Karpouzi, V., and Pauly, D. (2018). Persisting worldwide seabird-fishery competition despite seabird community decline. Curr. Biol. 28, 4009–4013. doi: 10.1016/j.cub.2018.10.051
Griffis, R., and Howard, J. (2013). “Oceans and Marine Resources in a Changing Climate A Technical Input to the 2013 National Climate Assessment” in 2013 National Climate Assessment - Oceans and Marine Resources. Eds R. Griffis and J. Howard. (Washington: Island Press).
Harrison, H. B., Williamson, D. H., Evans, R. D., Almany, G. R., Thorrold, S. R., Russ, G. R., et al. (2012). Larval export from marine reserves and the recruitment benefit for fish and fisheries. Curr. Biol. 22, 1023–1028. doi: 10.1016/j.cub.2012.04.008
Helson, J., Leslie, S., Clement, G., Wells, R., and Wood, R. (2010). Private rights, public benefits: industry-driven seabed protection. Mar. Policy 34, 557–566. doi: 10.1016/j.marpol.2009.11.002
Hicks, C. C., Cohen, P. J., Graham, N. A., Nash, K. L., Allison, E. H., D’Lima, C., et al. (2019). Harnessing global fisheries to tackle micronutrient deficiencies. Nature 574, 95–98. doi: 10.1038/s41586-019-1592-6
Hiddink, J. G., MacKenzie, B. R., Rijnsdorp, A., Dulvy, N. K., Nielsen, E. E., Bekkevold, D., et al. (2008). Importance of fish biodiversity for the management of fisheries and ecosystems. Fish. Res. 90, 6–8. doi: 10.1016/j.fishres.2007.11.025
Horton, T., Kroh, A., Ahyong, S., Bailly, N., Boyko, C. B., Brandão, S. N., et al. (2021). World Register of Marine Species (WoRMS). WoRMS Editorial Board. Available online at: http://www.marinespecies.org/index.php (accessed December 1, 2021).
IUCN (2016). Increasing Marine Protected Area Coverage for Effective Marine Biodiversity Conservation. Switzerland: IUCN.
IUCN (2021). The IUCN Red List of Threatened Species. Version 2021-3. Available online at: https://www.iucnredlist.org. Accessed on [13/01/2022]
Jacquet, J., and Pauly, D. (2008). Funding priorities: big barriers to small-scale fisheries. Conserv. Biol. 22, 832–835. doi: 10.1111/j.1523-1739.2008.00978.x
Jefferson, T., Costello, M. J., Zhao, Q., and Lundquist, C. J. (2021). Conserving threatened marine species and biodiversity requires 40% ocean protection. Biol. Conserv. 264:109368. doi: 10.1038/s41559-016-0040
Jenkins, C. N., and Van Houtan, K. S. (2016). Global and regional priorities for marine biodiversity protection. Biol. Conserv. 204, 333–339.
Jones, K. R., Klein, C. J., Grantham, H. S., Possingham, H. P., Halpern, B. S., Burgess, N. D., et al. (2020). Area requirements to safeguard Earth’s marine species. One Earth 2, 188–196. doi: 10.1002/ecy.3128
Kerwath, S. E., Winker, H., Götz, A., and Attwood, C. G. (2013). Marine protected area improves yield without disadvantaging fishers. Nat. Commun. 4, 1–6. doi: 10.1038/ncomms3347
Klein, C. J., Brown, C. J., Halpern, B. S., Segan, D. B., McGowan, J., Beger, M., et al. (2015). Shortfalls in the global protected area network at representing marine biodiversity. Sci. Rep. 5:17539. doi: 10.1038/srep17539
Le Port, A., Montgomery, J. C., Smith, A. N. H., Croucher, A. E., McLeod, I. M., and Lavery, S. D. (2017). Temperate marine protected area provides recruitment subsidies to local fisheries. Proc. R. Soc. B Biol. Sci. 284:20171300. doi: 10.1098/rspb.2017.1300
Lehtomäki, J., and Moilanen, A. (2013). Methods and workflow for spatial conservation prioritization using Zonation. Environ. Model. Softw. 47, 128–137.
Leleu, K., Remy-Zephir, B., Grace, R., and Costello, M. J. (2012). Mapping habitats in a marine reserve showed how a 30-year trophic cascade altered ecosystem structure. Biol. Conserv. 155, 193–201.
Lenihan, H. S., Gallagher, J. P., Peters, J. R., Stier, A. C., Hofmeister, J. K., and Reed, D. C. (2021). Evidence that spillover from Marine Protected Areas benefits the spiny lobster (Panulirus interruptus) fishery in southern California. Sci. Rep. 11, 1–9. doi: 10.1038/s41598-021-82371-5
Lewison, R. L., Crowder, L. B., Wallace, B. P., Moore, J. E., Cox, T., Zydelis, R., et al. (2014). Global patterns of marine mammal, seabird, and sea turtle bycatch reveal taxa-specific and cumulative megafauna hotspots. Proc. Natl. Acad. Sci. 111, 5271–5276. doi: 10.1073/pnas.1318960111
Lillebø, A. I., Pita, C., Rodrigues, J. G., Ramos, S., and Villasante, S. (2017). How can marine ecosystem services support the Blue Growth agenda? Mar. Policy 81, 132–142.
Lindegren, M., Holt, B. G., MacKenzie, B. R., and Rahbek, C. (2018). A global mismatch in the protection of multiple marine biodiversity components and ecosystem services. Sci. Rep. 8, 1–8. doi: 10.1038/s41598-018-22419-1
Link, J. S., and Watson, R. A. (2019). Global ecosystem overfishing: clear delineation within real limits to production. Sci. Adv. 5:eaav0474. doi: 10.1126/sciadv.aav0474
Lotze, H. K., and Worm, B. (2009). Historical baselines for large marine animals. Trends Ecol. Evol. 24, 254–262. doi: 10.1016/j.tree.2008.12.004
Lynham, J., Nikolaev, A., Raynor, J., Vilela, T., and Villaseñor-Derbez, J. C. (2020). Impact of two of the world’s largest protected areas on longline fishery catch rates. Nat. Commun. 11, 1–9. doi: 10.1038/s41467-020-14588-3
Meiri, S., and Chapple, D. G. (2016). Biases in the current knowledge of threat status in lizards, and bridging the ‘assessment gap’. Biol. Conserv. 204, 6–15.
McCauley, D. J., Pinsky, M. L., Palumbi, S. R., Estes, J. A., Joyce, F. H., and Warner, R. R. (2015). Marine defaunation: animal loss in the global ocean. Science. 347:1255641. doi: 10.1126/science.1255641
Miqueleiz, I., Bohm, M., Ariño, A. H., and Miranda, R. (2020). Assessment gaps and biases in knowledge of conservation status of fishes. Aquat. Conserv. Mar. Freshw. Ecosyst. 30, 225–236. doi: 10.1371/journal.pone.0211224
Moilanen, A., Franco, A. M., Early, R. I., Fox, R., Wintle, B., and Thomas, C. D. (2005). Prioritizing multiple-use landscapes for conservation: methods for large multi-species planning problems. Proc. R. Soc. B Biol. Sci. 272, 1885–1891. doi: 10.1098/rspb.2005.3164
Moilanen, A., Kujala, H., and Leathwick, J. R. (2009). “Chapter 15: the Zonation Framework and Software for Conservation Prioritization” in Spatial Conservation Prioritization: Quantitative Methods and Computational Tools. eds A. Moilanen, K. A. Wilson, and H. P. Possingham (Oxford: Oxford University Press). 196–209.
Moilanen, A., Leathwick, J. R., and Quinn, J. M. (2011). Spatial prioritization of conservation management. Conserv. Lett. 4, 383–393. doi: 10.1111/j.1755-263x.2011.00190.x
Moilanen, A., Pouzols, F. M., Meller, L., Veach, V., Arponen, A., Leppänen, J., et al. (2014). Zonation - Spatial Conservation Planning Methods and Software. Version 4. [User manual]. Finland: Edita.
Natural Earth (2019). 1:10 m Physical Vectors, Ocean, version 4.1.0. Available online at: https://www.naturalearthdata.com/downloads/10m-physical-vectors/10m-ocean [Accessed August 01, 2019]
O’Hara, C. C., Villaseñor-Derbez, J. C., Ralph, G. M., and Halpern, B. S. (2019). Mapping status and conservation of global at-risk marine biodiversity. Conserv. Lett. 12:e12651.
O’Leary, B. C., Winther-Janson, M., Bainbridge, J. M., Aitken, J., Hawkins, J. P., and Roberts, C. M. (2016). Effective coverage targets for ocean protection. Conserv. Lett. 9, 398–404.
Paleczny, M., Hammill, E., Karpouzi, V., and Pauly, D. (2015). Population trend of the world’s monitored seabirds, 1950-2010. PLoS One 10:e0129342. doi: 10.1371/journal.pone.0129342
Palomares, M. L. D., Froese, R., Derrick, B., Meeuwig, J. J., Nöel, S. L., Tsui, G., et al. (2020). Fishery biomass trends of exploited fish populations in marine ecoregions, climatic zones and ocean basins. Estuar. Coast. Shelf Sci. 243:106896. doi: 10.1016/j.ecss.2020.106896
Pauly, D., and Zeller, D. (2016). Catch reconstructions reveal that global marine fisheries catches are higher than reported and declining. Nat. Commun. 7:10244. doi: 10.1038/ncomms10244
Pauly, D., Zeller, D., and Palomares, M. L. D. (2020). Sea Around Us Concepts, Design and Data. Available online at: https://www.seaaroundus.org (accessed March 1, 2021).
Pikitch, E. K., Rountos, K. J., Essington, T. E., Santora, C., Pauly, D., Watson, R., et al. (2014). The global contribution of forage fish to marine fisheries and ecosystems. Fish Fish. 15, 43–64.
Pollnac, R., Christie, P., Cinner, J. E., Dalton, T., Daw, T. M., Forrester, G. E., et al. (2010). Marine reserves as linked social–ecological systems. Proc. Natl. Acad. Sci. 107, 18262–18265. doi: 10.1073/pnas.0908266107
Pompa, S., Ehrlich, P. R., and Ceballos, G. (2011). Global distribution and conservation of marine mammals. Proc. Natl. Acad. Sci. 108, 13600–13605. doi: 10.1073/pnas.1101525108
Rieser, A., Watling, L., and Guinotte, J. (2013). Trawl fisheries, catch shares and the protection of benthic marine ecosystems: has ownership generated incentives for seafloor stewardship? Mar. Policy 40, 75–83. doi: 10.1016/j.marpol.2012.12.028
Rife, A. N., Aburto-Oropeza, O., Hastings, P. A., Erisman, B., Ballantyne, F., Wielgus, J., et al. (2013). Long-term effectiveness of a multi-use marine protected area on reef fish assemblages and fisheries landings. J. Environ. Manag. 117, 276–283. doi: 10.1016/j.jenvman.2012.12.029
Roberts, C. M., McClean, C. J., Veron, J. E., Hawkins, J. P., Allen, G. R., McAllister, D. E., et al. (2002). Marine biodiversity hotspots and conservation priorities for tropical reefs. Science 295, 1280–1284. doi: 10.1126/science.1067728
Roberts, C. M., O’Leary, B. C., and Hawkins, J. P. (2020). Climate change mitigation and nature conservation both require higher protected area targets. Philos. Transac. R. Soc. B. 375:20190121. doi: 10.1098/rstb.2019.0121
Rowden, A. A., Stephenson, F., Clark, M. R., Anderson, O. F., Guinotte, J. M., Baird, S. J., et al. (2019). Examining the utility of a decision-support tool to develop spatial management options for the protection of vulnerable marine ecosystems on the high seas around New Zealand. Ocean Coast. Manag. 170, 1–16. doi: 10.1016/j.ocecoaman.2018.12.033
Russ, G. R., and Alcala, A. C. (1999). Management histories of Sumilon and Apo Marine Reserves, Philippines, and their influence on national marine resource policy. Coral Reefs 18, 307–319. doi: 10.1007/s003380050203
Sala, E., and Giakoumi, S. (2018). No-take marine reserves are the most effective protected areas in the ocean. ICES J. Mar. Sci. 75, 1166–1168. doi: 10.1093/icesjms/fsx059
Sala, E., Mayorga, J., Bradley, D., Cabral, R. B., Atwood, T. B., Auber, A., et al. (2021). Protecting the global ocean for biodiversity, food and climate. Nature 592, 397–402.
Sala, E., Mayorga, J., Costello, C., Kroodsma, D., Palomares, M. L., Pauly, D., et al. (2018a). The economics of fishing the high seas. Sci. Adv. 4:eaat2504. doi: 10.1126/sciadv.aat2504
Sala, E., Lubchenco, J., Grorud-Colvert, K., Novelli, C., Roberts, C., and Sumaila, U. R. (2018b). Assessing real progress towards effective ocean protection. Mar. Policy 91, 11–13. doi: 10.1016/j.marpol.2018.02.004
Schiller, L., Bailey, M., Jacquet, J., and Sala, E. (2018). High seas fisheries play a negligible role in addressing global food security. Sci. Adv. 4:eaat8351. doi: 10.1126/sciadv.aat8351
Selig, E. R., and Bruno, J. F. (2010). A global analysis of the effectiveness of marine protected areas in preventing coral loss. PLoS One 5:e9278. doi: 10.1371/journal.pone.0009278
Selig, E. R., Turner, W. R., Troëng, S., Wallace, B. P., Halpern, B. S., Kaschner, K., et al. (2014). Global priorities for marine biodiversity conservation. PLoS One 9:e82898. doi: 10.1371/journal.pone.0082898
Smith, A. D., Brown, C. J., Bulman, C. M., Fulton, E. A., Johnson, P., Kaplan, I. C., et al. (2011). Impacts of fishing low–trophic level species on marine ecosystems. Science 333, 1147–1150. doi: 10.1126/science.1209395
Stephenson, F., Hewitt, J. E., Torres, L. G., Mouton, T. L., Brough, T., Goetz, K. T., et al. (2021). Cetacean conservation planning in a global diversity hotspot: dealing with uncertainty and data deficiencies. Ecosphere 12:e03633.
Stralberg, D., Carroll, C., and Nielsen, S. E. (2020). Toward a climate-informed North American protected areas network: incorporating climate-change refugia and corridors in conservation planning. Conserv. Lett. 13:e12712.
Sumaila, U. R., Alder, J., and Keith, H. (2006). Global scope and economics of illegal fishing. Mar. Policy 30, 696–703.
Sumaila, U. R., Khan, A., Teh, L., Watson, R., Tyedmers, P., and Pauly, D. (2010). Subsidies to high seas bottom trawl fleets and the sustainability of deep-sea demersal fish stocks. Mar. Policy 34, 495–497. doi: 10.1016/j.marpol.2009.10.004
Sumaila, U. R., Lam, V. W., Miller, D. D., Teh, L., Watson, R. A., Zeller, D., et al. (2015). Winners and losers in a world where the high seas is closed to fishing. Sci. Rep. 5, 1–6. doi: 10.1038/srep08481
Sumaila, U. R., Zeller, D., Hood, L., Palomares, M. L. D., Li, Y., and Pauly, D. (2020). Illicit trade in marine fish catch and its effects on ecosystems and people worldwide. Sci. Adv. 6:eaaz3801. doi: 10.1126/sciadv.aaz3801
Swartz, W., Sala, E., Tracey, S., Watson, R., and Pauly, D. (2010). The spatial expansion and ecological footprint of fisheries (1950 to present). PLoS One 5:e15143. doi: 10.1371/journal.pone.0015143
Thrush, S. F., Ellingsen, K. E., and Davis, K. (2016). Implications of fisheries impacts to seabed biodiversity and ecosystem-based management. ICES J. Mar. Sci. 73, i44–i50. doi: 10.1038/s41598-017-04715-4
Tickler, D., Meeuwig, J. J., Palomares, M. L., Pauly, D., and Zeller, D. (2018). Far from home: distance patterns of global fishing fleets. Sci. Adv. 4:eaar3279. doi: 10.1126/sciadv.aar3279
Tittensor, D. P., Mora, C., Jetz, W., Lotze, H. K., Ricard, D., Berghe, E. V., et al. (2010). Global patterns and predictors of marine biodiversity across taxa. Nature 466, 1098–1101. doi: 10.1038/nature09329
Townsend, M., Davies, K., Hanley, N., Hewitt, J. E., Lundquist, C. J., and Lohrer, A. M. (2018). The challenge of implementing the marine ecosystem service concept. Front. Mar. Sci. 5:359. doi: 10.3389/fmars.2018.00359
Ulate, K., Alcoverro, T., Arthur, R., Aburto-Oropeza, O., Sánchez, C., and Huato-Soberanis, L. (2018). Conventional MPAs are not as effective as community co-managed areas in conserving top-down control in the Gulf of California. Biol. Conserv. 228, 100–109. doi: 10.1016/j.biocon.2018.09.033
UNEP-WCMC and IUCN (2021). Protected Planet: the World Database on Protected Areas (WDPA) and World Database on Other Effective Area-based Conservation Measures (WD-OECM). Cambridge: UNEP-WCMC and IUCN.
Vandeperre, F., Higgins, R. M., Sánchez-Meca, J., Maynou, F., Goñi, R., Martín-Sosa, P., et al. (2011). Effects of no-take area size and age of marine protected areas on fisheries yields: a meta-analytical approach. Fish Fish. 12, 412–426. doi: 10.1111/j.1467-2979.2010.00401.x
Veloz, S., Salas, L., Altman, B., Alexander, J., Jongsomjit, D., Elliott, N., et al. (2015). Improving effectiveness of systematic conservation planning with density data. Conserv. Biol. 29, 1217–1227. doi: 10.1111/cobi.12499
Virtanen, E. A., Viitasalo, M., Lappalainen, J., and Moilanen, A. (2018). Evaluation, gap analysis, and potential expansion of the Finnish marine protected area network. Front. Mar. Sci. 5:402. doi: 10.3389/fmars.2018.00402
Visalli, M. E., Best, B. D., Cabral, R. B., Cheung, W. W., Clark, N. A., Garilao, C., et al. (2020). Data-driven approach for highlighting priority areas for protection in marine areas beyond national jurisdiction. Mar. Policy 122:103927. doi: 10.1016/j.marpol.2020.103927
Wagner, D., Friedlander, A. M., Pyle, R. L., Brooks, C. M., Gjerde, K. M., and Wilhelm, T. A. (2020). Coral reefs of the high seas: hidden biodiversity hotspots in need of protection. Front. Mar. Sci. 7:776. doi: 10.3389/fmars.2020.567428
Watson, A. J., Schuster, U., Shutler, J. D., Holding, T., Ashton, I. G., Landschützer, P., et al. (2020). Revised estimates of ocean-atmosphere CO 2 flux are consistent with ocean carbon inventory. Nat. Commun. 11, 1–6. doi: 10.1038/s41467-020-18203-3
Watson, R. A., and Tidd, A. (2018). Mapping nearly a century and a half of global marine fishing: 1869–2015. Mar. Policy 93, 171–177. doi: 10.1016/j.marpol.2018.04.023
Westlund, L., and Zelasney, J. (2019). Securing Sustainable Small-scale Fisheries: sharing Good Practices from Around the World. Rome: FAO. I–182.
White, C., and Costello, C. (2014). Close the high seas to fishing? PLoS Biol. 12:e1001826. doi: 10.1371/journal.pbio.1001826
World Parks Congress (2014). A Strategy of Innovative Approaches and Recommendations to Enhance Implementation of Marine Conservation in the Next Decade. Sydney: IUCN World Parks Congress.
Worm, B., Barbier, E. B., Beaumont, N., Duffy, J. E., Folke, C., Halpern, B. S., et al. (2006). Impacts of biodiversity loss on ocean ecosystem services. Science 314, 787–790.
Worm, B., Sandow, M., Oschlies, A., Lotze, H. K., and Myers, R. A. (2005). Global patterns of predator diversity in the open oceans. Science 309, 1365–1369. doi: 10.1126/science.1113399
Yamasaki, A. (2002). Establishment of preserved area for snow crab Chionoecetes opilio and consequent recovery of the crab resources. Fish. Sci. 68, 1699–1702. doi: 10.2331/fishsci.68.sup2_1699
Yan, H. F., Kyne, P. M., Jabado, R. W., Leeney, R. H., Davidson, L. N., Derrick, D. H., et al. (2021). Overfishing and habitat loss drive range contraction of iconic marine fishes to near extinction. Sci. Adv. 7:eabb6026. doi: 10.1126/sciadv.abb6026
Young, C. N., and Carlson, J. K. (2020). The biology and conservation status of the oceanic whitetip shark (Carcharhinus longimanus) and future directions for recovery. Rev. Fish Biol. Fish. 30, 293–312.
Zhao, Q., Stephenson, F., Lundquist, C., Kaschner, K., Jayathilake, D., and Costello, M. J. (2020). Where Marine Protected Areas would best represent 30% of ocean biodiversity. Biol. Conserv. 244:108536. doi: 10.1016/j.biocon.2020.108536
Keywords: fisheries, biodiversity, IUCN Red List, ocean sustainability, marine protected areas (MPAs), conservation planning
Citation: Jefferson T, Palomares MLD and Lundquist CJ (2022) Safeguarding Seafood Security, Marine Biodiversity and Threatened Species: Can We Have Our Fish and Eat It too? Front. Mar. Sci. 9:826587. doi: 10.3389/fmars.2022.826587
Received: 01 December 2021; Accepted: 28 January 2022;
Published: 17 February 2022.
Edited by:
Leslie New, Ursinus College, United StatesReviewed by:
Jean-Noel Druon, European Commission, Joint Research Centre, BelgiumAlfonso Aguilar-Perera, Universidad Autónoma de Yucatán, Mexico
Copyright © 2022 Jefferson, Palomares and Lundquist. This is an open-access article distributed under the terms of the Creative Commons Attribution License (CC BY). The use, distribution or reproduction in other forums is permitted, provided the original author(s) and the copyright owner(s) are credited and that the original publication in this journal is cited, in accordance with accepted academic practice. No use, distribution or reproduction is permitted which does not comply with these terms.
*Correspondence: Tamlin Jefferson, dGplZjYzMUBhdWNrbGFuZHVuaS5hYy5ueg==