Unraveling Salinity Extreme Events in Coastal Environments: A Winter Focus on the Bay of Brest
 Coline Poppeschi1*
  Guillaume Charria1
  Eric Goberville2
  Peggy Rimmelin-Maury3
  Nicolas Barrier4
  Sébastien Petton5
  Maximilian Unterberger1 Emilie Grossteffan3 Michel Repecaud6 Loïc Quéméner6
  Sébastien Theetten1
  Jean-François Le Roux1
  Paul Tréguer7
- 1Laboratoire d’Océanographie Physique et Spatiale (LOPS), IUEM, CNRS, IRD, Ifremer, Université de Brest, Brest, France
- 2Unité Biologie des Organismes et Ecosystèmes Aquatiques (BOREA), Muséum National d’Histoire Naturelle, CNRS, IRD, Sorbonne Université, Université de Caen Normandie, Université des Antilles, Paris, France
- 3UMS 3113, OSU-Institut Universitaire Européen de la Mer (IUEM), Plouzané, France
- 4CNRS, Ifremer, IRD, MARBEC, University of Montpellier, Sète, France
- 5CNRS, IRD, LEMAR, Ifremer, Université de Brest, Argenton, France
- 6REM/RDT/DCM, Ifremer, Centre de Brest, Plouzané, France
- 7CNRS, IRD, Ifremer, Institut Universitaire Européen de la Mer, LEMAR, Université de Brest, Plouzané, France
Extreme weather events affect coastal marine ecosystems. The increase in intensity and occurrence of such events drive modifications in coastal hydrology and hydrodynamics. Here, focusing on the winter period (from December to March), we investigated multi-decade (2000–2018) changes in the hydrological properties of the Bay of Brest (French Atlantic coast) as an example of the response of a semi-enclosed bay to extreme weather episodes and large-scale atmospheric circulation patterns. The relationships between extreme weather events and severe low salinity conditions (as a proxy for changes in water density) were investigated using high-frequency in situ observations and high-resolution numerical simulations. The identification of intense episodes was based on the timing, duration, and annual occurrence of extreme events. By examining the interannual variability of extreme low salinity events, we detect a patent influence of local and regional weather conditions on atmospheric and oceanic circulation patterns, precipitation, and river runoff. We revealed that low salinity events in Brittany were controlled by large-scale forcings: they prevailed during the positive phase of the North Atlantic Oscillation and periods of low occurrences of the Atlantic Ridge weather regime. The increase in severe storms observed in western France since 2010 has led to a doubling of the occurrence and duration of extreme low salinity events in Brittany.
Introduction
Although coastal zones–including continental shelves–cover only a small fraction of the global ocean (about 8%; Yool and Fasham, 2001), they are key economical (e.g., 90% of the fish catch) and ecological (e.g., 30% of the global primary productivity; Wollast, 1998) regions. Coastal ecosystems occur in a transition zone, between land and open ocean, under environmental and anthropogenic pressures. How coastal ecosystems are influenced by climate at local, regional and global scales is therefore a crucial question to assess in order to predict their possible response to changing environmental conditions, and to determine the impact of human expansion (Cloern et al., 2016).
Strong and significant relationships between atmospheric circulation and precipitation patterns have already been detected over the North Atlantic Ocean. Changes in large-scale atmospheric variability over the North Atlantic modulate precipitation patterns and hydrological processes in western Europe (Bojarriu and Reverdin, 2002; Msadek and Frankignoul, 2009), which in turn can modify both the properties and dynamics of the water column in coastal ecosystems (Goberville et al., 2010). Previous studies have demonstrated that air masses, that circulate over the North Atlantic Ocean, significantly influence the exchanges between the ocean and the atmosphere, with putative consequences on long-term trends in sea surface waters (such as alternating between warming and cooling episodes) and changes in salinity in coastal and estuarine ecosystems (Chaalali et al., 2013). Investigating the relationships between changes in the regional physico-chemical environment and large-scale hydro-climatic forcing, Goberville et al. (2014) highlighted the influence of the Atlantic Multidecadal Oscillation and the East Atlantic Pattern (EAP) on long-term (1958–2007) changes in the North-East Atlantic and the North Sea ecosystems. In western Europe, Tréguer et al. (2014) and Charria et al. (2020) demonstrated the connection between changes in coastal waters of western Europe in winter and large-scale hydro-climate processes, as well as the influence of local factors, such as river discharge, during the 1998–2013 period.
Although the influence of climate variability on long-term trends and abrupt state transitions in coastal ecosystems is now well documented, changes in large-scale atmospheric and oceanic circulation patterns can also trigger “hazards” or extreme events (Mann et al., 2017; Shi et al., 2017; Trouet et al., 2018) with direct consequences for species and communities (Thibault and Brown, 2008; Van de Pol et al., 2010; Smale and Wernberg, 2013; Wernberg et al., 2013; Seuront et al., 2019), and for socio-economic, human health and lifestyle status (Bell et al., 2018). Since the second half of the 20th century, an increase in the frequency and the magnitude of heat waves, droughts, storms, or floods has been observed (Jentsch and Beierkuhnlein, 2008; Smith, 2011; Coumou and Rahmstorf, 2012; IPCC et al., 2012, 2019). Over the last decade, heat waves have increased in duration (Seuront et al., 2019) and frequency (a doubling in recent years, Christidis et al., 2015). Storm surges have already impacted 55% of the world coastlines and with increasing frequency (Mentaschi et al., 2017; Marcos et al., 2019). Extreme precipitation episodes since the early 2000s have been related to the human influence on climate (Coumou and Rahmstorf, 2012), inducing unprecedented extreme river flooding and wave conditions such as were encountered during the winter 2013–2014 (Matthews et al., 2014; Schaller et al., 2016; Thompson et al., 2017).
Winter is a conducive season to the quantify the links between physical ocean processes and climate variability in coastal ecosystems of western Europe (Tréguer et al., 2014; Charria et al., 2020). Winter is often referred as the “dormant season,” in contrast to the productive spring bloom period (Zingone et al., 2010), assuming that biological activity–especially that involving marine phytoplankton–is reduced. Nutrient levels are therefore maximum during this period (Del Amo et al., 1997). Continental and marine hydrodynamics are energetically at their maximum during winter (Margalef, 1978), with high wind speeds, large precipitation rate and important freshwater inputs from land to coastal areas. In western Europe, winter storms are one of the most typical meteorological-hydrological extreme events, leading to extreme precipitation, intense winds and wave heights (Leckebusch et al., 2006).
Open or semi-enclosed bays of western Europe can react in different ways to extreme weather events. By investigating recent changes in the physical characteristics of the Bay of Brest (a semi-enclosed bay located around 48.3°N, western France), we aimed to identify, document and understand the impacts of winter extreme weather events on the properties of coastal waters from 2000 to 2018. We used long-term in situ observations and numerical simulations, with a special emphasis on salinity as a key indicator of water density in coastal regions under river plume influence. Considering river runoffs, precipitation, currents, and wind patterns, we characterised the signature of extreme weather events on ocean salinity in the Bay of Brest. We then explored the interannual variability in extreme low salinity events, in relationship to large-scale hydro-climate processes.
Materials and Methods
Study Area
The Bay of Brest, in western Europe, is a shallow macro-tidal ecosystem: more than 50% of the bay is shallower than 5 m depth, with a maximum depth around 50 m (Auffret, 1983). The Bay of Brest is influenced by freshwater inflows from three rivers: the Aulne, Elorn, and Mignonne rivers with an average winter flow of 54, 10, and 3 m3 s–1, respectively. With a watershed of 1,842 km2 and providing more than 63% of the freshwater supply, the Aulne River is the dominant source of the freshwater inflows to the Bay of Brest (Auffret, 1983; Frère et al., 2017). The Elorn and Mignonne rivers account for less than 15% of the inflows. The watersheds of western Brittany consist mainly of impermeable rocks and soils (i.e., layers through which water cannot pass) and winter precipitation directly influences river discharges (Tréguer et al., 2014).
Environmental in situ Observation Data
Environmental data were collected from long-term in situ monitoring stations (see Figure 1 for the location of sampling sites and Table 1 for their characteristics).
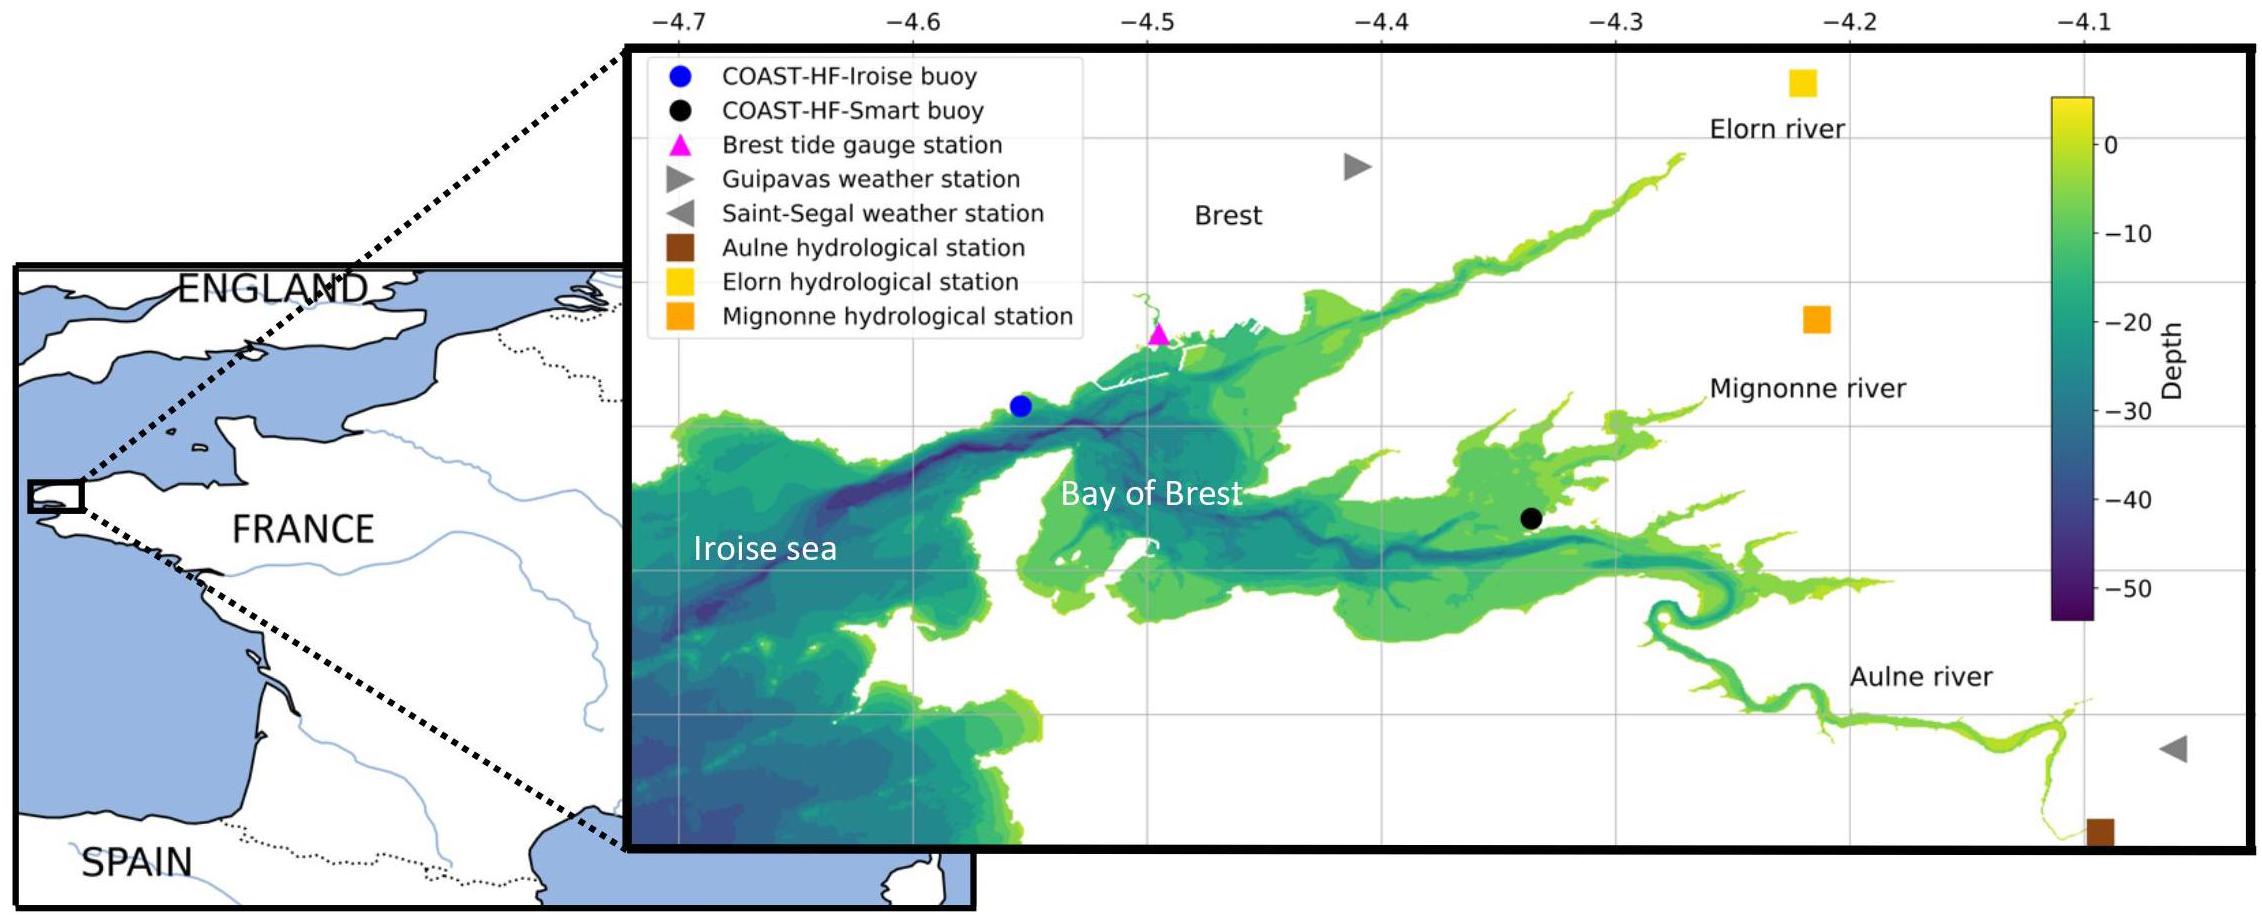
Figure 1. The study area (black square) is located in the western part of France. The COAST-HF-Iroise buoy (blue circle) is at the interface between the Iroise Sea (Atlantic) and the Bay of Brest. The COAST-HF-Smart (black circle) is more inland, in the eastern part of the Bay of Brest. The Brest tide gauge station (pink triangle), and weather (grey triangles) and hydrological (coloured squares) stations are indicated.
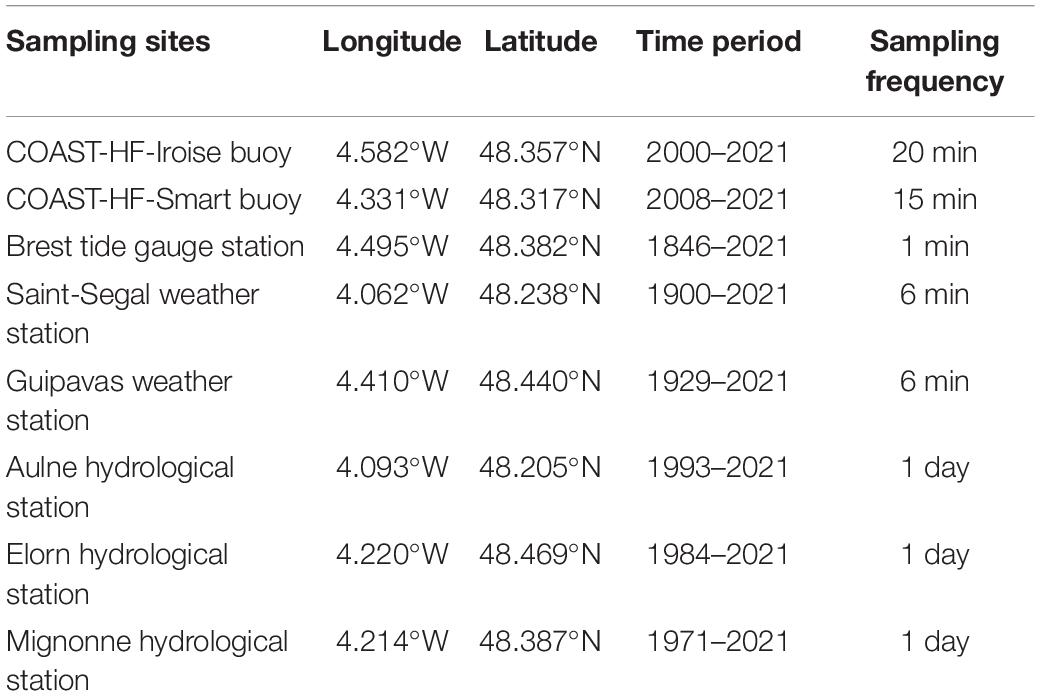
Table 1. Locations and characteristics of the in situ sampling sites.
COAST-HF-Iroise (Rimmelin-Maury et al., 2020) and COAST-HF-Smart (Petton et al., 2020a) are automated moored buoys that measure a wide range of environmental parameters (temperature, salinity, turbidity, dissolved oxygen concentration, fluorescence, and pCO2/pH). Salinity is derived from a conductivity sensor (accuracy ± 0.03 psu). Measurements are taken at 2 m depth for the COAST-HF-Iroise buoy and at 50 cm over the bottom sediment for the COAST-HF-Smart buoy. The COAST-HF-Iroise buoy is located at the interface between the Bay of Brest and the Atlantic Ocean (Iroise Sea) where fresh and marine waters mix. The depth of the mooring site ranges from 5 to 12 m, depending on the tide (Blain et al., 2004). The COAST-HF-Smart buoy is located in the eastern part of the Bay of Brest to monitor the land-sea continuum. The mooring site is located in a shallow embayment with a maximum depth of 8 m and receives the freshwater inputs from the Mignonne River (Petton et al., 2020a). December to March data were analysed from 2000 to 2018. All data are available on https://doi.org/10.17882/74004 (Rimmelin-Maury et al., 2020) or www.coriolis-cotier.org/ and the two high-frequency1 monitoring buoys are part of the French COAST-HF national observation network2 (Cocquempot et al., 2019; Farcy et al., 2019; Répécaud et al., 2019).
To assess the impact of freshwater inputs on salinity changes, we used daily flows of the three main rivers, measured daily by the regional water authority Agence de l’eau Loire-Bretagne3. Because the sampling stations are not located at the outlet, daily flows were normalised by the total area of the watersheds to be representative (Figure 1).
Precipitation data were retrieved from two weather stations from the Météo-France observation network: Saint-Ségal and Guipavas4 (Figure 1). No differences were observed between the two weather stations (less than 0.01 mm, with no temporal lag), supporting that precipitation patterns were consistent over the region during the 2000–2018 period. Therefore, we only considered the Guipavas station in our study.
Numerical Model Simulation Data
Numerical simulations can help to better understand the processes involved and to evaluate the ocean hydrodynamics when in situ observations are lacking. To cover the 2000–2018 period, two numerical simulations were used: the MARS3D–BACH (BiscAy Channel; modelled fields available from 2001 to 2012) and the MARS3D–MARC (Modelling and Analysis for Coastal Research; modelled fields available from 2010 to 2018) simulations. These realistic simulations are based on the primitive equation MARS3D model (3D hydrodynamical Model for Application at Regional Scale; Lazure and Dumas, 2008), developed by French Institute for Research and Exploitation of the Sea (IFREMER). The MARS3D–BACH and MARS3D–MARC simulations are thoroughly described in Theetten et al. (2017); Charria et al. (2017), and Petton et al. (2020b) and were validated by Charria et al. (2017) and Petton et al. (2020b).
Briefly, they differ mainly in their spatial resolution and how they were forced by atmospheric forcings. The horizontal and vertical resolutions of the MARS3D–BACH simulation were 1 km and 100 vertical sigma levels, respectively. The MARS3D–BACH simulation was carried out for the 2001–2012 period (i.e., 11 years) with daily average outputs, using the ERA-Interim simulation [reanalysis produced by the European Centre for Medium-Range Weather Forecasts (ECMWF); Berrisford et al., 2011] for atmospheric forcings. The DRAKKAR global configuration ORCA12_L46-MJM88 was used for the open boundary and initial conditions (Molines et al., 2014).
For the MARS3D–MARC simulation, the horizontal and vertical resolutions were 50 m and 20 vertical sigma levels, respectively. The simulation was carried out from January 2010 to July 2018 (i.e., 8 years) and produced instantaneous fields every 5 min. Atmospheric forcings were extracted from an analysis of the Applications from Research to Operational Mesoscale (AROME, 1 km resolution; Ducrocq et al., 2005) model provided by Météo-France. Initial salinity conditions originated from another simulation using the MARS3D model (Caillaud et al., 2016).
Here, we compared these simulations with in situ observations by extracting a model grid point as close as possible to the COAST-HF-Iroise measurement site: at 4.551°W, 48.357°N for MARS3D–BACH and at 4.546°W, 48.354°N for MARS3D–MARC.
Large-Scale Atmospheric Weather Regime Data
To evaluate the link between Bay of Brest hydrodynamics (including extreme low salinity events) and atmospheric circulation, we investigated four weather regimes associated with surface pressure, wind, air-temperature and precipitation anomalies (Barrier, 2013) and which represent the main large-scale atmospheric forcings that act in western Europe (Cassou et al., 2011; Barrier et al., 2014; Tréguer et al., 2014).
The North Atlantic Oscillation (NAO) describes the basin-scale gradient of atmospheric pressures over the North Atlantic between the high pressures centred on the subtropical Atlantic and the low pressures over Iceland (Hurrell et al., 2001). The positive phase (NAOp) induces warm and rainy winters in western Europe and is associated with extreme meteorological storm events. The negative phase (NAOn) induces cold and dry winters in western Europe (Barrier et al., 2014). Using the weather regimes to describe the NAO emphasises the asymmetry between the two phases, because they cannot be superimposed.
The Atlantic Ridge (AR) is directly related to the negative phase of the EAP and represents a blocking weather regime (high-pressure wind in Europe) with negative pressure anomalies around 60°N–20°E, and positive ones around 50°N–25°W. The AR brings cold temperature anomalies over western Europe and precipitation during the winter.
The Scandinavian Blocking (BLK) regime shows a region of negative (positive) sea-level pressure anomalies over southern Greenland (northern Europe), which are associated with a northward displacement of winds at 20°W dry weather (low precipitation) conditions in northern Europe.
Data Analysis
To identify low salinity extreme events that occurred in the Bay of Brest, we focused on the winter period (December to March) from 2000 to 2018. We developed a data processing chain that first identifies and filters tides. We then detected extreme low salinity events and analysed the relationship with precipitation, river runoffs and atmospheric weather regimes.
The Bay of Brest is governed by a strong tidal regime with a tidal range of about 6 m. During the ebb tide, freshwater accumulates in the bay from river water flowing to the open ocean; seawater inflow from the Iroise Sea is observed during the flood tide. To detect a freshwater signature at the COAST-HF-Iroise buoy, several tidal cycles are necessary. The lag between river discharge and its detection at the sampling station is mainly modulated by the tidal amplitude and phase (Frère et al., 2017). Water masses at the COAST-HF-Iroise buoy mainly represent oceanic water during high tides and inland water at low tides. To characterise the extreme low salinity events in the Bay of Brest, we therefore considered low tide periods. Due to the 20-min measurement period of the COAST-HF-Iroise buoy and the water mass inertia, salinity time series were constructed by computing, for each selected observation, the values recorded 20 min before and 40 min after each low tide cycle.
An extreme event can refer to a value that exceeds a threshold determined numerically, experimentally, graphically or arbitrarily (e.g., expert judgement). Here, we used the percentile method to identify extreme episodes: an extreme event was defined when exceeding the percentile threshold. For example, Wan Zin et al. (2010) used the 95th percentile to detect extreme daily precipitation events, but a 10th–90th percentile interval was used by Barnett et al. (2006) to investigate changes in atmospheric CO2. Here, we tested three threshold values (10th, 15th, and 20th percentiles) and determined the 15th percentile as the best compromise between sensitivity and precision to detect extreme low salinity events (Table 2). Finally, we considered a minimum duration of a full M2 lunar semi-diurnal tidal cycle (i.e., 12 h 25 min 12 s) for an extreme event, to avoid double detection of a single episode.
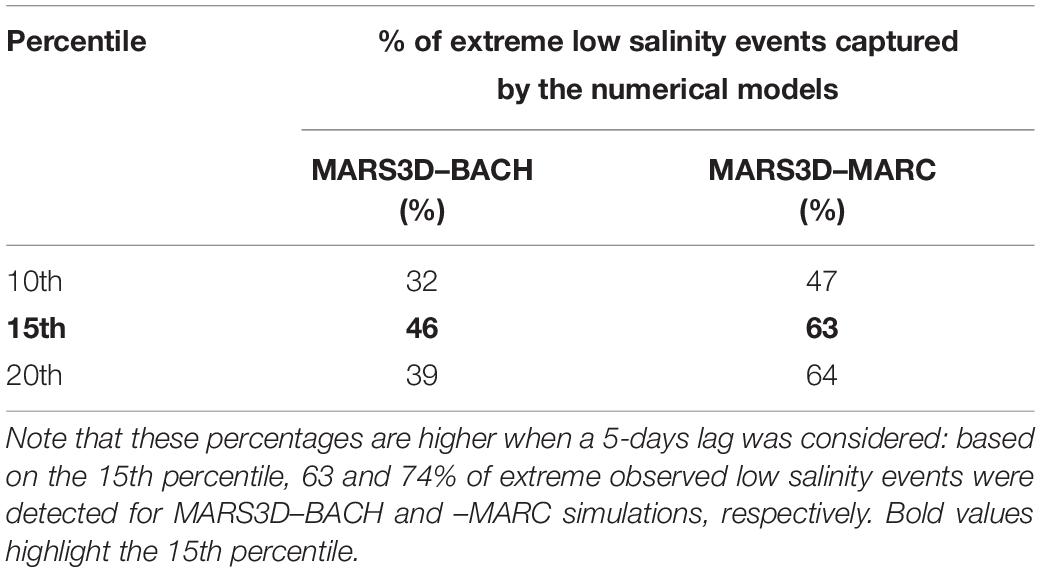
Table 2. Percentage of detection of extreme low salinity events (identified from in situ observations) in model simulations as a function of a percentile threshold.
The relationship between low salinity events, precipitation and rivers flows was assessed by estimating the time scales of the processes that took place in the Bay of Brest. During the winter period, a peak in river discharge systematically appeared around 24 h after a peak in precipitation. Direct evaporation and evapotranspiration are negligible processes in winter compared with the influence of precipitation (Tréguer et al., 2014). Following previous numerical simulations (Petton et al., 2020b), we used the Constituent-oriented Age and Residence time Theory (CART5) to estimate the influence of precipitation on water masses of the Bay of Brest: the effect of flooding on low salinity extreme events is visible about 12 days after a storm event (Frère et al., 2017; Petton et al., 2020b). Based on the most intense precipitation period of 2000–2018, i.e., the winter 2013–2014 (Petton et al., 2020b), we found that water residence times in the Bay of Brest ranges from 7 to 25 days (not shown). This study showed that when peaks of flow occur (>200 m3 s–1), the water age is always less than 14 days. We therefore used a maximum time lag of 14 days to determine whether precipitation had an effect on low salinity extreme events.
To explore the link with changes in large-scale atmospheric circulation, we used daily atmospheric Sea Level Pressure Anomalies (SLPA) from the ERA-5 reanalysis (Copernicus Climate Change Service, 2017) to calculate the daily occurrences of the four weather regimes. For each extreme event, the Euclidian distance between the ERA-5 SLPA and the centroids of the four winter weather regimes (i.e., mean SLPA associated with each weather regime) was computed and the regime that minimised the distance was assigned. To highlight the relationship between daily SLPA and the four weather regimes, daily spatial correlations were then computed and represented using the Kernel Density Estimation (KDE) method (Turlach, 1993; Yang et al., 2018), a non-parametric approach to estimate the probability density functions of SLPA correlations. A Gaussian kernel function was used to smooth the probability density function and to obtain the distribution of correlations for (1) the winter period and for (2) pre-extreme event periods (i.e., 14 days). Finally, Pearson correlation coefficients between winter precipitation and the occurrence of winter weather regimes were computed.
Results
Detection and Characterisation of Extreme Low Salinity Events
The observed in situ salinity, which ranged from 21 to 35.8 at COAST-HF-Iroise and from 5 to 35.1 at COAST-HF-Smart, exhibited a seasonal cycle with higher values in summer than in winter due to low river runoffs. In winter, salinity decreased, with peaks of low salinity for short durations (26 at COAST-HF-Iroise and 15 at COAST-HF-Smart; Figure 2). These peaks, defined as extreme low salinity events, were threshold dependent. Using the 15th percentile, the thresholds of salinity were 32.59 for in situ observations at COAST-HF-Iroise, 33.3 and 33.9 for the BACH and MARC simulations at the same point. Numerical simulations allowed us to identify 46% (MARS3D–BACH) and 63% (MARS3D–MARC) of the in situ observed extreme events. Note that the 15th percentile showed the best detection rate (Table 2). At the COAST-HF-Smart buoy, the threshold was lower (equal to 23.73) due to its location close to the Aulne river estuary.
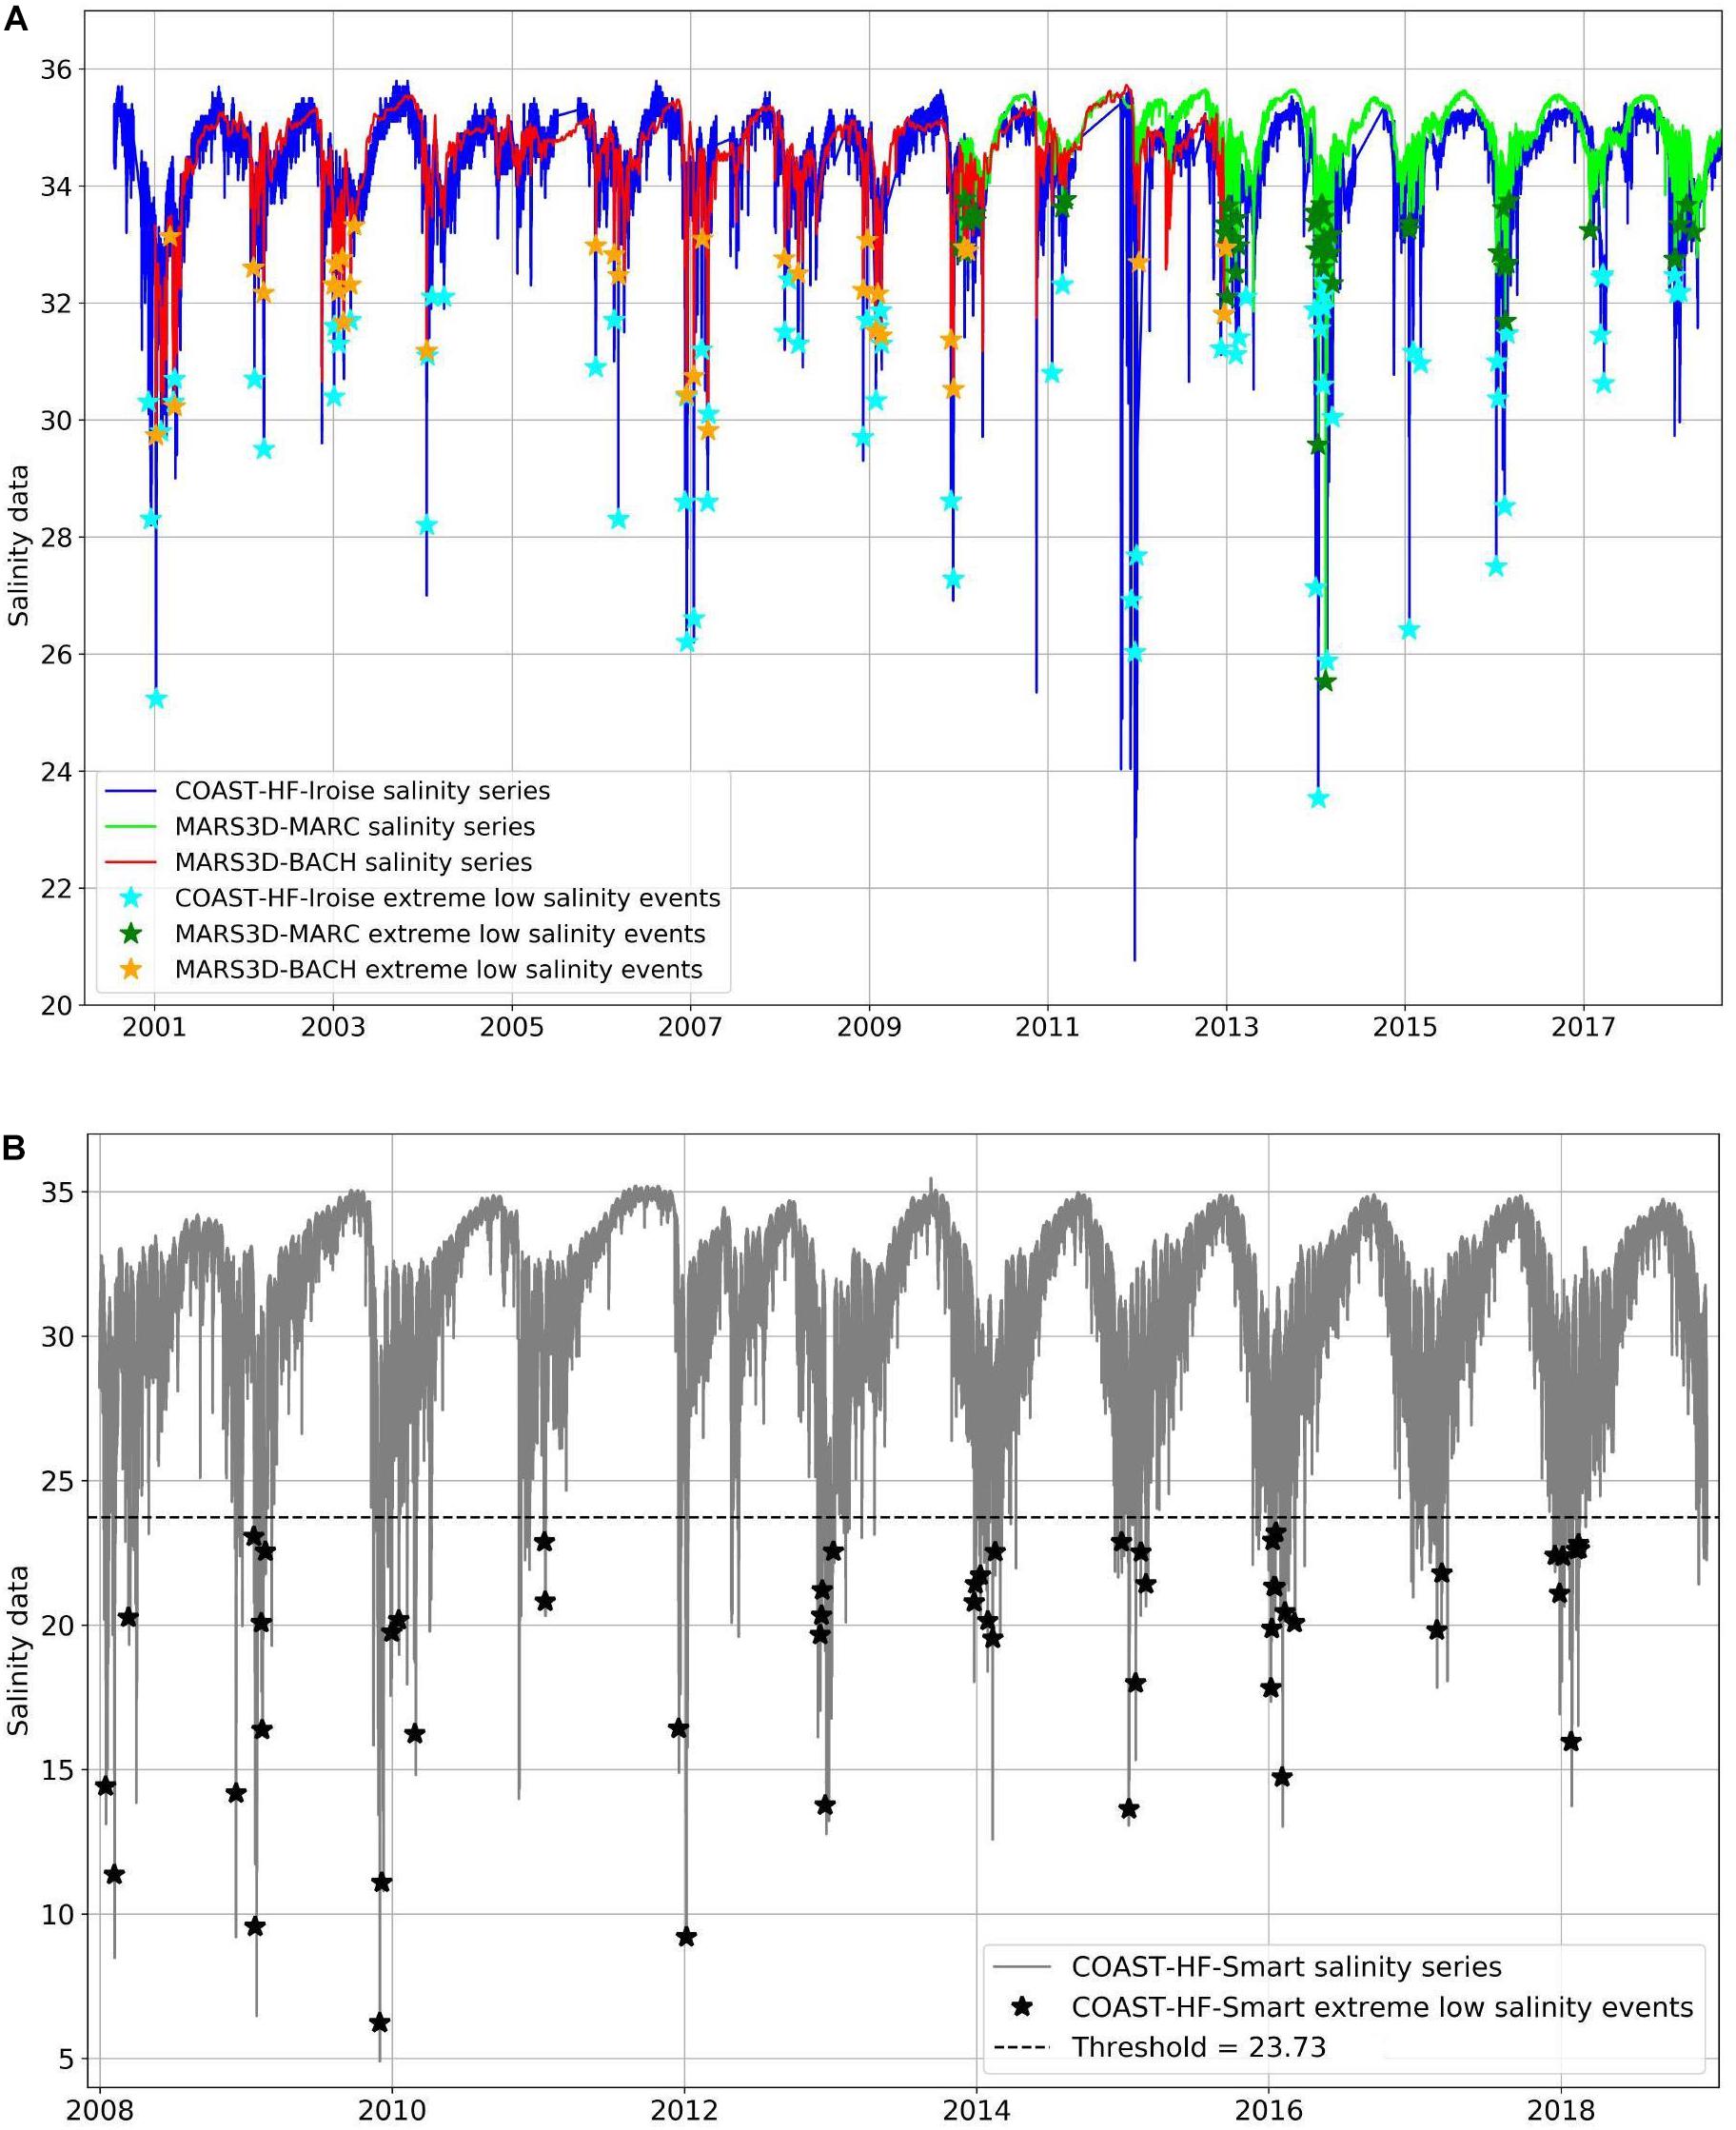
Figure 2. Time series of salinity and detected extreme low salinity events indicated with stars for (A) the observed data at COAST-HF-Iroise buoy (in blue) and the modelled data of the MARS3D–BACH (2001–2013, in red) and the MARS3D–MARC (2010-mid-2018, in green) simulations and (B) the observed data at the COAST-HF-Smart buoy (in grey). The dashed line represents the threshold salinity value of 23.73 determined from the percentile method.
When analysing in situ measurements (Figure 2), we detected 46 (COAST-HF-Iroise) and 52 (COAST-HF-Smart) extreme low salinity events over the common sampling period (2008–2018). From 2000 to 2018, 72 events were reported at COAST-HF-Iroise, i.e., an average occurrence of four events per winter. For both in situ datasets, we found a mean duration of the extreme low salinity events of about 2–3 days (Table 3), the maximum duration of an event being 27 days. The same number of events is not exactly similar due to differences in: amplitude, duration and lack of in situ data. Then, in some cases, observed in situ events are not detected in modelled time series due to modelled less intense events. Modelled events can also be too short in the simulation to be identified as events. Missing observations can explain modelled detected events not observed.
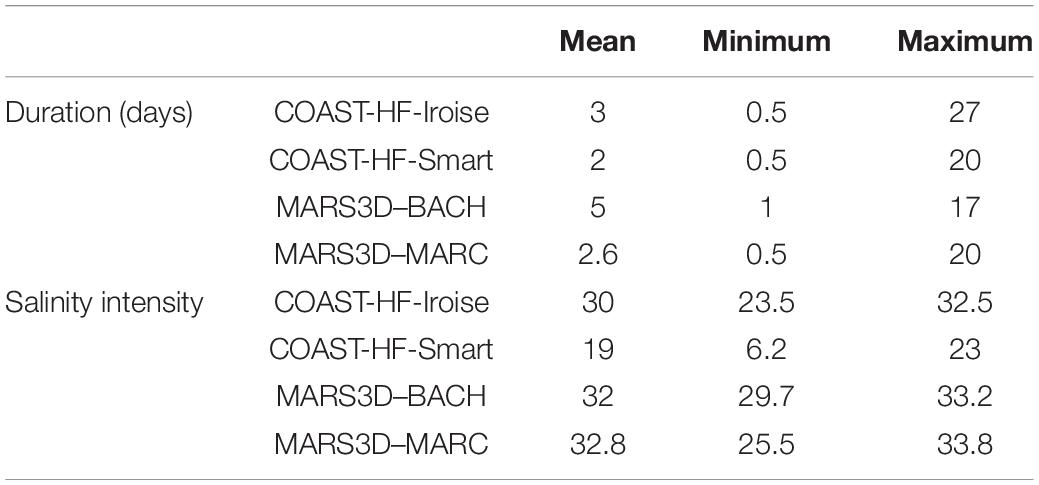
Table 3. Key characteristics of the observed and simulated events.
To explore the dynamics during periods with missing observations, model simulations are essential. We therefore compared in situ dataset between the COAST-HF-Iroise buoy and the MARS3D–BACH and MARS3D–MARC simulations. We reproduced the seasonal cycle well with the MARS3D–BACH simulation, with both and increase in salinity from March to September and a decrease during autumn and winter (Figure 2A); we also obtained similar intensity signals. The MARS3D–MARC simulation also reproduced the salinity seasonal cycle well, but salinity was overestimated in summer (Figure 2A), most likely because of the use of different forcing parameters in both simulations. Winter salinity was not affected, however. During extreme low salinity events, and for both simulations, modelled minimum values were higher than minimum in situ values (29.7 and 25.5 versus 23.5 at COAST-HF-Iroise; Table 3). The MARS3D–BACH simulation reproduced 78% (32 of 41) of the observed events over the 2001–2012 period. While 35 extreme salinity events were observed from 2010 to 2018, we modelled 46 events from the MARS3D–MARC simulation. This supports the use of the two numerical simulations, in combination, as an alternative to complete in situ observations and to better characterise extreme events.
By applying this analysis, 72 extreme low salinity events were detected at the COAST-HF-Iroise buoy with an average duration of 2 days and a drop in salinity of up to 6.5. Such a large variability in salinity may influence the functioning of the Bay of Brest. To assess possible consequences, the processes behind the emergence of extreme low salinity events need to be evaluated.
Dynamics of Low Salinity Events and Underlying Processes
Precipitation and Low Salinity Events
To better understand and illustrate the origin of extreme low salinity events, we explored the possible link with precipitation patterns (Figure 3). By focusing our interpretation on two periods during the year 2007, we detected that a peak in precipitation was always observed before an extreme low salinity event: (1) From 6 to 15 February 2007, precipitation reached 32 mm and a strong decrease in salinity (31.2) was observed 2–3 days later; (2) From 28 February to 3 March 2007, precipitation reached 29 mm and a marked decrease in salinity (28.5) was detected approximately 5 days later. Two low salinity extreme events were observed.
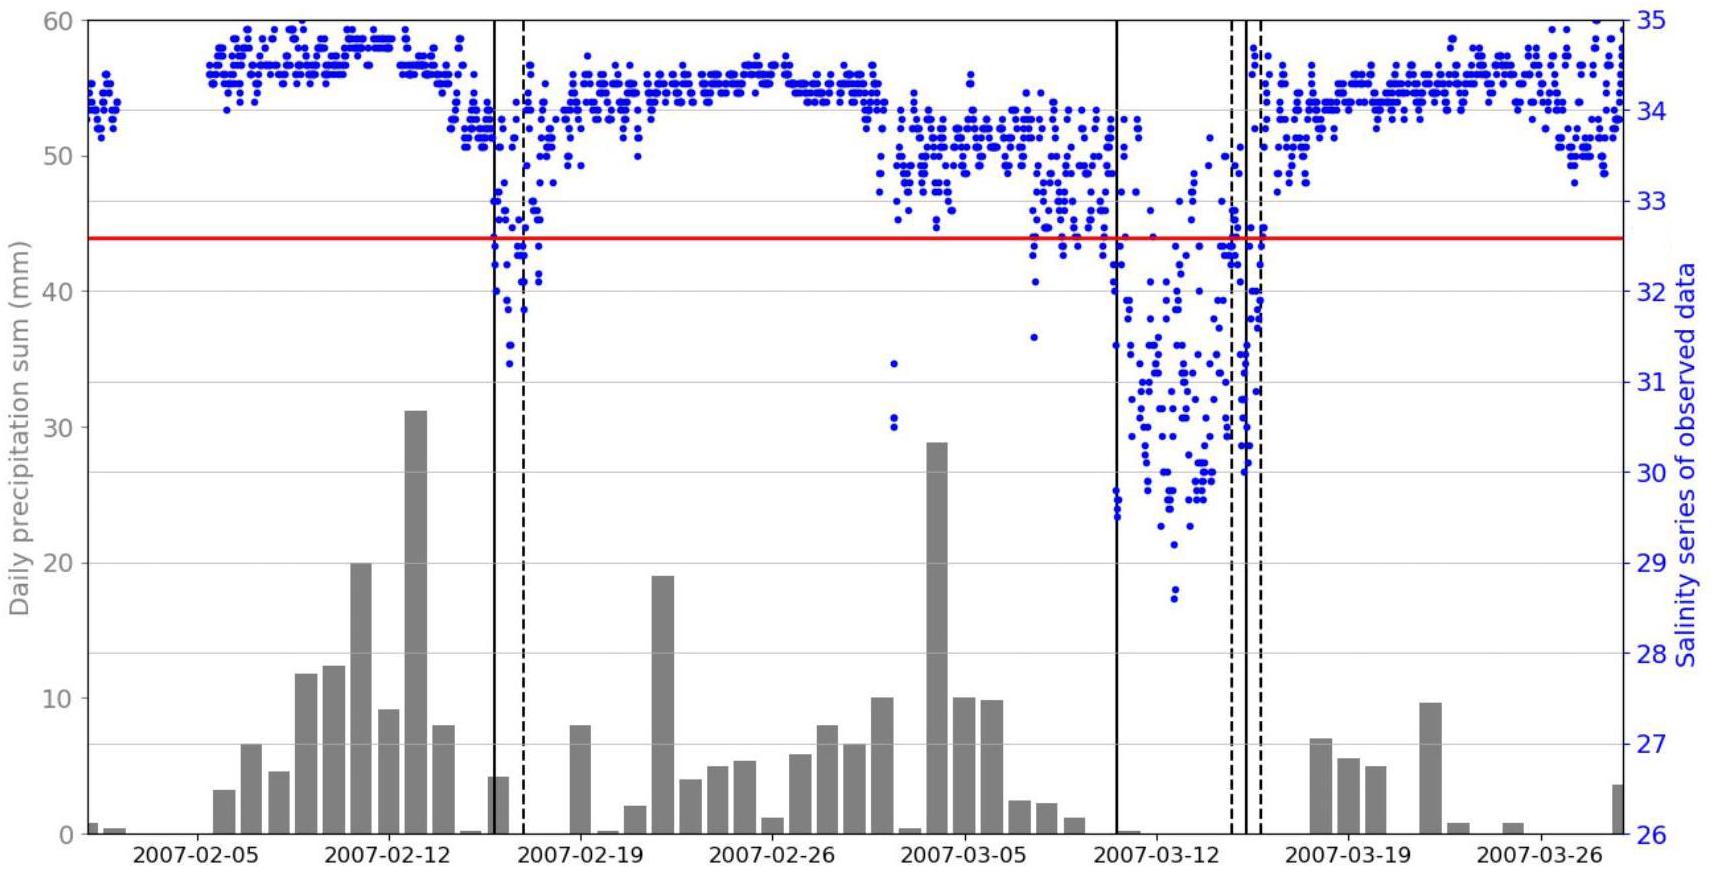
Figure 3. Average daily precipitation (in mm, histograms in grey) and salinity at high and low tides (blue dots) for the period from 1st February 2007 to 29th March 2007. The red line indicates the 32.59 salinity threshold. The continuous and dashed black vertical lines show the beginning and the end of an extreme event, respectively.
Considering the 14-day period before an extreme event, the average precipitation was 103 mm (not shown). The precipitation before extreme events was about twice (42% larger) as much as the average winter precipitation during the 2000–2018 period.
Underlying Processes of Low Salinity Events
Several ocean processes can explain the observation of low salinity events at the entrance of the Bay of Brest (around COAST-HF-Iroise buoy). Both model simulations allow reproducing the surface salinity dynamics with a bias of 0.23 (comparison between MARS3D–MARC and observations) and 0.17 (comparison between MARS3D–BACH and observations). The Root Mean Square Error reaches 0.87 (comparison with MARS3D–MARC) and 0.92 (comparison with MARS3D–BACH). In the water column, the stratification is also reproduced during the low salinity events in both simulations (not shown). For example, considering the difference between bottom and surface salinities (two-layer model), both simulations, during the common time period (2010–2012), are correlated at 0.59 with a Root Mean Square Error of 0.32 between MARS3D–BACH and MARS3D–MARC bottom/surface difference. Major peaks in the time series are then reproduced in both simulations. Based on the MARS3D–MARC model (with a finer spatial resolution) to investigate the processes behind extreme events, we observed a plume–mainly fed by freshwaters from the Aulne River (Figure 4B)–that was associated with increased westward and north-westward residual currents that reached 0.6 m s–1 (Figures 4A–C). The Aulne river flow increased during the event in parallel to changes in wind circulation: westerly/south-westerly winds decreased or veered to easterly winds (Figure 4B). During the event, at the end of December 2013, surface circulation induced by easterly winds (lower than 5 m s–1) has a limited impact on the river plume extent and the total surface circulation. We estimate that the wind forcings action will induce a surface circulation, which is not exceeding 0.15 m s–1 (considering that the surface current intensity corresponds to 3% of the wind intensity). The vertical extent of the river plume remained restricted (around 7 m) and flowed along the northern coast of the entrance of the Bay of Brest due to the Coriolis effect.
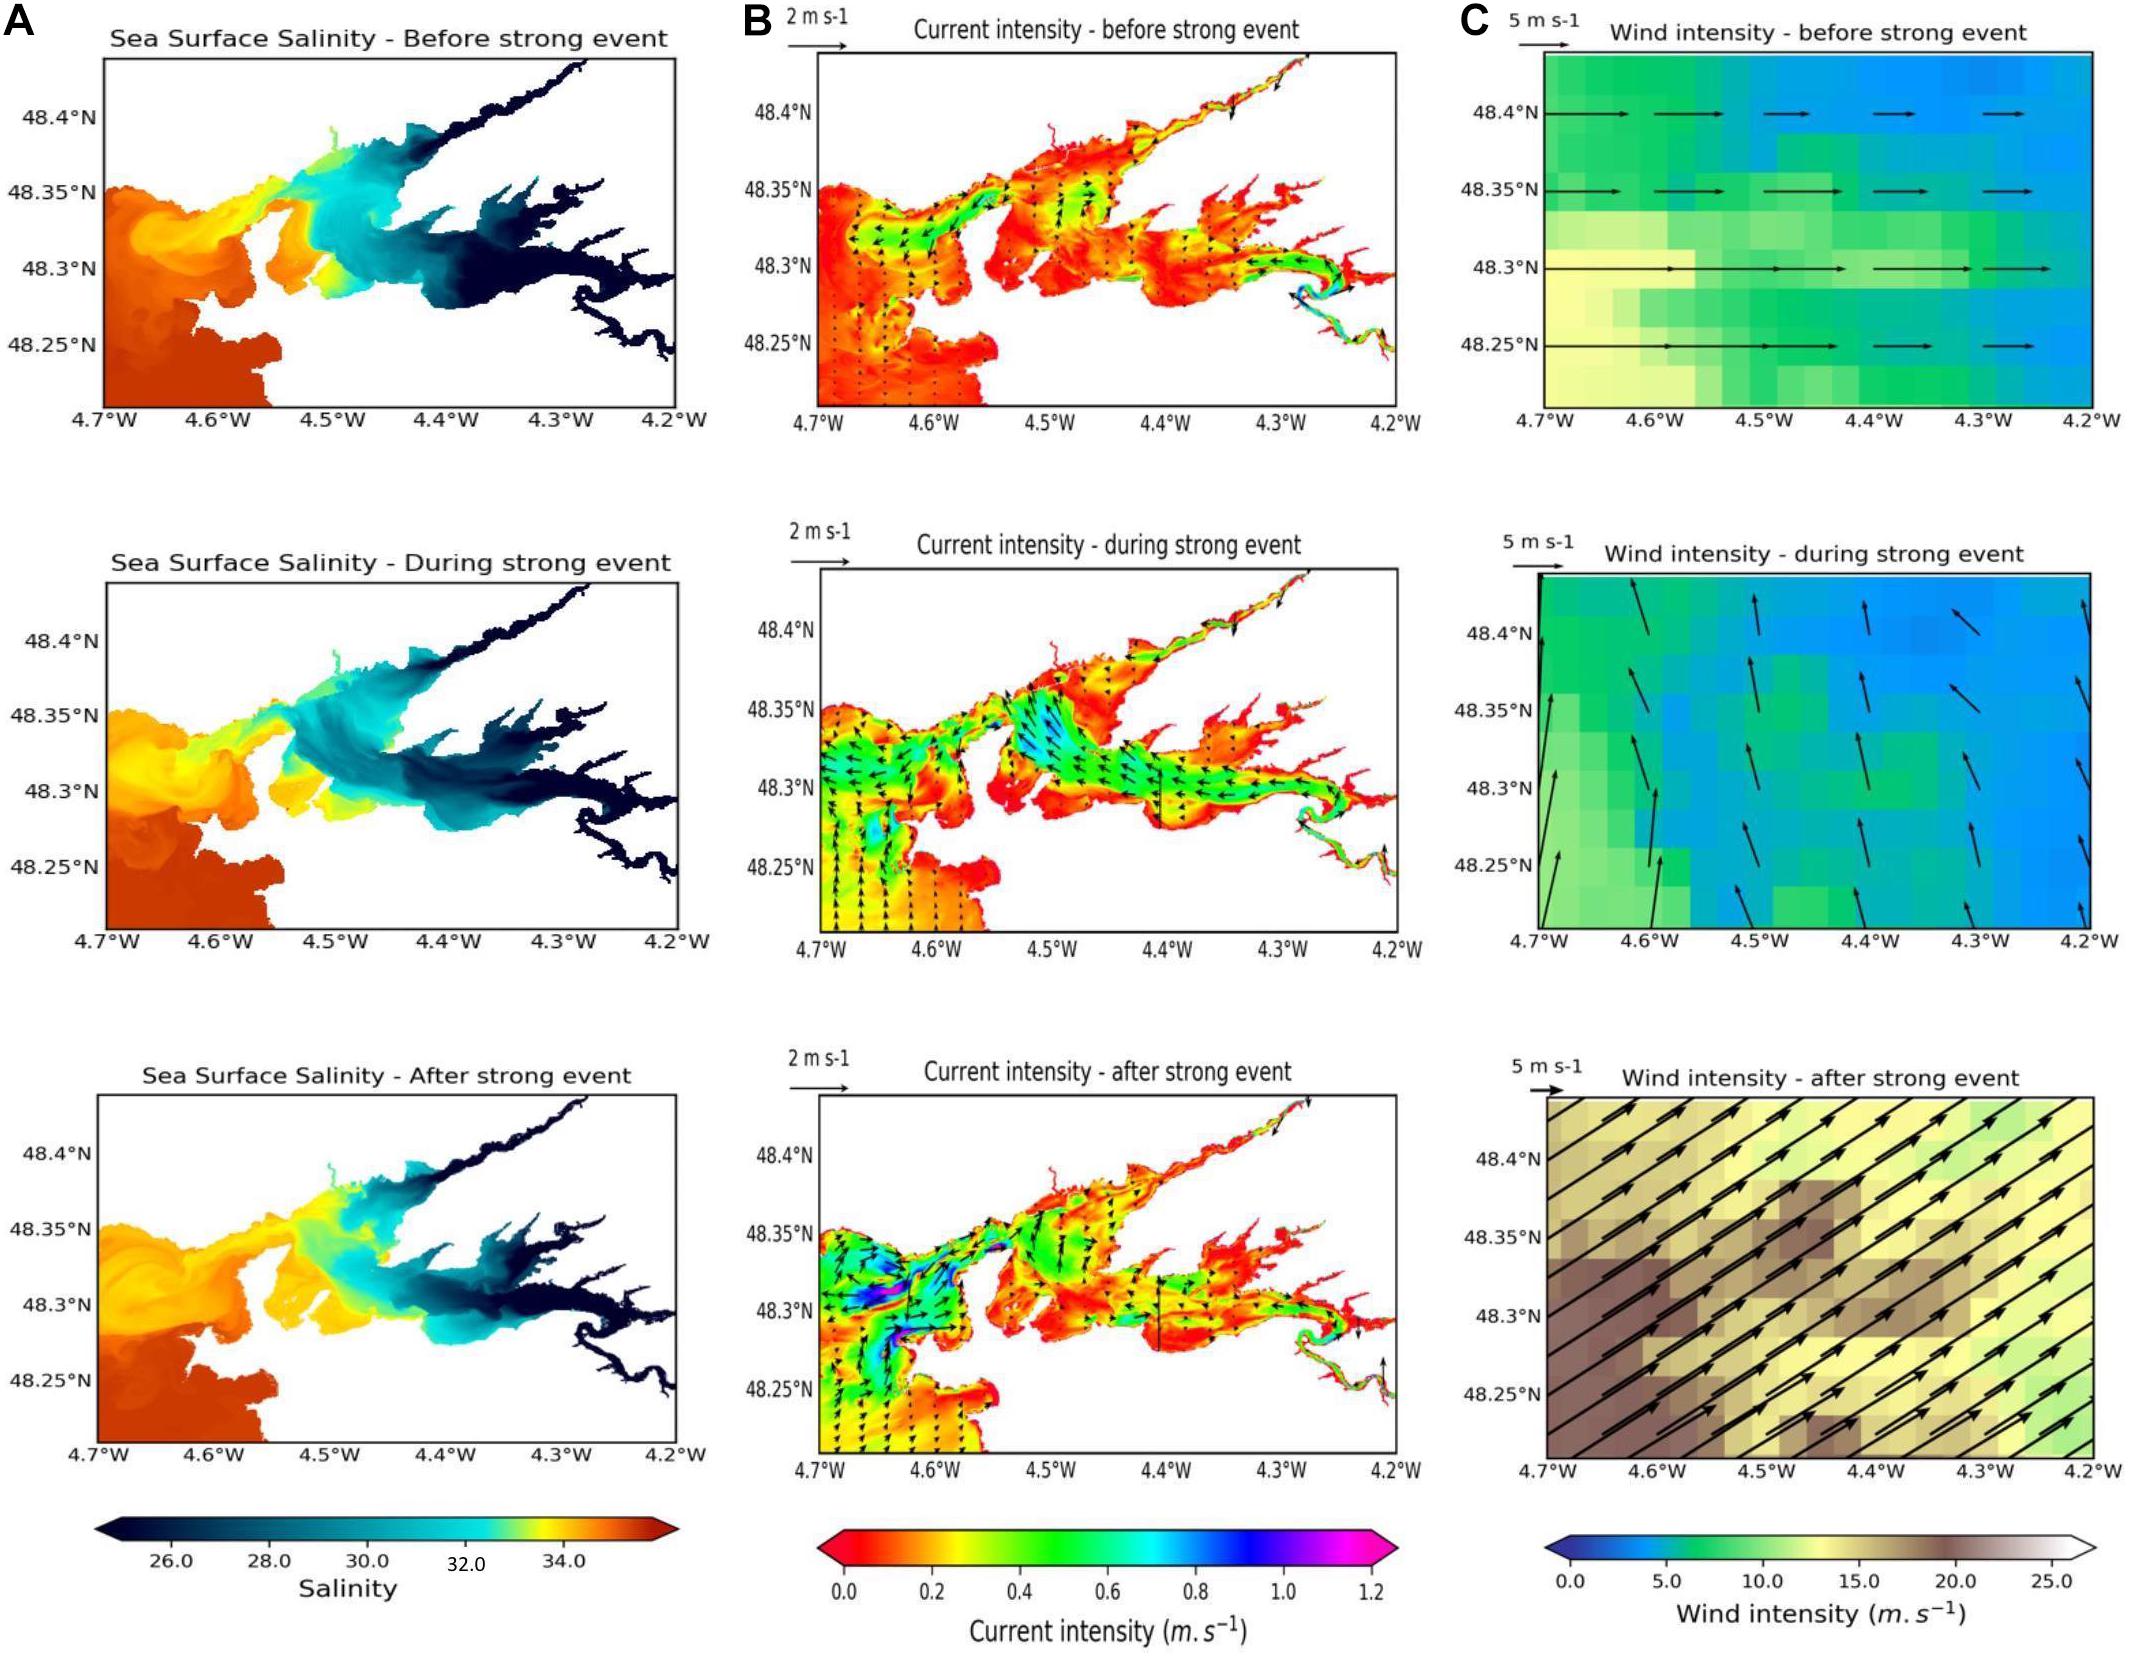
Figure 4. Maps of (A) sea surface salinity at 2 m depth, (B) surface current intensity (in m s–1) and its associated vectors, (C) surface wind intensity (in m s–1) and its associated vectors: before (28/12/2013; upper panels), during (30/12/2013; middle panels), and after (03/01/2014; lower panels) a low salinity event during the winter 2013–2014.
The analysis of all winter events confirmed that advection processes in the Bay of Brest explained the extent of the river plume and that the intensity of the events (combination of the influence of precipitation pattern and wind circulation) modulated the intensity and duration of the low salinity events: they can either be strong as during the winter 2013–2014, or weak as observed in the winter 2017–2018.
Variability of Low Salinity Events
A strong interannual variability in the number of extreme low salinity events was observed at the COAST-HF-Iroise buoy (Figure 5): 10 events were detected during the winter 2013–2014, but less than five events during the previous 4 years. The four most active winters were 2000–2001, 2006–2007, 2008–2009, and 2013–2014. Since 2010, at least three events per winter were detected, whereas only 1 or 2 events were detected before (Figure 5A). A clear variability in the duration of extreme low salinity events was also visible (Figure 5B). The winters 2000–2001 and 2013–2014, characterised by the strongest precipitation and winds, showed low salinity events that lasted more than 50 days, they rarely exceed 15 days during other winters. The mean duration of extreme low salinity has nearly doubled when comparing the periods 2000–2009 and 2010–2018 (10 versus 18 days).
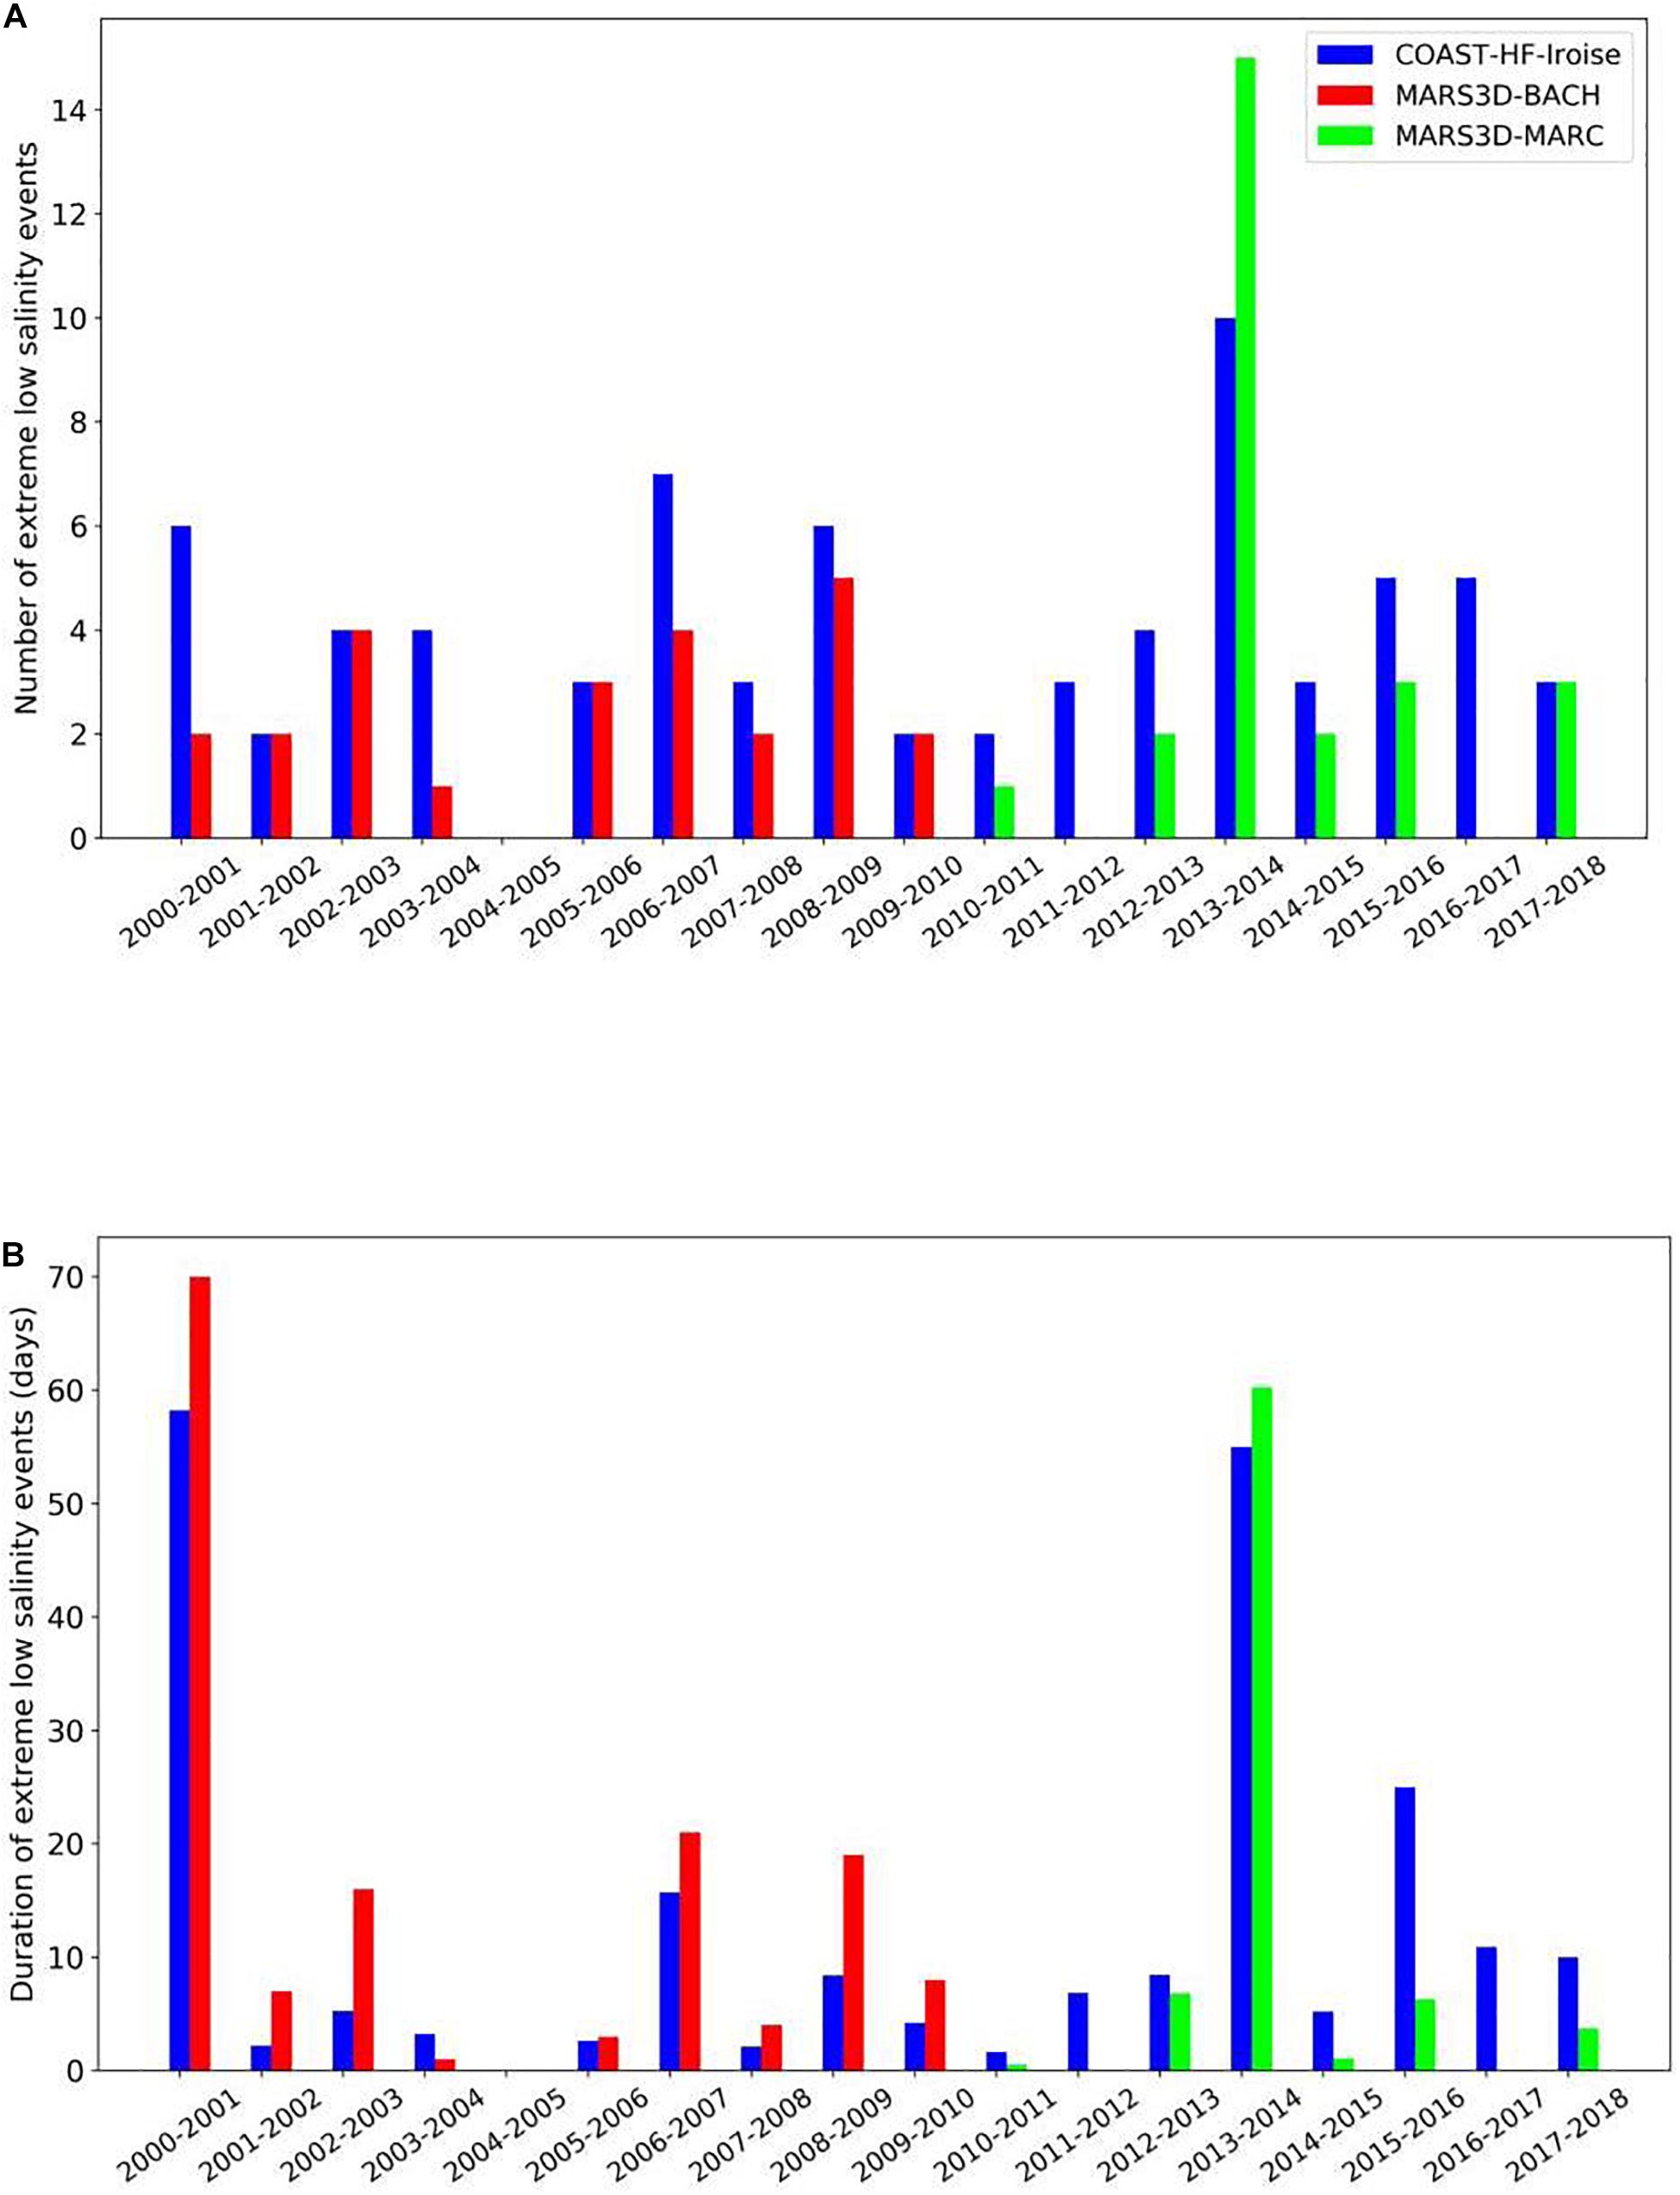
Figure 5. Histograms of (A) the number and (B) duration (in days) of extreme low salinity events concomitant in time with observed (COAST-HF-Iroise buoy, in blue) and simulated (MARS3D–BACH model and MARS3D–MARC, in red and green, respectively) data during the 2000–2018 period.
By comparing observed and modelled data, no event was detected in 2004–2005, but more than 10 events were observed in 2013–2014 (Figure 5A). Simulations reproduced the number of observed extreme events such as in 2002–2003, 2005–2006, 2009–2010, and 2017–2018. When investigating the duration of events, we found that MARS3D–BACH overpredicted the number of extreme low salinity events duration (on median average, 7.5 days for MARS3D–BACH and 3.7 days for the observations) and that MARS3D–MARC underpredicted those durations with 2.4 days on average compared with 9.2 days observed (Figure 5B). However, the MARS3D–BACH and MARS3D–MARC simulation show strong correlations with the in situ data, 0.94 and 0.98, respectively. The two most intense winters (2000–2001 and 2013–2014) stood out in the duration of extreme events.
Dynamics of Low Salinity Events at Global Scale
The correlations between atmospheric sea level pressure and the four weather regimes (NAOp, NAOn, AR, and BLK) were calculated for winter in situ observations using the KDE method for the 14 days before extreme events (Figure 6). Similar features were observed when the method was applied on results from numerical simulations. For the entire winter period (blue line; Figure 6), the KDE was centred around 0, suggesting no significant influence of large-scale processes. By examining density distributions of correlations when considering a 14-day period before extreme low salinity events (orange line; Figure 6), we detected a possible influence of the AR (correlations between −0.5 and −0.25) and the NAOp (correlations between 0.2 and 0.6) on the occurrence of extreme low salinity events. This relationship was related to the interconnection between winter precipitation and the AR and NAOp winter regimes in the north-eastern Atlantic (Pearson correlation coefficients of −0.29 and 0.26 for AR and NAOp, respectively).
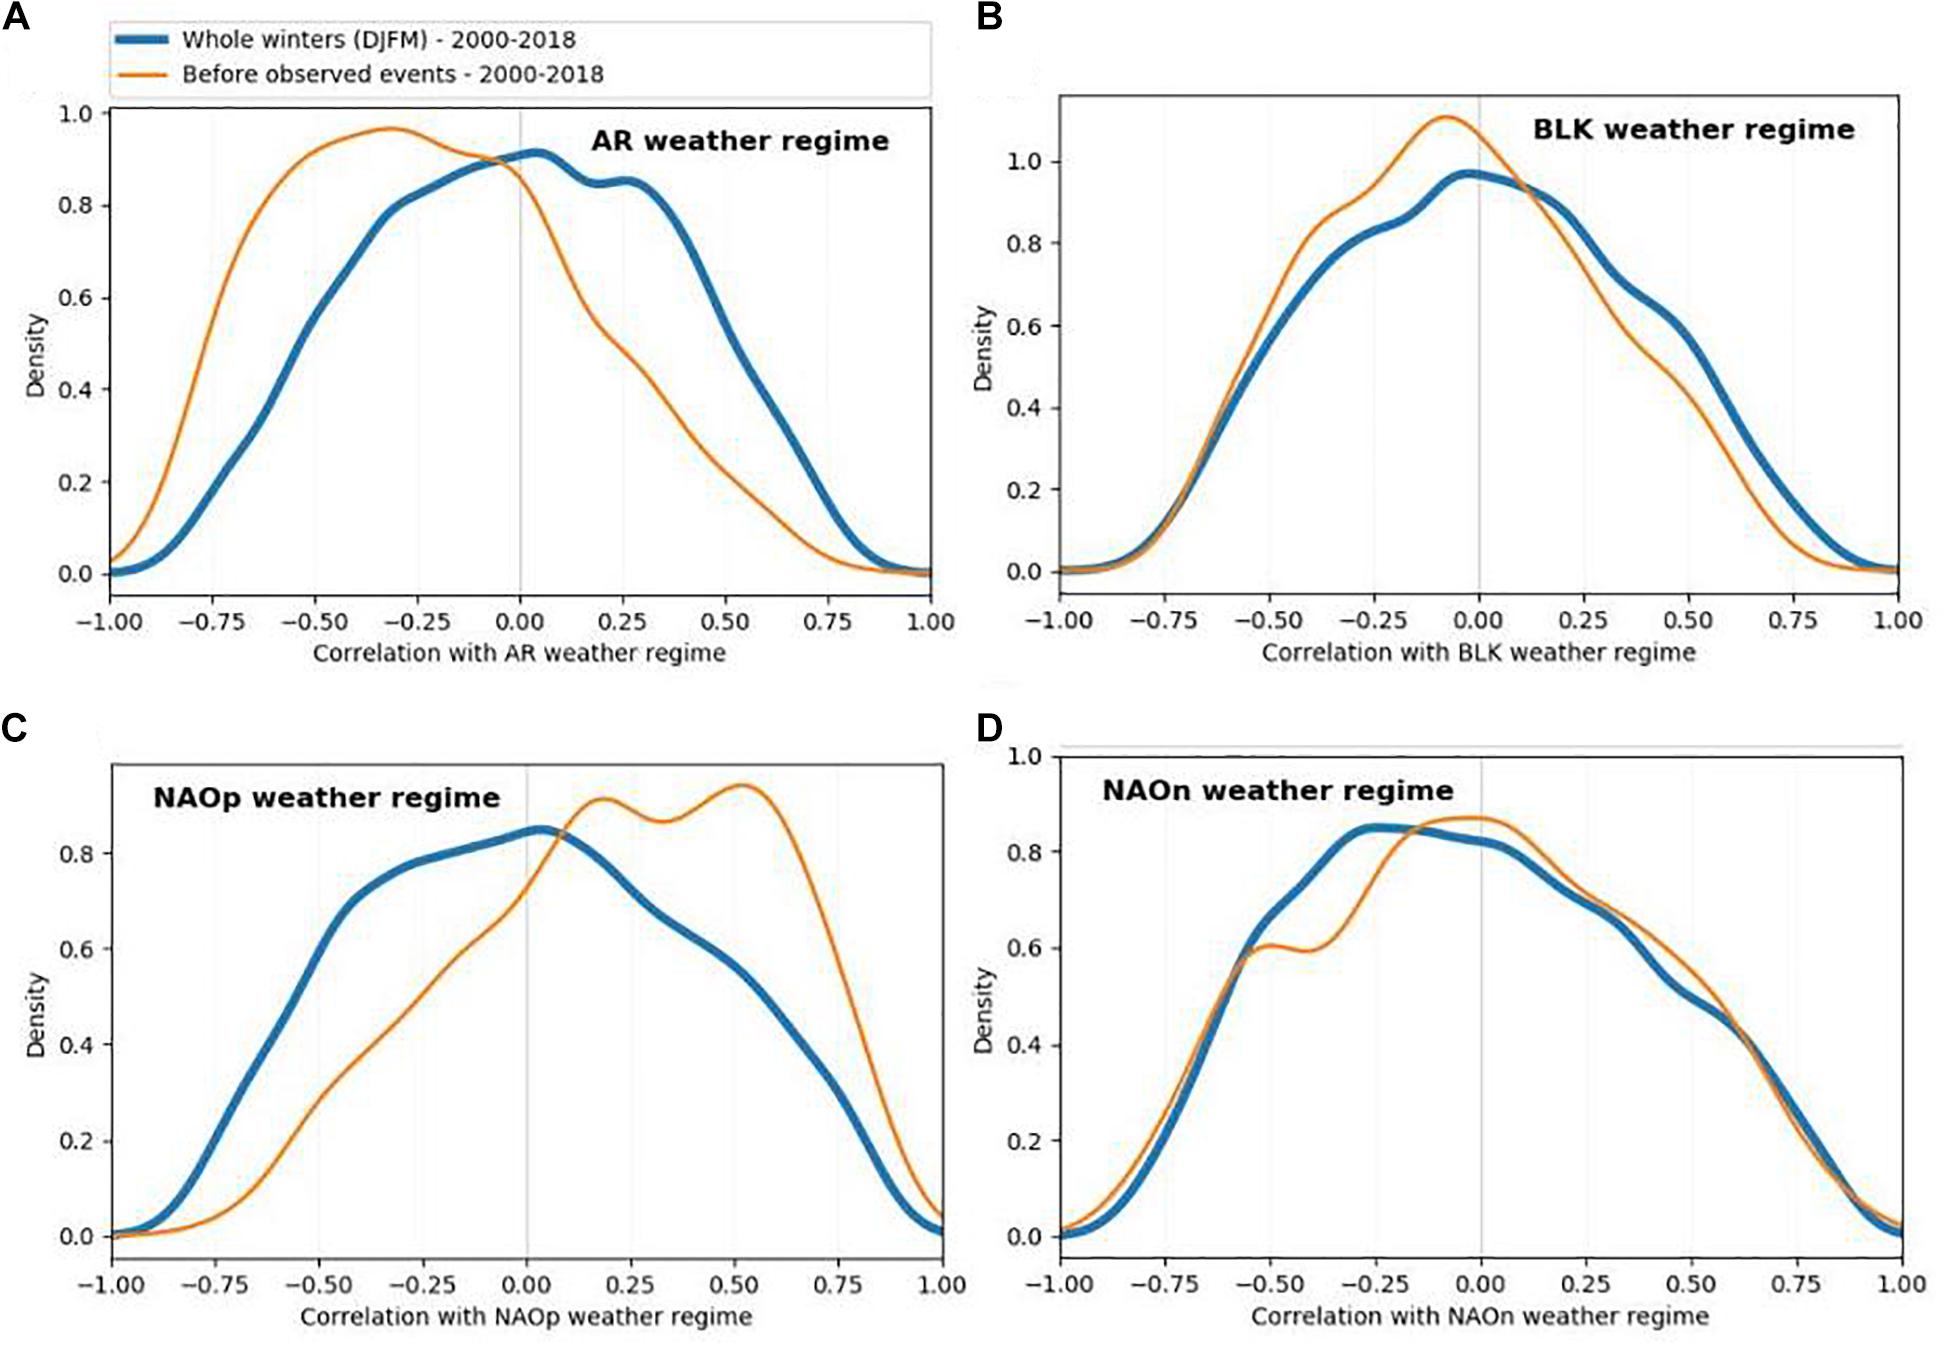
Figure 6. Kernel density based on the correlation values calculated between the atmospheric sea level pressure and (A) the Atlantic Ridge (AR), (B) the Scandinavian Blocking regime (BLK), (C) the positive (NAOp) and (D) negative (NAOn) phases of the NAO for the winter months of the period 2000–2018. Kernel density curves were calculated by considering either all winter months from 2000 to 2018 (blue curve) or only the 14-day periods before extreme low salinity events using in situ observations (orange curve).
Discussion
Extreme events influence coastal ecosystems worldwide: in the Tagus estuary (Costa et al., 2007), in the south-eastern Bay of Biscay (Ferrer et al., 2009), in the Central Oregon coast (Mazzini et al., 2015), in the Bay of San Pablo (Poulton et al., 2004), in California estuaries (Maynard et al., 2018), or in the north-western Arabian Gulf (Alosairi et al., 2019). Despite the profound consequences for ecosystem functioning (Bell et al., 2018; Seuront et al., 2019), the root causes underlying extreme episodes remain only rudimentarily documented. We lack understanding of how extreme events begin, and whether they propagate and induce alterations at the ecosystem scale. To bridge this gap, it is essential to better appreciate the interannual variability of extreme events to detect their occurrence and changes in intensity.
Impacts of Extreme Weather Events and Changes in Salinity in the Bay of Brest
Temporal changes in the physical characteristics of coastal waters of western Europe during winter revealed the clear occurrence of extreme low salinity events in the Bay of Brest since the early 2000s. Such “hazards” are relevant indicators of the response of semi-enclosed bay ecosystems to increasingly intense weather episodes, such as extreme storm surges, and floods (Jentsch and Beierkuhnlein, 2008; Smith, 2011; Coumou and Rahmstorf, 2012; IPCC et al., 2012, 2019). It is therefore essential to identify the contribution of the main drivers that influence the dynamic balance of freshwaters and marine waters.
Freshwater inputs in the Bay of Brest come predominantly from (i) river discharges (i.e., the Aulne, Elorn, and Mignonne rivers; Ménesguen and Piriou, 1995; Merot and Buffin, 1996; Guillaud and Bouriel, 2007), (ii) local precipitation, and (iii) ocean water mass exchanges between the bay and the Iroise Sea. During the winter period, precipitation has a cardinal influence on river flow (McCabe and Ayers, 1989). Therefore, precipitation over the watersheds and associated river runoffs can explain low salinity events (Cayan and Peterson, 1993; Poulton et al., 2004). Due to the nature and properties of the Aulne river basin (dominated by granite and schist; Acolas et al., 2006; Moskalski et al., 2018), floods directly mirror precipitation. This phenomenon is amplified during winter when soils are water-saturated. Here, we clearly demonstrated that an excess in precipitation induces–most of the time–to the occurrence of a low salinity event with a maximum time lag of 14 days.
To thoroughly analyse the interannual variability of extreme events, we demonstrated that numerical modelling provides essential information, when in situ observations are too scarce, to reproduce the freshwater pathway in the Bay of Brest and to help in better defining the relationship between river runoffs and low salinity events. These simulations can be refined, however, by improving the spatial resolution and/or the parametrisation of diffusion processes (Petton et al., 2020b). These improvements can help mitigate the underestimated values we simulated.
Extreme Low Salinity Events: A Specific Answer of the Bay of Brest to Intense Precipitation
The relationship between river runoff and extreme low salinity events was highlighted by our simulations which included only river runoff as external freshwater input (precipitation was not considered). The macro-tidal regime of the Bay of Brest, which contributed to both the advection and the diffusion of the river plumes (Ayouche et al., 2020; Petton et al., 2020b), explains the lag between precipitation and low salinity events.
To characterise changes in the amplitude of low salinity episodes, the duration of each event was compared with in situ minimum salinity, providing support that the intensity of each event and its duration were linked. Duration was not only related to precipitation, however, but also to the dynamics of the Bay of Brest. By investigating the contribution of external forcing during two contrasting events (winter 2013–2014 vs. winter 2017–2018), we showed that the surface circulation in the Bay of Brest played an important role in the advection of the Aulne River freshwater plume as a source of the low salinity events in the entrance of the bay. River flows, driven by the high precipitation rate, feed the Bay of Brest with freshwater, which in turn affects the properties of the water column. The tidal regime does not affect the amplitude of observed and modelled events during both neap and spring tides. But the stratification can be highly affected by the neap-spring tidal cycle under different environmental conditions (e.g., different stratification, open bay; Chegini et al., 2020 in the German Bight). The amplitude of modelled and observed events is also influenced by wind directions, speeds, and frequencies, as a driver of the river plume spreading (Kourafalou et al., 1996; Liu et al., 2008; Kastner et al., 2018). Changes in wind directions, as well as decrease in intensity, contribute to the extent of the river plume and influence the modelled surface currents. By considering the different forcings during the winter period (in 2013–2014 and 2017–2018), we showed that the seasonal circulation of surface layers was affected by an increase in river flow and by winds. And a strong high-frequency variability of the surface circulation in the Bay was also revealed. The occurrence of low salinity events at the entrance of the Bay of Brest resulted from a combination of high river discharge and north-westward downwelling-favourable winds (or at least with a weaker wind intensity). The key role of these downwelling-favourable winds on the river plume spreading was also further South in the Bay of Brest, in the Loire and Gironde estuaries (Lazure and Jegou, 1998). The sequence of events in the winter 2013–2014 induced longer and more frequent events.
Interannual Changes in Extreme Low Salinity Events
Since the early 2000s, the occurrence of observed and modelled winter extreme low salinity events has varied between 0 and 10 in the Bay of Brest, and pronounced interannual variability was characterised. Winters associated with intense mid-latitude depressions, such as in 2000–2001, 2006–2007, 2008–2009, and 2013–2014, showed a high number of events, but the winter 2004–2005 was a calm period. By investigating changes in hydro-climatological processes, we demonstrated a clear influence of extreme salinity with 2004–2005 and 2013–2014 being the most extreme winters. The winter 2004–2005 was particularly cold and dry (Somavilla et al., 2009, 2011, 2016; Charria et al., 2017) and only one storm, centred in the north of France, was observed. During the 2013–2014 period, intense winter storms were observed in western Europe (12 storms, including the two longest, 26 and 13.75 days, over the past 18 years, i.e., before 2013; Blaise et al., 2015; Castelle et al., 2015; Davies, 2015; Gohin et al., 2015; Masselink et al., 2016), explaining why we detected 10 extreme low salinity events.
By investigating interannual changes in both the occurrence and duration of extreme low salinity events in relationship to storm episodes (as identified by Météo-France; Figure 7), we detected a constant increase (in occurrence and duration of events) over the last two decades. This suggests that an intensification in the number of storms may have paralleled an increase in both the occurrence and magnitude of extreme events.
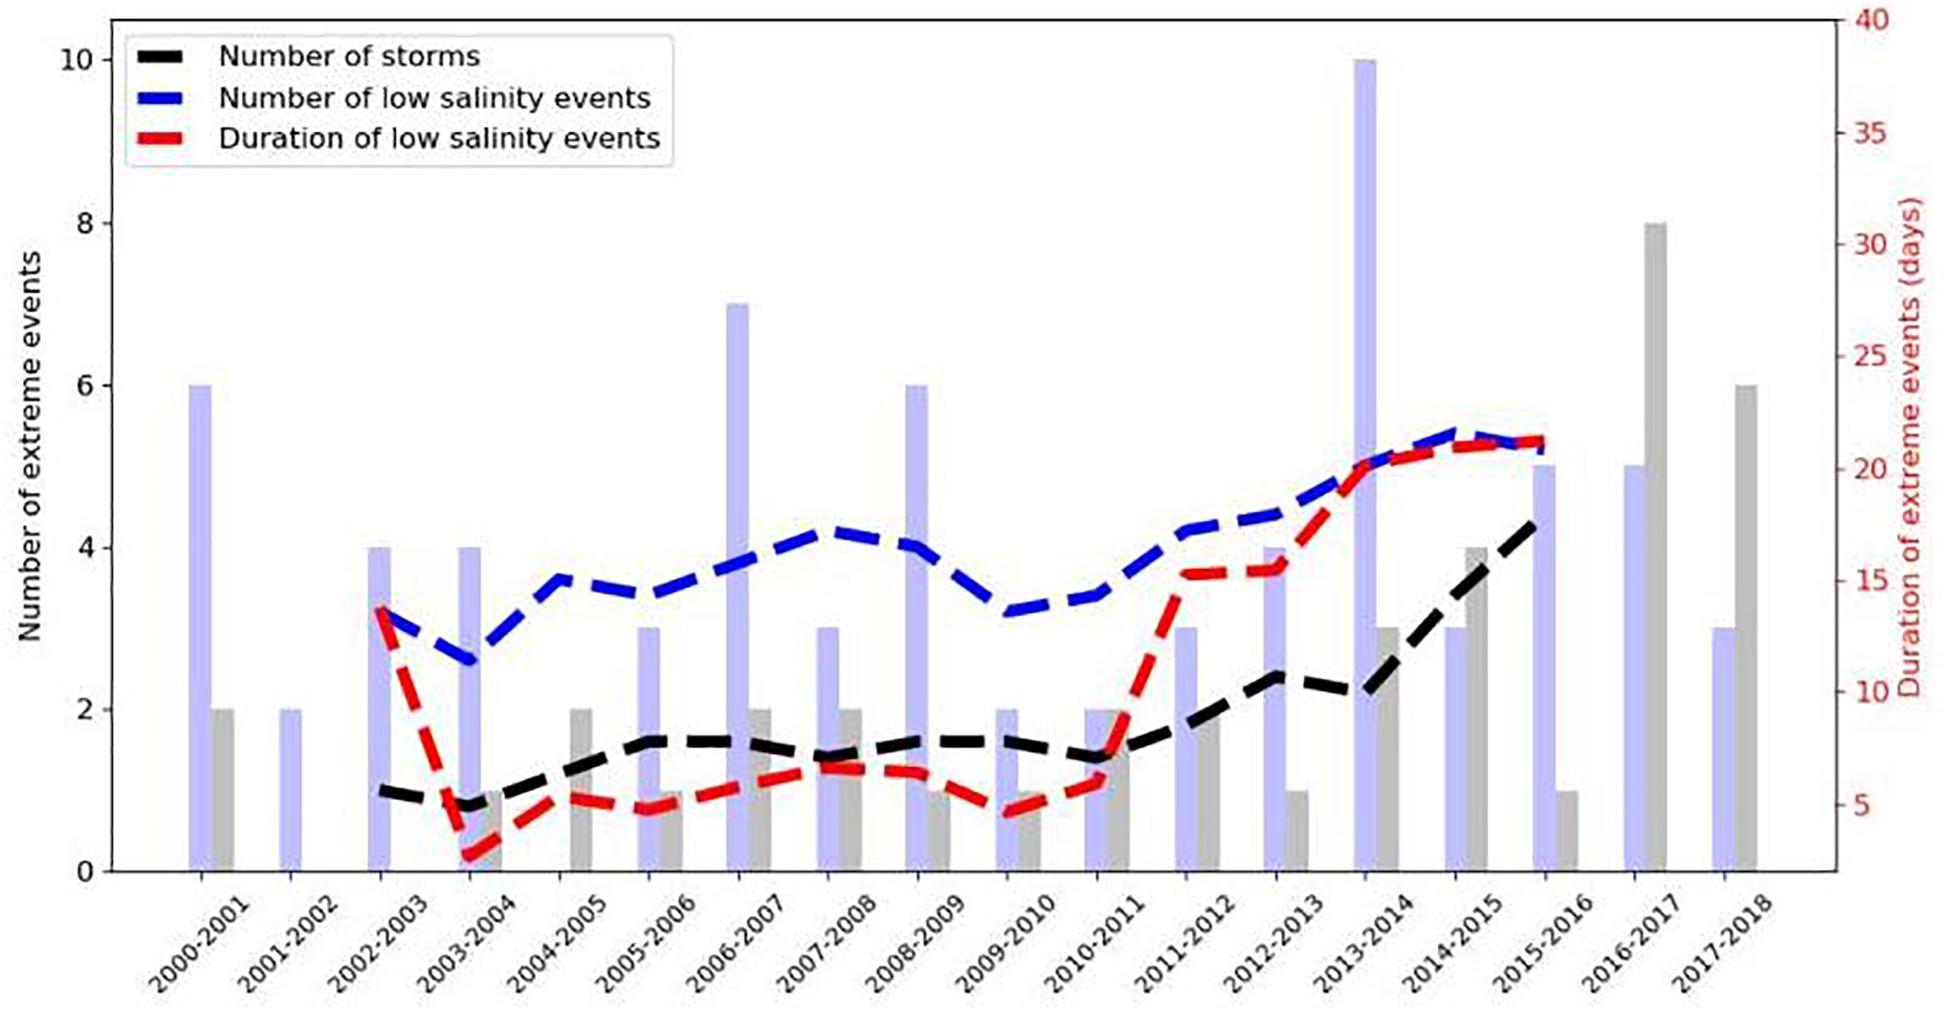
Figure 7. Interannual changes (after application of a 5-years running mean) in the number of extreme weather episodes (in black) with its raw data (in grey), in situ extreme low salinity events (in blue) with its raw data (in light blue) and their duration (in days, in red) at the COAST-HF-Iroise buoy.
Impacts of Large-Scale Hydro-Climate Processes on Extreme Events
Investigating interannual changes in the physical and chemical characteristics of coastal waters, Tréguer et al. (2014) highlighted the connection between the Bay of Brest and the North Atlantic atmospheric circulation. Here, we confirmed the impact of large-scale North Atlantic atmospheric processes on the coastal waters in the Bay of Brest. Extreme events are triggered by large-scale processes, with a dominance of low salinity events (1) during the NAOp and (2) when SLPA correspond to the reversed AR regime. Extreme precipitation and the winter NAO are strongly interrelated, underlining that the NAOp, by favouring storms, is the dominant regime in winter (Donat et al., 2010; Cassou et al., 2011; Gomara et al., 2014; Tabari and Willems, 2018).
Conclusion
Here, by combining two decades of in situ observations and numerical simulations, our study quantified–for the first time in the Bay of Brest–the occurrence of extreme low salinity events and their links with large-scale atmospheric circulation. We demonstrated that the signature of extreme weather events on trends in salinity was only visible when in situ high-frequency measurements and high-resolution numerical modelling were combined. In the Bay of Brest, the intensity of winter extreme episodes was mainly related to changes in precipitation patterns, with consequences on both the Aulne and Elorn river watersheds. A detailed analysis of underlying processes showed that extreme low salinity events occurred not only after a peak in river discharge, but also under favourable atmospheric (wind) conditions that contribute to the advection of the river plume within the Bay of Brest. By investigating interannual changes in the occurrence of extreme events, we revealed that two contrasted winter periods have taken place since the early 2000s, with a clear increase in both the number and duration of extreme low salinity events as a response to an intensification of winter storms. Large-scale hydro-climatic processes (i.e., the NAOp and the AR) significantly modulate precipitation and flooding events and triggered extreme low salinity episodes.
Data Availability Statement
The original contributions presented in the study are included in the article, further inquiries can be directed to the corresponding author.
Author Contributions
CP and GC designed the study and wrote the first draft of the manuscript. PR-M, MR, LQ, EGr, NB, SP, ST, and J-FR provided and pre-processed datasets. CP, GC, and MU performed most of the in situ and numerical analyses. NB provided expertise on weather regimes. J-FR contributed to Figure 1. MU contributed to Figure 3. GC computed Figure 6. EGo, PR-M, PT, and SP made substantial contributions in the successive versions of the manuscript. All authors contributed to manuscript revision, read and approved the submitted version.
Conflict of Interest
The authors declare that the research was conducted in the absence of any commercial or financial relationships that could be construed as a potential conflict of interest.
Acknowledgments
This study is part of the Contrat Plan Etat-Région ROEC partly supported by European Regional Development Funds. In situ observations were provided by the COAST-HF (http://www.coast-hf.fr) and the SOMLIT (http://somlit.epoc.u-bordeaux1.fr) national observation network from the ILICO research infrastructure. Modelling experiments (BACH configuration) were performed with GENCI (French Big National Equipment Intensive Computing) computational resources administered at CINES (National Computing Center for Higher Education). Data processing and figures were partly carried out using the open-source Python library VACUMM (http://www.ifremer.fr/vacumm/) and the Geographical Information System (QGIS–http://www.qgis.org). Tide gauges data were provided by the French Naval and Hydrographic Service (Shom). We also thank Michel Aïdonidis for insightful discussions. We thank Armel Bonnat for processing Météo-France in situ observations.
Footnotes
- ^ In the French coastal observing systems, high-frequency autonomous observing systems, and low-frequency sampled sites (weekly or biweekly manual water sampling campaigns) are distinguished based on sampling frequency.
- ^ www.coast-hf.fr
- ^ www.hydro.eaufrance.fr/
- ^ https://donneespubliques.meteofrance.fr/
- ^ www.climate.be/cart
References
Acolas, M. L., Véron, V., Jourdan, H., Bégout, M. L., Sabatié, M. R., and Baglinière, J. L. (2006). Upstream migration and reproductive patterns of a population of allis shad in a small river (L’Aulne, Brittany, France). J. Mar. Sci. 6, 476–484. doi: 10.1016/j.icesjms.2005.05.022
Alosairi, Y., Alsulaiman, N., Petrov, P., and Karam, Q. (2019). Responses of salinity and chlorophyll-a to extreme rainfall events in the northwest Arabian Gulf: emphasis on Shatt Al-Arab. Mar. Pollut. Bull. 149:110564. doi: 10.1016/j.marpolbul.2019.110564
Auffret, G. (1983). Dynamique sédimentaire de la Marge Continentale Celtique- Evolution Cénozoiïque- Spécificité du Pléistocène Supérieur et de l’Holocène. Ph.D. thesis. Talence: Université de Bordeaux I, 355.
Ayouche, A., Carton, X., Charria, G., Theetten, S., and Ayoub, N. (2020). Instabilities and vertical mixing in river plumes: application to the Bay of Biscay. Geophys. Astrophys. Fluid Dyn. 114, 650–689. doi: 10.1080/03091929.2020.1814275
Barnett, D. N., Brown, S. J., Murphy, J. M., Sexton, D. M., and Webb, M. J. (2006). Quantifying uncertainty in changes in extreme event frequency in response to doubled CO2 using a large ensemble of GCM simulations. Clim. Dyn. 26, 489–511. doi: 10.1007/s00382-005-0097-1
Barrier, N. (2013). Variability of the Ocean Circulation in the North-Atlantic in Response to Atmospheric Weather Regimes. Earth Science, Ph. D. thesis. Brest: Université de Bretagne occidentale, 180.
Barrier, N., Cassou, C., Deshayes, J., and Treguier, A.-M. (2014). Response of north atlantic ocean circulation to atmospheric Weather Regimes. J. Phys. Oceanogrogr. 44, 179–201. doi: 10.1175/jpo-d-12-0217.1
Bell, J., Brown, C., Conlon, K., Herring, S., Kunkel, K. E., Laurimore, J., et al. (2018). Changes in extreme events and the potential impacts on human health. J. Air Waste Manag. Assoc. 68, 265–287. doi: 10.1007/3-540-28862-7_26
Berrisford, P., Kâlberg, P., Kobayashi, S., Dee, D., Uppala, S., Simmons, A. J., et al. (2011). Atmospheric conservation properties in ERA-Interim. Q. J. R. Meteorol. Soc. 137, 1381–1399. doi: 10.1002/qj.864
Blain, S., Guillou, J., Tréguer, P., Woerther, P., Delauney, L., Follenfant, E., et al. (2004). High frequency monitoring of the coastal marine environment using the MAREL buoy. J. Environ. Monit. 6, 569–575. doi: 10.1039/b314073c
Blaise, E., Suanez, S., Stéphan, P., Fichaut, B., David, L., Cucq, V., et al. (2015). Review of winter storms 2013-2014 on shoreline retreat dynamic on Brittany coast. Géomorphol. Relief Processus Environ. 21, 267–292.
Bojarriu, R., and Reverdin, G. (2002). Large-scale variability modes of freshwaterflux and precipitation over the Atlantic. Clim. Dyn. 18, 369–381. doi: 10.1007/s003820100182
Caillaud, M., Petton, S., and Dumas, F. (2016). Hydrodynamic Hindcast at 500m Resolution with MARS3D-AGRIF Model - Channel-Biscay Zone. Brest: IFREMER.
Cassou, C., Minvielle, M., Terray, L., and Périgaud, C. (2011). A statistical dynamical scheme for reconstructing ocean forcing in the Atlantic. Part I : weather regimes as predictors for ocean surface variables. Clim. Dyn. 36, 19–39. doi: 10.1007/s00382-010-0781-7
Castelle, B., Marieu, V., Bujan, S., Splinter, K., Robinet, A., Sénéchal, N., et al. (2015). Impact of the winter 2013-2014 series of severe Western Europe storms on a double-barred sandy coast: Beach and dune erosion and megacusp embayments. Geomorphology 238, 135–148. doi: 10.1016/j.geomorph.2015.03.006
Cayan, D. R., and Peterson, D. H. (1993). Spring climate and salinity in the San Francisco Bay Estuary. Water Resour. Res. 29, 293–303. doi: 10.1029/92wr02152
Chaalali, A., Beaugrand, G., Raybaud, V., Goberville, E., David, V., Boët, P., et al. (2013). Climatic facilitation of the colonization of an estuary by Acartia tonsa. PLoS One 8:e74531. doi: 10.1371/journal.pone.0074531
Charria, G., Rimmelin-Maury, P., Goberville, E., L’Helguen, S., Barrier, N., David-Beausire, C., et al. (2020). “Temperature and salinity changes in coastal waters of western europe: variability, trends and extreme events,” in Evolution of Marine Coastal Ecosystems under the Pressure of Global Changes, eds H. J. Ceccaldi, Y. Hénocque, T. Komatsu, P. Prouzet, B. Sautour, and J. Yoshida (Cham: Springer), 207–226. doi: 10.1007/978-3-030-43484-7_15
Charria, G., Theetten, S., Vandermeirsch, F., Yelekçi, O., and Audiffren, N. (2017). Interannual evolution of (sub)mesoscale dynamics in the Bay of Biscay. Ocean Sci. 13, 777–797. doi: 10.5194/os-13-777-2017
Chegini, F., Holtermann, P., Kerimoglu, O., Becker, M., Kreus, M., Klingbeil, K., et al. (2020). Processes of stratification and destratification during an extreme river discharge event in the German Bright ROFI. J. Geophys. Res. Oceans 125:e2019JC015987.
Christidis, N., Jones, G., and Stott, P. (2015). Dramatically increasing chance of extremely hot summers since the 2003 European heatwave. Nat. Clim. Change 5, 46–50. doi: 10.1038/nclimate2468
Cloern, J. E., Abreu, P. C., Carstensen, J., Chauvaud, L., Elmgren, R., Grall, J., et al. (2016). Human activities and climate variability drive fast-paced change across the world’s estuarine-coastal ecosystems. Glob. Change Biol. 22, 513–529. doi: 10.1111/gcb.13059
Cocquempot, L., Delacourt, C., Paillet, J., Riou, P., Aucan, J., Castelle, B., et al. (2019). Coastal ocean and nearshore observation: a french case study. Front. Mar. Sci. 6:324. doi: 10.3389/fmars.2019.00324
Copernicus Climate Change Service (2017). ERA5: Fifth Generation of ECMWF Atmospheric Reanalyses of the Global Climate. Reading: Copernicus Climate Change Service Climate Data Store (CDS).
Costa, M. J., Vasconcelos, R., Costa, J. L., and Cabral, H. N. (2007). River flow influence on the fish community of the Tagus estuary (Portugal). Hydrobiologia 587, 113–123. doi: 10.1007/s10750-007-0690-x
Coumou, D., and Rahmstorf, S. (2012). A decade of weather extremes. Nat. Clim. Change 2, 491–496. doi: 10.1038/nclimate1452
Davies, H. (2015). Weather chains during the 2013/2014 winter and their significance for seasonal prediction. Nat. Geosci. 8, 833–837. doi: 10.1038/ngeo2561
Del Amo, Y., Le Pape, O., Treguer, P., Queguiner, B., Menesguen, A., and Aminot, A. (1997). Impacts of high-nitrate freshwater inputs on macrotidal ecosystems. I. Seasonal evolution of nutrient limitation for the diatom-dominated phytoplankton of the Bay of Brest (France). Mar. Ecol. Prog. Ser. 161, 213–224. doi: 10.3354/meps161213
Donat, M., Leckebusch, G., Pinto, J., and Ulbrich, U. (2010). Examination of wind storms over Central Europe with respect to circulation weather types and NAO phases. Int. J. Climatol. 30, 1289–1300.
Ducrocq, V., Bouttier, F., Melardel, S., Montmerle, T., and Seity, Y. (2005). Le projet Arome, crues méditerranéennes : les réponses scientifiques et techniques de l’Etat. La Houille Blanche 2, 39–44.
Farcy, P., Durand, D., Charria, G., Painting, S. J., Tamminem, T., Collingridge, K., et al. (2019). Toward a European coastal observing network to provide better answers to science and to societal challenges; the JERICO research infrastructure. Front. Mar. Sci. 6:529. doi: 10.3389/fmars.2019.00529
Ferrer, L., Fontán, A., Mader, J., Chust, G., González, M., Valencia, V., et al. (2009). Low-salinity plumes in the oceanic region of the Basque Country. Cont. Shelf Res. 29, 970–984. doi: 10.1016/j.csr.2008.12.014
Frère, L., Paul-Pont, I., Rinnert, E., Petton, S., Jaffré, J., Bihannic, I., et al. (2017). Influence of environmental and anthropogenic factors on the composition, concentration and spatial distribution of microplastics : a case study of the Bay of Brest (Brittany, France). Environ. Pollut. 225, 211–222. doi: 10.1016/j.envpol.2017.03.023
Goberville, E., Beaugrand, G., and Edwards, M. (2014). Synchronous response of marine plankton ecosystems to climate in the Northeast Atlantic and the North Sea. J. Mar. Syst. 129, 189–202. doi: 10.1016/j.jmarsys.2013.05.008
Goberville, E., Beaugrand, G., Sautour, B., and Tréguer, P., and Somlit Team. (2010). Climate-driven changes in coastal marine systems of Western Europe. Mar. Ecol. Prog. Ser. 408, 129–147. doi: 10.3354/meps08564
Gohin, F., Bryère, P., and Griffiths, J. (2015). The exceptional surface turbidity of the North-West European shelf seas during the stormy 2013-2014 winter : consequences for the initiation of the phytoplankton blooms. J. Mar. Syst. 148, 70–85. doi: 10.1016/j.jmarsys.2015.02.001
Gomara, I., Rodriguez-Fonseca, B., Zurita-Gotor, P., and Pinto, J. G. (2014). A statistical-dynamical scheme for reconstructing ocean forcing in the Atlantic. Part I : weather regimes as predictors for ocean surface variables. Geophys. Res. Lett. 41, 2182–2190.
Guillaud, J.-F., and Bouriel, L. (2007). Relationships between nitrate concentration and river flow, and temporal trends of nitrate in 25 rivers of Brittany (France). J. Water Sci. 20, 213–226.
Hurrell, J. W., Kushnir, Y., and Visbeck, M. (2001). The north Atlantic oscillation. Science 291, 603–605. doi: 10.1126/science.1058761
IPCC, Field, C. B., Barros, V., Stocker, T. F., Qin, D., Dokken, D. J., Ebi, K. L., et al. (2012). Cambridge: Cambridge University Press, 582.
IPCC, Pörtner, H.-O., Roberts, D. C., Masson-Delmotte, V., Zhai, P., Tignor, M., Poloczanska, E., et al. (2019). IPCC Special Report on the Ocean and Cryosphere in a Changing Climate. Geneva.
Jentsch, A., and Beierkuhnlein, C. (2008). Research frontiers in climate change: Effects of extreme meteorological events on ecosystems. C. R. Geosci. 340, 621–628. doi: 10.1016/j.crte.2008.07.002
Kastner, S., Horner-Devine, E., and Thomson, A. (2018). The influence of wind and waves on spreading and mixing in the Fraser River plume. J. Geophys. Res. Oceans 123:6840.
Kourafalou, V., Lee, T., Oey, L., and Wang, J. (1996). The fate of river discharge on the continental shelf. J. Geophys. Res. 101, 3435–3455.
Lazure, P., and Dumas, F. (2008). An external–internal mode coupling for a 3D hydrodynamical model for applications at regional scale (MARS). Adv. Water Resour. 31, 233–250. doi: 10.1016/j.advwatres.2007.06.010
Lazure, P., and Jegou, A. M. (1998). 3D modelling of seasonal evolution of Loire and Gironde plumes on Biscay Bay continental shelf. Oceanol. Acta 21, 165–177. doi: 10.1016/s0399-1784(98)80006-6
Leckebusch, G. C., Koffi, B., Ulbrich, U., Pinto, J. G., Spangehl, T., and Zacharias, S. (2006). Analysis of frequency and intensity of European winter storm events from a multi-model perspective, at synoptic and regional scales. Clim. Res. 31, 59–74. doi: 10.3354/cr031059
Liu, W., Chen, W., Cheng, R., and Hsu, M. (2008). Modelling the impact of wind stress and river discharge. Appl. Math. Model. 32, 1255–1280. doi: 10.1016/j.apm.2007.03.009
Mann, M., Rahmstorf, S., Kornhuber, K., Steinman, B. A., Miller, S. K., and Coumou, D. (2017). Influence of anthropogenic climate change on planetary wave resonance and extreme weather events. Sci. Rep. 7:45242.
Marcos, M., Rohmer, J., Vousdoukas, M. I., Mentaschi, L., Le Cozannet, G., and Amores, A. (2019). Increased extreme coastal water levels due to the combined action of storm surges and wind waves. Geophys. Res. Lett. 46, 4356–4364. doi: 10.1029/2019gl082599
Margalef, R. (1978). Life-forms of phytoplankton as survival alternatives in an unstable environment. Oceanol. Acta 1, 493–509.
Masselink, G., Castelle, B., Scott, T., Dodet, G., Suanez, S., Jackson, D., et al. (2016). Extreme wave activity during 2013/2014 winter and morphological impacts along the Atlantic coast of Europe. Coast Eur. 43, 2135–2143. doi: 10.1002/2015gl067492
Matthews, T., Murphy, C., Wilby, R. L., and Harrigan, S. (2014). Stormiest winter on record for Ireland and UK.Nat. Clim. Change 4, 738–740. doi: 10.1038/nclimate2336
Maynard, A., Bible, J. M., Pespeni, M. H., Sanford, E., and Evans, T. G. (2018). Transcriptomic responses to extreme low salinity among locally adapted populations of Olympia oyster (Ostrea lurida). Mol. Ecol. 27, 4225–4240. doi: 10.1111/mec.14863
Mazzini, P., Risien, C., Barth, J., Pierce, S. D., Erofeev, A., Dever, E. P., et al. (2015). Anomalous near-surface low-salinity pulses off the central oregon coast. Sci. Rep. 5:17145.
McCabe, G. J., and Ayers, M. A. (1989). Hydrologic effects of climate change in the Delaware River Basin. Water Resour. Bull. 25, 1231–1242. doi: 10.1111/j.1752-1688.1989.tb01335.x
Ménesguen, A., and Piriou, J.-Y. (1995). Nitrogen loadings and macroalgal (Ulva sp.) mass accumulation in Brittany (France). J. Ophelia 42, 227–237. doi: 10.1080/00785326.1995.10431506
Mentaschi, L., Vousdoukas, M. I., Voukouvalas, E., Dosio, A., and Feyen, L. (2017). Global changes of extreme coastal wave energy fluxes triggered by intensified teleconnection patterns. Geophys. Res. Lett. 44, 2416–2426. doi: 10.1002/2016gl072488
Merot, P., and Buffin, D. (1996). Essai de caractérisation de la variabilité hydrologique en Bretagne. Les Colloq. 79, 127–134.
Molines, J., Barnier, B., Penduff, T., Tréguier, A.-M., and Le Sommer, J. (2014). ORCA12.L46 Climatological and Interannual Simulations Forced With DFS4.4: GJM02 and MJM88. Drakkar Group Experiment Report GDRI-DRAKKAR-2014- 03-19. Available online at: https://www.drakkar-ocean.eu/publications/reports/orca12_reference_experiments_2014
Moskalski, S., Floc’h, F., Verney, R., Fromant, G., Le Dantec, N., and Deschamps, A. (2018). Sedimentary dynamics and decadal-scale changes in the macrotidal Aulne River Estuary, Brittany, France. J. Coast. Res. 34, 1398–1417. doi: 10.2112/jcoastres-d-17-00126.1
Msadek, R., and Frankignoul, C. (2009). Atlantic multidecadal variability and its influence on the atmosphere in a climate model. Clim. Dyn. 33, 45–62. doi: 10.1007/s00382-008-0452-0
Petton, S., Le Roy, V., Bellec, G., Queau, I., Le Souchu, P., and Pouvreau, S. (2020a). Marine Environmental Station Database of Daoulas bay. SEANOE. doi: 10.17882/42493
Petton, S., Pouvreau, S., and Dumas, F. (2020b). Intensive use of Lagrangian trajectories to quantify coastal area dispersion. Ocean Dyn. 70, 541–559. doi: 10.1007/s10236-019-01343-6
Poulton, V. K., Lovvorn, J. R., and Takekawa, J. Y. (2004). Spatial and overwinter changes in clam populations of San Pablo Bay, a semiarid estuary with highly variable freshwater inflow. Estuar. Coast. Shelf Sci. 59, 459–473. doi: 10.1016/j.ecss.2003.10.005
Répécaud, M., Quemener, L., Charria, G., Pairaud, I., Rimmelin, P., Claquin, P., et al. (2019). “National observation infrastructure: an example of a fixed-platforms network along the French Coast: COAST HF,” in Proceedings of the OCEANS 2019, (Marseille: IEEE), 1–6.
Rimmelin-Maury, P., Charria, G., Repecaud, M., Quemener, L., Beaumont, L., Guillot, A., et al. (2020). Iroise Buoy s Data From Coriolis Data Center as Core Parameter Support for Brest Bay and Iroise Sea Studies. Brest, France. SEANOE.
Schaller, N., Kay, A. L., Lamb, R., Massey, N. R., Van Oldenborgh, G. J., Otto, F. E. L., et al. (2016). Human influence on climate in the 2014 southern England winter floods and their impacts. Nat. Clim. Change 6, 627–634. doi: 10.1038/nclimate2927
Seuront, L., Nicastro, K. R., Zardi, G. I., and Goberville, E. (2019). Decreased thermal tolerance under recurrent heat stress conditions explains summer mass mortality of the blue mussel Mytilus edulis. Sci. Rep. 9:17498.
Shi, J., Cui, L., Ma, Y., Du, M., and Wen, K. (2017). Trends in temperature extremes and their association with circulation patterns in China during 1961-2015. Atmos. Res. 212, 259–272. doi: 10.1016/j.atmosres.2018.05.024
Smale, D. A., and Wernberg, T. (2013). Extreme climatic event drives range contraction of a habitat-forming species. Proc. R. Soc. 280, 1–9.
Smith, M. (2011). The ecological role of climate extremes: current understanding and future prospects. J. Ecol. 99, 651–655. doi: 10.1111/j.1365-2745.2011.01833.x
Somavilla, R., González-Pola, C., Rodriguez, C., Josey, S. A., Sánchez, R. F., and Lavín, A. (2009). Large changes in the hydrographic structure of the Bay of Biscay after the extreme mixing of winter 2005. J. Geophys. Res. 114, 1–14.
Somavilla, R., González-Pola, C., Ruiz-Villarreal, M., and Montero, A. L. (2011). Mixed layer depth (MLD) variability in the southern Bay of Biscay. Deepening of winter MLDs concurrent with generalized upper water warming trends ? Ocean Dyn. 61, 1215–1235. doi: 10.1007/s10236-011-0407-6
Somavilla, R., González-Pola, C., Schauer, U., and Budéus, G. (2016). Mid-2000s North Atlantic shift: heat budget and circulation 35 changes. Geophys. Res. Lett. 43, 2059–2068. doi: 10.1002/2015gl067254
Tabari, H., and Willems, P. (2018). Lagged influence of Atlantic and Pacific climate patterns on European extreme precipitation. Sci. Rep. 8:5748.
Theetten, S., Vandermeirsch, F., and Charria, G. (2017). BACH1000_100lev-51: a MARS3D model configuration for the Bay of Biscay. SEANOE. doi: 10.17882/43017
Thibault, K. M., and Brown, J. H. (2008). Impact of an extreme climatic event on community assembly. Proc. Natl. Acad. Sci. U.S.A. 105, 3410–3415. doi: 10.1073/pnas.0712282105
Thompson, V., Dunstone, N. J., Scaife, A. A., Smith, D., Slingo, J. M., Brown, S., et al. (2017). High risk of unprecedented UK rainfall in the current climate. Nat. Commun. 8:107.
Tréguer, P., Goberville, E., Barrier, N., L’Helguen, S., Morin, P., Bozec, Y., et al. (2014). Large and local-scale influences on physical and chemical characteristics of coastal waters of Western Europe during winter. J. Mar. Syst. 139, 79–90. doi: 10.1016/j.jmarsys.2014.05.019
Trouet, V., Babst, F., and Meko, M. (2018). Recent enhanced high-summer North Atlantic jet variability emerges from three century context. Nat. Commun. 9:180.
Turlach, B. A. (1993). Bandwidth selection in kernel density estimation: a review. Core Institut Statistique 19, 1–33.
Van de Pol, M., Jenouvrier, S., Cornelissen, J. H. C., and Visser, M. E. (2010). Behavioural, ecological and evolutionary responses to extreme climatic events: challenges and directions. Philos. Trans. R. Soc. 372, 1–16. doi: 10.1016/j.ecocom.2013.12.001
Wan Zin, W. Z., Jamaludin, S., Mohd Deni, S., and Aziz Jemain, A. (2010). Recent changes in extreme rainfall events in Peninsular Malaysia: 1971-2005. Theor. Appl. Climatol. 99, 303–314. doi: 10.1007/s00704-009-0141-x
Wernberg, T., Smale, D. A., Tuya, F., Thomsen, M. S., Langlois, T. J., Bettignies, T., et al. (2013). An extreme climatic event alters marine ecosystem structure in a global biodiversity hotspot. Nat. Clim. Change 3, 78–82. doi: 10.1038/nclimate1627
Wollast, R. (1998). “Evaluation and comparison of the global carbon cycle in the coastal zone and in the open ocean,” in The Sea—Vol 10: The global Coastal Ocean: Processes and Methods, eds K. H. Brink and A. R. Robinson (Chichester: J Wiley & Sons), 213–252.
Yang, X., Ma, X., Kang, N., and Maihemuti, M. (2018). Probability interval prediction of wind power based on KDE method with rough sets and weighted markov chain. IEEE Access 6, 51556–51565. doi: 10.1109/access.2018.2870430
Yool, A., and Fasham, M. (2001). An examination of the “continental shelf pump” in an open ocean general circulation model. Glob. Biogeochem. Cycles 15, 831–844. doi: 10.1029/2000gb001359
Keywords: Bay of Brest, salinity, river plume, atmospheric weather regimes, extreme events
Citation: Poppeschi C, Charria G, Goberville E, Rimmelin-Maury P, Barrier N, Petton S, Unterberger M, Grossteffan E, Repecaud M, Quéméner L, Theetten S, Le Roux J-F and Tréguer P (2021) Unraveling Salinity Extreme Events in Coastal Environments: A Winter Focus on the Bay of Brest. Front. Mar. Sci. 8:705403. doi: 10.3389/fmars.2021.705403
Received: 05 May 2021; Accepted: 28 June 2021;
Published: 21 July 2021.
Edited by:
Geórgenes Hilário Cavalcante, Federal University of Alagoas, BrazilReviewed by:
Zhaoqing Yang, Pacific Northwest National Laboratory (DOE), United StatesEduardo Siegle, University of São Paulo, Brazil
Copyright © 2021 Poppeschi, Charria, Goberville, Rimmelin-Maury, Barrier, Petton, Unterberger, Grossteffan, Repecaud, Quéméner, Theetten, Le Roux and Tréguer. This is an open-access article distributed under the terms of the Creative Commons Attribution License (CC BY). The use, distribution or reproduction in other forums is permitted, provided the original author(s) and the copyright owner(s) are credited and that the original publication in this journal is cited, in accordance with accepted academic practice. No use, distribution or reproduction is permitted which does not comply with these terms.
*Correspondence: Coline Poppeschi, coline.poppeschi@ifremer.fr