Habitat Use and Behavior of Multiple Species of Marine Turtles at a Foraging Area in the Northeastern Gulf of Mexico
 Natalie E. Wildermann1
  Christopher R. Sasso2
  Lesley W. Stokes2
  Derke Snodgrass2
  Mariana M. P. B. Fuentes1*
- 1Marine Turtle Research, Ecology and Conservation Group, Department of Earth, Ocean, and Atmospheric Science, Florida State University, Tallahassee, FL, United States
- 2National Marine Fisheries Service, NOAA Southeast Fisheries Science Center, Miami, FL, United States
Multi-species conservation strategies can be useful to maximize allocation of resources. To effectively plan for multi-species management practices, it is important to have a robust understanding of the variability in the spatial and behavioral ecology of sympatric species. To address this in the context of marine turtles, this study explored fine-scale habitat use by three sympatric species [juvenile green turtles (Chelonia mydas), Kemp’s ridley turtles (Lepidochelys kempii) and loggerhead turtles (Caretta caretta)] in a foraging area near Crystal River, Florida, United States. By combining sighting surveys and satellite tracking methods, we found that the distribution of the three species of marine turtles in this region overlapped both in space and time. We also observed differences in the fine-scale location of hotspots and in-water behavior among species, with some degree of apparent habitat partitioning. Habitat partitioning was particularly evident when assessing the diving and surfacing behavior of tracked turtles, with some degree of differentiation in diel diving patterns, particularly depths utilized during daytime/nighttime and the dive/surface duration. Our study provides ecological baseline data on the spatial overlap, habitat use and behavior of three sympatric marine turtle species, which can inform future management strategies at nearshore marine habitats in the Northeastern Gulf of Mexico.
Introduction
Conservation strategies for multiple species can be appropriate when there is spatial overlap among different species of conservation concern with similar ecological roles, habitat use, and common threats (IUCN/SSC, 2008). When resources (e.g., funds) are limited and conservation actions are time-sensitive, a multi-species approach can provide a cost-effective solution to the conservation/management of the species at issue (e.g., Sanderson et al., 2002; Downey et al., 2008; IUCN/SSC Species Conservation Planning Sub-Committee, 2017). However, one of the trade-offs of a multi-species management approach is that it can be challenging to accommodate for species-specific needs. Vulnerability to environmental changes (both anthropogenic and natural) can differ substantially between species, depending on the species’ ecological (e.g., habitat use, inter and intraspecific interactions, prey–predator interactions), biological (e.g., genetic, physiology, anatomy) and behavioral traits (e.g., foraging, resting and migratory behaviors, diving patterns). Characterizing these differences can help identify which species are more likely to be vulnerable within an ecosystem, and thus more effectively strategize local conservation efforts tailored to the different sympatric species of interest and their overlapping needs (Auerbach et al., 2014; Lindström et al., 2014).
Conservation of highly mobile and migratory megafauna, such as marine turtles, requires coordinated efforts to protect species across their range. Marine turtles are known to aggregate in coastal foraging areas as a result of seasonal shifts (e.g., Schmid and Witzell, 2006; Hawkes et al., 2007; Shimada et al., 2016a), and in-between developmental (e.g., Musick and Limpus, 1997; Mansfield et al., 2009; Vélez-Rubio et al., 2018) or reproductive stages (e.g., Miller, 1997; Hatase and Tsukamoto, 2008). Vulnerability of marine turtles to potential threats will vary greatly at each of these stages, and will depend on the specific characteristics and intensity of the threats and the biological and ecological plasticity of the affected individuals (Bolten et al., 2011; Fuentes et al., 2015; Klein et al., 2016). The large spatial scale of marine turtle migrations makes it challenging to quantify and manage threats across their range. Home ranges on coastal foraging habitats are usually smaller in scale, but habitat use can be variable and dependent on the specific site, species and life stage (e.g., Schofield et al., 2010; Shimada et al., 2014; Gillis et al., 2018). Thus, knowledge on the spatial aggregation of marine species at foraging areas can be a valuable tool for managers seeking to provide local and regional protection to endangered species (Heupel and Simpfendorfer, 2005). Expanding our knowledge on the spatial and temporal patterns in the distribution and habitat use of foraging turtles, in particular juvenile life stages (Wildermann et al., 2018a), is a current research priority to inform management actions at local scales (Hamann et al., 2010; Rees et al., 2016).
The sub-tropical neritic habitats along the coast of Florida, United States, are home to various life-stages of multiple marine turtle species [i.e., green turtle (Chelonia mydas, CM), Kemp’s ridley turtle (Lepidochelys kempii, LK), loggerhead turtle (Caretta caretta, CC), leatherback turtle (Dermochelys coriacea, DC), and hawksbill turtle (Eretmochelys imbricata, EI)]. Extended efforts have been undertaken in this region to generate and compile biological and ecological information of marine turtles in foraging habitats (see review in Eaton et al., 2008). Even though the co-existence of multiple marine species is well documented in the region (Eaton et al., 2008; Hart et al., 2018; Lamont and Iverson, 2018), studies on the habitat use have typically focused on a single species (e.g., Schmid, 2000; Makowski et al., 2006; Bresette et al., 2010; Foley et al., 2014). Consequently, there is a substantial body of knowledge on the distribution, movement and habitat use of juvenile CM and LK in several locations along Florida’s coast (Carr and Caldwell, 1956; Mendonça, 1983; Ogren, 1989; Rudloe et al., 1991; Renaud, 1995; Barichivich et al., 1998; Schmid, 1998, 2000; Schmid and Barichivich, 2005; Barichivich, 2006; Makowski et al., 2006; Schmid and Witzell, 2006; Bresette et al., 2010; IRG, 2012). Less is known about juvenile CC distribution and habitat use in coastal habitats of Florida (Mendonça and Ehrhart, 1982; Eaton et al., 2008; Lamont and Iverson, 2018), with one of the remaining geographic gaps in in-water research encompassing the southern Big Bend region in northwest peninsular Florida [Northeastern Gulf of Mexico (NeGM)] (Eaton et al., 2008).
To elucidate the benefits of determining habitat use by sympatric marine turtle species and provide a better understanding of the fine-scale habitat use by species, we assessed the spatial distribution and behavioral strategies of juvenile CM, LK, and CC near Crystal River (CR), Florida, located in the NeGM. By comparing species-level behavior we (a) identified areas where multiple marine turtle species overlap, (b) determined the differential use of habitat and shared resources among species, based on the horizontal (home range and core areas) and vertical (general and diel diving behavior) movements of satellite tracked turtles.
Materials and Methods
This study was carried out in accordance with the recommendations of National Marine Fisheries Service ESA Section 10(a) permit (#16733, #19496), Florida Fish and Wildlife Conservation Commission Marine Turtle Permit (MTP-16-30, MTP-16-243, MTP-17-243A), Research and Monitoring Special Use permit for Chassahowitzka (#41510-14002, #16011), and Florida Animal Care and Use Committee permit (ACUC #1524).
Study Area
This study was conducted in the coastal waters of the NeGM offshore of Citrus County between Crystal Bay and Homosassa Bay (hereafter CR region; Figure 1), which has been identified as important marine turtle habitat for three species of marine turtles: CM, LK, and CC (Barichivich et al., 1998; Schmid, 1998; Eaton et al., 2008). Limited information exists on the relative and cumulative impact of natural and anthropogenic threats to the local marine turtle populations, but recent evidence suggests that the recreational scallop harvest influences the behavior and distribution of marine turtles in the region (Wildermann et al., 2018b). There are two special management areas within the study area: St. Martins Marsh Aquatic Preserve (SAP) managed at state level (Florida Department of Environmental Protection, 2017) and Chassahowitzka National Wildlife Refuge (CNR) managed at federal level (U. S. Fish and Wildlife Service, 2010; Figure 1). The SAP was established in 1969 to protect “submerged lands of exceptional beauty that are to be maintained in their natural or existing conditions” (Florida Department of Environmental Protection, 2017), and the CNR was established in 1943 to protect waterfowl (U. S. Fish and Wildlife Service, 2010).
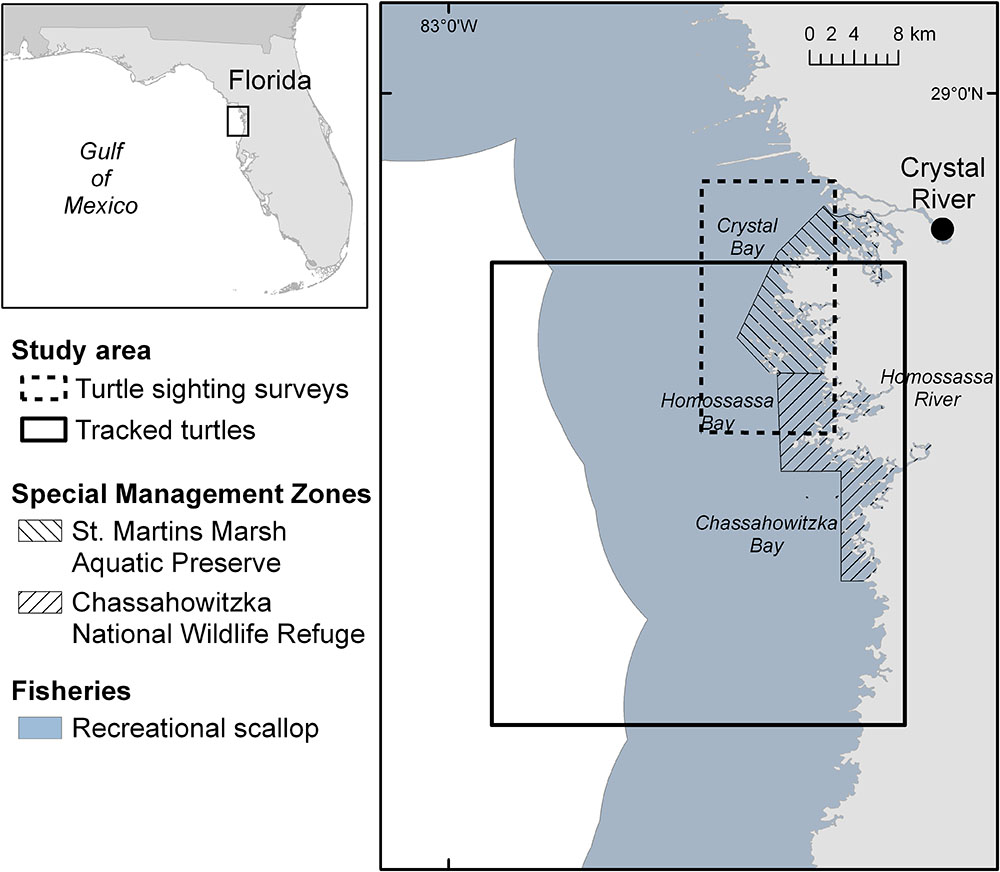
Figure 1. Study area in the Crystal River region, located in the Northeastern Gulf of Mexico, in Florida, United States.
Turtle Sightings and Captures
Turtle sightings were recorded opportunistically using a GPS along an area up to 11 km offshore between CR and Homosassa River (Figure 1). The study area was randomly sampled across different survey days. Survey days were randomly selected within each month between July and September 2016 using equal probability sampling across all day types (weekends, holidays, and weekdays) and conducted between 1100 and 1400, for a total of 13 survey days. A subset of the sighted turtles was captured using the “rodeo” technique (Limpus and Walter, 1980; Fuentes et al., 2006) and by dipnet. Once on board, we recorded standard straight carapace length (SCL ± 0.1 cm, measured from the anterior point at the nuchal scute to the posterior tip of the supracaudals) and body weight (±0.1 kg) of each turtle (Balazs, 1999), and marked them with two Inconel flipper tags (National Band and Tag Company, Style 681) and a passive integrated transponder (PIT tag, Biomark, GPT12) (Balazs, 1999).
Satellite Tag Deployment
Between 2014 and 2017 turtles were captured during five trips. Three turtles were captured during sighting surveys in 2016 in the northern extent (near SAP) of the survey area. All remaining turtles (5 in 2014, 2 in 2015, 4 in 2016, and 2 in 2017) were captured in the southern extent of the study area (near CNR) during random surveys dedicated to find marine turtles for satellite tracking following the protocols stated above. We deployed Argos-linked Fastloc GPS [Wildlife Computers SPLASH 10-BF-351E (n = 3), SPLASH 10-F296 (n = 2) and SPLASH 10-F297 (n = 11)] tags on 16 marine turtles (9 CM, 5 LK, and 2 CC; Table 1). Each turtle was released at the same location where it was captured. Satellite tags were attached using the methods described by Seney et al. (2010) for small juvenile turtles. Thirteen of the tags (models SPLASH 10-F296 and 10-F297) recorded diving behavior parameters (i.e., maximum dive depth, maximum dive and surface duration, time-at-depth or the proportion of time spent at predefined depth bins) and temperature (time-at-temperature or the proportion of time spent at predefined temperature bins). Binned data were sampled every 10 s and provided as summarized proportion of time in 6 h bins (at 0200, 0800, 1400, and 2000 Eastern Standard Time). Maximum dive depth was collected every 0.5 m from 0.5 to 12 m. Maximum dive and surface duration were collected every 1 min from 1 to 5 min, then every 5 min from 5 to 30 min, then every 10 min from 30 to 60 min, and then >60 min. Time-at-depth was collected every meter from 0 to 5 m, and then every 10 m from 10 to 200 m, and then >200 m. Time-at-temperature was collected every 2°C from 8 to 32°C, and then >32°C.
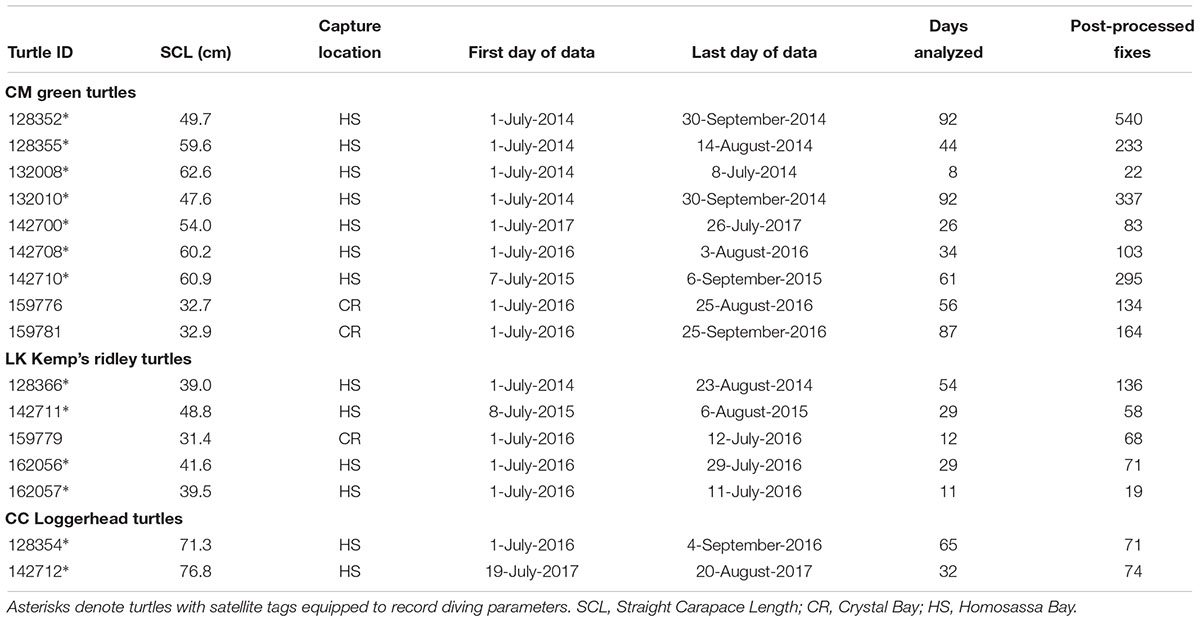
Table 1. Summary of marine turtles tracked between July and September (2014–2017) in the Crystal River region, United States.
Spatial Distribution of Tracked Turtles
Satellite-derived GPS locations of each turtle were extracted for the summer months within the open scallop recreational fishery season (July–September). We reconstructed the tracks of individual turtles by fitting a hierarchical first difference correlated random walk state space model (hDCRW-SSM) to each track (Jonsen et al., 2006), using the bsam package (Jonsen et al., 2017) in R v.3.5.1 (R Core Team, 2018). The models were computed using all satellite-derived locations [all GPS locations and ARGOS location class (LC) 3, 2, 1, 0, A and B; Supplementary Figure 1A and Supplementary Table 1]. Both ARGOS and GPS locations were utilized in the spatial analysis to maximize data retention and fill temporal gaps – ARGOS data trades lower accuracy for more frequent transmissions compared to GPS data (Supplementary Table 1). Nevertheless, to overcome this issue the hDCRW-SSM takes into account the estimated error associated with each ARGOS LC (Jonsen et al., 2006), which ranges from 3000 m for LC B to 150 m for LC 3 (see Vincent et al., 2002; Jonsen et al., 2005 for details on how estimated errors are calculated). To incorporate GPS locations in the model, we assigned them the lowest ARGOS error (LC 3, <150 m), as per Thums et al. (2017). The modeling parameters were as follows: we iterated one Markov chain Monte Carlo (MCMC) 300000 times, the first 100000 iterations were excluded (burn-in), every 100th of the remaining 200000 iterations was retained, and reconstructed locations were computed at 12-h intervals. We removed reconstructed locations that fell within periods with more than 5 days without raw fixes, to decrease the influence of erroneous locations when there are long periods of missing data (Bailey et al., 2008; Shimada et al., 2016b). The reconstructed tracks were then combined with the raw high-quality satellite-derived locations (all GPS locations, and ARGOS LC 3, 2, and 1) (Shimada et al., 2016b), and further filtered by removing visually obvious erroneous fixes (e.g., locations on land) (Supplementary Figure 1B). We then used the filtered locations to compute utilization distributions (UDs) of each individual employing a movement-based kernel density estimation (MKDE) based on a biased random bridge model (BRB) (Benhamou, 2011) to estimate home ranges (95% UD) and core areas (50% UD), with the package adehabitatHR (Calenge, 2011) in R.
Diving Behavior of Tracked Turtles
We used all binned time-at-depth and time-at-temperature records for each turtle to assess the vertical habitat use by each individual and species. We also examined the diving data for patterns in the maximum depth and duration of diving/surface behavior among species. In addition, we explored potential diel diving patterns for each species by clarifying each entry as daytime or nighttime, based on the local sunrise and sunset times for each day (NOAA Solar Calculator1). To decrease the influence of outliers, we discarded values outside the 99% percentile for each species and dive parameter (maximum diving depth, maximum diving duration and maximum surface duration).
Statistical Analyses
Descriptive statistics are expressed as mean ± standard deviation (SD). All statistical analyses were performed in R v. 3.5.1 (R Core Team, 2018). We fitted a One-way ANOVA or Kruskal–Wallis sum rank test (depending on normality and homogeneity of variance of samples) to assess the relationship between size of home ranges and core areas among species and to explore trends in Sea Surface Temperature (SST) across the sampling years. Monthly SST (based on the 11 μ daytime spectral band) for each year (2014–2017) was derived from NASA’s Aqua MODIS satellite at 4 km resolution (NASA Goddard Space Flight Center, Ocean Ecology Laboratory, Ocean Biology Processing Group, 2014). Differences in diving behavior parameters (maximum dive depth, dive duration and surface duration) among species was assessed through a Linear Mixed Effect Model (LMEM) with three-way nested data following the top-down protocol and likelihood ratio tests outlined in Zuur et al. (2009). Estimation of the final models was done with the restricted maximum likelihood (REML) method, with species as the fixed explanatory variable and individuals as random effect. For each model we log transformed the response (maximum dive depth, maximum dive duration or maximum surface duration). We acknowledge that differences in tracking duration among individuals (e.g., a turtle that was tracked over 3 months versus a turtle that was tracked over 1 month) might influence UD size estimates, which is a common issue in satellite tracking studies on marine megafauna. Thus, our results should be interpreted with caution considering that unequal tracking might yield to UD estimates biased toward the longest tracking durations.
Results
Spatial Distribution of Sighted Marine Turtles
In total, 297 individuals of three species of marine turtles were sighted during 13 survey days. CM were the most abundant species (n = 245), followed by LK (n = 34) and CC (n = 18). An apparent space partitioning among species was evident based on the turtle sighting surveys (Figure 2). Seemingly, “hotspots” of sighted CM and LK overlapped in the northern extent of the study area (Figures 2A,B), near the SMP, whereas “hotspots” for CC were concentrated further south in the Homosassa Bay region (Figure 2C). Overlap of the three marine turtle species was evident west off the boundary between SMP and CNR (Figure 2D).
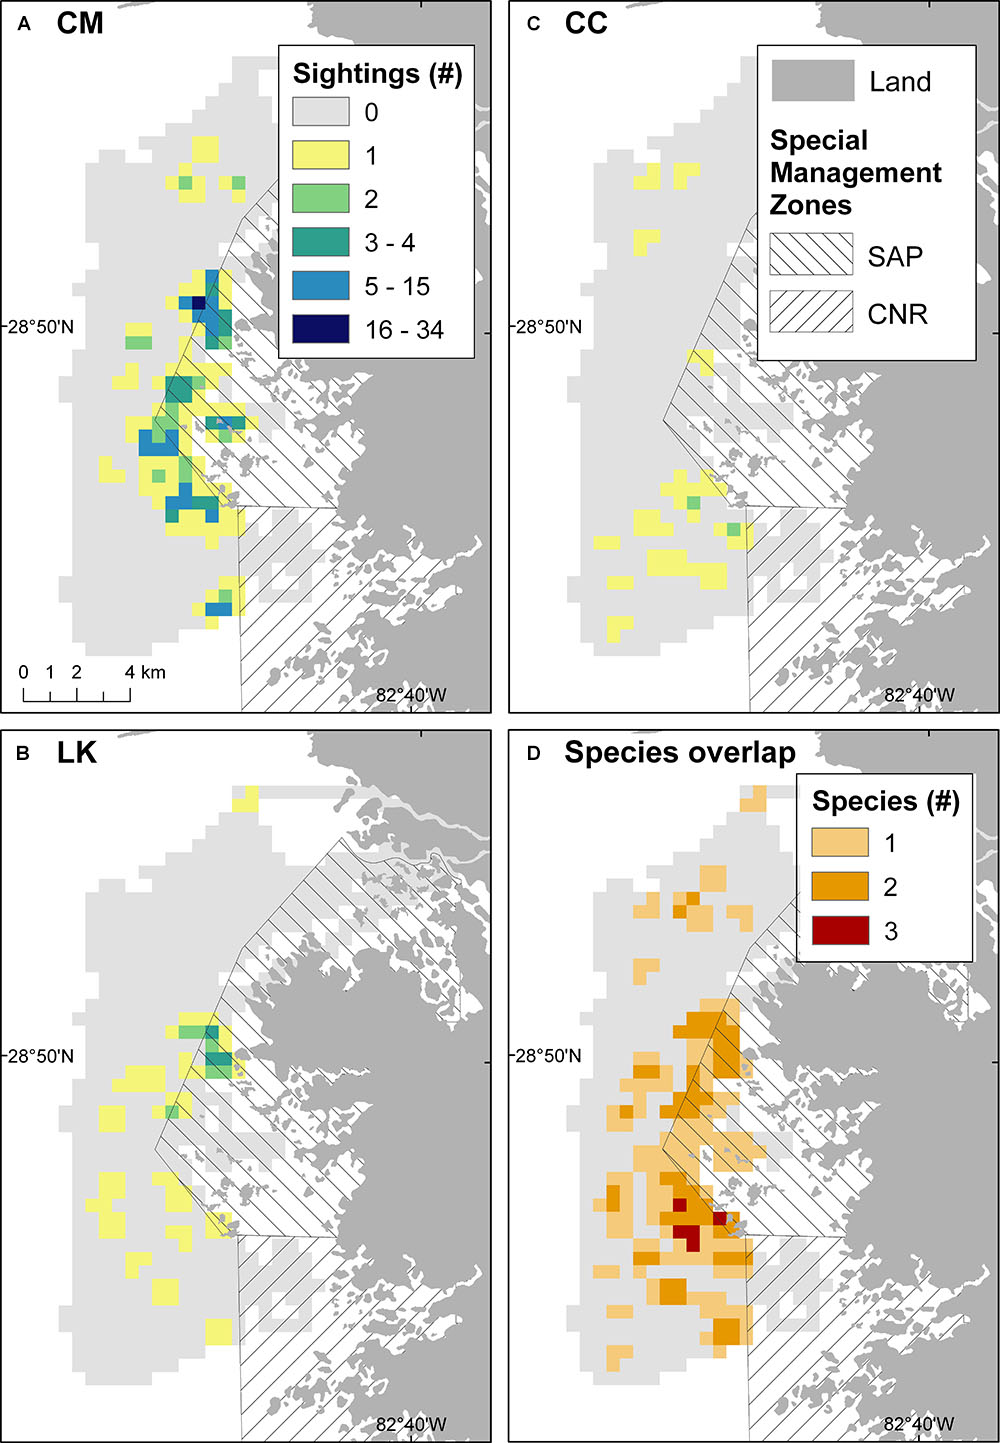
Figure 2. Spatial distribution of marine turtle sightings between July and September 2016 in the Crystal River region, United States: (A) 245 CM green turtles; (B) 34 LK Kemp’s ridley turtles; (C) 18 CC loggerhead turtles; and (D) the overlap of species (number of marine turtle species recorded in each cell). Light gray cells represent surveyed areas where no marine turtles were sighted. SAP, St. Martins Marsh Aquatic Preserve; CNR, Chassahowitzka National Wildlife Refuge.
We captured 72 individuals out of the sighted turtles (43 CM, 23 LK, and 6 CC). Most turtles were estimated to be immature, with higher proportions of small sized immature CM (<40 cm SCL; Figure 3A), medium to large immature LK (40–55 cm SCL; Figure 3B) and large immature and adult (1 female and 2 males) CC (85–93 cm SCL; Figure 3C). While depth at capture was not recorded during the surveys, consistent anecdotal reports in the study area between 2014–2017 suggest that larger turtles (immatures and some adults) are predominantly distributed in deeper waters (1–5 m), while smaller turtles remain mostly in very shallow waters (<1 m).
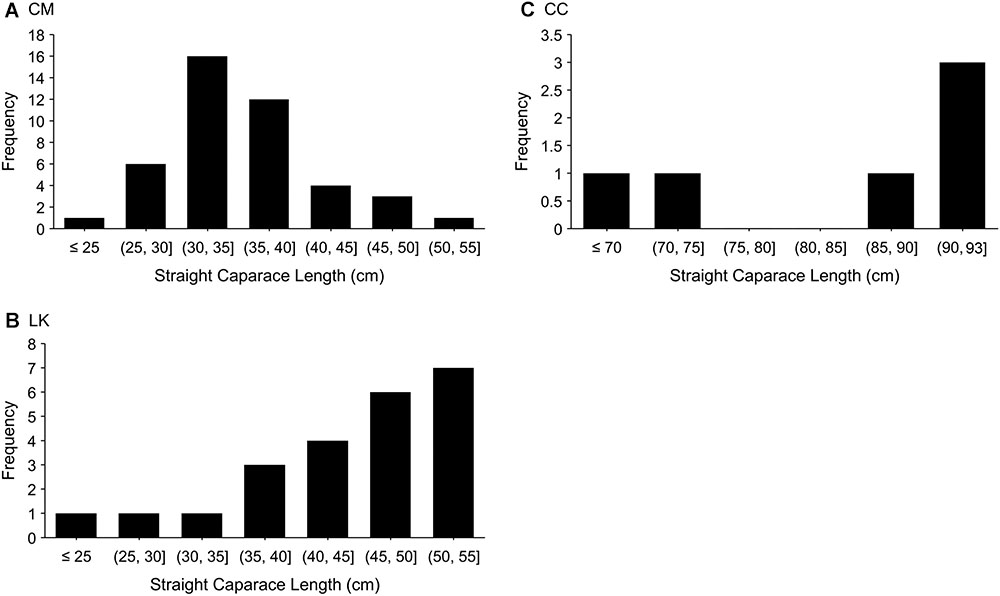
Figure 3. Frequency of size classes of marine turtles captured between July and September 2016 in the Crystal River region, United States: (A) 43 CM green turtles; (B) 23 LK Kemp’s ridley turtles; and (C) 6 CC loggerhead turtles.
Spatial Distribution of Tracked Marine Turtles
We tracked 16 turtles (9 CM, 5 LK and 2 CC) during the summer months (July–September) between 8 and 92 days (45 ± 28 days) (Table 1). Most tracked turtles were captured in random surveys dedicated to find individuals and deploy satellite tags, while 3 turtles (2 CM IDs 159776 and 159781, and 1 LK ID 159779) were captured during sighting surveys. All tracked turtles were of juvenile size, with mean SCL of 51.1 ± 1.6 cm for CM, 40.1 ± 6.2 cm for LK and 74.1 ± 3.9 cm for CC (Table 1). All turtles remained within the study area during the summer months. The recorded SST did not significantly differ during the summer months between 2014 and 2017 (One-way ANOVA; F = 0.596, df = 3, p = 0.635); therefore, we assumed that the distribution of tracked turtles among years was not influenced by the inter-annual variability in water temperature during this period. Moreover, maps on the distribution of turtles varied slightly depending on the method used to estimate the distribution of turtles (i.e., sightings or tracking). Only three turtles were captured and tracked concurrently during sighting surveys (carried out in the northern extent of the survey area, near SAP; Figure 1). Two of these turtles (CM ID 159781 and LK ID 159779) had home ranges that overlapped with an area of frequent turtle sightings, namely around the boundary of the central region of SMP (CM Figure 2A and Supplementary Figure 2C; LK Figure 2B and Supplementary Figure 2G). In contrast, the third tracked turtle (CM ID 159776) moved away from the capture location and utilized a nearshore area within the CNR (Figure 2A and Supplementary Figure 2C), which was not covered during the turtle sighting surveys.
Across all years, core areas (50% UD) of the different species overlapped in some regions, particularly in the northern extent of SAP and west off southern CNR (Figure 4). However, in most cases individual tracked turtles used distinctive areas, even within the same year (Supplementary Figure 2). The exception to this was for CM in 2014 (Supplementary Figure 2A) and CM and CC in 2017 (Supplementary Figures 2D,I), which seemed to have a larger overlap of their core areas. While most tracked turtles were distributed in waters between 5 and 15 km away from mainland, some LK (IDs 142711, 159779, and 162057,) and CM (IDs 159776 and 159781) used nearshore areas in close proximity to mangroves, and just one green turtle (ID 142708) moved further offshore to deeper waters (Figure 4).
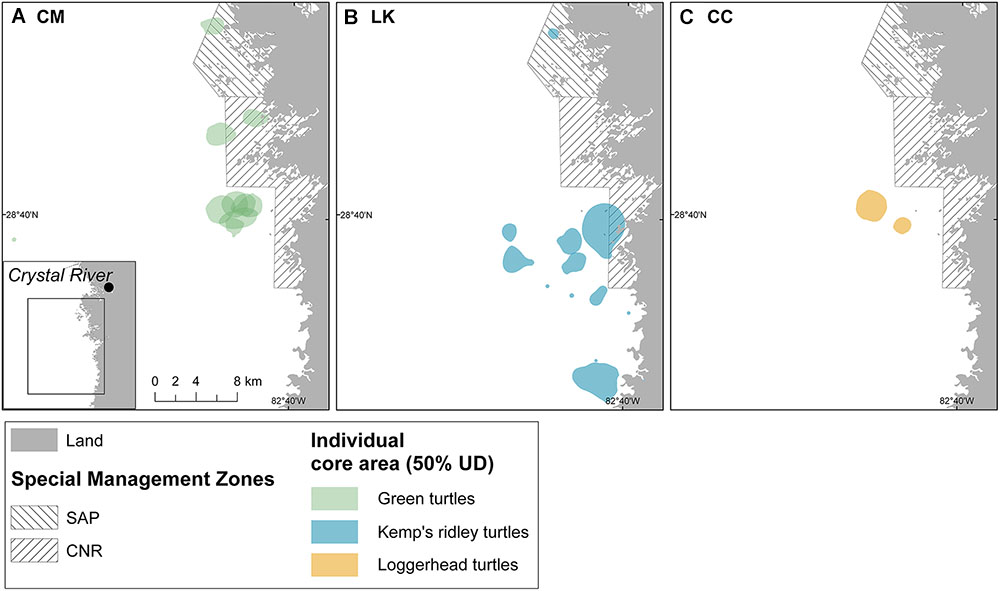
Figure 4. Spatial distribution of core areas (50% UD) of turtles tracked between July and September (2014–2017) in the Crystal River region, United States: (A) 9 CM green turtles; (B) 5 LK Kemp’s ridley turtles; and (C) 2 CC loggerhead turtles. SAP, St. Martins Marsh Aquatic Preserve; CNR, Chassahowitzka National Wildlife Refuge.
Size of home ranges (95% UD; One-way ANOVA; F = 2.241, df = 2, p = 0.146; Figure 5A) and core areas (50% UD; Kruskal–Wallis rank sum test; X2 = 0.16078, df = 2, p = 0.92; Figure 5B) were not significantly different among species. Areas used by CM (95% UD = 24.3 ± 9.8 km2; 50% UD = 4.4 ± 1.3 km2) and CC (95% UD = 24.1 ± 16.6 km2; 50% UD = 4.7 ± 3.5 km2) were similar in size, while the ones used by LK were relatively larger (95% UD = 64.9 ± 62.1 km2; 50% UD = 9.4 ± 10.1 km2).
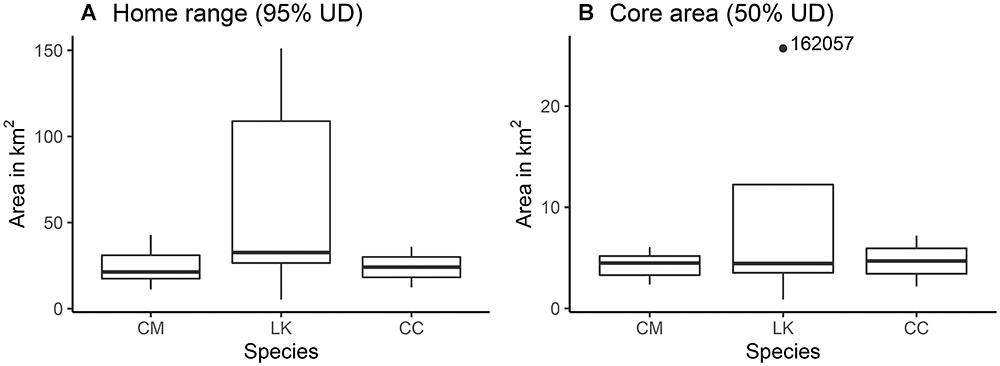
Figure 5. Area in km2 of (A) home ranges (95% UD) and (B) core areas (50% UD) of marine turtles (3 CM green turtles, 5 LK Kemp’s ridley turtles, and 2 CC loggerhead turtles) tracked between July and September (2014–2017) in the Crystal River region, United States.
Diving Behavior of Tracked Turtles
Diving parameters were only registered by turtles tracked from Homosassa Bay (7 CM, 4 LK, and 2 CC; Figure 1). Maximum dive depths most frequently recorded by the tracked turtles differed among each species. Tracked CM (n = 7) used a wider range of depths (up to 12 m), spending most of the time diving at 3 m of depth (27 and 30%, respectively) (Figure 6-CM). Most dives of LK (n = 4) were at 2 and 3 m of depth (34%), with frequent dives also at 1 and 2 m depth (25 and 23%, respectively) (Figure 6-LK), whereas CC (n = 2) spent most of the time (57%) at 1 m depth (Figure 6-CC). All species spent the highest proportion of time in waters around 32°C, with temperatures ranging between 28 and 32°C (Supplementary Figure 3).
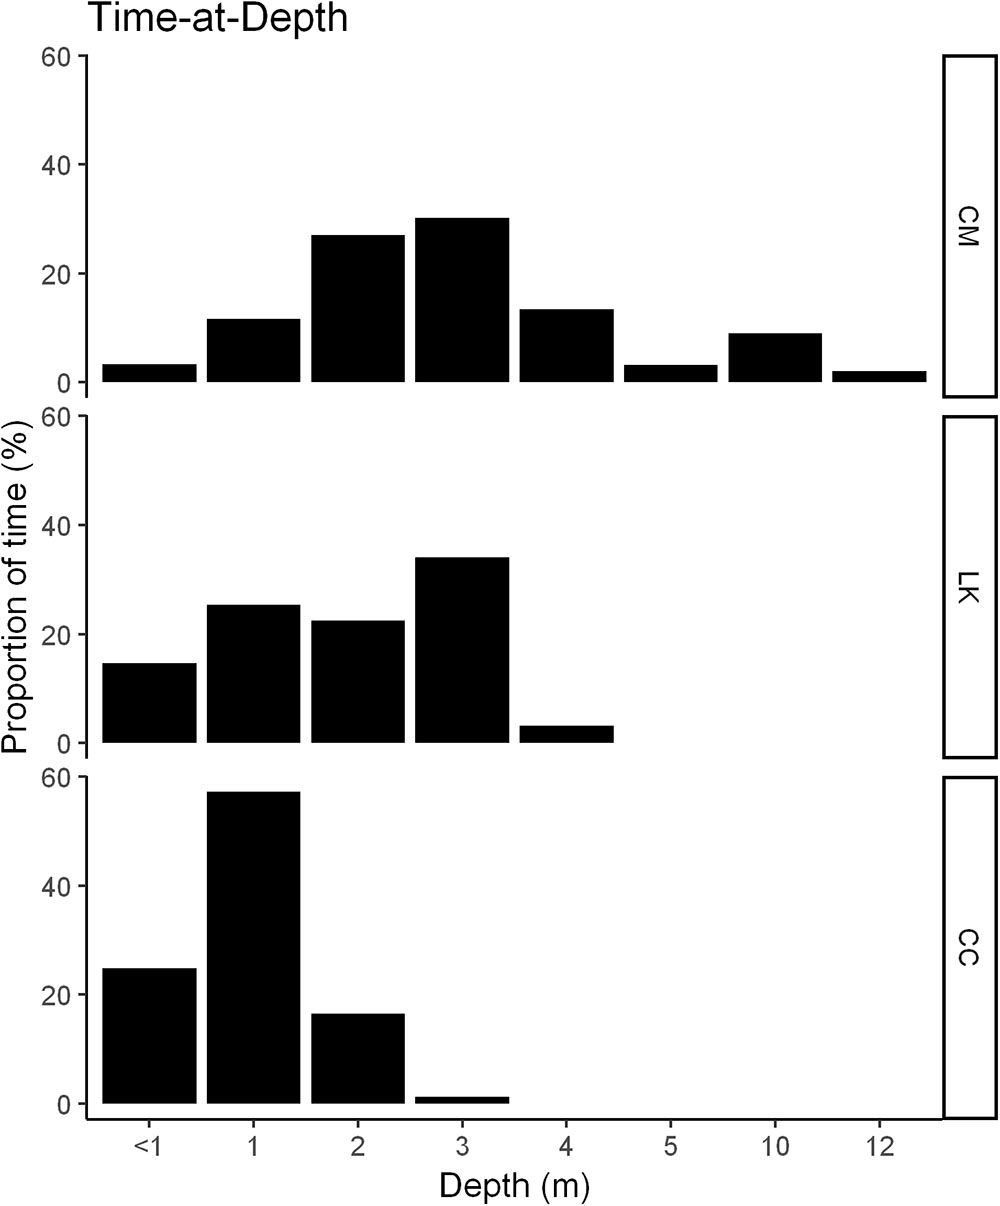
Figure 6. Histograms of the proportion of time each species spent within each dive depth bin. Data were obtained from 13 turtles (7 CM green turtles; 4 LK Kemp’s ridley turtles; and 2 CC loggerhead turtles), tracked between July and September (2014–2017) in the Crystal River region, United States.
Variability among individuals was significant for all diving behavior parameters and explained most of the differences in the maximum dive depth, dive duration and surface duration among species (LMEM fit by REML; models: response∼species, random=∼1|turtle). When comparing species-level variability in diving depth, significant differences were found between CM and CC, but not with LK. Maximum depth used by CM (3.4 ± 1.2 m) was significantly deeper than depths used by CC (1.6 ± 0.6 m) (LMEM fit by REML; t-value = -2.346541, df = 10, p = <0.0409); maximum depth used by LK averaged 3.1 m (±0.6 m) (Figure 7A). The maximum dive duration was highest for CC (29.5 ± 35.9 min), followed by CM (21.4 ± 22.7 min), and shortest for LK (11.5 ± 7.17 min) (Figure 7B). There were no significant differences in maximum dive duration among species. Nevertheless, the maximum surface duration of CM (17.5 ± 12.5 s) was significantly lower than that of LK (21.6 ± 13.0 s) (LMEM fit by REML; t-value = 4.59459, df = 10, p = <0.0010) and that of CC (22.5 ± 22.8 s) (LMEM fit by REML; t-value = 2.80161, df = 10, p = <0.0187) (Figure 7C), There were no significant differences in surface duration between LK and CC.
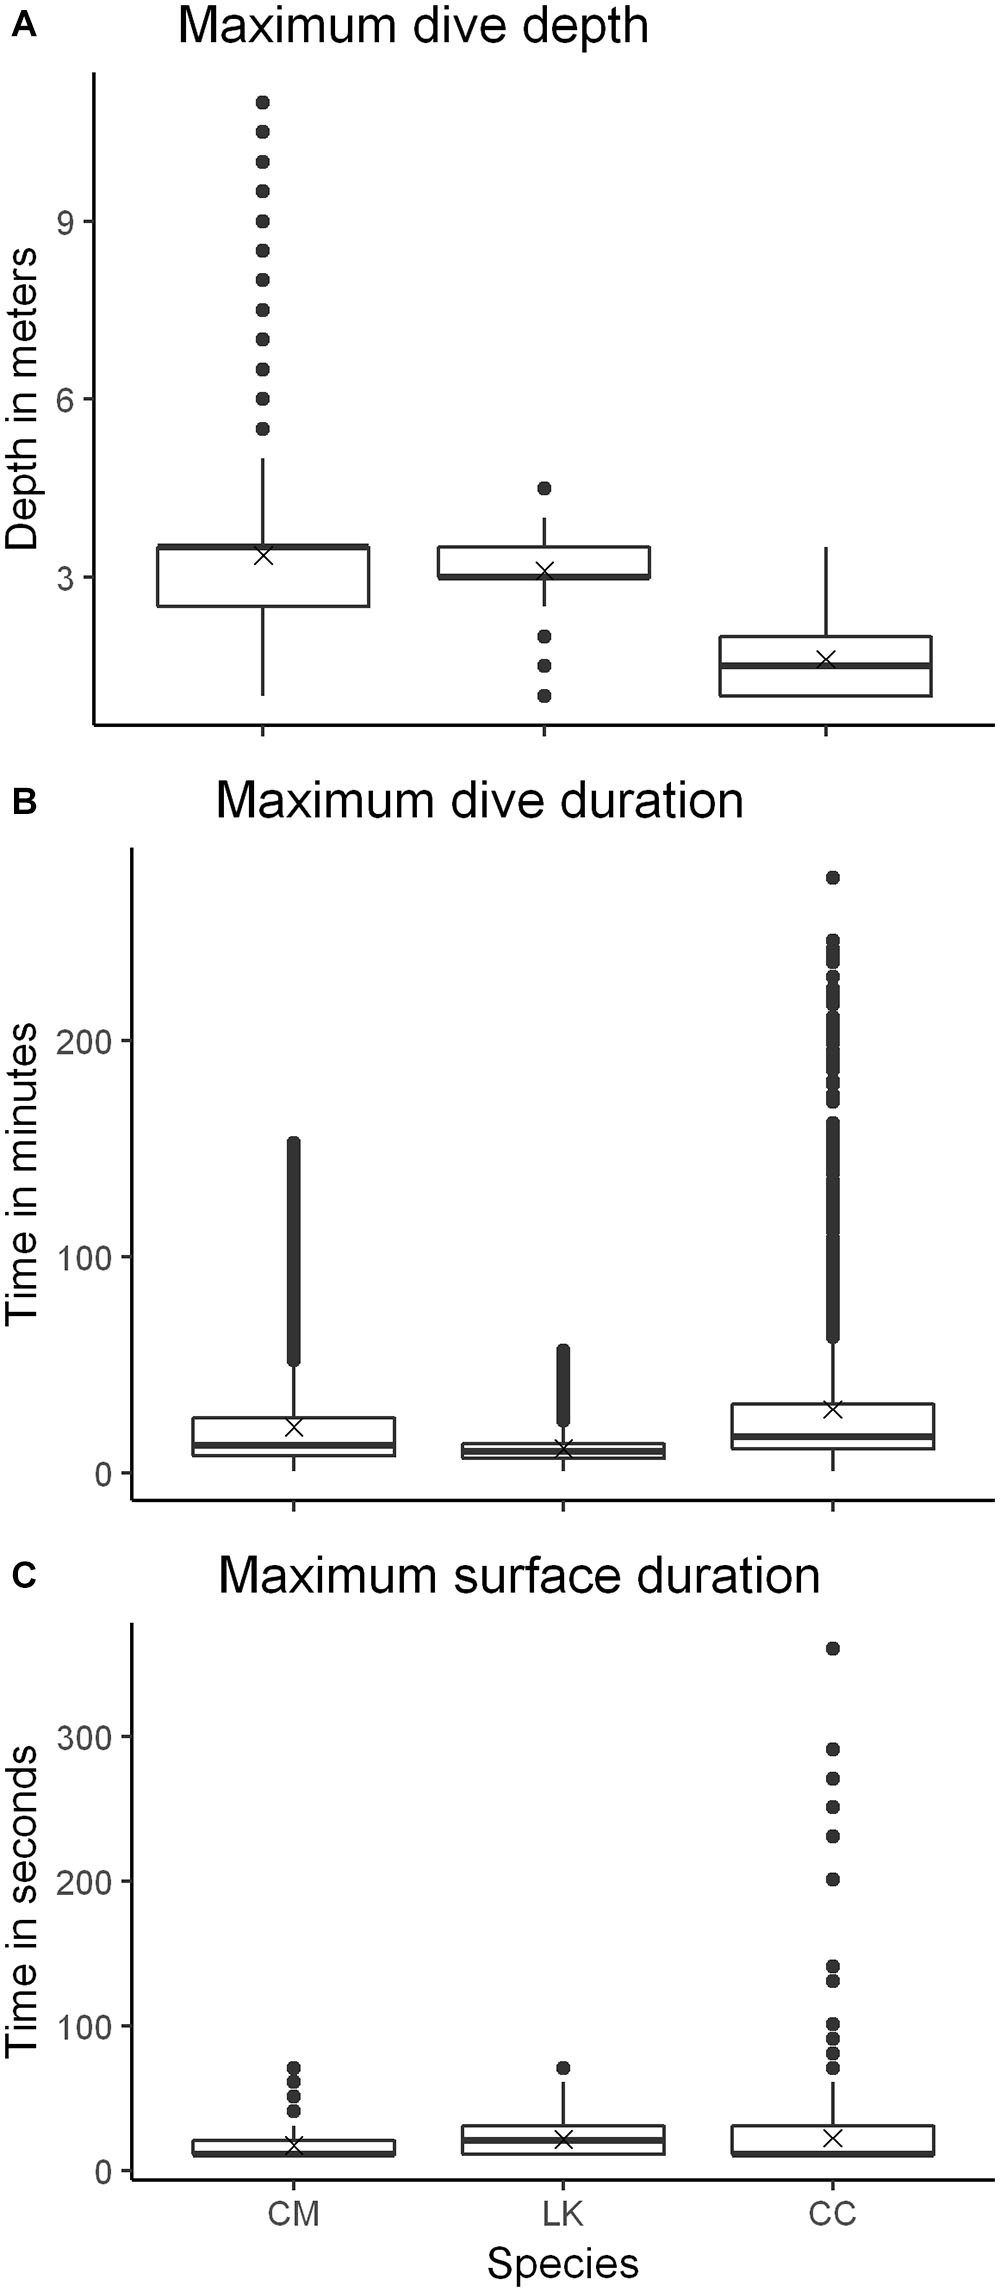
Figure 7. Box-plots of three diving behavior parameters: (A) maximum dive depth, (B) maximum dive duration, and (C) maximum surface duration, for each species. Data were obtained from 13 turtles (7 CM green turtles; 4 LK Kemp’s ridley turtles; and 2 CC loggerhead turtles), tracked between July and September (2014–2017) in the Crystal River region, United States. Box-plot description: whiskers represent the minimum and maximum values, box represents values in the second and third quantiles, line inside the box represents the median, “x” represents the mean, circles represent outliers.
All species used similar depths during the night, with CM slightly increasing the proportion of time at depths up to 3 m during nighttime compared to daytime (Supplementary Figure 4-CM), and CC slightly increasing the proportion of time at 2 m (Supplementary Figure 4-CC). There were no clear diel patterns in the depths used by LK (Supplementary Figure 4-LK). In addition, diel activity patterns in maximum dive depth for each species were on average similar during daytime and nighttime (CMday = 3.65 ± 1.08 m, CMnight = 3.16 ± 1.14 m; LKday = 3.19 ± 0.59 m, LKnight = 3.01 ± 0.63 m; CCday = 1.69 ± 0.54 m, CCnight = 1.56 ± 0.58 m) (Supplementary Figure 5A). Maximum dive durations for CM and CC were on average longer during daytime compared to nighttime (CMday = 26.2 ± 27.6 min, CMnight = 18 ± 17.5 min; CCday = 34.2 ± 43 min, CCnight = 25.9 ± 28.5 min), but remained similar during both time periods for LK (LKday = 11.7 ± 7.8 min, LKnight = 11.2 ± 6.34 min) (Supplementary Figure 5B). In contrast, maximum surface durations for CM and CC were on average longer during nighttime compared to daytime (CMday = 13.1 ± 7.28 s, CMnight = 20.6 ± 14.6 s; CCday = 17.6 ± 19.1 s, CCnight = 26.6 ± 24.9 s), while surface durations for LK remained similar throughout day and night (LKday = 20.7 ± 12.4 s, LKnight = 22.7 ± 13.6 s) (Supplementary Figure 5C).
Discussion
The CR region in the NeGM is an important developmental foraging area for CM, LK and CC, where their distribution overlaps both in space and time. In addition, there were marked differences in the fine-scale location of hotspots and in-water behavior among species and across years in this region, with some degree of apparent habitat partitioning among species (based on sighting “hotspots”) and individuals (based on core areas of tracked turtles). This spatial partitioning is likely driven by the food preferences of each species. This is based on meso-scale observations since there is no information on the distribution and availability of prey items in the study area. Habitat partitioning can be driven by differential behavioral traits among life-stages and species (e.g., depth use, use of different resources within the same area, or the same resource at different times; Griffin and Griffin, 2003; Parra, 2006; Blumenthal et al., 2008).
All individuals displayed typical foraging behavior for the three species in nearshore foraging areas (e.g., distinctive and stable small home ranges; Mendonça, 1983; Schmid et al., 2003; Hart and Fujisaki, 2010; Rees et al., 2012). Consistently utilizing smaller areas for foraging could help maximize energy budgets (e.g., less energy spent searching) and resource exploitation (Ford, 1983). Comparisons of home range sizes with other studies were limited due to the large variability in tracking methods (e.g., radiotelemetry, active tracking, satellite tracking), data resolution (e.g., ARGOS, GPS) and home range estimators (e.g., minimum convex polygons, kernel density estimation). In a study carried out in Palm Beach along the Atlantic coast of Florida (Makowski et al., 2006), home range size of tracked juvenile green turtles (95% UD = 2.09 ± 1.80 km2; 50% UD = 0.49 ± 0.39 km2) was substantially smaller than green turtles tracked from CR in our study (95% UD = 24.3 ± 9.8 km2; 50% UD = 4.4 ± 1.3 km2), which could be attributed to differences in habitat structure and composition (e.g., algae-rich in Palm Beach vs. seagrass beds in CR). Nevertheless, in the context of foraging grounds within the Gulf of Mexico (GoM), our results support the findings of Lamont and Iverson (2018) regarding similarities in home range size between CC and CM, as well as the larger home ranges recorded for LK. One CM (ID 142708) and several LK displayed more dynamic behaviors, occasionally moving longer distances between patches. Similar behaviors have also been reported for CM, LK, and CC in the northern GoM (Lamont and Iverson, 2018), and for LK in Cedar Key (north of CR) (Schmid et al., 2003), and have been attributed to turtles potentially searching for more favorable foraging areas. Combined, the results of these studies show consistent species-specific patterns in the foraging behavior of juvenile marine turtles in nearshore coastal habitats along the eastern and northern GoM and could provide useful evidence to inform management guidelines for other areas supporting all three species along this coastline.
The habitat partitioning observed by the three species of marine turtles studied here also occurs at a broader scale along the coast of Florida. Composition of the most abundant species varies across the region, typically with a higher proportion of CC in the northeast coast (north of Cape Canaveral), CM in the southeast coast (from Brevard County to the Florida Keys), and LK in the west coast of Florida (from Ten Thousand Islands to Apalachee Bay) (Eaton et al., 2008). Contrary to the general species distribution along Florida’s nearshore habitats, our study found that CM were by far the most abundant species in the CR region (northwest coast), which can be expected given the general preference of CM to feed on algae and seagrass (Bjorndal et al., 1997) and the extensive seagrass beds in the area. In contrast, LK and CC of equivalent size are more abundant in the oyster reefs at Cedar Key (Schmid, 1998; Schmid and Barichivich, 2005), located just ∼50 km north of CR. Captures in the CR region demonstrate a spatial overlap in the distribution of immature life stages during the summer months; a similar degree of spatial overlap of the same three marine turtle species was also recently reported at two other foraging grounds (St. Joseph and St. Andrew Bays) in the northern GoM (Lamont and Iverson, 2018). Moreover, additional records of captures at CR outside our study period also include some adult CM and CC (Marine Turtle Research Ecology and Conservation Group database, Florida State University, unpublished data).
Describing the local distribution of marine species provides the first line of knowledge to understand their spatial ecology. Additional patterns in habitat use can emerge when considering their vertical movements (e.g., diving behavior) (Bestley et al., 2015). The larger range of depths utilized by tracked CM (<1–11 m) might be attributed to differences in the diving depth during day and night, which has been reported elsewhere in Florida for this species (Makowski et al., 2006); the latter could be readily addressed in future studies with the data presented herein. As for LK (depth range <1–4.5 m), our study aligns with diving patterns observed for this species in similar habitats of the NeGM, in which turtles had an overall lower movement rate compared to other regions in Florida (Schmid et al., 2002). Less is known about the diving behavior of CC in Florida waters. A study on breeding males of CC in the vicinity of Cape Canaveral (on the east coast of Florida) found that they occurred in waters on average 7.4 m deep (Arendt et al., 2012). In contrast, CC tracked in our study seemed to prefer shallower waters (depth range 1–3.5 m), which aligns with depths reported for juvenile CC in the northern GoM (Lamont and Iverson, 2018). As observed in other studies (Seminoff et al., 2002; Plot et al., 2015; Christiansen et al., 2017), CM and CC displayed an apparent shift to shallower depths during the night, while no clear patterns were depicted for LK. However, contrary to typical diving patterns described for marine turtles which tend to have lower activity levels and undertake longer dives during nighttime (e.g., Mendonça, 1983; Hays et al., 2000; Schmid et al., 2002; Christiansen et al., 2017), our results suggest that for CM and CC the submergence times were longer and surfacing durations were shorter during daytime. It is unclear whether these differences are related to a behavioral response (e.g., to high vessel traffic during recreational scalloping season) or an artifact of the sampling method (i.e., data was derived from binned data recorded by satellite tags). In this sense, larger sample sizes and studies specifically designed to depict diel patterns (e.g., employing Time Depth Recorders) would enable stronger inferences to be made on the potential drivers of this behavior and their representation for the three marine turtle species in the region. Future studies could expand on potential differences in the diving patterns during varied behaviors, such as resting, foraging or seeking for shelter (Mendonça, 1983) to better understand the habitat use by the different sympatric species.
Differences in species and individual behavior can have an effect not only on their energy expenditure, but also in their exposure and response to different threats. For all marine turtle species in the CR region, exposure to threats is likely higher during summer months when they overlap with recreational scalloping fisheries (July to September; Greenawalt-Boswell et al., 2007; Geiger et al., 2015) and commercial shrimp trawling and crab trapping (May to October; Florida Fish and Wildlife Conservation Commission Rule 68B-38.001). Bay scallops along the Gulf coast of Florida, and thus recreational scalloping fishing effort, are distributed in very shallow waters (less than 2 m depth) (Arnold et al., 1998; Greenawalt-Boswell et al., 2007) that overlap with areas typically used by marine turtles (Wildermann et al., 2018b). Recreational scalloping fisheries are extremely popular in the CR region attracting thousands of users each year (Greenawalt-Boswell et al., 2007), which leads to significant increases of vessel traffic in the area during the scallop harvest season (Wildermann et al., 2018b). High density of vessels can increase the probability of marine turtle–vessel interactions (e.g., vessel strikes; Hazel et al., 2007; Work et al., 2010), and habitat degradation through pollution (e.g., oil leaks, marine debris) and anchoring (Hallac et al., 2012), among other sources, can potentially impact food source quality and quantity. Based on the behavioral patterns estimated in this study, most CM were distributed in shallow waters where there is potentially higher exposure to marine traffic, but those CM distributed in deeper waters (up to 12 m) are less exposed to marine traffic and have more room to avoid occasional vessels. LK and CC are likely to be more vulnerable to threats related to the presence of vessels (e.g., disturbance, behavioral changes, vessel strikes) (Sobin, 2008), as they move substantially across the region and spend slightly longer periods at the surface (>20 s) in consistently shallow waters. Future studies on the cumulative and synergistic effect of this and other potential threats (e.g., hook-and-line, pot fisheries, trawl fisheries, water quality, algal blooms) on the overall health of nearshore habitats and consequently their impact on marine turtle foraging ecology could enhance effective management of threats to the local marine turtle populations.
As species listed as threatened (CC) or endangered (LK and Florida’s CM) under the Endangered Species Act, marine turtles are comprehensively protected under state and federal regulations in the United States (NMFS and USFWS, 1991, 2008; NMFS et al., 2011). Within the CR region, there is additional protection to a portion of the coastal habitats through special management zones (namely SAP and CNR; see section “Study Area”). As a National Wildlife Refuge, CNR regulations prohibit any kind of fishing activities, reducing as a result the abundance and density of vessels within the management zone (U. S. Fish and Wildlife Service, 2010). In contrast, SAP regulations allow the use of resources, including those derived from recreational fisheries, while also providing guidelines to protect the long-term health of the ecosystems and sustainability of species and habitats of concern, such as bay scallops and seagrass (Florida Department of Environmental Protection, 2017). Growing threats such as changes in water quality (related to nutrients, pollution, and environmental contaminants), increase in coastal development and fishing efforts occurring in adjacent areas might have a spillover effect into the special management zones, both directly or indirectly (Florida Department of Environmental Protection, 2017). The CR area is an important developmental habitat for multiple-species of protected marine turtles, which makes the management of existing (e.g., recreational scallop fisheries, commercial shrimp fisheries) and future threats extremely important to the area and its marine turtles. Areas where multi-species overlap might provide opportunities to maximize protection given limited resources (i.e., funds; Fuentes et al., 2016; Klein et al., 2016). Hence, areas identified here (e.g., west off the boundary between SAP and CNR, and west off southern CNR) are good candidates for further protection and investigation into the effectiveness of additional management measures to mitigate threats. Information obtained on the ecological habitat use (e.g., diving behavior) of each species provides species-specific traits that could further inform management and the development of regulations in the region.
Data Availability
The datasets generated for this study are available on request to the corresponding author.
Author Contributions
MF, CS, LS, and DS conducted the field work. NW and MF analyzed the data. NW wrote the manuscript. All co-authors provided comments and edits on the manuscript.
Conflict of Interest Statement
The authors declare that the research was conducted in the absence of any commercial or financial relationships that could be construed as a potential conflict of interest.
Acknowledgments
We appreciate the support provided by the Department of Environmental Protection of Florida, the Marine Turtle Research Ecology and Conservation Group at Florida State University, the Inwater Research Group Inc., the National Oceanic and Atmospheric Administration, Captain Hal Butler, and Mr. Christian Gredzens. This research was partly supported by the Florida Marine Turtle License Plate grant scheme. We are also thankful for the support and comments provided by the editorial office and reviewers.
Supplementary Material
The Supplementary Material for this article can be found online at: https://www.frontiersin.org/articles/10.3389/fmars.2019.00155/full#supplementary-material
Footnote
References
Arendt, M. D., Segars, A. L., Byrd, J. I., Boynton, J., Whitaker, J. D., Parker, L., et al. (2012). Distributional patterns of adult male loggerhead sea turtles (Caretta caretta) in the vicinity of Cape Canaveral, Florida, USA during and after a major annual breeding aggregation. Mar. Biol. 159, 101–112. doi: 10.1007/s00227-011-1793-5
Arnold, W. S., Marelli, D. C., Bray, C. P., and Harrison, M. M. (1998). Recruitment of bay scallops Argopecten irradians in Floridan Gulf of Mexico waters: scales of coherence. Mar. Ecol. Prog. Ser. 170, 143–157. doi: 10.3354/meps170143
Auerbach, N. A., Tulloch, A. I. T., and Possingham, H. P. (2014). Informed actions: where to cost effectively manage multiple threats to species to maximize return on investment. Ecol. Appl. 24, 1357–1373.
Bailey, H., Shillinger, G., Palacios, D., Bograd, S., Spotila, J., Paladino, F., et al. (2008). Identifying and comparing phases of movement by leatherback turtles using state-space models. J. Exp. Mar. Biol. Ecol. 356, 128–135. doi: 10.1016/j.jembe.2007.12.020
Balazs, G. (1999). “Factors to consider in the tagging of sea turtles,” in Research and Management Techniques for the Conservation of Sea Turtles, eds K. L. Eckert, K. Bjorndal, F. A. Abreu-Grobois, and M. Donnelly (Washington, DC: IUCN/SSC Marine Turtle Specialist Group Publication), 101–114.
Barichivich, W. J. (2006). Characterization of a Marine Turtle Aggregation in the Big Bend of Florida. M.S. thesis, University of Florida:, Gainesville, FL.
Barichivich, W. J., Sulak, K. J., and Carthy, R. R. (1998). Characterization of Kemp’s Ridley Sea Turtles in the Florida Big Bend Area. Panama, FL: Southeast Fisheries Science Center.
Benhamou, S. (2011). Dynamic approach to space and habitat use based on biased random bridges. PLoS One 6:e14592. doi: 10.1371/journal.pone.0014592
Bestley, S., Jonsen, I. D., Hindell, M. A., Harcourt, R. G., and Gales, N. J. (2015). Taking animal tracking to new depths: synthesizing horizontal–vertical movement relationships for four marine predators. Ecology 96, 417–427. doi: 10.1890/14-0469.1
Bjorndal, K. A., Lutz, P., and Musick, J. (1997). Foraging ecology and nutrition of sea turtles. The Biology. of Sea Turtles 1, 199–231.
Blumenthal, J. M., Austin, T. J., Bothwell, J. B., Broderick, A. C., Ebanks-Petrie, G., Olynik, J. R., et al. (2008). Diving behavior and movements of juvenile hawksbill turtles Eretmochelys imbricata on a Caribbean coral reef. Coral Reefs 28, :55. doi: 10.1007/s00338-008-0416-1
Bolten, A. B., Crowder, L. B., Dodd, M. G., MacPherson, S. L., Musick, J. A., Schroeder, B. A., et al. (2011). Quantifying multiple threats to endangered species: an example from loggerhead sea turtles∗. Frontiers. in Ecology. and the Environment. 9:, 295–301. doi: 10.1890/090126
Bresette, M. J., Witherington, B. E., Herren, R. M., Bagley, D. A., Gorham, J. C., Traxler, S. L., et al. (2010). Size-class partitioning and herding in a foraging group of green turtles Chelonia mydas. Endangered. Species Research. 9, 105–116. doi: 10.3354/esr00245
Calenge, C. (2011). Home Range Estimation in R: The adehabitatHR Package. CRAN. Available at: https://cran.r-project.org/web/packages/adehabitatHR/vignettes/adehabitatHR.pdf.
Carr, A. F., and Caldwell, D. K. (1956). The ecology and migrations of sea turtles. 1, Results of field work in Florida, 1955. Am. Mus. Novit. 1793, 1–23.
Christiansen, F., Esteban, N., Mortimer, J. A., Dujon, A. M., and Hays, G. C. (2017). Diel and seasonal patterns in activity and home range size of green turtles on their foraging grounds revealed by extended Fastloc-GPS tracking. Mar. Biol. 164, :10. doi: 10.1007/s00227-016-3048-y
Downey, B. L., Downey, B. A., Quinlan, R. W., Frank, S. L., Cross, D. E., Jarina, D. J., et al. (2008). MULTISAR: A Multi-Species Conservation Strategy for Species at Risk 2007-2008 Report. Edmonton, AB: Alberta Sustainable Resource Development.
Eaton, C., McMichael, E., Witherington, B., Foley, A., Hardy, R., and Meylan, A. (2008). In-Water Sea Turtle Monitoring and Research in Florida: Review and Recommendations. Tallahassee, FL: Florida Fish and Wildlife Conservation Commission.
Florida Department of Environmental Protection. (2017). St. Martins Marsh Aquatic Preserve Management Plan. Tallahassee, FL: Florida Department of Environmental Protection.
Foley, A. M., Schroeder, B. A., Hardy, R., MacPherson, S. L., and Nicholas, M. (2014). Long-term behavior at foraging sites of adult female loggerhead sea turtles (Caretta caretta) from three Florida rookeries. Mar. Biol. 161, 1251–1262. doi: 10.1007/s00227-014-2415-9
Ford, R. G. (1983). Home range in a patchy environment: optimal foraging predictions. American. Zoologist. 23, 315–326. doi: 10.1093/icb/23.2.315
Fuentes, M. M. P. B., Blackwood, J., Jones, B., Kim, M., Leis, B., Limpus, C. J., et al. (2015). A decision framework for prioritizing multiple management actions for threatened marine megafauna. Ecological. Applications. 25, 200–214. doi: 10.1890/13-1524.1
Fuentes, M. M. P. B., Chambers, L., Chin, A., Dann, P., Dobbs, K., Marsh, H., et al. (2016). Adaptive management of marine mega-fauna in a changing climate. Mitigation. and Adaptation. Strategies. for Global. Change. 21, 209–224. doi: 10.1007/s11027-014-9590-3
Fuentes, M. M. P. B., Lawler, I. R., and Gyuris, E. (2006). Dietary preferences of juvenile green turtles (Chelonia mydas) on a tropical reef flat. Wildlife. Research. 33, 671–678. doi: 10.1071/WR05081
Geiger, S., Parker, M., Stephenson, S., Radigan, R., Hurley, A., Kirby, C., et al. (2015). Florida Bay Scallop 2014 Annual Report. St. Petersburg, FL: Florida Fish and Wildlife Conservation Commission.
Gillis, A. J., Ceriani, S. A., Seminoff, J. A., and Fuentes, M. M. (2018). Foraging ecology and diet selection of juvenile green turtles in the Bahamas: insights from stable isotope analysis and prey mapping. Marine. Ecology. Progress. Series. 599, 225–238. doi: 10.3354/meps12635
Greenawalt-Boswell, J., Frazer, T. K., Jacoby, C. A., and Arnold, W. S. (2007). Mortality and exploitation rate estimates for the recreational bay scallop fishery off the Gulf Coast of Florida, USA. North. American. Journal. of Fisheries. Management. 27, 1230–1242. doi: 10.1577/M06-207.1
Griffin, R. B., and Griffin, N. J. (2003). Distribution, habitat partitioning, and abundance of Atlantic spotted dolphins, bottlenose dolphins, and loggerhead sea turtles on the eastern Gulf of Mexico continental shelf. Gulf of Mexico. Science. 21, 325–34. doi: 10.18785/goms.2101.03
Hallac, D. E., Sadle, J., Pearlstine, L., Herling, F., and Shinde, D. (2012). Boating impacts to seagrass in Florida Bay, Everglades National Park, Florida, USA: links with physical and visitor-use factors and implications for management. Marine. and Freshwater. Research. 63, 1117–1128. doi: 10.1071/Mf12025
Hamann, M., Godfrey, M. H., Seminoff, J. A., Arthur, K., Barata, P. C. R., Bjorndal, K. A., et al. (2010). Global research priorities for sea turtles: informing management and conservation in the 21st century. Endangered. Species Research. 11, 245–269. doi: 10.3354/esr00279
Hart, K. M., and Fujisaki, I. (2010). Satellite tracking reveals habitat use by juvenile green sea turtles Chelonia mydas in the Everglades, Florida, USA. Endangered. Species Research. 11, 221–232. doi: 10.3354/esr00284
Hart, K. M., Iverson, A. R., Fujisaki, I., Lamont, M. M., Bucklin, D., and Shaver, D. J. (2018). Marine threats overlap key foraging habitat for two imperiled sea turtle species in the Gulf of Mexico. Frontiers. in Marine. Science. 5:336. doi: 10.3389/fmars.2018.00336
Hatase, H., and Tsukamoto, K. (2008). Smaller longer, larger shorter: energy budget calculations explain intrapopulation variation in remigration intervals for loggerhead sea turtles (Caretta caretta). Canadian. Journal. of Zool.ogy-Revue Canadienne De Zoologie 86, 595–600. doi: 10.1139/Z08-035
Hawkes, L. A., Broderick, A. C., Coyne, M. S., Godfrey, M. H., and Godley, B. J. (2007). Only some like it hot - quantifying the environmental niche of the loggerhead sea turtle. Diversity. and Distributions. 13, 447–457. doi: 10.1111/j.1472-4642.2007.00354.x
Hays, G. C., Adams, C. R., Broderick, A. C., Godley, B. J., Lucas, D. J., Metcalfe, J. D., et al. (2000). The diving behaviour of green turtles at Ascension Island. Animal. Behaviour. 59, 577–586.
Hazel, J., Lawler, I., Marsh, H., and Robson, S. (2007). Vessel speed increases collision risk for the green turtle Chelonia mydas. Endangered. Species Research. 3, 105–113. doi: 10.3354/esr003105
Heupel, M. R., and Simpfendorfer, C. A. (2005). Using acoustic monitoring to evaluate MPAs for shark nursery areas: the importance of long-term data. Marine. Technology. Society. Journal. 39, 10–18. doi: 10.4031/002533205787521749
IRG. (2012). Pilot Project - Sea Turtle Developmental Habitats in the St Martins Marsh and Big Bend Seagrasses Aquatic Preserves∗. Washington, DC: US Fish and Wildlife Service.
IUCN/SSC. (2008). Strategic Planning for Species Conservation: A Handbook. Version 1.0∗. Gland: IUCN Species Survival Commission, 104.
IUCN/SSC Species Conservation Planning Sub-Committee. (2017). Guidelines for Species Conservation Planning. Version 1.0. Gland: IUCN, 114.
Jonsen, I. D., Bestley, S., Wotherspoon, S. J., Sumner, M. D., and Mills Flemming, J. E. (2017). Package ‘bsam’. CRAN. 15. Available at: https://cran.r-project.org/web/packages/bsam/bsam.pdf.
Jonsen, I. D., Flemming, J. M., and Myers, R. A. (2005). Robust state-space modeling of animal movement data. Ecology 86, 2874–2880. doi: 10.1890/04-1852
Jonsen, I. D., Myers, R. A., and James, M. C. (2006). Robust hierarchical state-space models reveal diel variation in travel rates of migrating leatherback turtles. J. Anim. Ecol. 75, 1046–1057. doi: 10.1111/j.1365-2656.2006.01129.x
Klein, C. J., Beher, J., Chaloupka, M., Hamann, M., Limpus, C., and Possingham, H. P. (2016). Prioritization of marine turtle management projects: a protocol that accounts for threats to different life history stages. Conservation. Letters. 10, 547–554. doi: 10.1111/conl.12324
Lamont, M. M., and Iverson, A. R. (2018). Shared habitat use by juveniles of three sea turtle species. Marine. Ecology. Progress. Series. 606, 187–200. doi: 10.3354/meps12748
Limpus, C., and Walter, D. (1980). The growth of immature green turtles (Chelonia mydas) under natural conditions. Herpetologica 36, 162–165.
Lindström,Å, Chapman, B. B., Jonzén, N., and Klaassen, M. (2014). “Movement and migration in a changing world,” in Animal Movement Across Scales, eds L. A. Hansson and S. Åkesson (Oxford: Oxford University Press), 36–50. doi: 10.1093/acprof:oso/9780199677184.003.0003
Makowski, C., Seminoff, J. A., and Salmon, M. (2006). Home range and habitat use of juvenile Atlantic green turtles (Chelonia mydas L.) on shallow reef habitats in Palm Beach, Florida, USA. Marine. Biology. 148, 1167–1179. doi: 10.1007/s00227-005-0150-y
Mansfield, K. L., Saba, V. S., Keinath, J. A., and Musick, J. A. (2009). Satellite tracking reveals a dichotomy in migration strategies among juvenile loggerhead turtles in the Northwest Atlantic. Marine. Biology. 156, 2555–2570. doi: 10.1007/s00227-009-1279-x
Mendonça, M. T. (1983). Movements and feeding ecology of immature green turtles (Chelonia mydas) in a Florida Lagoon. Copeia 1983, 1013–1023. doi: 10.2307/1445104
Mendonça, M. T., and Ehrhart, L. M. (1982). Activity, population size and structure of immature Chelonia mydas and Caretta caretta in Mosquito Lagoon, Florida. Copeia 1982, 161–167. doi: 10.2307/1444280
Miller, J. D. (1997). “Reproduction in sea turtles,” in The Biology of Sea Turtles, Vol. I, eds P. L. Lutz and J. A. Musick (Boca Raton, FL: CRC Press), 51–82.
Musick, J. A., and Limpus, C. J. (1997). “Habitat utilization and migration in juvenile sea turtles,” in The Biology of Sea Turtles, eds P. L. Lutz and J. A. Musick (Boca Raton, FL: CRC Press), 137–163.
NASA Goddard Space Flight Center, Ocean Ecology Laboratory, Ocean Biology Processing Group. (2014). Sea-Viewing Wide Field-of-View Sensor (SeaWiFS) Ocean Color Data∗∗. Greenbelt, MD: NASA OB.DAAC.
NMFS and USFWS. (1991). Recovery Plan for US Population of Atlantic Green Turtle∗. Washington, DC: National Marine Fisheries Service.
NMFS and USFWS. (2008). Recovery Plan for the Northwest Atlantic Population of the Loggerhead Sea Turtle (Caretta caretta). Second revision∗. Silver Spring, MD: National Marine Fisheries Service.
NMFS, USFWS, and SEMARNAT. (2011). Bi-National Recovery Plan for the Kemp’s Ridley Sea Turtle (Lepidochelys kempii). Second revision∗. Silver Spring, MD: National Marine Fisheries Service.
Ogren, L. (1989). “Distribution of juvenile and subadult Kemp’s ridley turtles: preliminary results from the 1984-1987 surveys,” in Proceedings of the 1st International Symposium on Kemp’s Ridley Sea Turtle Biology, Conservation, and Management, eds C. W. Caillouet and A. M. Landry (Galveston, TX: Texas A&M University Sea Grant College Program), 116–123.
Parra, G. J. (2006). Resource partitioning in sympatric delphinids: space use and habitat preferences of Australian snubfin and Indo-Pacific humpback dolphins. Journal. of Animal. Ecology. 75, 862–874.
Plot, V., de Thoisy, B., and Georges, J. Y. (2015). Dispersal and dive patterns during the post-nesting migration of olive ridley turtles from French Guiana. Endangered. Species Research. 26, 221–234. doi: 10.3354/esr00625
R Core Team. (2018). R: A Language and Environment for Statistical Computing. Vienna: R Foundation for Statistical Computing.
Rees, A. F., Alfaro-Shigueto, J., Barata, P. C. R., Bjorndal, K. A., Bolten, A. B., Bourjea, J., et al. (2016). Are we working towards global research priorities for management and conservation of sea turtles? Endangered. Species Research. 31, 337–382. doi: 10.3354/esr00801
Rees, A. F., Margaritoulis, D., Newman, R., Riggall, T. E., Tsaros, P., Zbinden, J. A., et al. (2012). Ecology of loggerhead marine turtles Caretta caretta in a neritic foraging habitat: movements, sex ratios and growth rates. Marine. Biology. 160, 519–529. doi: 10.1007/s00227-012-2107-2
Renaud, M. L. (1995). Movements and submergence patterns of Kemp’s ridley turtles (Lepidochelys kempii). Journal. of Herpetology. 29, 370–374. doi: 10.2307/1564986
Rudloe, A., Rudloe, J., and Ogren, L. (1991). Occurrence of immature Kemp’s ridley turtles, Lepidochelys kempi, in coastal waters of northwest Florida. Northeast Gulf Science. 12, 49–53. doi: 10.18785/negs.1201.05
Sanderson, E. W., Redford, K. H., Vedder, A., Coppolillo, P. B., and Ward, S. E. (2002). A conceptual model for conservation planning based on landscape species requirements. Landscape. and Urban Planning. 58, 41–56. doi: 10.1016/S0169-2046(01)00231-6
Schmid, J. (2000). Activity Patterns and Habitat Associations of Kemp’s Ridley Turtles, Lepidochelys Kempi, in the Coastal Waters of the Cedar Keys, Florida. Doctoral dissertation, ProQuest:, Ann Arbor, MI.
Schmid, J. R. (1998). Marine turtle populations on the west-central coast of Florida: results of tagging studies at the Cedar Keys, Florida, 1986-1995. Fishery. Bulletin. 96, 589–602.
Schmid, J. R., and Barichivich, W. J. (2005). Developmental biology and ecology of the Kemp’s ridley sea turtle, Lepidochelys kempii, in the eastern Gulf of Mexico. Chelonian Conservation. and Biology. 4, 828–834.
Schmid, J. R., Bolten, A. B., Bjorndal, K. A., and Lindberg, W. J. (2002). Activity patterns of Kemp’s ridley turtles, Lepidochelys kempii, in the coastal waters of the Cedar Keys, Florida. Marine. Biology. 140, 215–228. doi: 10.1007/s002270100708
Schmid, J. R., Bolten, A. B., Bjorndal, K. A., Lindberg, W. J., Percival, H. F., and Zwick, P. D. (2003). Home range and habitat use by Kemp’s ridley turtles in west-central Florida. Journal. of Wildlife. Management. 67, 196–206. doi: 10.2307/3803075
Schmid, J. R., and Witzell, W. N. (2006). Seasonal migrations of immature Kemp’s ridley turtle (Lepidochelys kempii Garman) along the West Coast of Florida. Gulf of Mexico. Science. 1, 28–40. doi: 10.18785/goms.2401.05
Schofield, G., Hobson, V. J., Fossette, S., Lilley, M. K. S., Katselidis, K. A., and Hays, G. C. (2010). Fidelity to foraging sites, consistency of migration routes and habitat modulation of home range by sea turtles. Diversity. and Distributions. 16, 840–853. doi: 10.1111/j.1472-4642.2010.00694.x
Seminoff, J. A., Resendiz, A., and Nichols, W. J. (2002). Home range of green turtles Chelonia mydas at a coastal foraging area in the Gulf of California, Mexico. Marine. Ecology. Progress. Series. 242, 253–265. doi: 10.3354/meps242253
Seney, E. E., Higgins, B. M., and Landry, A. M. (2010). Satellite transmitter attachment techniques for small juvenile sea turtles. Journal. of Experimental. Marine. Biology. and Ecology. 384, 61–67. doi: 10.1016/j.jembe.2010.01.002
Shimada, T., Aoki, S., Kameda, K., Hazel, J., Reich, K., and Kamezaki, N. (2014). Site fidelity, ontogenetic shift and diet composition of green turtles Chelonia mydas in Japan inferred from stable isotope analysis. Endangered. Species Research. 25, 151–164. doi: 10.3354/esr00616
Shimada, T., Jones, R., Limpus, C., Groom, R., and Hamann, M. (2016a). Long-term and seasonal patterns of sea turtle home ranges in warm coastal foraging habitats: implications for conservation. Marine. Ecology. Progress. Series. 562, 163–179. doi: 10.3354/meps11972
Shimada, T., Limpus, C., Jones, R., Hazel, J., Groom, R., and Hamann, M. (2016b). Sea turtles return home after intentional displacement from coastal foraging areas. Marine. Biology. 163, 1–14. doi: 10.1007/s00227-015-2771-0
Sobin, J. M. (2008). Diving Behavior of Female Loggerhead Turtles (Caretta caretta) During Their Internesting Interval and an Evaluation of the Risk of Boat Strikes. Durham, NC: Duke University. doi: 10.1109/OCEANS.2008.5152080
Thums, M., Waayers, D., Huang, Z., Pattiaratchi, C., Bernus, J., and Meekan, M. (2017). Environmental predictors of foraging and transit behaviour in flatback turtles Natator depressus. Endangered. Species Research. 32, 333–349. doi: 10.3354/esr00818
U. S. Fish and Wildlife Service. (2010). Chassahowitzka National Wildlife Refuge. Washington, DC: U.S. Fish & Wildlife Service.
Vélez-Rubio, G. M., Cardona, L., López-Mendilaharsu, M., Martinez Souza, G., Carranza, A., Campos, P., et al. (2018). Pre and post-settlement movements of juvenile green turtles in the Southwestern Atlantic Ocean. Journal. of Experimental. Marine. Biology. and Ecology. 501, 36–45. doi: 10.1016/j.jembe.2018.01.001
Vincent, C., McConnell, B. J., Ridoux, V., and Fedak, M. A. (2002). Assessment of Argos location accuracy from satellite tags deployed on captive gray seals. Marine. Mammal. Science. 18, 156–166. doi: 10.1111/j.1748-7692.2002.tb01025.x
Wildermann, N., Gredzens, C., Barrios-Garrido, H., Bell, I., Blumenthal, J., Bolten, A., et al. (2018a). Informing research priorities for immature sea turtles through expert elicitation. Endangered. Species Research. 37, 55–76. doi: 10.3354/esr00916
Wildermann, N., Sasso, C., Gredzens, C., and Fuentes, M. M. P. B. (2018b). Assessing the effect of recreational scallop harvest on the distribution and behaviour of foraging marine turtles. Oryx 1–8. doi: 10.1017/s0030605318000182
Work, P. A., Sapp, A. L., Scott, D. W., and Dodd, M. G. (2010). Influence of small vessel operation and propulsion system on loggerhead sea turtle injuries. Journal. of Experimental. Marine. Biology. and Ecology. 393, 168–175. doi: 10.1016/j.jembe.2010.07.019
Keywords: Chelonia mydas, Lepidochelys kempii, Caretta caretta, green turtle, Kemp’s ridley turtle, loggerhead turtle, juvenile, spatial ecology
Citation: Wildermann NE, Sasso CR, Stokes LW, Snodgrass D and Fuentes MMPB (2019) Habitat Use and Behavior of Multiple Species of Marine Turtles at a Foraging Area in the Northeastern Gulf of Mexico. Front. Mar. Sci. 6:155. doi: 10.3389/fmars.2019.00155
Received: 15 November 2018; Accepted: 11 March 2019;
Published: 28 March 2019.
Edited by:
Jeremy Kiszka, Florida International University, United StatesReviewed by:
Brendan John Godley, University of Exeter, United KingdomGail Schofield, Queen Mary University of London, United Kingdom
Jérôme Bourjea, Institut Français de Recherche pour l’Exploitation de la Mer (IFREMER), France
Copyright © 2019 Wildermann, Sasso, Stokes, Snodgrass and Fuentes. This is an open-access article distributed under the terms of the Creative Commons Attribution License (CC BY). The use, distribution or reproduction in other forums is permitted, provided the original author(s) and the copyright owner(s) are credited and that the original publication in this journal is cited, in accordance with accepted academic practice. No use, distribution or reproduction is permitted which does not comply with these terms.
*Correspondence: Mariana M. P. B. Fuentes, mfuentes@fsu.edu