Cumulative Effects and Boreal Woodland Caribou: How Bow-Tie Risk Analysis Addresses a Critical Issue in Canada's Forested Landscapes
 Richard Winder1*
  Frances E. C. Stewart1,2
  Silke Nebel3
  Eliot J. B. McIntire1,4
  Andrew Dyk1
  Kangakola Omendja1
- 1Pacific Forestry Centre, Canadian Forest Service, Natural Resources Canada, Victoria, BC, Canada
- 2School of Environmental Studies, University of Victoria, Victoria, BC, Canada
- 3Bird Studies Canada, Port Rowan, ON, Canada
- 4Faculty of Forestry, University of British Columbia, Vancouver, BC, Canada
Boreal caribou (Woodland Caribou, boreal population; Rangifer tarandus caribou) is a prominent mammal at the heart of a decades-long conflict between a growing resource sector and the associated risks to biodiversity. We employed the ISO 31010 Bow-tie Risk Assessment Tool (BRAT) to evaluate the cumulative effects of anthropogenic and natural factors that may affect risks to self-sustainability in boreal caribou herds of Northeastern British Columbia. We used the BRAT to produce a visual synthesis of the cumulative effects causing the growth rate of boreal caribou herds to persistently fall below a level corresponding to a 60% chance of self-sustainability (λ < 1.025). The BRAT diagram provided the basis for a quantitative Layers of Protection Analysis (LOPA) of risk probabilities for three caribou herds. We combined threat assessments from the Species at Risk Act recovery strategy (Environment Canada, 2012) with data from published landscape experiments (e.g., restoration of seismic traces, maternal penning, and wolf culls) to parameterize the LOPA in three study areas. We report the implications of a combination of mitigation options vs. current risk conditions, as well as the implications of uncertainty in threat prevention. Our analysis indicates that a combination of mitigation scenarios will best facilitate caribou herd recovery, that barriers preventing predation threats could also aid in recovery success, and that compensatory predation may account for a significant proportion of both adult and juvenile female mortality across different herds. We estimated the minimum annual cost for effective mitigation and recovery to be $CDN 224K within any of the study areas. Bow-tie diagrams are a flexible and quantifiable tool that can translate resource management solutions to the diverse audience involved in conservation decision-making: scientists, land managers, policy makers, and concerned stakeholders.
Introduction
Assessing cumulative environmental effects is an important component of formal environmental impact assessments that are, themselves, at the core of efforts to prevent environmental degradation (Duinker et al., 2013). Building on previous definitions (Auditor General of British Columbia, 2015), cumulative effects are defined here as changes to the environment due to the combined effect of past, present, and future human activities in the context of dynamic ecological processes. They arise from major but often disparate spheres of human activity and land use, including renewable and non-renewable resource extraction, agriculture, transportation, and settlement or urbanization. Over the past 25 years, cumulative effects have received considerable attention from practitioners, academics, and legislators (Sinclair et al., 2017), and have resulted in a proliferation of legislation requiring regulators to consider cumulative effects when managing marine and terrestrial ecosystems (Judd et al., 2015). Yet, accurate assessment and management of cumulative environmental effects at scales larger than local sites or forest stands remains challenging (Sinclair et al., 2017).
The effects of human activities in the boreal ecosystem of Canada's North provide a prime example of cumulative environmental effects at the landscape level. Resource development in boreal forests is on the rise (Brandt et al., 2013; Andrew et al., 2014), and Canada's boreal forests are now experiencing some of the most rapid land use changes occurring across the globe (Hansen et al., 2013). There is increasing activity in industrial sectors, including forestry (timber harvest), oil and gas production (exploration, extraction, and distribution), electrical energy production (hydroelectric dams and energy transmission), and mining (Brandt et al., 2013; Venier et al., 2014; Culling and Cichowski, 2017). In western Canada (including Alberta, British Columbia, Manitoba, and Saskatchewan), land use changes are primarily driven by globally prominent forest and energy industries (Timoney, 2003; Naugle, 2010).
Caribou (Rangifer tarandus) is one of the species involved in the conflict between land use required for commercial sectors and the need to conserve ecosystem services and protect biodiversity in boreal forests (Hebblewhite, 2017; Fisher and Burton, 2018). They are an iconic umbrella species in much of northern North America (Festa-Bianchet et al., 2011; Bichet et al., 2016), because their distribution is large and the key drivers responsible for their conservation are common challenges to many other species at risk. They are also fundamental for the cultural identity, spirituality, and diets of northern aboriginal peoples (Dale et al., 1994; Mowat and Heard, 2006; Festa-Bianchet et al., 2011; David Suzuki Foundation, 2013; Government of British Columbia, 2014). There is only one species of caribou globally, but several subspecies and ecotypes are currently distinguished based on differences in habitat use, behavior, and migration patterns (Festa-Bianchet et al., 2011). Population declines and range contractions are among the most pronounced for Woodland caribou (Schaefer, 2003; Venier et al., 2014), one of the three major ecotypes of caribou in Canada. The boreal population of Woodland caribou (Rangifer tarandus caribou; here referred to as “boreal caribou”) is the widest-ranging of Canada's five populations of Woodland caribou (Government of Canada, 2018) and is listed under the federal Species at Risk Act as “Threatened” (Environment and Climate Change Canada, 2018). The drivers leading to population declines in Woodland caribou are complex, but the cumulative impacts of industrial development and fire are highlighted as a key cause (Environment Canada, 2011; Johnson et al., 2015; Environment and Climate Change Canada, 2019).
The Province of British Columbia uses a cumulative effects framework that consists of three components, or stages of development (Government of British Columbia, 2014). The first component is “establishment of the values foundation,” which includes identifying the relevant values and objectives, choosing the appropriate methods for the assessment, collecting the necessary data, and defining the geographic area for the cumulative effects assessment. The second component is the “assessment” itself, which involves an evaluation of the current condition of values relative to the objectives, and identification of current and future risks. The third component is “decision support.” Crucially, the results of the cumulative effects assessment need to be synthesized and made easily accessible and understandable for all stakeholders to effectively support decision-making (Government of British Columbia, 2014). One of the tools often used within the cumulative effects framework is a spatial analysis, which shows the location and spatial extent of each impact as well as areas of overlapping concern (Government of British Columbia, 2014). This allows for an analysis of proposed projects and impacts with respect to, for example, the range of a threatened species. What this does not show, however, is the extent to which effects may interact in the context of specific risks and how they are managed.
The Bow-tie Risk Assessment Tool (BRAT) offers an alternative approach. BRAT diagrams provide a visual synthesis of a tipping point or top event, its potential consequences, and the threats that increase the likelihood of the top event taking place (Table 1). The BRAT owes its name to the shape of the risk analysis diagram, often resembling a bow-tie in appearance (Figure 1). The International Organization for Standardization, which develops international standards that provide solutions to global challenges, has listed the BRAT as a widely-applicable method for selection and implementation of systematic techniques for risk assessment (IEC/ISO 31010:2009 standard). BRAT can show the barriers that could prevent top events from occurring, or minimize their effects if they do occur, as well as show the factors that can escalate or exacerbate existing threats. Hence, BRAT frameworks can potentially contribute a clearer understanding to the complexity of cumulative effect problems. The BRAT is only now starting to be applied for identifying and managing significant environmental issues (International Council for Exploration of the Sea, 2014; Elliott et al., 2017; Kishchuk et al., 2018).
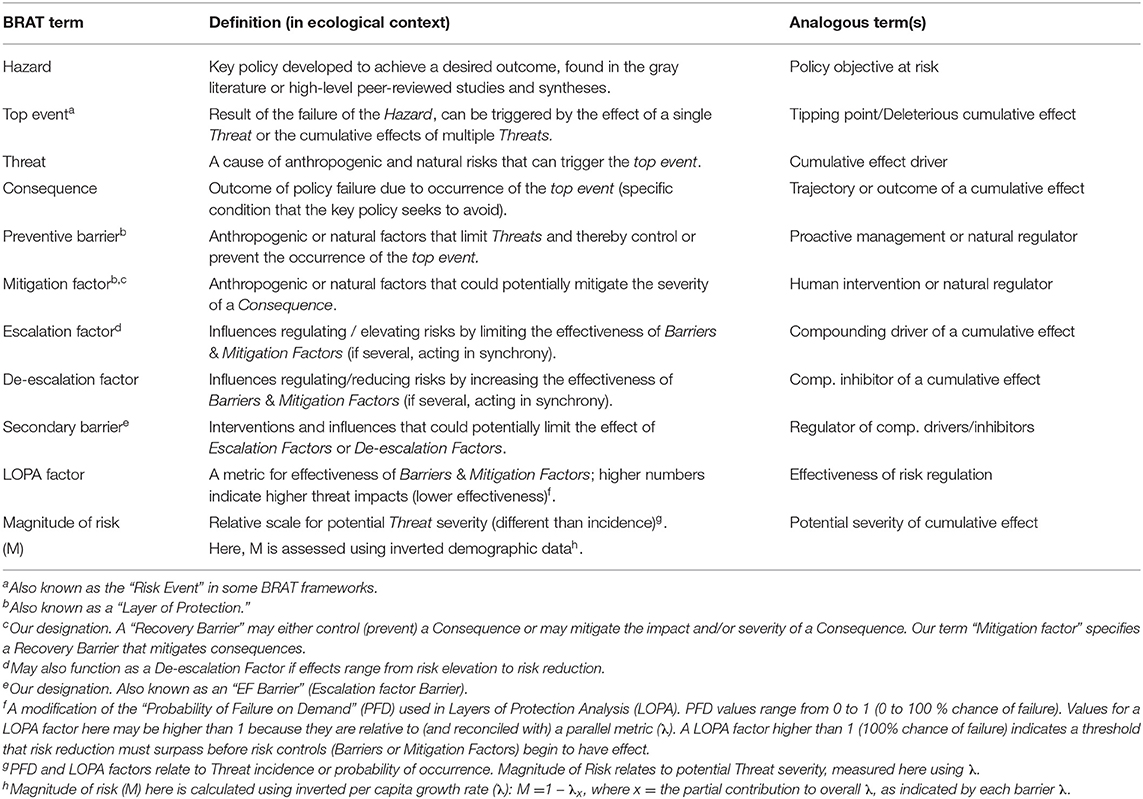
Table 1. Terminology used in the Bowtie Risk Assessment Tool (BRAT) with definitions and analogous terms.
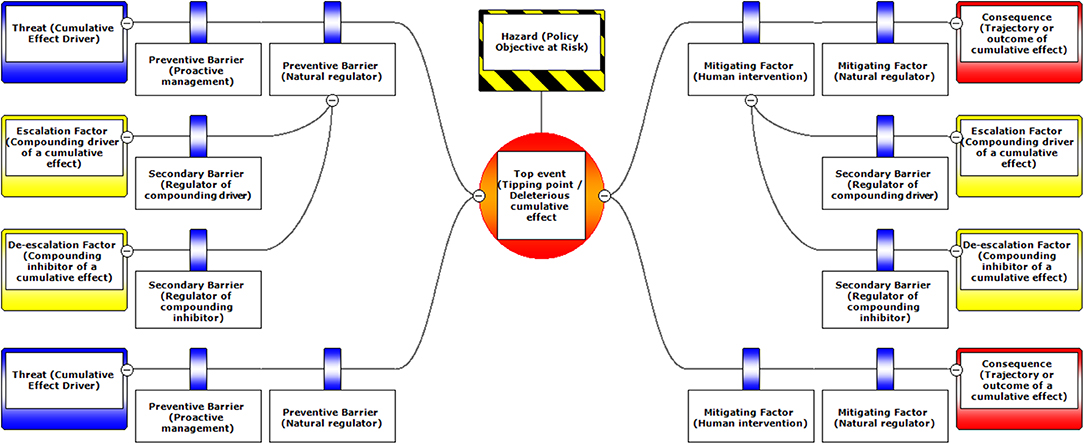
Figure 1. A schematic diagram illustrating the typical layout of BRAT components. Components are labeled with standard BRAT terms or our modified terms (with similar ecological terms in parentheses).
As a demonstration of assessment methods for challenging cumulative effect problems, we focus here on the herds of boreal caribou residing in the large peatland complexes of Northeastern British Columbia (B.C.), Canada. Their distribution covers important habitat for biodiversity conservation and carbon sequestration (Hebblewhite, 2017). The species also represents the contemporary pinnacle between the challenge of balancing globally relevant resources (forestry, oil and gas reserves) with accelerating biodiversity declines in the Anthropocene (Ceballos et al., 2015). As such, the conservation of caribou represents a social, economic, and scientific challenge to our values associated with the natural world.
To prevent further declines of boreal caribou, assessment, and management of cumulative effects is crucial. Although BRAT frameworks were originally developed for high-hazard industries, we use one here to synthesize the ecological factors relevant to cumulative effects on boreal caribou—information directly applicable to the third component of the B.C. cumulative effects framework. Our objective was to balance complexity vs. the need to understand, at the landscape level, the interactive effects of human activities and natural disturbances (e.g., fire) on caribou; ultimately we aimed to identify the most effective management strategies suggested by the framework. We used the bow-tie diagram as an example of systematically working through this process for species at risk, while providing implications and quantitative risk analysis in the context of decision support for the B.C. cumulative effects framework.
Materials and Methods
Study Areas
We focused our analysis on threats to boreal caribou ranges in Northeastern B.C. This region is bounded by the borders of Yukon and Northwest Territories to the north, the border of Alberta to the east, and the Rocky Mountains to the west and south (Figure 2). The boreal forest that dominates this area is considered to be in the “Boreal White and Black Spruce” (BWBS) zone of the B.C. Biogeoclimatic Ecozone Classification system (DeLong et al., 2011). We focused our analyses on three 8,000 km2 study areas within this region, each selected to encompass the range and extent of anthropogenic disturbances occurring in the area (Figures 3, 4). These areas varied in elevation from 218 to 963 m above sea level. Cumulative anthropogenic impacts in Northeastern B.C. stem from a diverse array of land uses and commercial activities including pipelines, well-pads and associated facilities, roads, seismic lines, and forestry, along with a human footprint resulting from farming, settlement, transportation, and infrastructure. These diverse land uses can be important in predicting the conservation and restoration of boreal caribou (Environment Canada, 2012; Environment and Climate Change Canada, 2019).
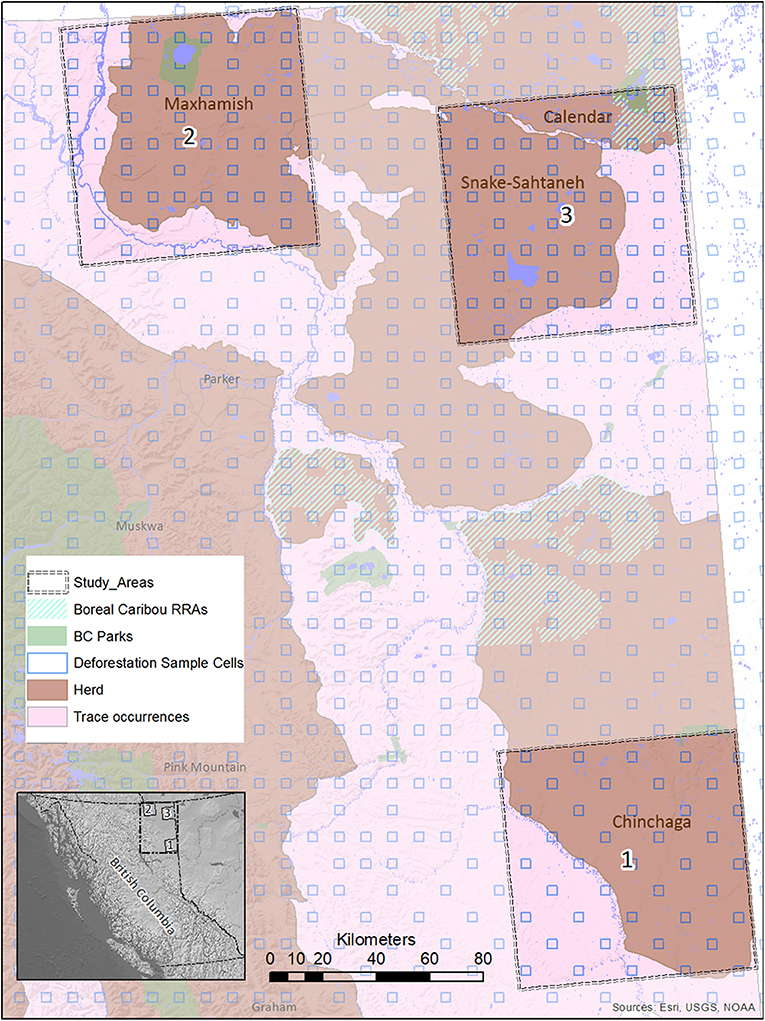
Figure 2. A map of study areas in Northeastern B.C. selected for use in the BRAT (LOPA) analysis, showing their relationship to caribou herds, protected areas, and deforestation sample cells. The location of the study areas within the entire province is also shown (inset, lower left).
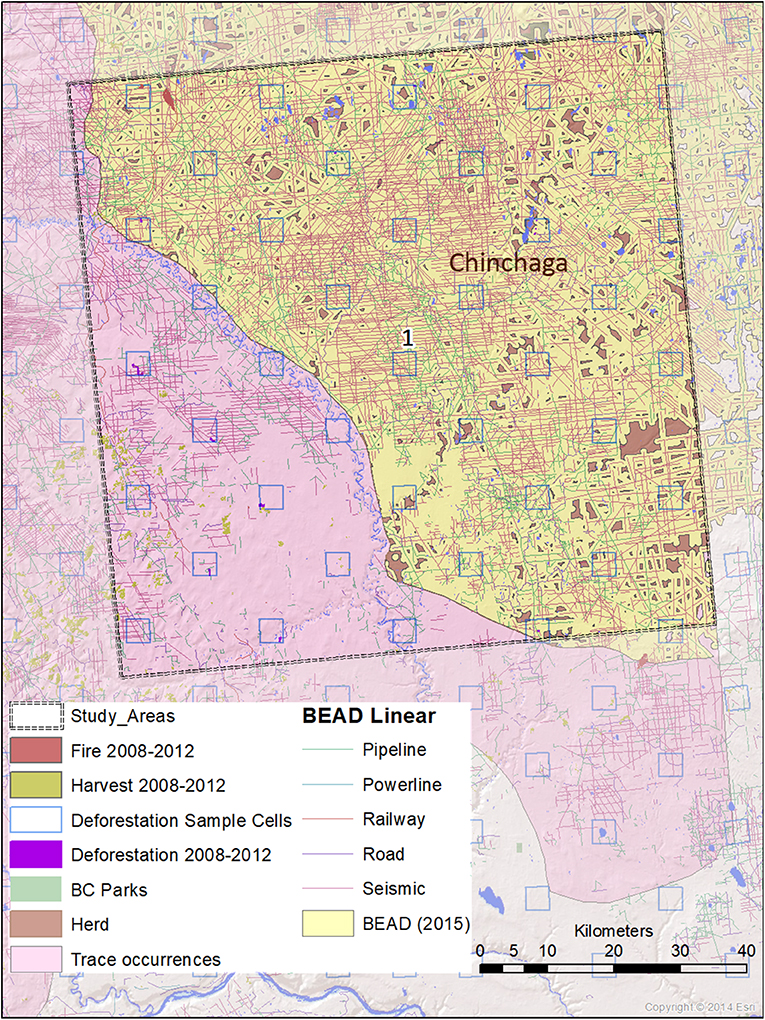
Figure 3. A map of natural and anthropogenic disturbances, deforestation sample cells, and linear features in Study Area 1, associated with the Chinchaga caribou herd. Linear features are those included in the Boreal Ecosystem Anthropogenic Disturbance (BEAD) vector database corresponding to 2008–2010 Landsat imagery.
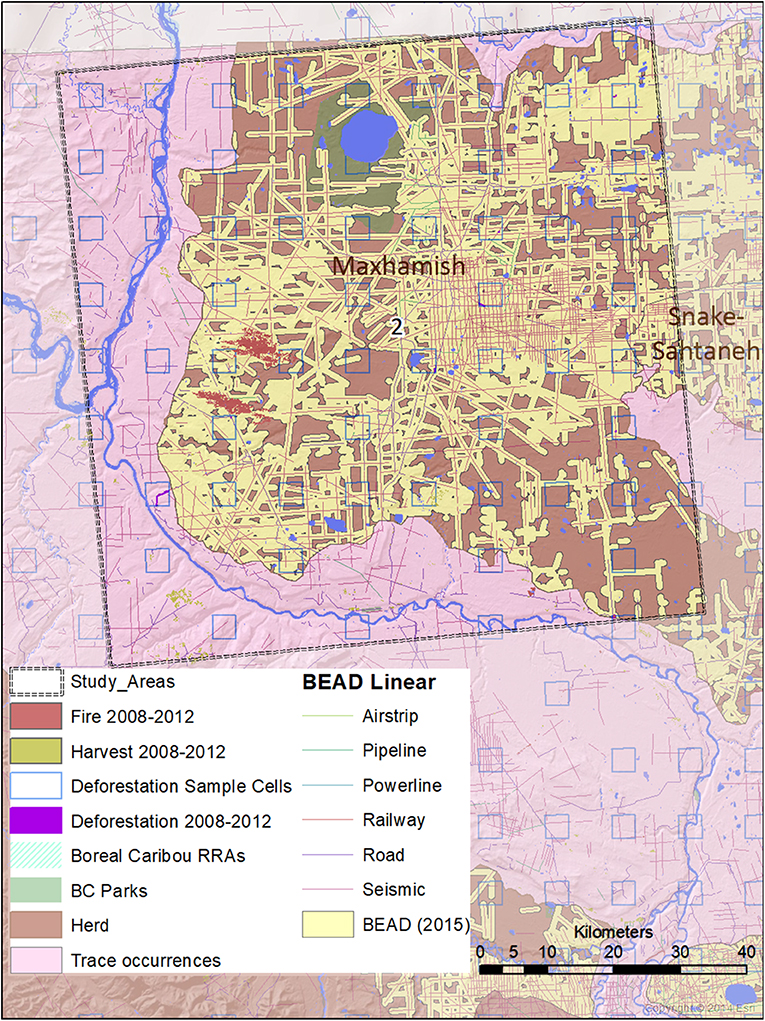
Figure 4. A map of natural and anthropogenic disturbances, deforestation sample cells, and linear features in Study Area 2, associated mostly with the Maxhamish caribou herd. A small portion is also associated with the Snake-Sahtahneh herd. Linear features are those included in the Boreal Ecosystem Anthropogenic Disturbance (BEAD) vector database corresponding to 2008 to 2010 Landsat imagery.
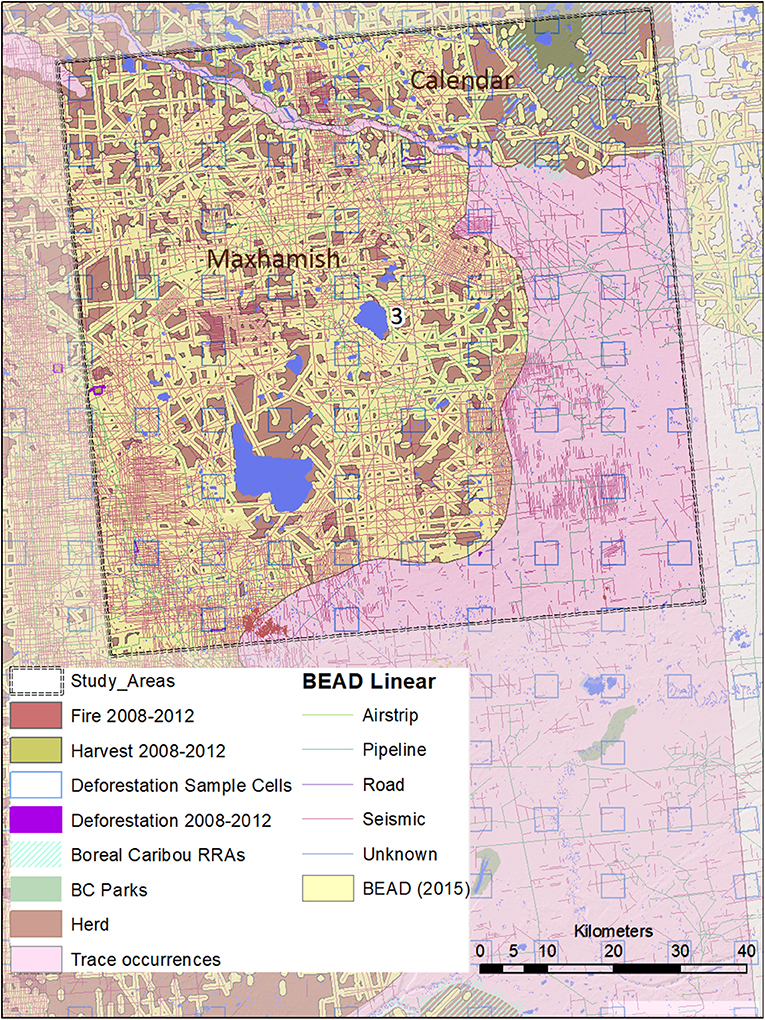
Figure 5. A map of natural and anthropogenic disturbances, deforestation sample cells, and linear features in Study Area 3, associated with the Snake-Sahtahneh and Calendar caribou herds. Linear features are those included in the Boreal Ecosystem Anthropogenic Disturbance (BEAD) vector database corresponding to 2008 to 2010 Landsat imagery.
The spatial data we used in this analysis were derived from several datasets. Caribou herd ranges that overlapped our study areas were derived from Environment and Climate Change Canada (2017). Protected areas were derived from 2001 B.C. Parks data (BCMEMPR, 2019) and Cichowski et al. (2012). General and linear disturbance data were derived from Boreal Ecosystem Anthropogenic Disturbance vector data based on 2008 to 2010 Landsat imagery (Government of Canada, 2012). Deforestation estimates were performed using the specialized calculation method detailed in Dyk et al. (2015), extrapolating from sample-based mapping with 3.5 × 3.5 km cells within the study areas. Annual disturbance rates corresponding to burned areas and timber harvests were derived from the Composite2Change (C2C) dataset (White et al., 2017) based on disturbance in the years 2008–2012.
We ensured that our selected study areas each included 70% of known regular caribou ranges, and 30% of occasional caribou occurrences; this strategy was designed to investigate cumulative effects involving both core and marginal habitat. In 2015, a minimum of 728 caribou was reported for five unspecified Northeastern B.C. herds in “Boreal Caribou Designatable Unit DU6” (Government of British Columbia, 2015). Boreal caribou herds in DU6 include those wholly within Northeastern B.C. (Maxhamish, Calendar, Snake-Sahtahneh, Parker, and Prophet), and one herd spanning across the border of B.C. and Alberta (Chinchaga); these caribou are listed as threatened under Canada's Species at Risk Act, red-listed by the province, and classified as Priority 1 under the B.C. Conservation framework (Government of British Columbia, 2015). The herds most closely associated with our study areas are Chinchaga (Study Area 1), Maxhamish (Study Area 2), and both Snake-Sahtahneh and Calendar (Study Area 3). A very small portion of Study Area 2 is also associated with Snake-Sahtahneh (Figure 2).
Bow-Tie Risk Analysis
The Bow-tie Risk Analysis Tool (BRAT) is composed of two components; the BRAT diagram (Figure 1), and a Layers of Protection Analysis (LOPA)—the numbers presented within a BRAT diagram. The diagram portrays the factors that regulate risk pertinent to a particular hazard, or in the case of land management, a specific policy objective. In the process, it highlights structural aspects of the system regulating risk, along with potential knowledge and policy gaps. It also provides a foundation for making quantitative estimates of risk. LOPA can be used as an additional component to perform a quantitative risk assessment and populate the BRAT with numbers corresponding to the probability of failure for each threat and barriers to those threats (factors causing potential threat reduction, sensu Koornneef et al., 2010). We developed and plotted these components using BowtieXP software (Release version 9.2.17.0, CGE Risk Management Solutions, Ledschendam, The Netherlands), but see section Data Availability below for open and reproducible code.
Because BRAT analyses were created for industrial processes focused around “probabilities of failure,” we modified two key features of the technique to adapt it for use in wildlife biology. This was necessary because wildlife data do not map onto “probabilities of failure”; rather, they have demographic rates and estimates of variability. The first is a scale inversion of risk and the second is an incorporation of the stochasticity inherent in biological systems. We first modified the LOPA method for assessing the importance and scale of threats. In a traditional LOPA, quantification occurs in units (0–1) of risk frequency (or probability of failure); higher values indicate risk failure. In contrast, the key element of biological populations is per capita growth rate, lambda (λ), where higher values indicate success. To connect these, we chose to invert the demographic data to a relative scale more consistent with a traditional LOPA scale; we refer to this as the magnitude of risk:
where x is one of several partial contributions to λ (see below), such as the partial effect of predation on adult female survival rate. So, if the adult female survival rate is 0.885, the magnitude of risk is 0.115. All values we show are derived from demographic data and are therefore on the λ scale; equivalent magnitudes of risk are derived from these values on the λ scale using Equation (1) and are conducted to maintain the connection to a more standard BRAT study. The LOPA numbers in a traditional analysis are multipliers of an initial frequency. We maintain this approach, but we derived all LOPA numbers by converting partial lambda contributions on the additive scale. For example, wolf trapping represents a 35% improvement (reduction of risk); in other words a 0.65 magnitude of risk. This calculation is a novel modification of both BRAT (the qualitative analysis or figure) and LOPA (the quantification applied to the BRAT), and extends application of the tool for decision analysis of wild populations. All LOPA calculations, corresponding rationale, and data sources are outlined in Table A1 (Supplementary Material). The details of an example calculation (for the wolf trapping and hunting barrier) are illustrated in Appendix 2 (Supplementary Material).
Our second modification to the LOPA took into account the annual variability of natural populations that needs to be accounted for when comparing risk to a static threshold. A common approach to reporting the variation in population λ is through the mean estimate and an inter-annual standard deviation. To apply the BRAT framework to cumulative effects analyses of natural populations, we assumed λ was normally distributed and had a standard deviation of 0.1, which is consistent with boreal caribou herd coefficients of variation nationally [Sutherland et al., (in preparation)]. Caribou demographic data distinguish threats between juveniles (through recruitment) and adults (through adult female survival), therefore we followed this convention in our BRAT (Figures 6–8).
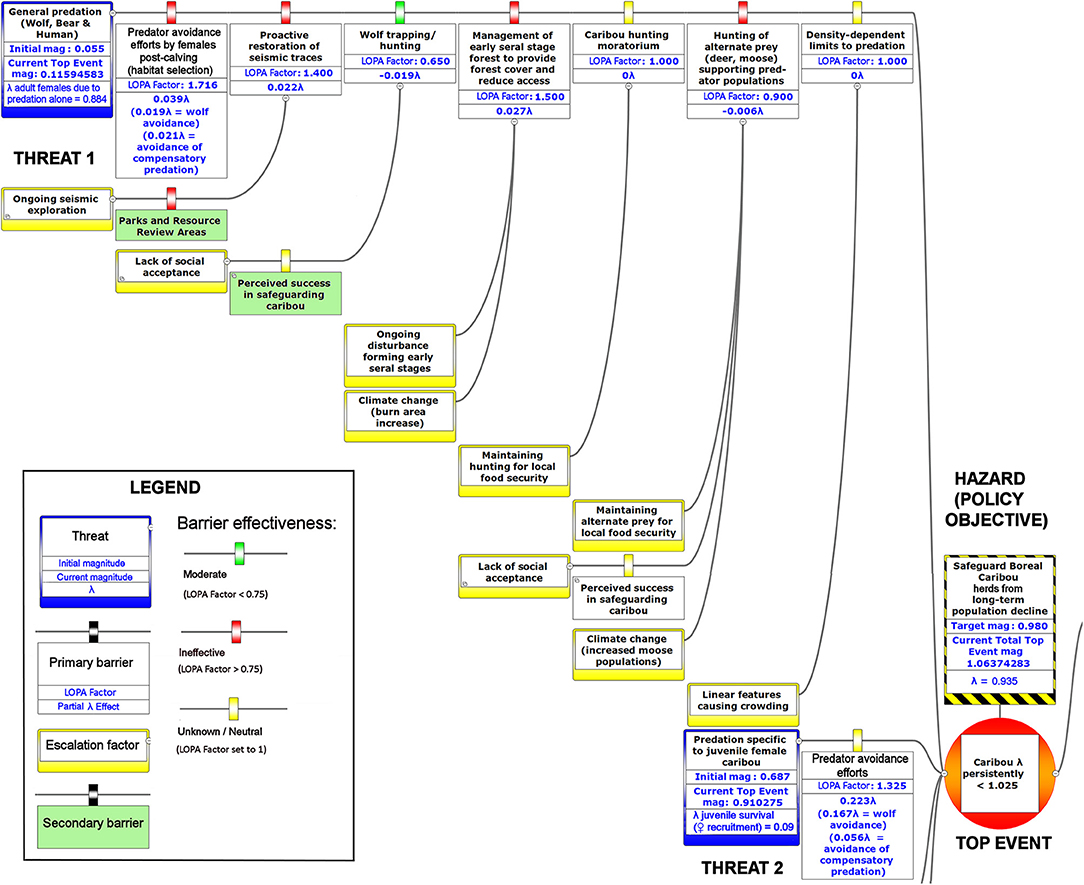
Figure 6. The upper left-hand portion of a bow-tie diagram that visualizes cumulative environmental threats to the boreal caribou meta-population. The top event (red circle, right) is a circumstance where the population growth rate of caribou (λ) persistently falls below 1.025. Natural and anthropogenic factors potentially causing the top event are shown in blue boxes on the left panel. Unchecked, the cumulative threats shown in this figure lead to caribou λ persistently < 1.025; the colored boxes placed between threats and the top event show natural factors and human interventions that are potential barriers to the threats. For each threat, relevant factors that increase risks by limiting barrier effects (escalation factors) are shown in yellow boxes linked to the relevant barriers. Secondary barriers that may reduce or nullify the escalation of risk are shown along the lines leading from escalation factors to the primary threat barriers. The numbers appearing in the blue threat boxes correspond to mean current LOPA incidence for the Chinchaga herd (1.0 = 100% probability of occurrence). Numbers in the barrier boxes correspond to the mean current probability-based LOPA factor for barrier or mitigation failure (1.0 = 100%; greater values compensate for natural vs. altered conditions and unfactored threat incidence). The top event box contains target values for sustainable thresholds. To assist with visual interpretation of the LOPA figures, the barriers are color-coded according to the LOPA factor (green < 0.75, red > 0.75, yellow = 1.0 indicating uncertain risk).
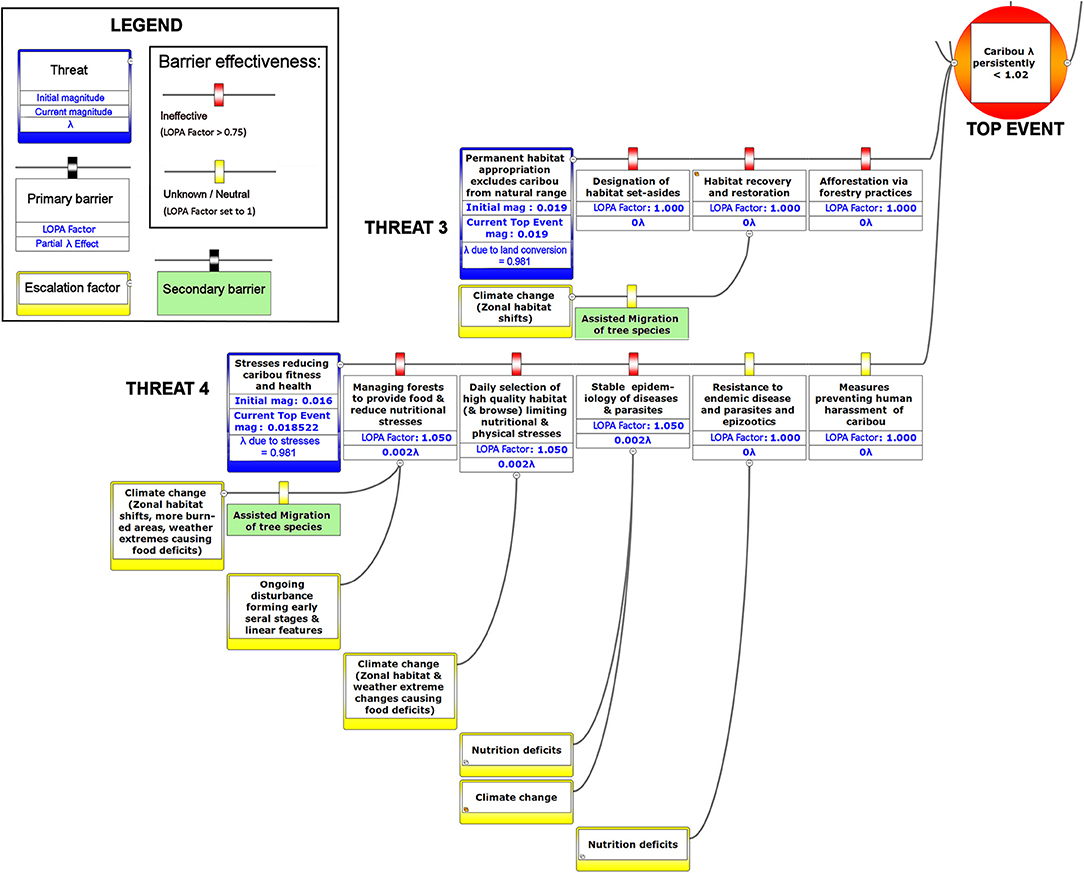
Figure 7. The lower left-hand portion of a bow-tie diagram that visualizes cumulative environmental threats to the boreal caribou meta-population. The top event (red circle, right) is a circumstance where the population growth rate of caribou (λ) persistently falls below 1.025. Natural and anthropogenic factors potentially causing the top event are shown in blue boxes on the left panel. Unchecked, the cumulative threats shown in this figure lead to caribou λ persistently < 1.025; the colored boxes placed between threats and the top event show natural factors and human interventions that are potential barriers to the threats. For each threat, relevant factors that increase risks by limiting barrier effects (escalation factors) are shown in yellow boxes linked to the relevant barriers. Secondary barriers that may reduce or nullify the escalation of risk are shown along the lines leading from escalation factors to the primary threat barriers. The numbers appearing in the blue threat boxes correspond to mean current LOPA incidence for the Chinchaga herd (1.0 = 100% probability of occurrence). Numbers in the barrier boxes correspond to the mean current probability-based LOPA factor for barrier or mitigation failure (1.0 = 100%; greater values compensate for natural vs. altered conditions and unfactored threat incidence). The top event box contains target values for sustainable thresholds. To assist with visual interpretation of the LOPA figures, the barriers are color-coded according to the LOPA factor (green < 0.75, yellow = 1.0 indicating uncertain risk).
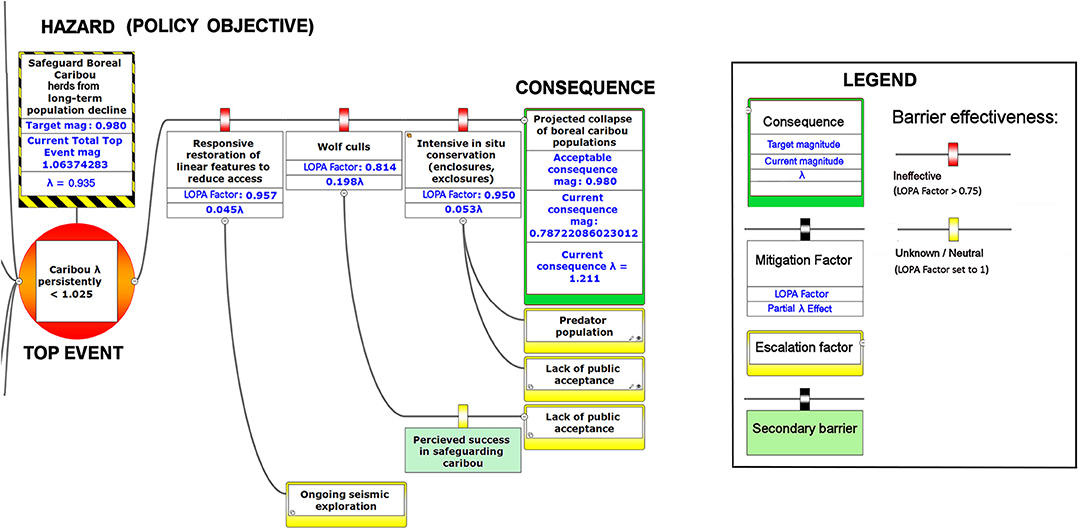
Figure 8. The right-hand portion of a bow-tie diagram that visualizes cumulative environmental threats to the boreal caribou meta-population. The top event (red circle, left) is a circumstance where the population growth rate of caribou (λ) persistently falls below 1.025. The outcome of the top event is shown in the green box at right; the unchecked consequence of an occurrence of the top event would be a reduced meta-population that could ultimately be extirpated. Potential mitigating factors are indicated in boxes between the top event and the outcome. Yellow boxes show risk escalation factors that may reduce barrier effectiveness, and secondary barriers to those escalation factors, if present. The numbers appearing in the mitigation boxes correspond to the mean current probability-based LOPA factor for barrier or mitigation failure for the Chinchaga herd (1.0 = 100%; greater values compensate for natural vs. altered conditions and unfactored threat incidence). The top event and consequence boxes contain target values for sustainable thresholds. To assist with visual interpretation of the LOPA figures, the barriers are color-coded according to the LOPA factor (green = 0.01–0.25, light green = 0.25–0.50, orange = 0.50–0.75, red = values > 0.75, yellow = unknown and set to 1.0 as default). To assist with visual interpretation of the LOPA figures, the barriers are color-coded according to the LOPA factor (red > 0.75, yellow = 1.0 indicating uncertain risk).
Our framework diagram (Figures 6–8) presents the LOPA values calculated for Study Area 1, which contains the BC portion of the Chinchaga herd of boreal caribou. It incorporates published herd size (N), juvenile recruitment (rec), and adult female survival values (SadF; Environment Canada, 2008, 2011). We also calculated the LOPA values for Study Area 2 (i.e., the Maxhamish herd) and Study Area 3 (i.e., the Snake-Sahtahneh herd). Chinchaga and Snake-Sahtahneh herds both had herd size, juvenile recruitment, and adult female survival estimates reported in the national boreal caribou scientific reports (Environment Canada, 2008, 2011). The Maxhamish herd only had data available from provincial reporting on herd size and juvenile recruitment between the years 2013 and 2016 (BCOGRIS, 2016); we averaged these values to obtain an averaged juvenile recruitment and averaged herd size value, and assumed that adult female survival was consistent with the national average of 0.85 (Environment Canada, 2011). The demographic values associated with our study areas can be updated as new data become available. We include multiple study areas for comparison of estimated costs and LOPA parameters for three boreal caribou herds (Tables 2, 3). We used R v3.5.2 (R Foundation for Statistical Computing, 2019) to calculate all inputs and values of the BRAT diagram.
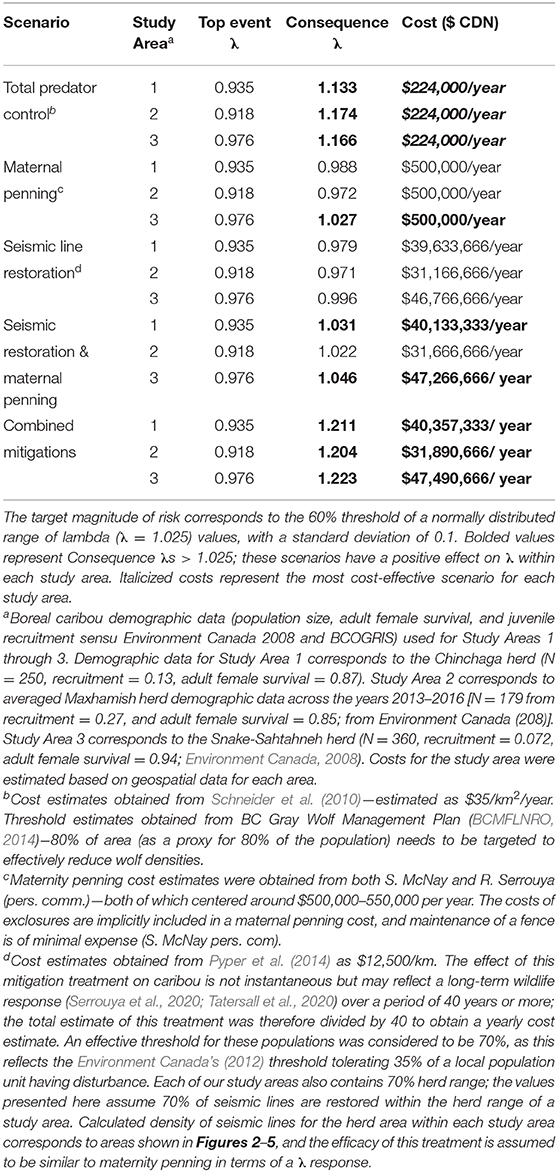
Table 2. Risk quantification and costing for five different mitigation scenarios in three study areas having Woodland boreal caribou in Northeastern British Columbia, Canada, under the presented BRAT framework.
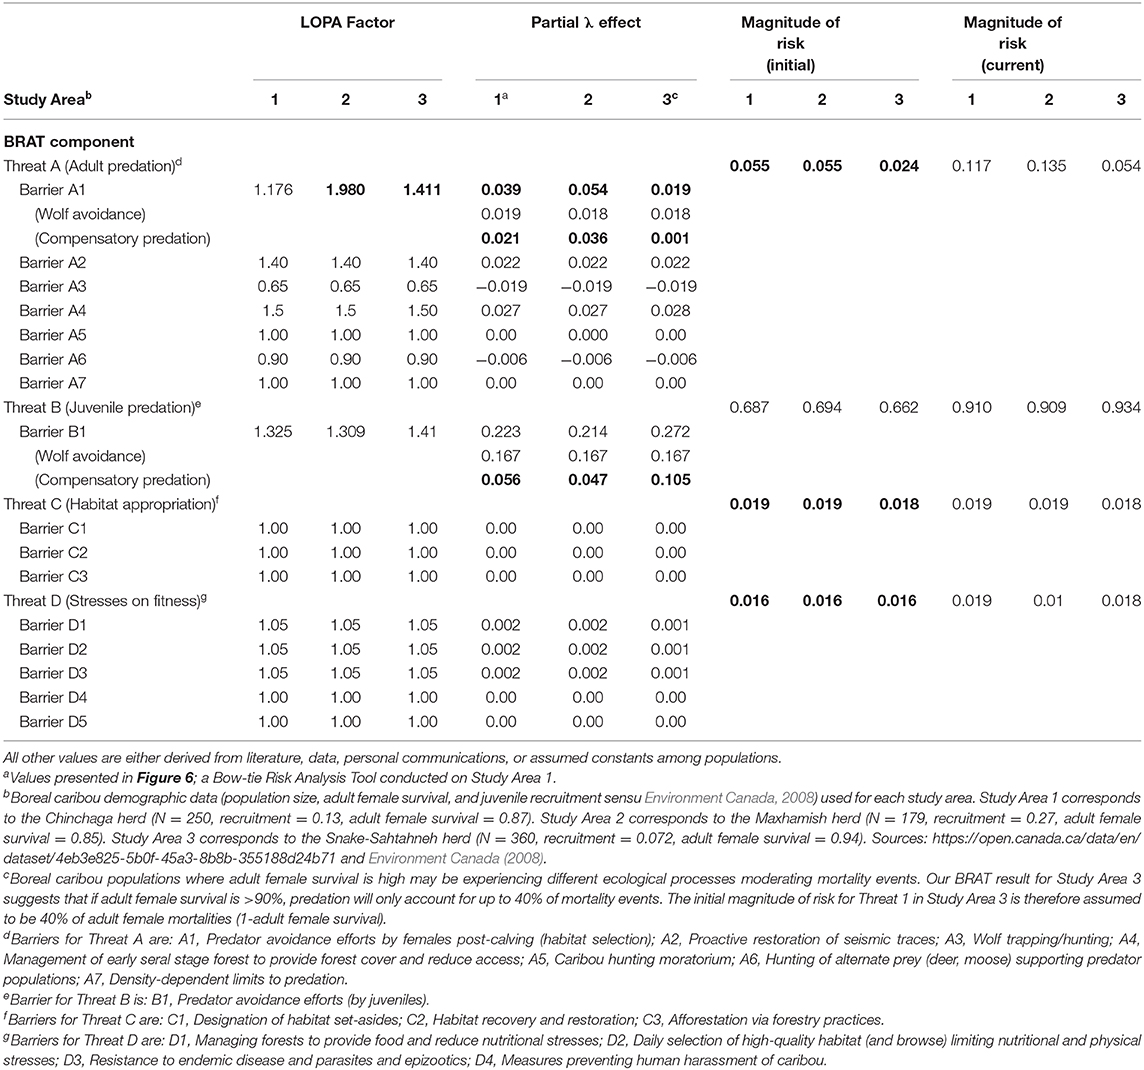
Table 3. Input values for two study areas (Study Areas 1 and 3) having Woodland boreal caribou in Northeastern British Columbia, Canada, under the presented BRAT framework. Bolded values are calculated using the BRAT framework.
The Anatomy and Rationale of a Bow-Tie Risk Analysis Tool Diagram
BRAT diagrams visually display the main risks and outcomes for a specific hazard (policy objective); for cumulative effects, this means that analysis can focus on a reduced set of critical factors and interactions. Outcomes for policy objectives are determined by assessing the most significant cumulative risks emphasized by consensus expert opinion, rather than adapting detailed threat data and models to account for every possible interaction. Our terminology for BRAT components is summarized in Table 1; a typical schematic layout of BRAT components is portrayed in Figure 1. The focus of a bow-tie diagram is a top event (also called “risk event”). The top event is a negative outcome (tipping point) associated with a hazard (or policy objective); policy objectives inspire the identification of the top event. Threats are factors that increase the probability of top event occurrence and any resulting consequences. Barriers can prevent or reduce threats. Barriers to different threats may be similar, but they are considered to be independent for the purposes of risk quantification. Multiple barriers may, however, operate in concert to prevent or reduce threats. In contrast, mitigation factors work to reduce or prevent the consequences of the top event. Like threat barriers, mitigation factors for different consequences are independent, but several may act in concert to reduce or prevent a consequence. Escalation (or de-escalation) factors exacerbate (and/or limit) threats or consequences by limiting or strengthening barriers and mitigation factors. Secondary barriers may limit these escalation or de-escalation factors.
The threats, barriers, mitigation, and escalation factors included in our framework correspond to threats and interventions outlined in Canada's Woodland Caribou (boreal population) recovery strategy (Environment Canada, 2012). The configuration of our framework contrasts with previously developed ecological BRAT frameworks (Elliott et al., 2017; Kishchuk et al., 2018), where all threats and barriers were considered to be anthropogenic. Current ecological models suggest that additive anthropogenic and natural disturbances both cause range-wide declines in boreal caribou (Environment Canada, 2011; Environment and Climate Change Canada, 2019); our framework shows both human and natural threats and barriers.
The numbers shown in the various components of Figures 6–8 correspond to partial λ effects and their equivalent LOPA factor values. For threats, best available information is used to determine the initial partial λ for the threat occurrence and its equivalent magnitude of risk (Equation 1). On the magnitude of risk scale, numbers included with barriers and mitigation factors are multipliers based on a modified Probability of Failure on Demand (PFD). Traditionally, this is the fractional probability (0 = 0%, 1= 100%) that the barrier will fail to prevent the threat or outcome from occurring, according to best available evidence. Our framework allows continuous values >1 for potential barrier failure; this reflects a situation where the barrier experiences a particular reinforcement of risk due to a departure from baseline values (e.g., degraded landscapes). For example, a failure to manage early seral forests within forest management would create a degraded landscape; the barrier would not begin to reduce risks until a combination of less degradation and other risk reduction caused the value to fall below 1.0. This feature also compensates for the possibility that threat incidence may be partly incipient (hidden by natural factors that indirectly reinforce risk), and therefore higher than we are normally able to estimate. We therefore show a partial λ effect and its equivalent modified PFD (“LOPA factor”) for each barrier, where the PFD has been adjusted accordingly. To aid visual interpretation, the barriers and mitigation factors are colored according to their level of effectiveness (Legend, Figures 6–8).
Policy Objective and Top Event
Considering the threatened status of boreal caribou and the intent of Canada's Woodland Caribou (boreal population) Recovery Strategy, which is to sustain all existing local population units (similar to “herds”) under the Species at Risk Act (Environment Canada, 2012), we specified the policy objective of our BRAT framework as: “Safeguarding boreal caribou herds from long-term decline.” Leading from this, we initially expressed the top event as “boreal caribou herd growth rate (‘lambda’ or λ) falling persistently < 1.” Growth rates vary annually, and the recovery strategy for this species has utilized multi-year and multi-herd data to quantify the probability of herd persistence under different landscape disturbances. The strategy document (Environment Canada, 2011) states:
“This recovery strategy identifies 65% undisturbed habitat in a range as the disturbance management threshold, which provides a measurable probability (60%) for a local population to be self-sustaining. This threshold is considered a minimum threshold because at 65% undisturbed habitat there remains a significant risk (40%) that local populations will not be self-sustaining.”
The boreal caribou recovery strategy accepts a threshold of 60% probability of herd persistence under a limit of 35% total landscape disturbance within each herd. We calculated the 60% threshold of a normally distributed population growth rate (λ) centered around 1.0, with standard deviation conservatively set to 0.1 (q.v. section Bow-Tie Risk Analysis); the 60% mark of this distribution corresponds to a value of 1.025. The threshold for triggering the top event was therefore set to λ ≥ 1.025. The assumed standard deviation and threshold value of this distribution can be easily changed under future scenarios to reflect different socially acceptable limits to risk. More data on temporal variation in λ (e.g., using a State-Space population model from population size estimates; Hostetler and Chandler, 2015) would provide a more accurate estimate of the standard deviation, and thus the long-term average λ value that would be required to maintain a 60% probability of a self-sustaining population.
Data Availability
All source code and data for this BRAT analysis are openly available through GitHub (https://github.com/StewartResearch/BRAT_CaribouCalculations.git).
Threats and Barriers
The LOPA functions similar to a structural equation model (Kline, 2015). The product of initial events (magnitudes of risk) and the barrier magnitude of risk for each threat produces an overall magnitude of risk for each threat. In our LOPA, summing the overall magnitudes of risk pertaining to each threat produces a total magnitude of risk for the top event. For barriers, we partition the λ values for the various threats into units of λ [e.g., Appendix 2 (Supplementary Material)]. In some cases we could estimate the partial λ effect corresponding to barriers from literature [e.g., section Post-Top Event Mitigation Factor: Wolf Culls of Appendix 1 (Supplementary Material)] and this value allowed translation into the LOPA factor for that barrier. Elsewhere, simple algebra and knowledge of information components informing a barrier were used to deduce partial λ effects and LOPA factors [e.g., section Threat 2: Predation Specific to Female Juvenile Caribou of Appendix 1 (Supplementary Material)]. Reporting all values in units of λ is valuable as it directly reflects a direction, and quantity, of population change, i.e., a barrier with a −0.02 partial λ effect indicates that it might lower λ from 1.04 to 1.02. Appendix 1 (Supplementary Material) provides details concerning the rationale for including each threat and barrier in the BRAT framework, and how the corresponding numbers were determined or calculated for quantification of risk with LOPA.
For our quantification, we assumed that the effects of escalation factors were implicit (having a current impact already accounted in the LOPA factor for the relevant barrier). While we expect that the escalation factors (e.g., those involving climate change and linear features) are potentially significant factors to model in various future decision-making scenarios, we limited the scope of our analysis to the current situation for caribou in our study areas. Our quantification of risk in this framework therefore applies to contemporary (2019) risk and not a larger timeframe. Escalation factors are shown as qualitative elements where future refinement of risk quantification in different timeframes should focus, but we performed no explicit calculations to portray or model their influence in scenarios where risks are escalated.
Alternate Mitigation Scenarios and Associated Costs
To determine the combination of mitigation factors required to prevent the decline of boreal caribou herds occupying our study areas (Figure 8), we re-ran the LOPA analysis to address different mitigation scenarios: only predator control, only maternal penning, only seismic trace restoration, a combination of seismic trace and maternal penning, and all combined mitigations. We used reported mitigation costs from other caribou herds to determine the cost of each mitigation scenario and contrasted the change on λ values within and between herds under these different “conservation levers” (Table 2).
Sensitivity Analysis
Many of the variables within our BRAT framework were derived from personal communications with caribou researchers or from published or gray literature, and involve inherent uncertainty. Therefore, a sensitivity analysis was performed for our BRAT framework, examining four different classes of uncertainty for the Chinchaga herd. For each type of uncertainty, we varied individual barrier parameters ±50% to determine the resulting change in the top event λ and related metrics.
To evaluate the first class of uncertainty, barrier values, we individually varied the λ value corresponding to the threat with highest potential impact (Threat A, Predation). To determine how much risk from Threat A would be needed to affect the top event λ, we also combined the 50% decreased values of the two barriers having the highest LOPA factors (A1, Predator avoidance, and A4, Management of early seral forest).
Uncertainty in λ distribution was the second class of uncertainty. Varying the sd of the λ distribution (which we assumed to represent a normal distribution) would shift the 60% threshold of herd self-sustainability. We varied the λ sd for the framework ±50% to check effects on calculating the 60% quartile of the λ distribution (i.e., the λ quartile), which represents Environment Canada's (2012) threshold for an acceptable probability of herd persistence (see section Policy Objective and Top Event).
Apportionment of overall risk to individual threat lines constituted the third class of uncertainty. Considering the 90% weight given to Threat A, we varied this weighting ±50% to assess changes relative to the top event λ quartile (1.025).
The fourth class of uncertainty involved potential variability in data pertaining to Threat B (Juvenile predation). The magnitude of risk for this threat was determined based on personal communications with researchers involved in maternal penning studies (Scott McNay, pers. com). This calculation was based on juvenile survival, which in turn was calculated from data for the pregnancy rate of adult females, the survival rate of adult females (SadF), and the likelihood for a calf to survive through their first day without predators (FCalf surv 1st day). We varied these components ±50% to determine implications for the top event λ of the BRAT framework.
Results
Top Event, Consequence, and Mitigation Options: Projected Collapse of Boreal Caribou Herds Alongside Potential for Recovery
Given the current threats to boreal caribou and the associated barriers, our BRAT framework presents a current top event magnitude of risk corresponding to 0.935 λ (or a LOPA factor of 1.06) for Study Area 1, in close agreement with the value for the Chinchaga herd reported by Environment Canada (Environment Canada, 2008). Our BRAT analysis shows that this Chinchaga herd λ is below the targeted 60% probability of self-sustainability (1.025 λ; Figures 6–8, Table 2).
The product of the top event and mitigation factors produces the consequence magnitude of risk. The magnitude of risk for the consequence in this example, based on Chinchaga demographic data (Environment Canada, 2008) and with all mitigation factors quantified, corresponds to 1.211 λ (Figure 8, Table 2); with mitigation the Chinchaga herd may be able to recover to a sustainable level (Figure 8; Table 2). Consequences for herds associated with our three study areas are presented in Table 2, along with associated cost combinations for mitigation scenarios. With either wolf culls, or a combination of mitigations, all three herds may be able to recover to a sustainable level. Exceptions include Snake herd potentially recovering with only maternal penning, and either Chinchaga or Snake herds recovering with a combination of maternal penning and seismic line restoration (Table 2). However, the reliability of all herd recoveries is greatly enhanced (lambda > 1.20) when combining two or more mitigation strategies.
We used local population (i.e., herd) data, from available federal (Environment Canada, 2008, 2011) and provincial (BCOGRIS, 2016) sources to calculate the top event and consequence λ of each study area (Figures 6–8; Table 2). Across all three herds, the top event λ varied from 0.918 to 0.976 λ and was consistently below the target λ (1.025 λ; Table 2), demonstrating potential collapse of B.C. boreal caribou herds under current conditions. Consequence λ varied highly between mitigation scenario combinations (0.971 – 1.223 λ). Implementing total predator controls, a combination of all mitigations, or a combination of seismic trace and maternal penning mitigations provides the potential for a successful recovery of the British Columbia boreal caribou herds (Table 2). The minimal estimated annual cost for an effective mitigation strategy (i.e., recovery strategy) for any study area starts at $224,000 (CDN)/year (Table 2). We note that the costs associated with seismic trace restoration are very high, and in no case will they achieve the objective alone (Table 2).
Sensitivity Analysis
Regarding the first class of uncertainty in threat prevention (barrier values for the Chinchaga herd), increasing or decreasing any one LOPA factor for barriers to Threat A (Predation) by 50% did not cause the top event λ to exceed 1.025 (Table 4). This indicated that a 50% departure from current individual barrier values would not be enough to prevent occurrence of the top event. When the two barriers having the highest LOPA factors were assessed with a combined 50% change, the top event changed to 1.023 (<1.025); more than a 50% change would be required to both of the barriers before they would be marginally effective on the top event.
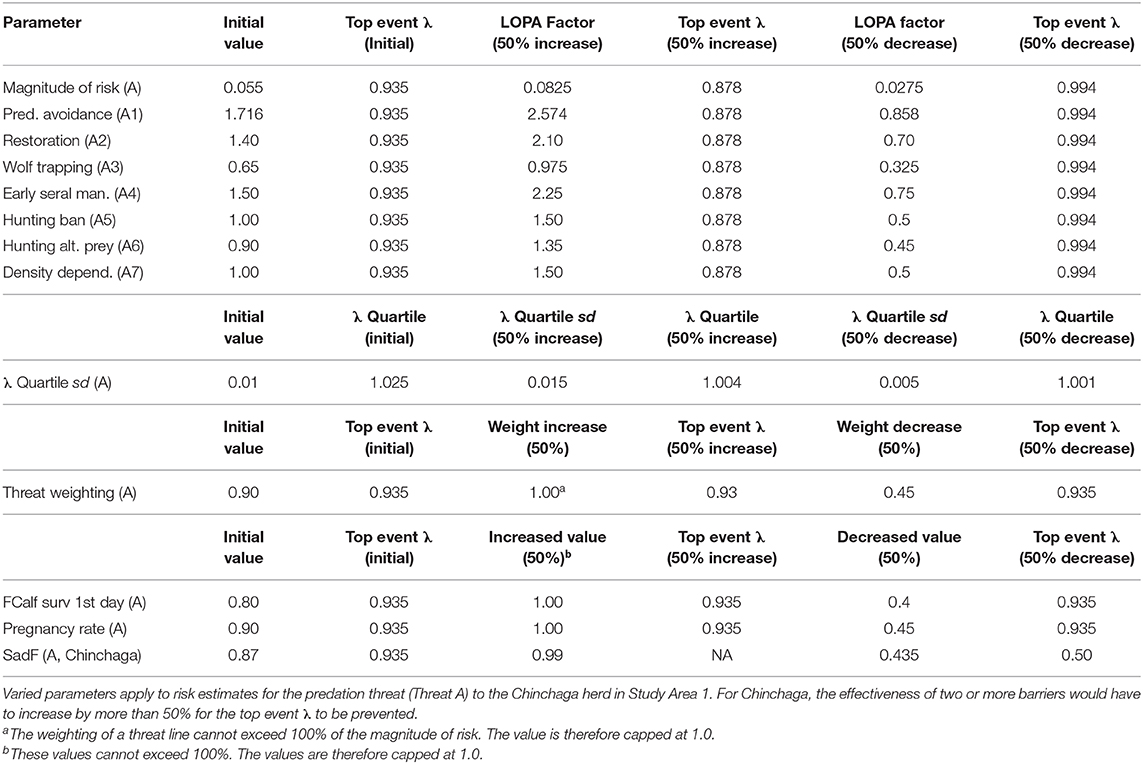
Table 4. Sensitivity analysis for a BRAT framework quantifying risks to Woodland boreal caribou in Northeastern British Columbia, Canada.
For the second class of uncertainty (λ distribution for the Chinchaga herd), a 50% increase in variation of the λ quartile sd also increases the maximum λ quartile, making the barriers for Threat A less likely to prevent the top event (Table 4).
For the third class of uncertainty (apportionment of risk among threats to the Chinchaga herd), varying the 90% apportionment of risk to Threat A did not change the top event λ, as the residual risk due to predation shifted to become a multiplier for the other threats (Table 4).
The fourth class of uncertainty (predation on juveniles in the Chinchaga herd, Threat B) produced impacts on top event that depended on the parameter in question. FCalf surv 1st day and Pregnancy rate did not change the top event λ, as the risk apportioned to predation on female calves (Threat B) shifted to predation on adult females (Threat A; Table 4). In contrast, decreasing SadF 50% below 0.9 drastically altered the top event λ, as it directly affected calculation of the top event for Threat A (Table 4).
Discussion
Using the BRAT, we show that combining mitigation strategies (total predator control, maternity penning, and total restoration of seismic traces) provided the largest growth rate response for all three situations quantified; λ values increased by up to 28.6% (Table 2). Simpler options can also achieve the 60% herd sustainability threshold provided by Environment Canada (2012) for boreal caribou in Northeastern BC. Specifically, total predator control alone and also a combination of seismic trace restoration and maternal penning can achieve the objective. Maternal penning alone may increase λ sufficiently to achieve the objective, but only for the Snake-Sahtahneh herd. Seismic trace restoration alone was unable to achieve the sustainability threshold (Table 2). This analysis did not incorporate a temporal aspect, nor did it address a multi-species perspective. However, results from temporally explicit multi-species modeling (moose, deer, and caribou, Johnson et al., 2019) suggest similar conclusions for the Chinchaga herd; long-term lethal wolf control, a predator exclosure, and aggressive restoration of seismic traces are required for the most cost-effective recovery. Similar results involving seismic lines and multi-species modeling (moose, caribou, and wolves) are apparent for Alberta's herds; linear feature restoration needs to be coupled with other mitigation strategies to lead to population recovery (Serrouya et al., 2020). For situations involving elevated risks due to climate change, forest fragmentation, etc., the influence of escalation factors (and secondary barriers) will require specialized models and calculations to refine the framework, likely through chaining more specific BRAT frameworks for those factors and barriers.
The sensitivity analysis indicated that there are also opportunities to decrease risks through threat prevention, prior to occurrence of the top event. However, options to improve threat barriers in this framework are less immediate and more varied in nature; as a result they are more difficult to cost as options for risk control. If the effectiveness of two barriers to the predation threat (efforts of caribou to avoid predators, and management of early seral stage forests) was improved by 50%, the potential for marginal success in conserving λ was indicated. From our understanding of the current literature, this would require drastic improvement over the current situation. On the other hand, even partial improvement in threat prevention might be joined with the mitigation efforts we have described to achieve a successful outcome. More work is needed to delineate options and associated costs for improving the effectiveness of threat barriers generally.
Significant research regarding predation on caribou has focused on the direct effect of wolves. The focus is appropriate because predation is generally the primary cause of investigated mortality (Wittmer et al., 2005; Hervieux et al., 2014), wolves are generally observed to be a primary direct cause of caribou predation (Bergerud, 1988), and the relationship between wolves and caribou may be density-dependent (Seip, 1992). Controversially, some views have considered the possible contribution of other factors, often hidden behind compensatory predation (Theberge, 1990; Ballard, 1994; Wittmer et al., 2005). Assuming that the majority of wolf predation occurs on juveniles, per various experimental and observational caribou findings (e.g., Adams et al., 1995; Hervieux et al., 2014), we back-calculated the barrier LOPA factor of predation for both adult and juvenile caribou. Based on the population change (λ) values provided in a recent wolf cull experiment (Hervieux et al., 2014), we separated the effect of direct wolf predation and compensatory predation on both adult female and juvenile survival (Figure 6; Table 3). In Study Area 1, we found that compensatory predation has a smaller effect on juvenile survival, but a larger effect on adult female survival, than direct mortality caused by wolves. In Study Area 3, we found that compensatory predation has a larger effect on juvenile survival than direct mortality by wolves. For example, our BRAT analysis (Study Area 1; Figure 6) indicates that wolf predation accounts for 46.7% of adult female predation events and 74.9% of juvenile female predation events in the Chinchaga herd; the remaining predation (53.3% for adults and 25.1% for juveniles) is considered to be compensatory (Table 3). These high levels of compensatory mortality may be one explanation for why multi-annual, relatively high intensity (50–80% density reduction) wolf culls are required to provide a change in caribou herd λ (BCMFLNRO, 2014; Hervieux et al., 2014). Alternatively, the compensatory predation component of caribou mortality suggested here may be due to wolves not targeted by culls (i.e., wolf immigration through meta-population dynamics), other predators (i.e., bears, cougars, or wolverines), or knowledge gaps surrounding caribou health and disease.
Our BRAT framework identified and partly addressed additional knowledge gaps in our understanding of caribou population declines. We found that herds with high adult female survival may have lower proportions of their respective mortality rates due to additive predation. For herds with >90% adult female survival, our LOPA factors and magnitudes of risk only reconciled if we assumed that 40% of adult female mortality was due to predation. This insight may show the difference between rates of high predation on adult females, and alternate ecological processes causing adult female mortality. As adult female mortality increases (e.g., above 10%), predation accounts for the majority of mortality events. At lower levels of adult female mortality, alternate causes of death or reduction in λ (habitat appropriation, and/or health; Threats 3 and 4 Figure 7) appear to encompass the dominant mortality drivers (Table 3). Other knowledge gaps surround aspects of caribou and predator behavior on population dynamics (but see Vors and Boyce, 2009; Dickie et al., 2017; Droghini and Boutin, 2017 for highlighted existing examples), and the impacts of climate change on risks and risk management. Knowledge is still being accumulated for some factors like health stressors (Forde et al., 2016; Schwantje et al., 2016; Bondo et al., 2019). Studies quantifying risk in these areas would help to better assess trade-offs when analyzing the risks for different management scenarios; the high annual costs associated with optimal levels of penning, wolf culls, and restoration of seismic traces (Table 1; Johnson et al., 2019), for example, may increase the need to consider a mix of other management options.
Climate change emerges in this framework as a pervasive anthropogenic factor potentially escalating future risks. While precipitation in the boreal zone is generally predicted to increase, increased temperatures and evaporation will likely lead to more frequent drought conditions in boreal forests in western Canada and increase the risk of forest fires (Price et al., 2013), leading to biome shifts (Luo et al., 2018). Together with land use change (Darlington, 2018), warming winter temperatures also improve over-winter survival of deer, and as a consequence of the increased prey base, wolf population densities may also increase (Dawe and Boutin, 2016). In Alberta, for example, climate and land use changes have caused the expansion of white-tailed deer ranges into boreal caribou ranges (Latham et al., 2011; Dawe et al., 2014; Hebblewhite, 2017). Climate change will also affect many aspects of ecosystems representing caribou habitat suitability (Molau and Alatalo, 1998; Dukes et al., 2009; Joly et al., 2009; Vors and Boyce, 2009; Culling and Cichowski, 2017). Migration rates of tree species are much slower than the rate of predicted change in climatic conditions (Winder et al., 2011; Price et al., 2013); suboptimal climate conditions for vegetation and biomes may reduce habitat suitability and ultimately jeopardize the long-term effectiveness of penning and other in situ conservation efforts. Assisted migration of key tree provenances (Pedlar et al., 2012) might mitigate some climate risks, although this carries its own risks that increase with translocation distance (Ste-Marie et al., 2011; Winder et al., 2011). We predict that climate change will be a key factor to consider in any attempt to model future cumulative effects in general; it has the potential to significantly degrade a wide variety of natural barriers to risk, such as many of those incorporated into this BRAT framework.
A rarely discussed topic and additional knowledge gap in caribou conservation surrounds our accurate understanding and sampling of ecological process on past, present, and projected future landscapes. The diversity of caribou monitoring methods, which are constantly changing due to advancements in the field like remote cameras (Burton et al., 2015), non-invasive genetic tagging methodologies (Ball et al., 2010), remote sensing, and statistical technologies, complicates this sampling as not all methods will produce comparable estimates of density and abundance (Burgar et al., 2018; Stewart et al., 2018). As the heterogeneity of boreal landscapes increases with both land use and climate change, the diversity of ecological processes moderating efficacy of conservation strategies may also change (Dunning et al., 1992; Stewart et al., 2019). For a species such as caribou, with a long evolutionary history in a relatively homogenous and rarely fragmented ecosystem (Schaefer, 2003; Wilson et al., 2019), a combination of conservation strategies may be required to conserve landscape processes facilitating their survival (Serrouya et al., 2019, 2020).
Refining Future Analyses
There are assumptions and caveats associated with our demonstration of the BRAT that should be considered in future efforts to refine its use in risk analysis of ecological cumulative effects. For example, standard approaches to the BRAT have emphasized human regulations, rules, laws, and policies as effective barriers or mitigation actions in a regulatory system; our approach involves a more comprehensive listing of natural and anthropogenic factors regulating a population at a landscape level. To validate the type of BRAT that we developed, there is therefore a need for comprehensive data on threats and barrier effectiveness or compliance. This is especially the case because we only explored one potential ecological outcome, and did not investigate other social or political consequences that could also be considered, such as economic implications for the forestry industry, or cultural implications for northern aboriginal peoples.
One limitation of using the BRAT to assess cumulative effects is that there is no explicit accounting for secondary interactions among BRAT components. This issue could likely be addressed by using the framework to underpin a fully quantitative and detailed risk assessment, via conversion to a Bayesian belief network (Periera et al., 2015). Through building upon the BRAT provided here, future analyses could detail the relationships among threat probability and impacts, ecological thresholds, natural barriers, and ultimately relevant, specific rules and regulations (Government of British Columbia, 2015) controlling or mitigating the threat.
Using the BRAT for Decision Support
In its present form, the bow-tie diagram can facilitate decision-making by presenting a clear visual and quantitative synthesis that effectively translates our knowledge of risk to stakeholders. For example, a draft provincial boreal caribou recovery implementation plan (BCME/BCMFLNRO, 2017) makes specific recommendations concerning forest management. Its key elements involve: (1) establishment of an early seral habitat target of (initially) <6% across each boreal caribou range; (2) prohibition of forest harvesting and road building in 15 of the 16 core areas; and (3) prohibition of the creation of new early seral forest in core ranges unless an exception is granted. Our BRAT framework speaks to each of these elements. Through analysis of different management scenarios within those elements, a quantitative approach using BRAT could ideally form the basis of a decision-making system to manage risks to caribou at the landscape level.
Fully addressing the various facets of each threat in our framework would require the development of separate or chained BRAT frameworks. For example, a framework could be considered for permanent habitat appropriation, wherein “reduction of caribou habitat” would be the top event. With all of the threats being anthropogenic at that point, specific human planning elements and regulations would then constitute the chief threat barriers and principal mitigating factors. However, the extent and severity of disturbance impacts on caribou varies depending on the spatial and temporal scales involved, with factors such as terrain, seasonal attributes, the type and pattern of disturbance, and the composition and sensitivity of herds playing an important role in that variability (Vistens and Nelleman, 2008; Shackelford et al., 2018). Defining rules or thresholds for using the relevant framework in decision-making (predation vs. habitat appropriation) would thus require a spatially explicit analysis.
The appetite for boreal caribou recovery efforts spans provincial, federal, and aboriginal governments (Environment and Climate Change Canada, 2018). However, scientific research needs to be translatable to policy makers to produce on-the-ground change. We believe that this is a contributory role that the BRAT framework can fulfill; the strategies investigated here were based on existing and well-quantified landscape experiments that we were able to apply to the policy guidelines surrounding boreal caribou herds of Northeastern British Columbia. These strategies did not take the temporal window of recovery, or interactions among threats or mitigations, into account but instead assumed a direct response upon implementation. It therefore represents the most optimistic situation.
Conclusions
Using Woodland caribou as a practical example, we found the BRAT framework can be adapted to provide a new visual synthesis of the threats, barriers and impacts pertinent to cumulative ecological effects on threatened wildlife species. By identifying the most substantial elements of the complexity affecting caribou herds in three study areas in Northeastern British Columbia, the BRAT framework provides a new comprehensive perspective on the cumulative ecological effects pertinent to Woodland caribou (boreal population). We quantified the effort and estimated the cost of interventions required to mitigate risk and maintain λ above the top event threshold of 1.025 (representing the λ associated with 60% probability of herds being self-sustaining; Table 2). Uncertainty pertaining to threat reduction prior to the top event was also evaluated (Table 4). We show that visualization of cumulative effect problems can identify key knowledge gaps in risk mitigation, and that quantification of risk events leads to evaluation of possible strategies for mitigation. The confidence of our results for boreal caribou in Northeastern B.C. may improve with additional knowledge on habitat appropriation, health, and potential climate change impacts, as well as the effect of compensatory predation on mortality events. Our analysis of mitigation options is consistent with other analyses of the Woodland caribou situation; it confirms that applying any of the proposed mitigation strategies (predator control, maternal penning, or seismic trace restoration) has the potential to reduce population declines, but that concerted application of multiple strategies is required to effectively recover herds. Given our parameter estimates, risk mitigation would be unlikely to achieve long term success without including a determined and ongoing wolf cull, whether alone or in conjunction with maternal penning and restoration of seismic traces. However, risk prevention may be another option. Our sensitivity analysis indicated that >50% combined improvement in two barriers preventing the predation threat (efforts of caribou to avoid predators, and management of early seral stage forests) may lead to a marginal chance of success. Combining mitigation interventions and threat prevention strategies therefore provides a path to sustainable herds of boreal woodland caribou. This mix will nevertheless require a more detailed understanding of threat prevention, and ongoing efforts to mitigate current declines.
Data Availability Statement
Data layers corresponding to caribou range and demographics, parks boundaries, the BEAD database, and the C2C database, are publicly available as referenced in the citations. Data corresponding to the special calculations for deforestation are not public; it is available from the authors of the cited publication.
Author Contributions
RW organized the project. RW and SN jointly conceived, researched, and developed the initial bow-tie framework, and jointly wrote the main parts of the initial manuscript. FS, EM, and RW developed key revisions for the framework (layout, LOPA analysis, and scenario-based cost analyses), additional context, and major sections of revised text. AD and KO provided analysis of geospatial data, models, and context to support the LOPA analysis.
Funding
This research was funded by Natural Resources Canada (Canadian Forest Service, Forest Ecosystem Integrity and Cumulative Effects Programs).
Conflict of Interest
The authors declare that the research was conducted in the absence of any commercial or financial relationships that could be construed as a potential conflict of interest.
The reviewer DP, declared a shared affiliation, with no collaboration, with authors, RW, FS, EM, AD, and KO to the handling editor at the time of review.
Acknowledgments
We thank T. Muhly, H. Schwantje, B. Smith, J. Psylakis, H. Madill, R. Courmier, I. Creed, M. Fullerton, L. Venier, B. Kishchuk, D. Kreutzweiser, J. Brandt, D. Maynard, J. Wittrock, S. McNay, W. Hays-Byl, and E. Campbell for providing insightful discussions and review comments concerning BRAT and caribou recovery plans. We also thank N. Beaudoin and H. Boczulak for technical assistance.
Supplementary Material
The Supplementary Material for this article can be found online at: https://www.frontiersin.org/articles/10.3389/fevo.2020.00001/full#supplementary-material
References
Adams, L. G., Singer, F. J., and Dale, B. W. (1995). Caribou calf mortality in Denali national park, Alaska. J. of Wildlife Manag. 584–594. doi: 10.2307/3802467
Andrew, M. E., Wulder, M. A., and Cardille, J. A. (2014). Protected areas in boreal Canada: a baseline and considerations for the continued development of a representative and effective reserve network. Env. Rev. 22, 135–160. doi: 10.1139/er-2013-0056
Auditor General of British Columbia (2015). Managing the Cumulative Effects of Natural Resource Development in B.C. 37. Available online at: http://www.bcauditor.com/sites/default/files/publications/reports/OAGBC%20Cumulative%20Effects%20FINAL.pdf (accessed August 10, 2018).
Ball, M. C., Finnegan, L., Manseau, M., and Wilson, P. (2010). Integrating multiple analytical approaches to spatially delineate and characterize genetic population structure: an application to boreal caribou (Rangifer tarandus caribou) in central Canada. Cons. Gen. 11, 2131–2143. doi: 10.1007/s10592-010-0099-3
BCME/BCMFLNRO (British Columbia Ministry of Environment B.C. Ministry of Forests Lands, Natural Resource Operations). (2017). Draft Boreal Caribou Recovery Implementation Plan. Available online at: https://engage.gov.bc.ca/app/uploads/sites/121/2017/03/Draft-Boreal-Caribou-Recovery-Implementation-Plan-2017-2.pdf (accessed July 17, 2018).
BCMEMPR (B.C. Ministry of Energy Mines Petroleum Resources). (2019). Geospatial Data Downloads. Available online at: http://www.empr.gov.bc.ca/Mining/Geoscience/MapPlace/geoData/Pages/default.aspx (accessed February 22, 2019).
BCMFLNRO (B.C. Ministry of Forests Lands and Natural Resource Operations). (2014). Management Plan for the Grey Wolf (Canis lupus) in British Columbia. Victoria, BC: B.C. Ministry of Forests, Lands and Natural Resource Operations. 48.
BCOGRIS (2016), Boreal Caribou. Completed Projects. Available online at: http://bcogris.ca/boreal-caribou/projects/complete (accessed December 9, 2019).
Bergerud, A. T. (1988). Caribou, wolves, and man. Trends Ecol. Evol. 3, 68–72. doi: 10.1016/0169-5347(88)90019-5
Bichet, O., Dupuch, A., Hébert, C., Le Borgne, H., and Fortin, D. (2016). Maintaining animal assemblages through single-species management: the case of threatened caribou in boreal forest. Ecol. Appl. 26, 612–623. doi: 10.1890/15-0525
Bondo, K. J., Macbeth, B., Schwantje, H., Orsel, K., Culling, D., Culling, B., et al. (2019). Health survey of boreal caribou (Rangifer tarandus caribou) in Northeastern British Columbia, Canada. J. Wildlife Dis. 55, 544–562. doi: 10.7589/2018-01-018
Brandt, J. P., Flannigan, M. D., Maynard, D. G., Thompson, I. D., and Volney, W. J. A. (2013). An introduction to Canada's boreal zone: ecosystem processes, health, sustainability, and environmental issues. Env. Rev. 21, 207–226. doi: 10.1139/er-2013-0040
Burgar, J. M., Stewart, F. E. C., Volpe, J. P., Fisher, J. T., and Burton, A. C. (2018). Estimating density for species conservation: comparing camera trap spatial count models to genetic spatial capture-recapture models. Glob. Ecol. Cons. 15:e00411. doi: 10.1016/j.gecco.2018.e00411
Burton, A. C., Neilson, R., Moreira, D., Ladle, A., Steenweg, R., Fisher, J. T., et al. (2015). Wildlife camera trapping: a review and recommendations for linking survey to ecological processes. J. Appl. Ecol. 53, 675–685. doi: 10.1111/1365-2664.12432
Ceballos, G., Ehrlich, P. R., Barnosky, A. D., García, A., Pringle, R. M., and Palmer, T. M. (2015). Accelerated modern human–induced species losses: entering the sixth mass extinction. Sci. Adv. 1:e1400253. doi: 10.1126/sciadv.1400253
Cichowski, D., Culling, D., and McNay, S. (2012). Performance measures for resource review areas for Woodland Caribou in British Columbia. Report to British Columbia Ministry of Forests, Lands and Natural Resource Operations. Available online at: http://www.env.gov.bc.ca/wld/speciesconservation/bc/documents/RRA%20Performance%20Measures%20-%20March%2031,%202012.pdf (accessed January 26, 2019).
Culling, D. E., and Cichowski, D. B. (2017). Boreal Caribou (Rangifer tarandus) in British Columbia: 2017 Science Review. 141. Available online at: http://www.bcogris.ca/sites/default/files/bcip-2016-21-science-review-2017-final.pdf (accessed August 10, 2018).
Dale, B. W., Adams, L. G., and Bowyer, R. T. (1994). Functional response of wolves preying on barren-ground caribou in a multiple-prey ecosystem. J. Anim. Ecol. 63, 644–652. doi: 10.2307/5230
Darlington, S. (2018). Cumulative effects of human landscape change, predators, and natural habitat drive distributions of an invasive ungulate (MSc Thesis), University of Victoria. Available online at: http://dspace.library.uvic.ca/bitstream/handle/1828/10397/Darlington_Siobhan_MSC_2018.pdf (accessed January 24, 2019).
David Suzuki Foundation (2013). Cultural and Ecological Value of Boreal Woodland Caribou Habitat. Available online at: https://www.afn.ca/uploads/files/report-caribou.pdf (accessed August 10, 2018).
Dawe, K. L., Bayne, E. M., and Boutin, S. (2014). Influence of climate and human land use on the distribution of white-tailed deer (Odocoileus virginianus) in the western boreal forest. Can. J. Zool. 92, 353–363. doi: 10.1139/cjz-2013-0262
Dawe, K. L., and Boutin, S. (2016). Climate change is the primary driver of white-tailed deer (Odocoileus virginianus) range expansion at the northern extent of its range; land use is secondary. Ecol. Evol. 6, 6435–6451. doi: 10.1002/ece3.2316
DeLong, C., Banner, A., MacKenzie, W. H., Rogers, B. J., and Kaytor, B. (2011). A field guide to ecosystem identification for the Boreal White and Black Spruce Zone of British Columbia. Land Management Handbook No. 65. Victoria, BC: BC Ministry of Forests and Range, Research Branch.
Dickie, M., Serrouya, R., McNay, R. S., and Boutin, S. (2017). Faster and farther: wolf movement on linear features and implication for hunting behaviour. J. Appl. Ecol. 54, 253–263. doi: 10.1111/1365-2664.12732
Droghini, A., and Boutin, S. (2017). Snow conditions influence grey wolf (Canis lupus) travel paths: the effect of human-created linear features. Can. J. Zool. 96, 39–47. doi: 10.1139/cjz-2017-0041
Duinker, P. N., Burbridge, E. I., Boardley, S. R., and Greig, L. A. (2013). Scientific dimensions of cumulative effects assessment: toward improvements in guidance for practice. Env. Rev. 21, 40–52. doi: 10.1139/er-2012-0035
Dukes, J. S., Pontius, J., Orwig, D., Garnas, J. R., Rodgers, V. L., Brazee, N., et al. (2009). Responses of insect pests, pathogens, and invasive plant species to climate change in the forests of northeastern North America: what can we predict? Can. J. For. Res. 39, 231–248. doi: 10.1139/X08-171
Dunning, J. B., Danielson, B. J., and Pulliam, H. R. (1992). Ecological processes that affect populations in complex landscapes. Oikos 65, 169–175. doi: 10.2307/3544901
Dyk, A., Leckie, D., Trinis, S., and Ortlepp, S. (2015). Canada's National Deforestation Monitoring System: System Description. Information report BC-X-439. Available online at: http://cfs.nrcan.gc.ca/pubwarehouse/pdfs/36042.pdf (accessed January 26, 2019).
Elliott, M., Burdon, D., Atkins, J. P., Borja, A., Cormier, R., de Jonge, V. N., et al. (2017). “And DPSIR begat DAPSI(W)R(M)!” - a unifying framework for marine environmental management. Maritime Pollut. Bull. 118, 27–40. doi: 10.1016/j.marpolbul.2017.03.049
Environment Canada (2008). Scientific Review for the Identification of Critical Habitat for Woodland Caribou (Rangifer tarandus caribou), Boreal Population, in Canada. Ottawa: Environment Canada. 72.
Environment Canada (2011). Scientific Assessment to Inform the Identification of Critical Habitat for Woodland Caribou (Rangifer tarandus caribou), Boreal Population, in Canada: 2011 Update. Ottawa, ON: Environment Canada. 102.
Environment Canada (2012). Recovery Strategy for the Woodland Caribou (Rangifer tarandus caribou), Boreal population, in Canada−2012. Species at Risk Act Recovery. 138 Available online at: http://publications.gc.ca/collections/collection_2012/ec/En3-4-140-2012-eng.pdf (accessed August 10, 2018).
Environment Climate Change Canada (2017). Report on the Progress of Recovery Strategy Implementation for the Woodland Caribou (Rangifer tarandus caribou), Boreal Population in Canada for the Period 2012–2017. Ottawa: Environment and Climate Change Canada. 94. Available online at: http://publications.gc.ca/collections/collection_2017/eccc/En3-4-140-1-2017-eng.pdf (accessed August 10, 2018).
Environment and Climate Change Canada (2018). Progress Report on Unprotected Critical Habitat for the Woodland Caribou (Rangifer tarandus caribou), Boreal Population, in Canada. Species at Risk Act Critical Habitat Report Series. Ottawa: Environment and Climate Change Canada. 19. Available online at: https://www.canada.ca/en/environment-climate-change/services/species-risk-public-registry/critical-habitat-reports/woodland-caribou-boreal-population-2018.html (accessed January 27, 2019).
Environment Climate Change Canada (2019). Woodland Caribou, Boreal Population (Rangifer tarandus caribou): Amended Recovery Strategy 2019. Available online at: https://www.canada.ca/en/environment-climate-change/services/species-risk-public-registry/recovery-strategies/woodland-caribou-boreal-2019.html (accessed September 25, 2019).
Festa-Bianchet, M., Ray, J. C., Boutin, S. S., Côté, D., and Gunn, A. (2011). Conservation of caribou (Rangifer tarandus) in Canada: an uncertain future. Can. J. Zool. 89, 419–434. doi: 10.1139/z11-025
Fisher, J. T., and Burton, A. C. (2018). Wildlife winners and losers in an oil sands landscape. Front. Ecol. Environ. 16:1807. doi: 10.1002/fee.1807
Forde, T. L., Orsel, K., Zadoks, R. N., Biek, R., Adams, L. G., Checkley, S. L., et al. (2016). Bacterial genomics reveal the complex epidemiology of an emerging pathogen in arctic and boreal ungulates. Front. Microbiol. 7:1759. doi: 10.3389/fmicb.2016.01759
Government of British Columbia (2014). Addressing Cumulative effects in Natural Resource Decision-Making: A Framework for Success. 13. Available online at: www.gov.bc.ca/assets/gov/environment/natural-resource-stewardship/cumulative-effects/overview_report_addressing_cumulative_effects.pdf (accessed August 10, 2018).
Government of British Columbia (2015). Boreal Caribou. Available online at: https://www2.gov.bc.ca/gov/content/environment/plants-animals-ecosystems/wildlife/wildlife-conservation/caribou/boreal-caribou (accessed August 1, 2018).
Government of Canada (2012). Boreal Ecosystem Anthropogenic Disturbance Vector Data for Canada Based on 2008 to 2010 Landsat Imagery. Available online at: https://open.canada.ca/data/en/dataset/afd0ce47-17c3-445c-b823-2f86409da2e0 (accessed January 26, 2019).
Government of Canada (2018). Species at Risk Public Registry. Available online at: https://www.registrelep-sararegistry.gc.ca/default.asp?lang=En&n=F9E5752E-1&offset=6 (accessed September 25, 2019).
Hansen, M. C., Potapov, P. V., Moore, R., Hancher, M., Turubanova, S. A., Tyukavina, S. A., et al. (2013). High-resolution global maps of 21st-century forest cover change. Science 342, 850–853. doi: 10.1126/science.1244693
Hebblewhite, M. (2017). Billion dollar boreal woodland caribou and the biodiversity impacts of the global oil and gas industry. Biol. Cons. 206, 102–111. doi: 10.1016/j.biocon.2016.12.014
Hervieux, D., Hebbelwhite, M., Stepinsky, D., Bacon, S., and Boutin, S. (2014). Managing wolves (Canis lupus) to recover threatened woodland caribou (Rangifer tarandus caribou) in Alberta. Can. J. Zool. 92, 1029–1037. doi: 10.1139/cjz-2014-0142
Hostetler, J. A., and Chandler, R. B. (2015). Improved state-space models for inference about spatial and temporal variation in abundance from count data. Ecology 96, 173–1723. doi: 10.1890/14-1487.1
International Council for Exploration of the Sea (2014). Report of the Joint Rijkswaterstaat/DFO/ICES Workshop: Risk Assessment for Spatial Management (WKRASM, 24–28 February 2014, Amsterdam, the Netherlands. 35. Available online at: http://ices.dk/sites/pub/Publication%20Reports/Expert%20Group%20Report/SSGHIE/2014/WKRASM2014.pdf (accessed August 10, 2018).
Johnson, C. J., Ehlers, L. P. W., and Seip, D. R. (2015). Witnessing extinction–cumulative impacts across landscapes and the future loss of an evolutionarily significant unit of woodland caribou in Canada. Biol. Cons. 186, 176–186. doi: 10.1016/j.biocon.2015.03.012
Johnson, C. J., Mumma, M. A., and St-Laurent, M. H. (2019). Modelling multispecies predator-prey dynamics: predicting the outcomes of conservation actions for woodland caribou. Ecosphere. 10:e02622. doi: 10.1002/ecs2.2622
Joly, K., Jandt, R. R., and Klein, D. R. (2009). Decrease of lichens in Arctic ecosystems: the role of wildfire, caribou, reindeer, competition and climate in north-western Alaska. Polar Res. 28, 433–442. doi: 10.1111/j.1751-8369.2009.00113.x
Judd, A. D., Backhaus, T., and Goodsir, F. (2015). An effective set of principles for practical implementation of marine cumulative effects assessment. Env. Sci. Policy 54, 254–262. doi: 10.1016/j.envsci.2015.07.008
Kishchuk, B. E., Creed, I. F., Laurent, K. L., Nebel, S., Kreutzweiser, D., Venier, L., and Webster, K. (2018). Assessing the ecological sustainability of a forest management system using the ISO Bowtie Risk Management Assessment Tool. For. Chron. 94, 25–34. doi: 10.5558/tfc2018-005
Kline, R. B. (2015). Principles and Practice of Structural Equation Modeling. 4th edn. New York, NY: Guilford Publications.
Koornneef, J., Spruijt, M., Molag, M., Ramírez, A., Turkenburg, W., and Faaij, A. (2010). Quantitative risk assessment of CO2 transport by pipelines: A review of uncertainties and their impacts. J. Haz. Mat. 177, 12–27. doi: 10.1016/j.jhazmat.2009.11.068
Latham, A. D. M., Latham, M. C., McCutchen, N. A., and Boutin, S. (2011). Invading white-tailed deer change wolf–caribou dynamics in northeastern Alberta. J. Wildlife Manag. 75, 204–212. doi: 10.1002/jwmg.28
Luo, Y., Chen, H., McIntire, E., and Andison, D. (2018). Divergent temporal trends of net biomass change in western Canadian boreal forests. J. Ecol.107, 69–78. doi: 10.1111/1365-2745.13033
Molau, U., and Alatalo, J. M. (1998). Responses of subarctic–alpine plant communities to simulated environmental change: biodiversity of bryophytes, lichens, and vascular plants. Ambio 27, 322–329.
Mowat, G., and Heard, D. C. (2006). Major components of grizzly bear diet across North America. Can. J. Zool. 84, 473–489. doi: 10.1139/z06-016
Naugle, D. (2010). Energy Development & Wildlife Conservation in Western North America. New York, NY: Island Press. doi: 10.5822/978-1-61091-022-4
Pedlar, J. H., McKenney, D. W., Aubin, I., Beardmore, T., Beaulieu, J., Iverson, L., et al. (2012). Placing forestry in the assisted migration debate. BioSci. 62, 835–842. doi: 10.1525/bio.2012.62.9.10
Periera, J. C., Lima, G. B. A., and Santanna, A. P. (2015). A bow-tie based risk framework integrated with a Bayesian belief network applied to the probablistic risk analysis. Brazil. J. Op. Prod. Man. 12, 350–359. doi: 10.14488/BJOPM.2015.v12.n2.a14
Price, D. T., Alfaro, R. I., Brown, K. J., Flannigan, M. D., Fleming, R. A., Hogg, E. H., et al. (2013). Anticipating the consequences of climate change for Canada's boreal forest ecosystems. Env. Rev. 21, 322–365. doi: 10.1139/er-2013-0042
Pyper, M., Nishi, J., and McNeil, L. (2014). Linear Feature Restoration in Caribou Habitat: a Summary of Current Practices and a Roadmap for Future Programs. Technical Report. Fuse Consulting, Ltd., Spruce Grove, AB, Canada.
R Foundation for Statistical Computing (2019). R: A Language and Environment for Statistical Computing. Vienna: R Core Team.
Schaefer, J. A. (2003). Long-term range recession and the persistence of caribou in the taiga. Cons. Biol. 17, 1435–1439. doi: 10.1046/j.1523-1739.2003.02288.x
Schneider, R. R., Hauer, G., and Boutin, S. (2010). Triage for conserving populations of threatened species: the case of woodland caribou in Alberta. Bio. Cons. 143, 1603–1611. doi: 10.1016/j.biocon.2010.04.002
Schwantje, H., Macbeth, B., Kutz, S., and Elkin, B. (2016). British Columbia Boreal Caribou Health Program, Progress Report: Year 2 (February 1, 2015–March 31, 2016) (British Columbia Boreal Caribou Health Research Program Working Group). 49. Available online at http://www.bcogris.ca/sites/default/files/bcip-2014-05-boreal-caribou-health-study-final-report-year-2.pdf (accessed January 26, 2019).
Seip, D. R. (1992). Factors limiting woodland caribou populations and their interrelationships with wolves and moose in southeastern British Columbia. Can. J. Zool. 70, 1495–1503. doi: 10.1139/z92-206
Serrouya, R., Dickie, M., DeMars, C., Witman, M. J., and Boutin, S. (2020). Predicting the effects of restoring linear features on woodland caribou populations. Ecol. Model. 416:108891. doi: 10.1016/j.ecolmodel.2019.108891
Serrouya, R., Seip, D. R., Hervieux, D., McLellan, B. N., McNay, R. S., Steenweg, R., et al. (2019). Saving endangered species using adaptive management. PNAS 116, 6181–6186.
Shackelford, N., Standish, R. J., Ripple, W., and Starzomski, B. M. (2018). Threats to biodiversity from cumulative human impacts in one of North America's last wildlife frontiers. Cons. Biol. 32, 672–684. doi: 10.1111/cobi.13036
Sinclair, A. J., Doelle, M., and Duinker, P. N. (2017). Looking up, down, and sideways: Reconceiving cumulative effects assessment as a mindset. Environ. Impact Assess. Rev. 62, 183–194. doi: 10.1016/j.eiar.2016.04.007
Ste-Marie, C., Nelson, E. A., Dabros, A., and Bonneau, M.-E. (2011). Assisted migration: Introduction to a multifaceted concept. For. Chron. 87, 724–730. doi: 10.5558/tfc2011-089
Stewart, F. E. C., Fisher, J. T., Burton, A. C., and Volpe, J. P. (2018). Species occurrence data reflect the magnitude of animal movements better than the proximity of animal space use. Ecosphere 9:2112. doi: 10.1002/ecs2.2112
Stewart, F. E. C., Volpe, J. P., Eaton, B., Hood, G. A., Vujnovic, D., and Fisher, J. T. (2019). Protected areas alone rarely predict mammal biodiversity across spatial scales in an Albertan working landscape. Biol. Cons. 240:108252. doi: 10.1016/j.biocon.2019.108252
Tatersall, E. R., Burgar, J. M., Fisher, J. T., and Burton, A. C. (2020). Mammal seismic line use varies with restoration: applying habitat restoration to species at risk conservation in a working landscape. Biol. Conserv. doi: 10.1016/j.biocon.2019.108295
Theberge, J. B. (1990). Potentials for misinterpreting impacts of wolf predation through prey: predator ratios. Wildlife Soc. Bull. 18, 188–192.
Timoney, K. P. (2003). The changing disturbance regime of the boreal forest of the Canadian Prairie Provinces. For. Chron. 79, 502–516. doi: 10.5558/tfc79502-3
Venier, L. A., Thompson, I. D., Fleming, R., Malcolm, J., Aubin, I., Trofymow, J. A., et al. (2014). Effects of natural resource development on the terrestrial biodiversity of Canadian boreal forests. Env. Rev. 22, 457–490. doi: 10.1139/er-2013-0075
Vistens, I., and Nelleman, C. (2008). The matter of spatial and temporal scales: a review of reindeer and caribou response to human activity. Polar Biol. 31, 399–407. doi: 10.1007/s00300-007-0377-9
Vors, L. S., and Boyce, M. S. (2009). Global declines of caribou and reindeer. Glob. Change Biol. 15, 2626–2633. doi: 10.1111/j.1365-2486.2009.01974.x
White, J. C., Wulder, M. A., Hermosilla, T., Coops, N. C., and Hobart, G. (2017). A nationwide annual characterization of 25 years of forest disturbance and recovery for Canada using Landsat time series. Rem. Sens. Env. 194, 303–321. doi: 10.1016/j.rse.2017.03.035
Wilson, K. S., Pond, B. A., Brown, G. S., and Schaefer, J. A. (2019). The biogeography of hame range size of woodland caribou Rangifer tarandus caribou. Div. Distr. 25, 205–216. doi: 10.1111/ddi.12849
Winder, R. S., Nelson, E. A., and Beardmore, T. (2011). Ecological implications for assisted migration in Canadian forests. For. Chron. 87, 731–744. doi: 10.5558/tfc2011-090
Keywords: Rangifer tarandus, policy, conservation, risk, landscape, decision support
Citation: Winder R, Stewart FEC, Nebel S, McIntire EJB, Dyk A and Omendja K (2020) Cumulative Effects and Boreal Woodland Caribou: How Bow-Tie Risk Analysis Addresses a Critical Issue in Canada's Forested Landscapes. Front. Ecol. Evol. 8:1. doi: 10.3389/fevo.2020.00001
Received: 12 July 2019; Accepted: 03 January 2020;
Published: 04 February 2020.
Edited by:
Michael L. Morrison, Texas A&M University, United StatesReviewed by:
David Thomas Price, Natural Resources Canada, CanadaKenneth Shawn Smallwood, Independent Researcher, Davis, United States
Copyright © 2020 Winder, Stewart, Nebel, McIntire, Dyk and Omendja. This is an open-access article distributed under the terms of the Creative Commons Attribution License (CC BY). The use, distribution or reproduction in other forums is permitted, provided the original author(s) and the copyright owner(s) are credited and that the original publication in this journal is cited, in accordance with accepted academic practice. No use, distribution or reproduction is permitted which does not comply with these terms.
*Correspondence: Richard Winder, Richard.Winder@canada.ca