Remote sensing time series analysis for crop monitoring with the SPIRITS software: new functionalities and use examples
 Felix Rembold1*
  Michele Meroni1
  Ferdinando Urbano1
  Antoine Royer1
  Clement Atzberger2
  Guido Lemoine1 Herman Eerens3 Dominique Haesen3
- 1Joint Research Centre, European Commission, Institute for Environment and Sustainability, Ispra, Italy
- 2Department of Landscape, Spatial and Infrastructure Sciences, University of Natural Resources and Life Sciences, Vienna, Austria
- 3Vlaamse Instelling voor Technologisch Onderzoek, Mol, Belgium
Monitoring crop and natural vegetation conditions is highly relevant, particularly in the food insecure areas of the world. Data from remote sensing image time series at high temporal and medium to low spatial resolution can assist this monitoring as they provide key information about vegetation status in near real-time over large areas. The Software for the Processing and Interpretation of Remotely sensed Image Time Series (SPIRITS) is a stand-alone flexible analysis environment created to facilitate the processing and analysis of large image time series and ultimately for providing clear information about vegetation status in various graphical formats to crop production analysts and decision makers. In this paper we present the latest functional developments of SPIRITS and we illustrate recent applications. The main new developments include: HDF5 importer, Image re-projection, additional options for temporal Smoothing and Periodicity conversion, computation of a rainfall-based probability index (Standardized Precipitation Index) for drought detection and extension of the Graph composer functionalities. The examples of operational analyses are taken from several recent agriculture and food security monitoring reports and bulletins. We conclude with considerations on future SPIRITS developments also in view of the data processing requirements imposed by the coming generation of remote sensing products at high spatial and temporal resolution, such as those provided by the Sentinel sensors of the European Copernicus programme.
Introduction
For many years, agricultural monitoring systems have been using remote sensing instruments to provide timely and synoptic information about seasonal vegetation development. At national and regional level, remote sensing can be highly helpful in the early detection of crop stress during the growing season and in forecasting the final yield (e.g., Meroni et al., 2013; Newlands et al., 2014; Lopez-Lozano et al., 2015). Satellite products used for these purposes mostly refer to vegetation indices (e.g., the Normalized Difference Vegetation Index, NDVI) and biophysical variables (e.g., the Fraction of Absorbed Photosynthetically Active Radiation, FAPAR; the Leaf Area Index, LAI). The mentioned vegetation indices and biophysical variables are mainly derived from space measurements in the visible to near infrared reflected domain (Rembold et al., 2013). The thermal domain is also exploited for vegetation monitoring as it is used to estimate for example rainfall (e.g., Tarnavsky et al., 2014) or, in conjunction with other meteorological variables, the evapotranspiration (for a review see Petropoulos et al., 2009). In order to draw conclusions about the development of crops during an ongoing growing season, such key variables are analyzed in near real-time and often compared with reference years (for instance, a past year known for having had abundant or poor crop production) or with their historical average (here referred to as the Long Term Average, LTA). Globally, a number of operational systems have implemented such type of analysis as recently reviewed in Rembold et al. (2013) and Atzberger (2013). Index-based crop insurance schemes also rely on such data (de Leeuw et al., 2014).
The use of remote sensing time series for crop and vegetation monitoring typically requires a number of processing steps that include the temporal smoothing of the cloud-affected remote sensing signal, the computation of LTA and associated variability, the computation of anomalies, the detection of plant phenology and the classification of the productivity level on the basis of seasonal performances. Furthermore, the production of a crop monitoring bulletin (i.e., a report intended to illustrate the current agronomic situation to decision makers and non-specialists in general) summarizing all the information gathered from the analysis of the mentioned derived products, requires additional post-processing steps. These include for example the computation of statistics aggregated by administrative unit and by land cover class, and the generation of maps and graphs showing spatial patterns and temporal evolutions of relevant indicators (Massart et al., 2010).
The various graphical outputs are usually generated at different levels of spatial aggregation (typically at the national and regional levels) for a large number of spatial units of interest and updated frequently whenever a new remote sensing observation is made available. Thus, there is a clear need to automatize the whole processing chain. Many of the single processing steps can be implemented in various free software like for example ILWIS (http://www.ilwis.org) or TIMESAT (Jönsson and Eklundh, 2004), or can be coded in any programming language. However, no existing software offers a user-friendly environment to support the whole time series processing chain typically needed for crop monitoring analysis. This gap is the reason that led to the development of SPIRITS (Software for the Processing and Interpretation of Remotely sensed Image Time Series; http://spirits.jrc.ec.europa.eu/; Eerens et al., 2014).
In this paper we briefly summarize the SPIRITS architecture and main functionalities, and then we present the latest functional developments of the software. The most commonly used functionalities of the software are illustrated with real case examples. In particular we focus on the time series analysis performed for the production of an agricultural drought monitoring bulletin in Angola (Rembold et al., 2014) as well as on a number of additional analysis and visualization products used in recently released crop monitoring and food security reports. We then conclude with considerations on future SPIRITS developments also in view of the data processing requirements imposed by the coming generation of remote sensing products at high spatial and temporal resolution such as those provided by the Sentinel sensors of the European Copernicus programme (www.copernicus.eu).
Main SPIRITS Functionalities
SPIRITS is a stand-alone toolbox for environmental monitoring that provides a collection of useful routines for image time series analysis in one package accessible through a graphical user interface (GUI). It is designed to produce clear and evidence-based information for crop production analysts and decision makers. The software has been developed by the Flemish Institute for Technological Research (VITO) and the Joint Research Centre (JRC) of the European Commission. A detailed description is provided in Eerens et al. (2014). The software is extensively documented and distributed freely for non-commercial use, which is especially important in developing countries where free software can provide an important contribution to capacity building for local institutions.
SPIRITS has been developed for the monitoring of vegetation conditions with medium to low resolution satellite image time series, but many of the tools can also be applied to other types of raster data and application domains (e.g., forest and habitat monitoring). In its prevalent use in crop monitoring, common input data are surface reflectances, vegetation indices (e.g., NDVI) or biophysical parameters (e.g., FAPAR and Dry Matter Productivity, DMP). Also gridded meteorological data derived from atmospheric circulation models (e.g., European Centre for Medium-Range Weather Forecasts—ECMWF) or from geostationary satellites (e.g., METEOSAT) are typically processed.
The software runs under Microsoft Windows and is based on a GUI developed in Java. The GUI makes extensive use of the GLIMPSE (GLobal IMage Processing SoftwarE) library (Eerens et al., 2014), developed by VITO, to perform the processing in the background. This library consists of a set of ANSI-C executables for a wide range of dedicated image processing tasks. In addition, over the years, SPIRITS was extended with many other modules enabling, for example, the import of imagery in external formats, the generation of maps and the extraction of regional databases. The software also makes use of open source libraries such as GDAL (http://www.gdal.org/), FWTools (http://fwtools.maptools.org/) and HSQLDB (http://hsqldb.org/), which are included in the current SPIRITS distribution package.
The main program modules can be grouped in the following functional classes: import/export to external data sources, processing, and analysis tools. The processing tools can be further categorized into: spatial operations, thematic operations, and temporal operations (Table 1).
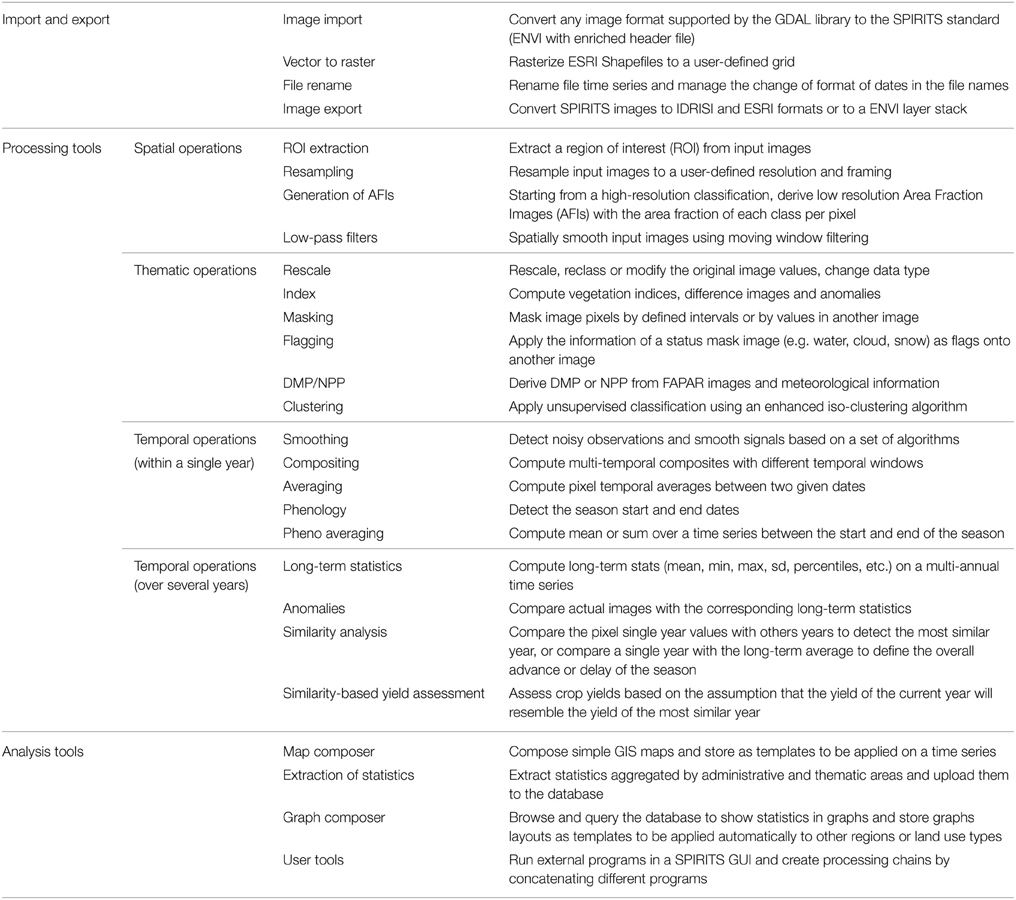
Table 1. Main SPIRITS functionalities according to the SPIRITS program menu.
More specifically, spatial operations include the extraction of a region of interest (ROI extraction) from a larger imagery, spatial Resampling, and Generation of area fraction images (i.e., percent cover of a land cover class within a coarser resolution pixel). Thematic operations include Rescaling, Vegetation indices computation, Masking, Flagging, Clustering, and computation of Dry matter productivity from FAPAR and meteorological information. Temporal operations can be further subdivided into those working on any arbitrary time period (temporal Smoothing, Compositing, Averaging, Phenology extraction, Phenology-based averaging), and those requiring an archive composed of multiple years (computation of Long term statistics and Anomalies, Similarity analysis and Similarity-based yield assessment). Finally, the analysis tool can be used to produce and visualize the graphical outputs needed by the analyst for the evaluation of the crop status. This set of tools includes the Map composer to customize the graphical layout used to automatically generate time series of maps, the Database manager to configure the internal database and to upload the desired statistics (e.g., the mean values per region and land cover type), the Graph composer to customize the content and graphical layout used to automatically produce a set of graphs based on the database content. In addition, any external functions or executable programs can be integrated into SPIRITS processing chain by using the User tool. More information of the SPIRITS functionalities can be found in Eerens et al. (2014), on the SPIRITS web site (http://spirits.jrc.ec.europa.eu/) and in the software manual.
Although most of these functionalities can be also be found in other software or can be reproduced by linking different packages, SPIRITS offers a number of unique features like for example: the availability of all functionalities in one single environment, a high degree of customization flexibility of each function, and the optimized processing flow for rapid time-series and multiple spatial entities analysis. The latter point is particularly important in crop monitoring as it permits the user to first set and tune a given operation on one image. This setting is then applied in a loop on the whole time series and/or to a set of different spatial entities and can easily be repeated every time new data becomes available.
Recent SPIRITS Developments
After the official presentation of SPIRITS at the GSDI conference in Addis Ababa in November 2013, the users' community has been rapidly growing and increasingly providing feedback about possible improvements beyond the main functionalities summarized in the previous sections. As a result of this interaction with users and developers, new versions, including the upgrades described below, are periodically released. The latest available version is dated in March 2015 (version 1.3.0) and is available at http://spirits.jrc.ec.europa.eu. This section provides a detailed list of the new developments included in version 1.3.0.
HDF5 Format Image Import
The HDF5 (Hierarchical Data Format) file format is designed to efficiently store and organize large amounts of numerical data, including satellite images. It is already used for a number of remote sensing data sources (e.g., Meteosat Second Generation, SPOT-VEGETATION and Proba-V provided through the Copernicus program) and will likely be adopted by other sensors. The HDF5 importer makes use of HDF (http://www.hdfgroup.org/) and GDAL (http://www.gdal.org/) libraries for inspecting data and attributes and converting HDF5 imagery into SPIRITS format. This tool allows a large set of current and future data sources to be easily integrated into the SPIRITS processing chain.
Re-projection
The new Image re-projection tool, based on the GDAL library, allows, in conjunction with the resampling tool, to convert SPIRITS images and vector files from and to a large set of spatial reference systems and resolutions, increasing the flexibility of the software in image processing and vector rasterization.
Image Time Series Smoothing
Temporal image smoothing is a large research area in the time series processing domain and many new algorithms are developed and tested every year. Among these, the Whittaker smoother recently received broader attention within the remote sensing community (Atzberger and Eilers, 2011; Atkinson et al., 2012). This algorithm does not assume periodicity and is based on penalized least squares. In the SPIRITS implementation (Smoothing module), two user-defined parameters control the smoothness of the output time series: the number of iterations and the parameter k, referred to as the smoothing parameter. The user can also select an “upper envelope adaptation” with which the smoothing is iteratively applied to fit the “upper envelope” of the time series under the assumption that atmospheric perturbations result in sudden drops of the vegetation index (Beck et al., 2006). At the first iteration the original time series is smoothed. At each subsequent iteration, the smoothing algorithm is applied to an updated time series where all observed values that are smaller than the curve fitted in the previous iteration are replaced by their fitted values.
This new algorithm complements those already available in SPIRITS: simple interpolation, BISE (Best Index Slope Extraction) adapted from Viovy et al. (1992), and Swets (modified weighted least square regression) adapted from Swets et al. (1999) by Klisch et al. (2006). The application of different smoothing algorithms on noisy (raw) NDVI time series is exemplified in Figure 1.
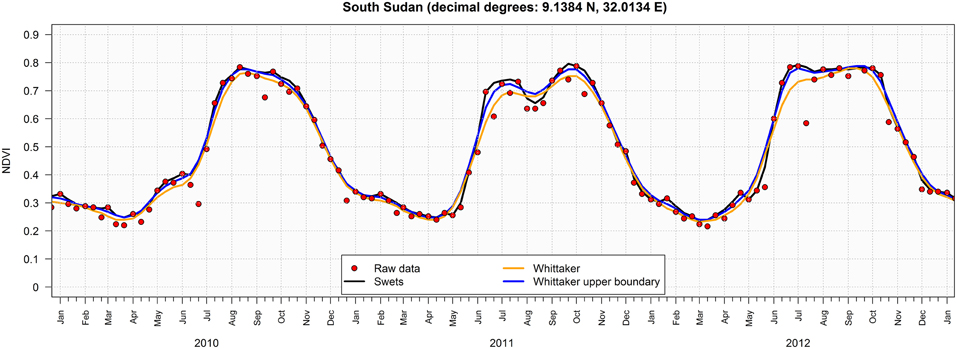
Figure 1. Example of SPOT-VEGTATION NDVI temporal profile of a pixel showing a distinct annual seasonality over the years 2010–2012: raw (red dots), smoothed with the Swets (black line), Whittaker (yellow line), and Whittaker adapted to upper envelope (blue line). Default values have been used for the Swets (5 dekads moving window, see SPIRITS manual for other weights) and Whittaker (second order difference, k = 1, 3 iterations) algorithms.
Image Time Series Periodicity Conversion
SPIRITS works with a fixed set of input image periodicity, namely: daily, 10-daily, monthly and annual images. This was recognized as a limiting factor in the possibility to integrate data from other potential data sources, such as for example the MODIS 250 m resolution 16-days vegetation index global imagery (MOD13Q1 and MYD13Q1 products), one of the most widely used data set for crop and vegetation monitoring. It is now possible to overcome this limitation thanks to the new module Periodicity conversion that converts images (of vegetation indices and biophysical variables) of any input frequency into daily, ten-daily, or monthly time series. For this purpose, the input images are transformed to the SPIRITS standard periodicities by the use of a temporal smoothing (see previous section). The transformed data can then be processed with any other SPIRITS modules.
The example in Figure 2 illustrates the transformation from the native 16-day periodicity of the MODIS NDVI product (MOD13Q1) to the typical 10-day periodicity used in SPIRITS with the Periodicity conversion tool.
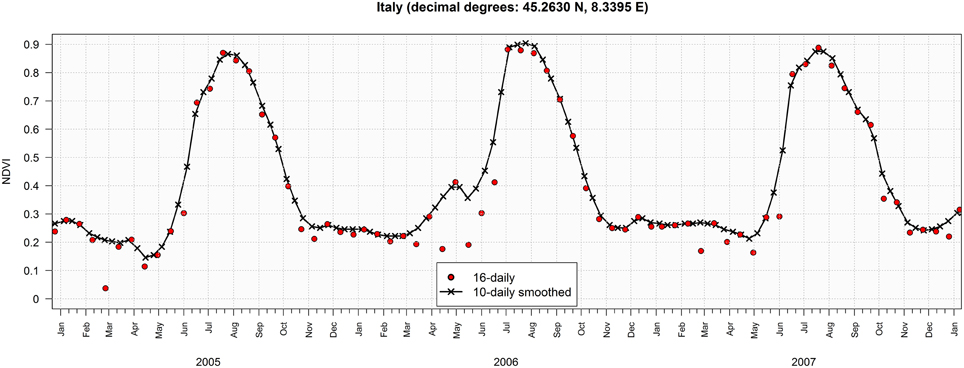
Figure 2. Example of the results of the Periodicity conversion module (from 16- to 10-day composite) using the Swets smoothing algorithm applied to a 16-day MODIS NDVI (product MOD13Q1) temporal profile for a single pixel in central Italy over the years 2005–2007.
Standardized Precipitation Index
The first official SPIRITS release (version 1.1.1) included the possibility to compute 14 different types of image anomalies, including many of the most used for early warning and drought monitoring (e.g., simple and percent difference with historical mean, simple and percent difference with previous year, percentiles). However, such anomalies are mainly intended for the use with remote sensing indicators of vegetation biomass and status (typically NDVI and FAPAR). Rainfall estimates exhibit a different statistical data distribution compared to vegetation indices and this has to be taken into account in the computation of anomaly indicators. Therefore, in order to address the needs of drought monitoring, the possibility to calculate the commonly used Standardized Precipitation Index (SPI; WMO, 2012) was included in the latest SPIRITS release.
The SPI expresses the probability of the observed cumulative rainfall for any time scale. The frequency distribution of historic rainfall data for a given pixel is first fitted to a gamma distribution which is then transformed into a normal distribution with mean of 0 and standard deviation of 1 so that the SPI, expressed as the Z-score of the observed rainfall, can be computed. The SPI can be computed with rainfall cumulative values for different time periods—from 1 to 48 months depending on the application.
Upgrade of the SPIRITS Graph Viewer Operations
The SPIRITS Graph composer allows browsing and displaying the aggregated statistics extracted from imagery and loaded in the internal database. The viewer is typically used by the analysts to inspect the temporal variability over the crop season of relevant variables (e.g., NDVI and rainfall) for a defined spatial entity (e.g., an administrative unit) and land cover class (e.g., cropland). Once the user customizes the preferred parameters (variables, statistics, time range, and supplementary information), the layout can be automatically applied to all spatial entities and classes of interest, saving the output graphs as Portable Network Graphic (PNG) graphic files. At the same time, graphic titles (e.g., region name) are automatically adapted as well as the PNG file names.
In the SPIRITS releases prior to version 1.3.0, the Graph composer already included a set of operations to compute and plot on-the-fly statistics derived from the data loaded in the graph, for example the LTA. Other on-the-fly operations included the minimum and maximum at each time step composing the series, and anomalies such as the simple and relative difference anomalies as compared to the previous year, the LTA and the so called “historical average” (LTA that excludes the year under consideration from the computation of the statistics). These operations have now been extended to include the long term standard deviation, the historical standard deviation (excluding the target year), and the corresponding standard scores. In addition, a large number of minor changes increased the functionalities and flexibility of the Graphic composer as for example the addition of bars to points and lines, improving the readability of graphs where multiple variables are plotted together.
Finally, a new way to visualize statistical data stored in the SPIRITS database was introduced: the Matrix chart. In this graphic form, the target dataset is displayed as a table where cell value is represented by means of a color map. The table rows (Y-axis) represent the years whereas the columns (X-axis) represent the time within the year (i.e., dekads or months). This results in a synoptic view of the inter- and intra-annual variability facilitating comparisons and visual identification of specific temporal patterns (see Figure 9).
Examples of Recent Operational Crop and Drought Monitoring with Spirits
Effective crop monitoring systems providing timely information at both the national and regional scale are particularly necessary in arid and semi-arid countries, where temporal and geographic rainfall variability leads to high inter-annual fluctuations in primary production and to a high risk of food and feed shortage. In general, crop monitoring analysis at the regional and national scale is based on the comparison of the actual crop status to previous seasons or to what can be assumed to be the average or “normal” situation (Rembold et al., 2013). Detected anomalies are then used to draw conclusions on possible yield limitations.
In this section we highlight some of the key results of various analysis performed using the SPIRITS software during year 2014. These operational case studies are provided here as examples of the use SPIRITS processing tool, maps and graphs for drought and crop monitoring.
As compared to climatological data, year 2014 did not present major droughts for most African countries (FAO-GIEWS, 2014a). Nevertheless, regular crop monitoring with SPIRITS detected dry conditions with limited spatial extent and provided relevant information throughout the year for a number of cases, for example in Angola, Kenya, Somalia, and Ethiopia.
Simple difference NDVI anomaly maps form the SPOT-VEGETATION (VGT) satellite for Angola in January and February 2014 (Figures 3A,B, respectively) show for example that vegetation development was generally above average for large parts of the country, while specific areas, including croplands, along the coast and in the South West were affected by drought in early 2014.
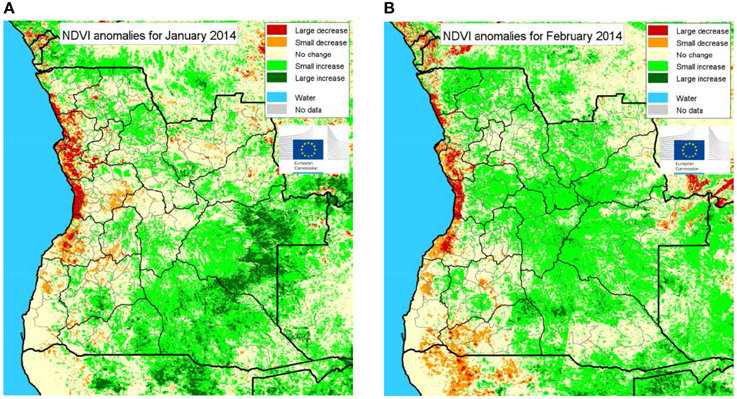
Figure 3. SPIRITS difference SPOT-VGT NDVI anomaly maps for January (A) and February 2014 (B) over Angola. NDVI anomaly values have been classified into five classes from large decrease to large increase, relative to the Long Term Average, according to the following NDVI anomaly thresholds: −0.125, −0.05, 0.05, 0.125.
Similar maps can also be derived from rainfall estimates as shown in Figure 4 (based on TAMSAT data, Tarnavsky et al., 2014). In February a tropical storm in the Mozambique channel had pushed humid air masses northwards, causing anomalous rains in large parts of Tanzania and Kenya which is clearly visible in the anomaly maps of February and to some extent March (Figures 4A,B, respectively). After that, rainfall estimate anomalies show dry conditions in April (Figure 4C), the time at which the main rainy season usually starts in the eastern part of the Horn of Africa.
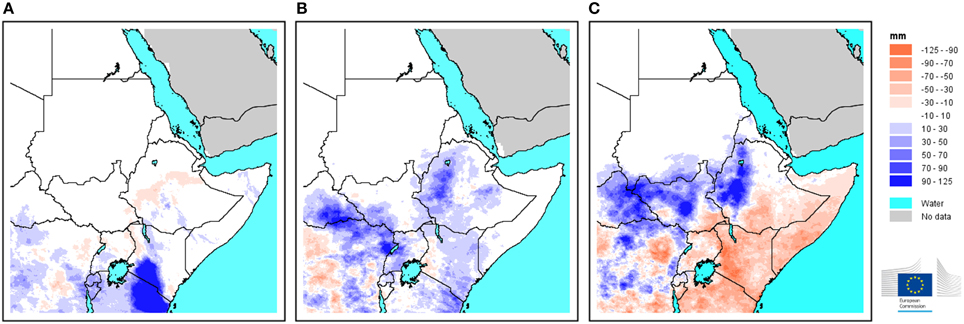
Figure 4. SPIRITS difference anomaly maps derived from TAMSAT rainfall estimates over East Africa. Anomalies of monthly rainfall for the months of February, March, and April 2014 in the (A–C) panels, respectively.
The effect of such delayed rainfalls (main driver of vegetation development in this area) are then visible in the timing of vegetation onset for crops and pasture in the same region. For this purpose, the SPIRITS Phenology module permits to express the current date as the progress of the current season, i.e., the percentage of the average duration of the growing season. For the two crop seasons typical of most of the Horn of Africa, this progress (until the second dekad of May) is shown in Figure 5A. This is fundamental information for the analyst that has to assess the impact of an observed anomaly. In fact, a negative anomaly when the season has not yet started or is in its very initial stage should not be interpreted as the same anomaly happening in a later stage of the season. The anomaly of the 2014 timing of the start of the season as compared to the average timing is shown in Figure 5B. The figure shows the delay of the start of the season in particular for the rangeland areas in Central Somalia and in Southern Ethiopia, while crop areas in Kenya and western Ethiopia generally had an early start due to the abundant rainfall in February and March (FAO-GIEWS, 2014b). Analysts typically exploit this convergence of evidence from independent sources (in this case rainfall estimates and NDVI-derived phenology) to evaluate the degree of confidence they can attribute to their analysis.
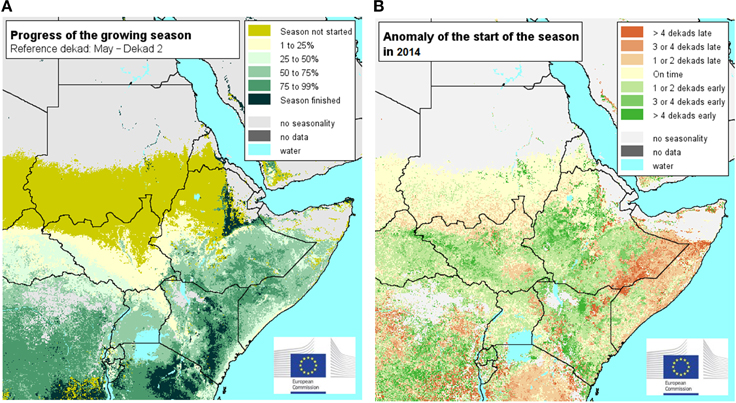
Figure 5. Example maps for the Horn of Africa derived from SPIRITS Phenology module and using SPOT-VGT NDVI time series as input. (A) Progress of the average season development expressed in percentage of the total season length; (B) anomaly of the start of the current growing season (as by the second dekad of May) expressed as number of dekads of delay/advance with respect to average.
In addition to analyzing anomaly images for qualitative crop growth monitoring, useful information can be derived from temporal profiles of vegetation indices aggregated over spatial entities of interest such as administrative areas. Differently from anomaly images that highlight spatial patterns but capture only a snapshot of vegetation development, seasonal profiles reveal the temporal evolution of the variable of interest, allowing a full overview of the growing season development. In SPIRITS these temporal profiles are extracted by: (i) averaging all pixel values inside a desired spatial entity (typically an administrative area), or (ii) averaging values only for cropland pixels (or rangeland, or any thematic class of interest) within the spatial entity. For the latter extraction, a mask of the desired thematic class must be available. The profiles give a complete picture of the vegetation development during the seasonal cycle, and can be compared with other crop seasons (for example the previous ones) and the long term average profiles. Several approaches have been elaborated for extracting “crop specific” temporal signatures from the low resolution pixel that may contain multiple land covers (so-called “mixed pixel”) (Busetto et al., 2008; Atzberger et al., 2014). A simple and widely used approach is the crop-specific NDVI (CNDVI) method (Genovese et al., 2001). The approach adds proportional weights to the NDVI pixel values based on the fractional coverage of crop area within each low resolution pixel. It obviously requires that a crop mask is available at a spatial resolution higher than the one of NDVI.
Examples of seasonal profiles generated by SPIRITS for rainfall estimates and cumulated rainfall taken from the 2014 Angola bulletin are reported in Figure 6 for two administrative regions in the country. In such type of graphics the current precipitation evolution can be comparatively evaluated with respect to three benchmarks: the average conditions for that specific area, and the extremes experienced in the last 30 years (i.e., maximum and minimum cumulative rainfall).
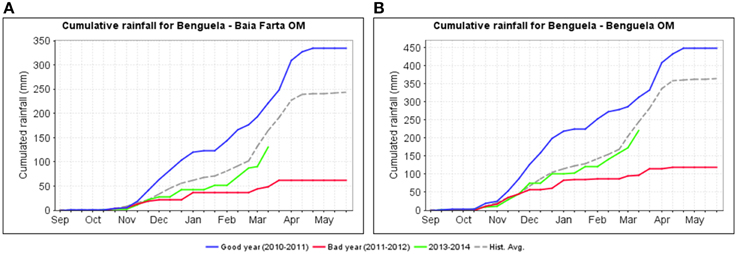
Figure 6. Temporal evolution of cumulative rainfall (source: TAMSAT rainfall estimates) spatially averaged over all pixels within the administrative regions of Baia Farta (A) and Benguela (B), Angola. The graphics depict the temporal evolution of the current season (2013–2014), the historical average (Hist. Avg.), and reference years with the highest and lowest total rainfall (named as “Good year” and “Bad year,” respectively). The historical average is computed over a set of 30 years.
Figures 6A,B indicate a significant negative deviation from normal conditions in the current season rainfalls compared to historical average. Figure 7 shows how to get a complete picture of crop and rangelands conditions in this region thanks to simultaneous analysis of NDVI and rainfall evolution for these two thematic classes. For both cropland and grassland irregular and below average rainfall has characterized the season and resulted in a clearly reduced vegetation development (see the NDVI profile); precipitation in the first dekad of March (latest data available at the time of bulletin preparation) were abundant but probably too late to allow crop recover.
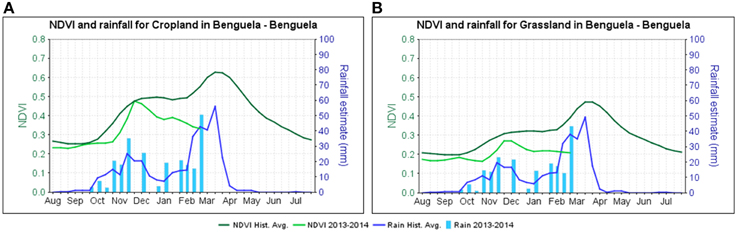
Figure 7. Temporal evolution of SPOT-VGT NDVI and rainfall (TAMSAT) for different land cover classes in the administrative region of Benguela (Angola) up to March 2014: cropland and grassland in (A) and (B), respectively.
The visualization of spatially averaged time series data in SPIRITS with the so-called matrix graph is well suited to highlight and compare temporal patterns over different years (Figure 8). On a single row of the matrix plot, one cell is visualized for each dekad of the year (columns of the matrix). The different years are plotted as rows of the matrix. The color of the cell shows the magnitude of the variable. In this way, in addition to the seasonal variation, one can observe the inter-annual changes for one administrative region and land cover type by comparing the current season to all previous years. The matrix graph in Figure 8 shows the NDVI anomaly corresponding to the temporal profile reported in Figure 7A. From the analysis of the matrix graph it can be concluded for example that the season 2013–2014 was similarly dry to the one of 2011–2012, while 2012–2013 had been a relatively normal season.
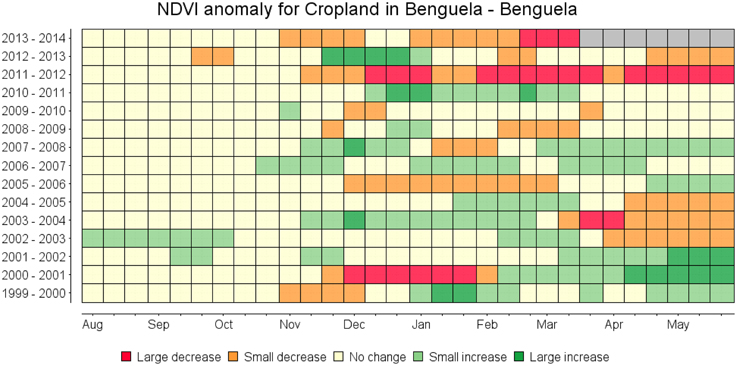
Figure 8. NDVI anomaly matrix graph corresponding to SPOT-VGT NDVI anomaly of Figure 7A. Classes are classified on the base of the intervals of simple difference anomaly reported in Figure 3.
Another interesting example of an operational use of SPIRITS profiles is provided by the National Drought Monitoring Authority (NDMA) of Kenya. NDMA use VCI profiles from filtered and gap-filled MODIS NDVI at 250 m resolution (Klisch et al., 2015). The VCI expresses as percentage the relative position of the observed value (act) of a given pixel (p) with respect to the extreme values (min and max) observed in the historical archive (Kogan, 1995). The weekly VCI data at pixel level are aggregated at the sub-county level and for various time spans for monitoring drought and making available Disaster Contingency Funds (DCF). DCFs are disbursed to affected counties according to pre-defined VCI triggers.
SPIRITS graphs with monthly updates of VCI computed over the previous 3 months are used for monitoring the situation as shown in the example of Figure 9. In this case VCI has been below average nearly for the whole year in 2014 and approaches the historical minimum (as compared to the last 12 years) in February 2015. The 3-monthly VCI entered the stage “slight drought” in October 2014 and degraded further to “extreme drought” conditions in December 2014. Consequently, DCFs were disbursed by NDMA to this county.
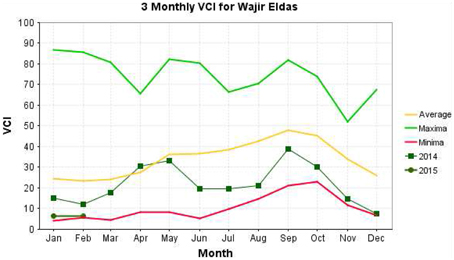
Figure 9. VCI temporal profiles produced using SPIRITS for the Eldas Subcounty (in Wajir County) in Kenya. The 3-monthly VCI is here derived from weekly MODIS NDVI observations at 250 m spatial resolution and using a customized version of the Whittaker smoother as implemented by NDMA.
In addition to observing and studying anomalies, with SPIRITS it is also possible to analyze the potential impact of such anomalies. In fact, a negative NDVI anomaly over an area may have different food security impacts depending on the type and extent of people's activities in the area. It is acknowledged that this kind of impact assessment is a rather complex task to be performed and requires a wealth of diverse sources of information. In fact, specific tools have been developed and currently used for thorough food security analysis (e.g., Integrated Food Security Phase Classification; IPC Global Partners, 2012). Nevertheless, a first insight can be obtained using the information at hand, for example by plotting the percentages of the areas affected by different levels of anomaly severity in order to understand the portion of agricultural land which has been affected, as reported for Koalack Province (Senegal) in Figure 10. In this way we have an additional detail related to the spatial importance of the various levels of anomaly severity. This is a different information from the profiles shown in Figures 7, and 8, where the average spatial value computed over each administrative area can hide for instance a bimodal distribution of the values.
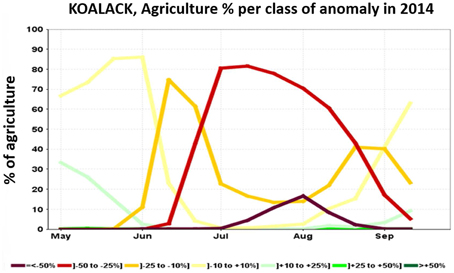
Figure 10. Temporal evolution of the percentage of cropland area experiencing different levels of relative difference severity (SPOT-VGT/Proba-V NDVI from 01 May to 19 September 2014) for the Koalack province, Senegal.
In a similar way one can also compare the anomalies with independent information, such as for example the number of villages affected by an NDVI relative anomaly below-25% (Figure 11). A preliminary raster layer is generated with the number of rural villages per pixel. Then the sum of villages intersecting with the class of anomaly selected (here below −25%) is computed per administrative area.
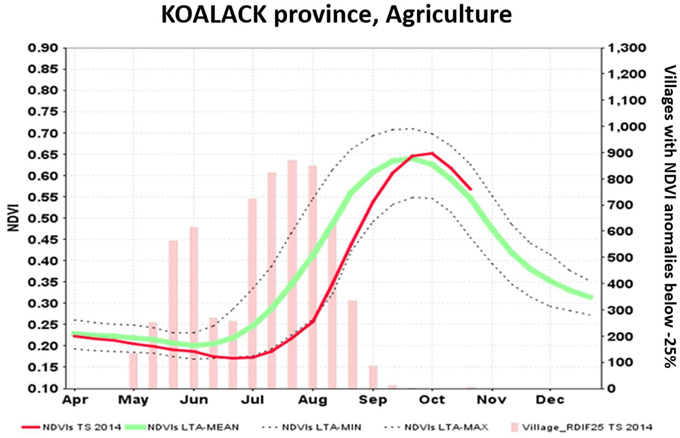
Figure 11. Temporal evolution of SPOT-VGT/Proba-V NDVI for the 2014 season (April–October, 2014) in Koalack province, Senegal. The current profile is plotted together with the LTA and the minimum and maximum profiles (lines). The number of villages experiencing a negative deviation greater than 25% from the LTA is reported as bars.
Future Data Processing Requirements and Spirits Developments
SPIRITS has been developed to answer the specific needs of the agriculture monitoring community, with the objective to support the whole chain of image time series processing steps and the production of synoptic visual analysis outputs in a user-friendly and flexible manner. Since its first release in 2012 the software has evolved into an advanced and comprehensive time series processing tool.
Additional improvements are currently under development and will be included in a new release expected for the end of 2015. The new features foreseen for this release include: automatic production of maps for all administrative units included within a region of interest (currently a time series of maps can be built only with one user-defined region at a time), a generic raster calculator, an improved export function to save the content of the internal database in different formats, functionalities to compare time series of aggregated statistics in scatterplot graphs and simple trend analysis of aggregated statistics. A major direction of development will also be the integration of SPIRITS in larger information systems, for example using PostgreSQL as reference database.
In the longer term SPIRITS, like all other tools for satellite image processing, will face the technical challenges that the upcoming generation of satellite sensors will pose to software developers and data analysts. In fact, the increasing spatial and temporal resolution offered by recent and future satellite systems (e.g., the Sentinel sensors of the European Copernicus programme) will result in a data flow of a much bigger magnitude than what current software is used to deal with and time series processing will no longer be restrained to the medium and low resolution domains. Sensors like Sentinel-2 will provide global time series of optical data with deca-metric spatial resolution every 6–12 days and will enable the derivation of time series of crop specific indicators at high spatial and spectral detail (e.g., red-edge, short-wave infrared differential indices), allowing improved crop mapping and monitoring accuracy. The related processing requirements will pose serious challenges in terms of storage capacity and processing time. Traditional desktop applications for remote sensing analysis like for example ENVI and SPIRITS, or complex workflows integrating a variety of geospatial processing tools (e.g., GDAL, PostGIS, GRASS, QGIS, OpenCV) will still be an effective solution in many operational cases and will probably continue to evolve to cope with the new requirements. Nevertheless, the most promising approach to take full advantage of “Big Data” is expected to be represented by the introduction of cloud-based tools and data repositories.
At least two main directions are emerging for overcoming the constraints imposed by processing power and storage capacity limitations of local applications in the “Big Data” for crop monitoring applications.
The first one is represented by web-based portals offering only processed outputs derived from remote sensing time series with no access to the original data and limited analysis customizability. Some examples of this approach are: the Agricultural Stress Index System of the Food and Agriculture Organization of the United Nations (http://www.fao.org/climatechange/asis/en/), VegScape of the United State Department of Agriculture (https://catalog.data.gov/dataset/vegscape-vegetative-condition-explorer), the time series viewer of VITO (http://tsviewer.vito-eodata.be/), or at national level BOKU's web-service for displaying NDMA data for Kenya (http://ivfl-geomap.boku.ac.at/html/demo_WG/kenya/). Such systems have the advantage of being intuitive and easy to use but their functionalities are mainly limited to the visualization of the results of predefined operations. Hence, these systems are scarcely customizable and lack flexibility in the analysis the user can perform.
The second web-based option is to offer scripting languages and a complete developing environment for user-defined processing chains to be run in the cloud. An example of this innovative approach is Google Earth Engine (https://earthengine.google.org), where very large data sets are managed, stored, and shared in the cloud, with an enormous processing power made available to users and no local resources needed for storage and processing.
SPIRITS' future development could possibly position the tool in between these two paradigms by offering the current GUI as web-based system. By storing the mass of image data on the cloud and providing the necessary processing power, users with sufficiently fast internet connection will perform all the required processing steps on-line and save the desired intermediate results and the final graphical outputs on the local machine. Where or when the internet connection is not available, the user would use the desktop version of the GUI and use the data stored locally.
Finally, it is also important to remind that despite the rapidly increasing availability of higher spatial and temporal resolution data, the analysis at national and regional level will still include spatially and temporally aggregated data, not necessarily requiring the full detail of information available. Moreover, and especially for anomaly detection, the new generation of high resolution Earth Observation satellites do not yet possess the necessary (long) archive and low to medium resolution time series will continue to play an important role. In this sense for example, the Sentinel 3 mission is planned to deliver optical observations at 300 m resolution and will offer continuity to the medium and low resolution data acquisition of SPOT VEGETATION and Proba-V. Within this framework, approaches for working with multiple resolutions like data fusion and aggregation at different spatial and temporal levels will become progressively more relevant.
Conflict of Interest Statement
The authors declare that the research was conducted in the absence of any commercial or financial relationships that could be construed as a potential conflict of interest.
References
Atkinson, P. M., Jeganathan, C., Dash, J., and Atzberger, C. (2012). Inter-comparison of four models for smoothing satellite sensor time-series data to estimate vegetation phenology. Remote Sens. Environ. 123, 400–417. doi: 10.1016/j.rse.2012.04.001
Atzberger, C. (2013). Advances in remote sensing of agriculture: context description, existing operational monitoring systems and major information needs. Remote Sens. 5, 949–981. doi: 10.3390/rs5020949
Atzberger, C., and Eilers, P. H. C. (2011). Evaluating the effectiveness of smoothing algorithms in the absence of ground reference measurements. Int. J. Remote Sens. 32, 3689–3709. doi: 10.1080/01431161003762405
Atzberger, C., Formaggio, A. R., Shimabukuro, Y. E., Udelhoven, T., Mattiuzzi, M., Sanchez, G. A., et al (2014). Obtaining crop-specific time profiles of NDVI: the use of unmixing approaches for serving the continuity between SPOT-VGT and PROBA-V time series. Int. J. Remote Sens. 35, 2615–2638. doi: 10.1080/01431161.2014.883106
Beck, P. S. A., Atzberger, C., Høgda, K. A., Johansen, B., and Skidmore, A. K. (2006). Improved monitoring of vegetation dynamics at very high latitudes: a new method using MODIS NDVI. Remote Sens. Environ. 100, 321–334. doi: 10.1016/j.rse.2005.10.021
Busetto, L., Meroni, M., and Colombo, R. (2008). Combining medium and coarse spatial resolution satellite data to improve the estimation of sub-pixel NDVI time series. Remote Sens. Environ. 112, 118–131. doi: 10.1016/j.rse.2007.04.004
de Leeuw, J., Vrieling, A., Shee, A., Atzberger, C., Hadgu, K. M., Biradar, C. M., et al (2014). The potential and uptake of remote sensing in insurance: a review. Remote Sens. 6, 10888–10912. doi: 10.3390/rs61110888
Eerens, H., Haesen, D., Rembold, F., Urbano, F., Tote, C., and Bydekerke, L. (2014). Image time series processing for agriculture monitoring. Environ. Model. Soft. 53, 154–162. doi: 10.1016/j.envsoft.2013.10.021
FAO-GIEWS. (2014a). Crop Prospects and Food Situation, 2014. Rome: FAO. Available online at: http://www.fao.org/giews/english/cpfs/I4256e/I4256E.html
FAO-GIEWS. (2014b). Greater Horn of Africa: Late and Erratic Rains Raise Serious Concern for Crop and Livestock Production. Rome: FAO. Available online at: www.fao.org/giews/english/shortnews/hof03062014.pdf
Genovese, G., Vignolles, C., Nègre, T., and Passera, G. (2001). A methodology for a combined use of normalised difference vegetation index and CORINE land cover data for crop yield monitoring and forecasting. A case study on Spain. Agronomie 21, 91–111. doi: 10.1051/agro:2001111
IPC Global Partners (2012). Integrated Food Security Phase Classification Technical Manual Version 2.0. Evidence and Standards for Better Food Security Decisions. Rome: FAO.
Jönsson, P., and Eklundh, L. (2004). TIMESAT–a program for analysing time-series of satellite sensor data. Comput. Geosci. 30, 833–845. doi: 10.1016/j.cageo.2004.05.006
Klisch, A., Atzberger, C., and Luminari, L. (2015). “Satellite-based drought monitoring in Kenya in an operational setting,” in 36th International Symposium on Remote Sensing of Environment (ISRSE), Commission VI, WG VI/4 (Berlin).
Klisch, A., Royer, A., Lazar, C., Baruth, B., and Genovese, G. (2006). “Extraction of phenological parameters from temporally smoothed vegetation indices,” in ISPRS Archives XXXVI-8/W48 Workshop Proceedings: Remote Sensing Support to Crop Yield Forecast and Area Estimates. 30th November–1st December 2006 (Stresa).
Kogan, F. N. (1995). Droughts of the late 1980s in the United States as derived from NOAA Polar-Orbiting Satellite data. Bull. Am. Meteorol Soc. 76, 655–668.
Lopez-Lozano, R., Duveiller, G., Seguini, L., Meroni, M., Garcia-Condado, S., Hooker, J., et al (2015). Towards regional grain yield forecasting with 1 km-resolution EO biophysical products: strengths and limitations at pan-European level. Agric. Forest Meteorol. 206, 12–32. doi: 10.1016/j.agrformet.2015.02.021
Massart, M., Rembold, F., Rojas, O., and Leo, O. (2010). “The use of remote sensing data and meteorological information for food security monitoring, examples in East Africa,” in Advances in Earth Observation for Global Change, Chapter 15. Available online at: http://www.springer.com/earth+sciences+and+geography/remote+sensing/book/978-90-481-9084-3
Meroni, M., Marinho, M., Verstraete, M., Sghaier, N., and Leo, O. (2013). Remote sensing based yield estimation in a stochastic framework – case study of Tunisia. Remote Sens. 5, 539–557. doi: 10.3390/rs5020539
Newlands, N. K., Zamar, D. S., Kouadio, L., Zhang, Y., Chipanshi, A. C., Potgieter, A., et al (2014). An integrated, probabilistic model for improved seasonal forecasting of agricultural crop yield under environmental uncertainty. Front. Environ. Sci. 2:17. doi: 10.3389/fenvs.2014.00017
Petropoulos, G., Carlson, T. N., Wooster, M. J., and Islam, S. (2009). A review of Ts/VI remote sensing based methods for the retrieval of land surface energy fluxes and soil surface moisture. Progr. Phys. Geogr. 33, 224–250. doi: 10.1177/0309133309338997
Rembold, F., Atzberger, C., Savin, I., and Rojas, O. (2013). Using low resolution satellite imagery for yield prediction and yield anomaly detection. Remote Sens. 5, 1704–1733. doi: 10.3390/rs5041704
Rembold, F., Kerdiles, H., Urbano, F., Leo, O., and Kayitakire, F. (2014). Crop and Rangeland Monitoring in Angola, March 2014. European Commission, Joint Research Centre, Institute for Environment and Sustainability. Avaliable online at: http://mars.jrc.ec.europa.eu/mars/content/download/3406/16975/file/Angola_March2014_report_final_V2.pdf
Swets, D. L., Reed, B. C., Rowland, J. D., and Marko, S. E. (1999). “A weighted least-squares ap-proach to temporal NDVI smoothing,” in Proceedings of the American Society of Photogram-metric Remote Sensing, Portland, USA, May 1999 (Washington, DC: American Society of PhotogrammetricRemote Sensing), 526–536.
Tarnavsky, E., Grimes, D., Maidment, R., Black, E., Allan, R., Stringer, M., et al (2014). Extension of the TAMSAT satellite-based rainfall monitoring over Africa and from 1983 to present. J. App. Meteorol. Climatol. 53, 2805–2822. doi: 10.1175/JAMC-D-14-0016.1
Viovy, N., Arino, O., and Belward, A. (1992). The Best Index Slope Extraction (BISE): a method for reducing noise in NDVI time-series. Int. J. Remote Sens. 13, 1585–1590. doi: 10.1080/01431169208904212
WMO, Word Meteorological Organization. (2012). Standardized Precipitation Index User Guide. Technical Document No. 1090. Geneva: WMO. Available online at: http://www.wamis.org/agm/pubs/SPI/WMO_1090_EN.pdf
Keywords: remote sensing, crop monitoring, image time series, agriculture, food security analysis
Citation: Rembold F, Meroni M, Urbano F, Royer A, Atzberger C, Lemoine G, Eerens H and Haesen D (2015) Remote sensing time series analysis for crop monitoring with the SPIRITS software: new functionalities and use examples. Front. Environ. Sci. 3:46. doi: 10.3389/fenvs.2015.00046
Received: 29 April 2015; Accepted: 23 June 2015;
Published: 15 July 2015.
Edited by:
Yang Liu, Emory University, USAReviewed by:
Shuisen Chen, Guangzhou Institute of Geography, ChinaNathaniel K. Newlands, Science and Technology, Government of Canada, Canada
Copyright © 2015 Rembold, Meroni, Urbano, Royer, Atzberger, Lemoine, Eerens and Haesen. This is an open-access article distributed under the terms of the Creative Commons Attribution License (CC BY). The use, distribution or reproduction in other forums is permitted, provided the original author(s) or licensor are credited and that the original publication in this journal is cited, in accordance with accepted academic practice. No use, distribution or reproduction is permitted which does not comply with these terms.
*Correspondence: Felix Rembold, Monitoring Agricultural ResourceS Unit, Joint Research Centre, European Commission, Institute for Environment and Sustainability, Via E. Fermi 2749, Ispra, VA I-21027, Italy, felix.rembold@jrc.ec.europa.eu