Top–Down Precursory Volcanic Seismicity: Implications for ‘Stealth’ Magma Ascent and Long-Term Eruption Forecasting
 Diana C. Roman
 Katharine V. Cashman
- 1Department of Terrestrial Magnetism, Carnegie Institution for Science, Washington, DC, United States
- 2School of Earth Sciences, University of Bristol, Bristol, United Kingdom
Volcanic eruptions occur when a conduit forms to connect a crustal magma reservoir to Earth’s surface. Conduit formation is generally assumed to be a ‘bottom–up’ process and a major driver of precursory volcanic seismicity, which is the most commonly monitored parameter at volcanoes worldwide. If both assumptions are true, initial precursory seismicity should coincide spatially with petrologically-estimated magma reservoir depths. A review of six well-constrained case studies of arc volcanoes that erupt after repose intervals of decades indicates that, to the contrary, initial precursory seismicity is consistently several kilometers shallower than the magma reservoir. We propose a model involving a three-phase process of unrest and eruption: initial (partial) conduit formation occurs during a ‘staging’ phase, either aseismically or long before the onset of the immediate precursory run-up to eruption. Staging may involve slow ascent rates and/or small volumes. A destabilization phase then coincides with the onset of precursory seismicity, leading to a ‘tapping’ phase that involves additional magma ascent from the magma reservoir. This model implies that, most critically, it may be possible to detect precursory magma ascent well before the onset of seismic activity by continuous monitoring of the state of stress in the mid to shallow crust.
Introduction
Magma migrates upwards from its ultimate source region in the mantle, often stalling in the mid-crust for an indeterminate period of time before erupting. Several signals detectable at Earth’s surface are thought to reflect magma migration through the crust, and are thus routinely monitored as a basis for detecting magmatic unrest and forecasting eruptive activity. One reasonable first-order assumption is thus that the time-depth progression of a monitored signal should reflect upward movement of magma before an eruption. Another is that the earliest instances of the precursory signal should coincide spatially with the location of the magma reservoir feeding the eruption, which may be constrained by various petrologic indicators. These two assumptions motivate our analysis of published studies documenting time-depth patterns of precursory seismic activity and petrologically-constrained source depths, with the aim of evaluating the spatiotemporal dynamics of magma ascent and developing paradigms that could extend forecasts of impending volcanic activity by months to years.
Background
All models of eruption triggering are built around the central concept of an upper-crustal reservoir [3–10 km below sea level (BSL)], where magmas are staged for some duration before eruption (Figure 1A). This concept is supported by numerous geophysical, geochemical and petrologic observations (e.g., Zimmer et al., 2007), including maximum dissolved H2O content in melt inclusions, experimentally-reproduced phase assemblages and compositions, geodetic inflation/deflation source depths, and locations/depths of seismicity during and following eruptions (Lowenstern, 2003; Dzurisin, 2006; Scaillet et al., 2008; Segall, 2010; Edmonds and Wallace, 2017). Reservoir depth is regularly determined for individual eruptions through analysis of eruptive products in combination with geophysical observations including the maximum observed depth of seismicity (Hammer and Rutherford, 2003; Blundy et al., 2008). An emerging school of thought, however, conceives this upper-crustal reservoir in arc volcanoes as often volumetrically small and representing only the top of a vertically-extensive column of melt lenses embedded within a largely crystallized mush (Cashman et al., 2017); the extent to which these melt lenses can rapidly coalesce to form large single magma bodies (e.g., Druitt et al., 2012), or be tapped sequentially during a single eruptive episode (e.g., Tarasewicz et al., 2012), is a fundamental question in volcanology (Sparks and Cashman, 2017).
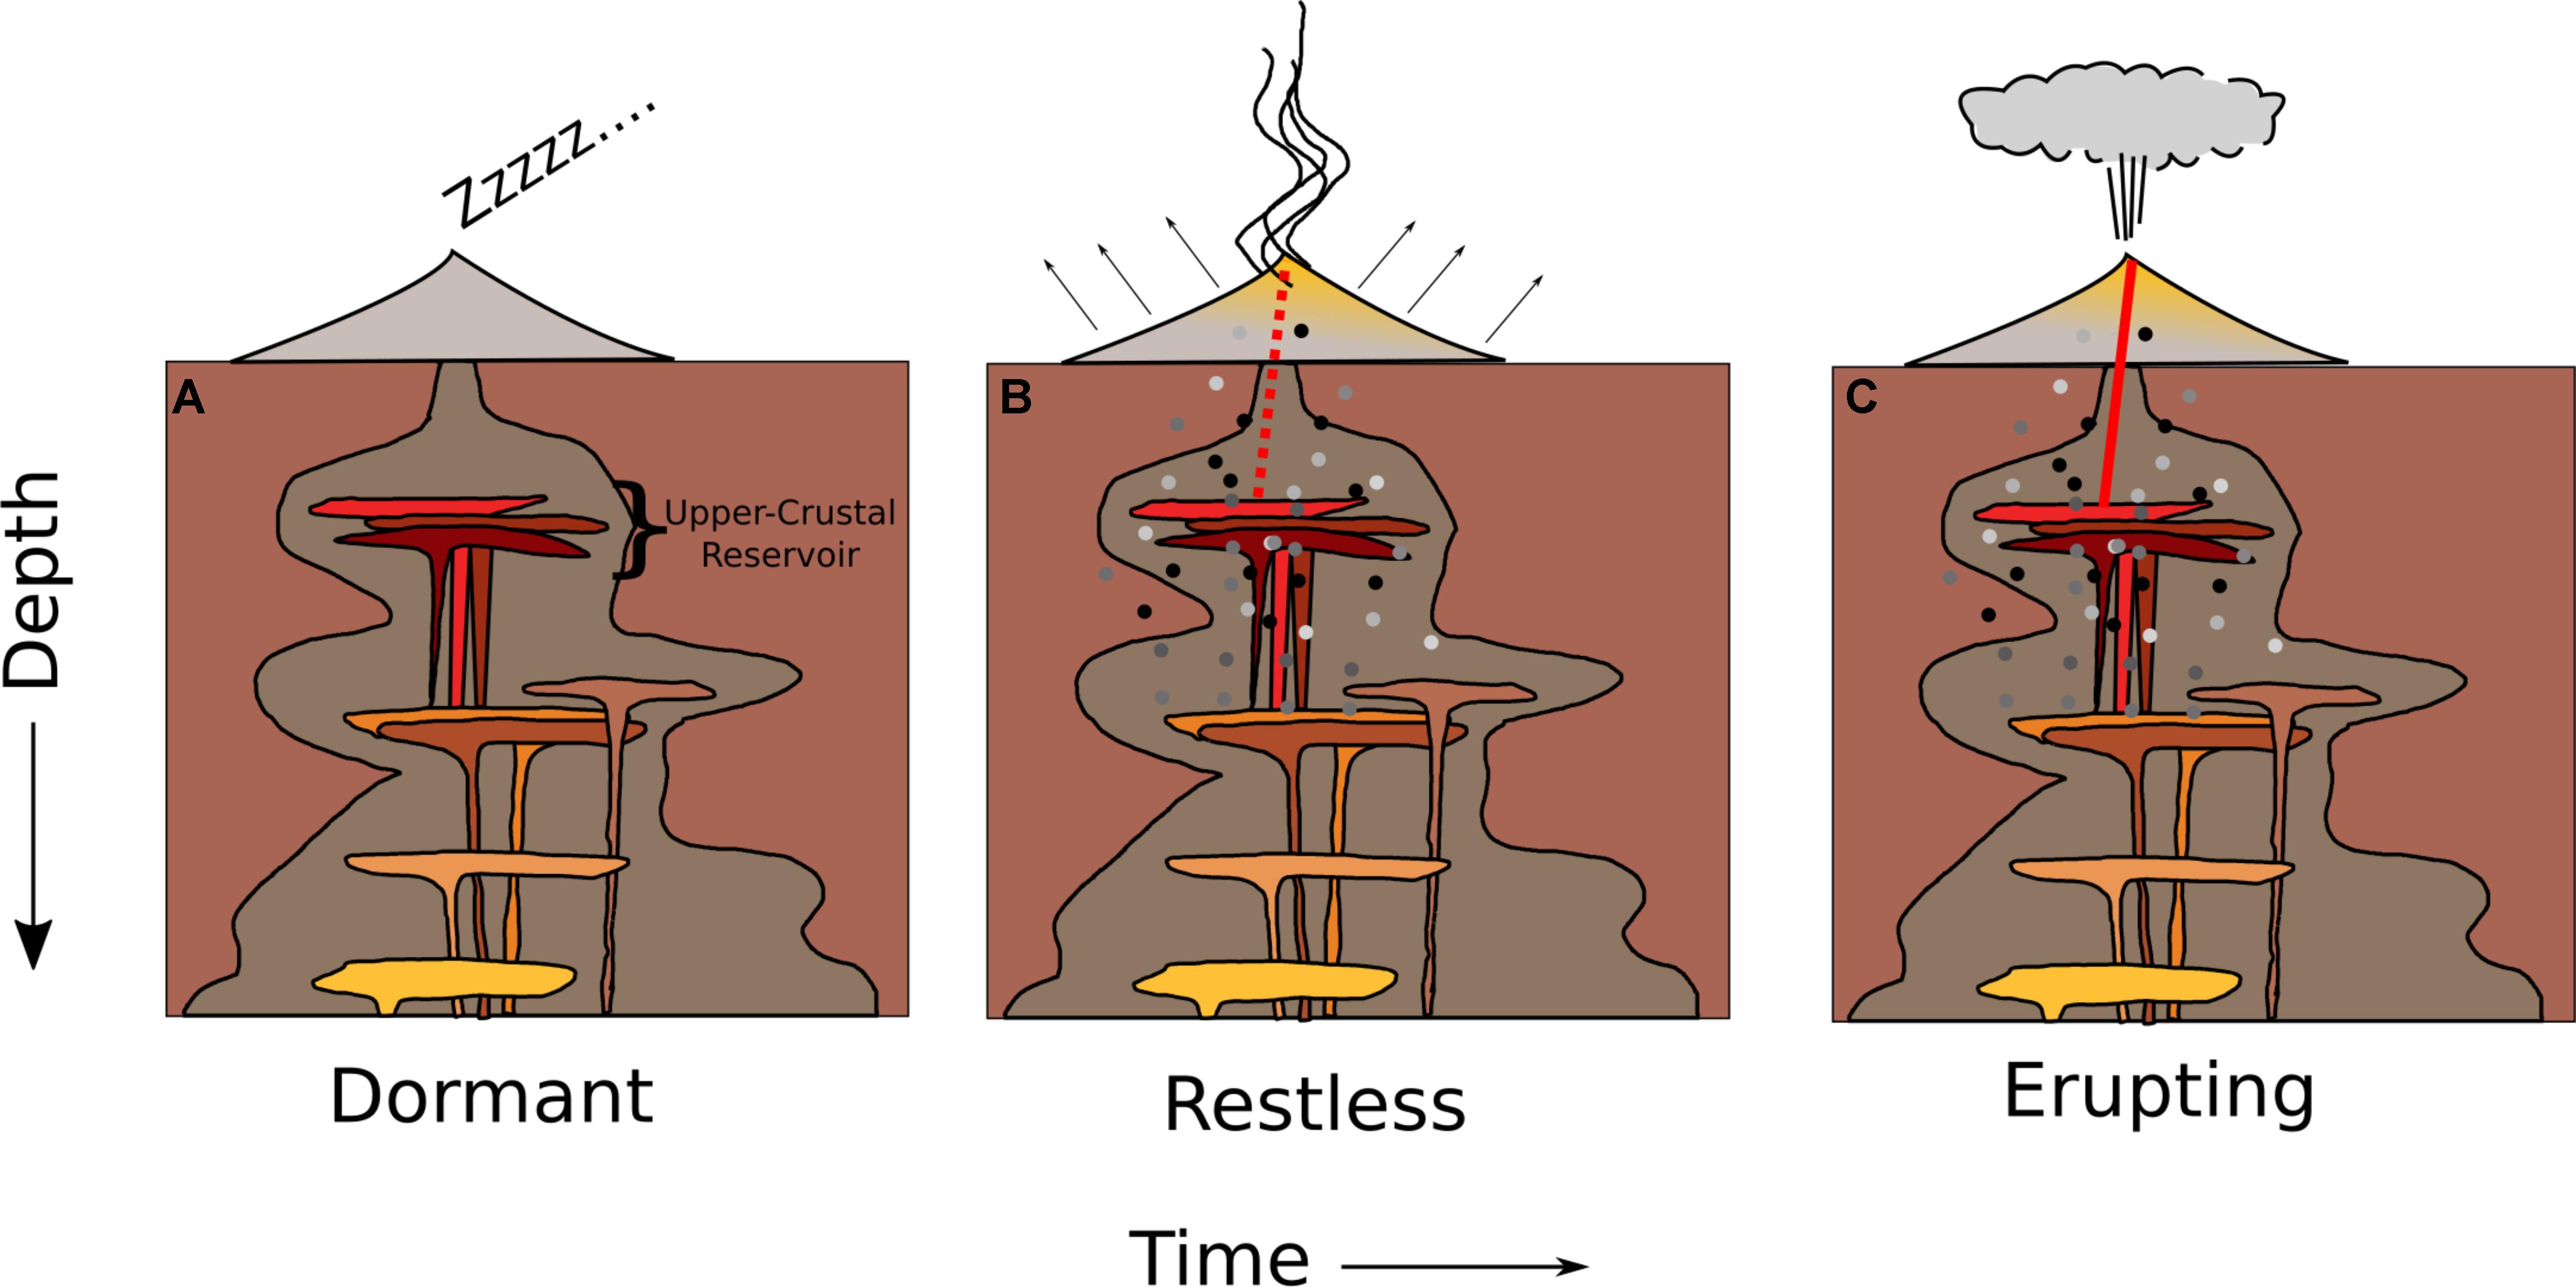
FIGURE 1. Cartoon illustrating three possible states of a volcanic system (e.g., Sparks and Cashman, 2017). (A) A dormant volcano may be underlain by stagnant magma but no conduit exists. This state may be accompanied by no or low rates of seismicity and gas emissions. Although not illustrated, this state also encompasses deep vertical transfers of magma. (B) Prior to eruption, a conduit must be formed. This process is assumed to be characterized by a ‘restless’ state involving elevated rates of seismicity, deformation, and gas emissions. In some cases, conduit formation begins but is never completed, leading to a “failed eruption” (Moran et al., 2011). (C) If a through-going conduit is formed, magma ascends to intersect the surface and erupt.
From a different perspective, we know that before an eruption can occur, a conduit must form to connect the upper-crustal reservoir to Earth’s surface (Scandone et al., 2007) (Figures 1B,C). Conduit formation underlies the concept of eruption triggering mechanisms, which are commonly attributed to the upper-crustal reservoir reaching (1) a critical volume of eruptible melt (Parks et al., 2012), (2) a critical buoyancy (Caricchi et al., 2014), or (3) a critical volatile overpressure (Tait et al., 1989). These states may be achieved by input of new magma and/or volatiles from a deeper region or by crystallization-induced vapor saturation (‘second boiling’) of magma within the upper-crustal reservoir. These triggering mechanisms have been suggested based on evidence of mafic inclusions, magma mixing and disequilibrium crystal textures in erupted magmas (e.g., Plail et al., 2018). The timing of mafic inputs is commonly constrained by diffusion chronometry, and suggests eruption-generating disturbances to large magmatic systems may occur decades (Druitt et al., 2012; Barker et al., 2016), years (Morgan et al., 2004; Saunders et al., 2012); or months (Kilgour et al., 2014; Till et al., 2015; Rasmussen et al., 2018) prior to the eruption onset. Attempts to link diffusion time scales directly to monitoring data are limited; to date, the best correlations appear to be with deep-seated seismicity (Saunders et al., 2012; Kilgour et al., 2014; Rasmussen et al., 2018).
The process of conduit formation is generally assumed to be seismogenic (e.g., Rubin et al., 1998; Kilburn, 2003) and reflected by the days to months of precursory seismic unrest observed at most well-monitored volcanoes. A recent analysis of reports of volcanic unrest worldwide occurring between 2000 and 2011 demonstrated that seismic unrest was the most commonly documented pre-eruptive unrest indicator (57 instances of pre-eruptive seismic unrest compared to 26 instances of pre-eruptive degassing, the next most common indicator) and had a mean duration of 192 days (± 525 days) (Phillipson et al., 2013). Similarly, a recent study of caldera unrest worldwide between 1988 and 2014 indicated that 72% of pre-eruptive unrest episodes involved high seismicity and degassing (Sandri et al., 2017). Precursory seismic unrest may involve a range of signal types, including high-frequency or ‘volcano-tectonic’ (VT) earthquakes and low-frequency, or ‘long-period’ (LP) events. VT earthquakes are generally thought to reflect shear failure of rock due to stress changes in the crust produced by magma migration, while LP events are considered to be a more direct consequence of various fluid flow processes (Chouet and Matoza, 2013 and references therein). A recent study further proposed that explosive eruptions are preceded by ‘distal VT seismicity’ (which is defined in the study as high-frequency seismicity that occurs in swarm-like distributions and originates at lateral distances of 1–45 km from the eventual eruption vent) and that, at volcanoes in repose for two decades or longer, distal VT seismicity is the earliest seismic precursor (White and McCausland, 2016). However, at most volcanoes (including all four case study volcanoes considered by White and McCausland, 2016) the local seismic monitoring network is non-existent or rudimentary at the start of seismic unrest, and earthquake location errors generally exceed several kilometers, making it nearly impossible to accurately assess the exact location of initial volcano-seismic unrest.
None of the above-described models for eruption triggering address the mechanical process of conduit formation, nor the timescale over which it occurs. One conceptual model for conduit formation involves a ‘bottom–up’ process, whereby overpressures in an upper-crustal reservoir exceed the tensile strength of overlying rock, which fractures to form a dike that propagates upwards to intersect the surface (Rivalta et al., 2017 and references therein). However, a long-noted problem with this mechanism is the rarity of observations of upward propagation of volcanic hypocenters suggestive of magma migration, even at densely instrumented volcanoes (e.g., Roman and Cashman, 2006; Scandone et al., 2007). Rare cases of precursory hypocenter propagation are limited to hot spots (Battaglia et al., 2005; Taisne et al., 2011) or are subtle and apparent only following high-precision relocation (Patane et al., 2002), and are more often lateral than upwards (e.g., Rubin et al., 1998; Sigmundsson et al., 2015). As an alternative, Scandone et al. (2007) proposed that conduit formation may precede introduction of magma into the fractures that comprise it, with magma ascent a passive response to mechanical failure of the overlying rock. The proposed mechanisms for this process are either external (e.g., tectonic) or internal (e.g., release of volatiles from the magma). Another possibility is that conduits develop from the ‘top–down,’ as documented in observations of seismicity and degassing at mafic volcanoes in both open system (e.g., Girona et al., 2015; Ripepe et al., 2015) and rift (e.g., Tarasewicz et al., 2012) settings. A similar mechanism has been suggested for some mafic caldera-forming eruptions (Cashman and Giordano, 2014). Such ‘top–down’ mechanisms, however, apply to situations where the conduit has already been formed – i.e., magma has already migrated upwards from the reservoir, and not to the stage of initial conduit formation.
In light of the difficulty reconciling mechanisms of conduit formation with observations of precursory seismicity, we hypothesize that precursory seismicity does not reflect initial conduit formation, nor, by implication, reservoir destabilization. Rather, we suggest that reservoir destabilization and initial conduit formation may occur either aseismically, or long before the immediate seismic run-up to eruption. In the following sections, we evaluate this hypothesis by comparing information on reservoir depth and suggested eruption triggering mechanisms derived from petrologic analyses with time-depth patterns of precursory seismicity during the immediate run-up to eruption at well-monitored and frequently-erupting volcanoes. We use these data to develop a conceptual model for the processes occurring during conduit formation. Finally, we explore the implications of this model for long- and intermediate-term eruption forecasting.
Case Studies
We searched the peer-reviewed literature, Smithsonian Global Volcanism Program database, and reports published on observatory websites for well-constrained case studies that document the timing and depth of pre-eruption seismicity at volcanoes worldwide. We consider only case studies that meet three criteria. First, the volcano must have been monitored by a ‘Level 3’ seismic network [defined by Moran et al. (2008a) as the minimum seismic instrumentation for accurate hypocenter location] centered on the location of earliest seismicity for at least a year prior to eruption. Level 3 seismic monitoring requires a network with at least two seismometers located within 5 km of the vent, and six seismometers within 20 km of the vent. Second, because we are interested in examining the earliest stages of conduit formation and its associated geophysical signals, we consider only eruptions that have occurred after a minimum 10-year period of no surface activity (either phreatic or magmatic eruption). Third, we consider only eruptions that involve magma. We take reported observations for all case studies meeting the above criteria at face value, that is, we consider that the earliest seismic unrest was detected and that hypocenter locations are accurate. We recognize, at the same time, that factors such as temporary instrument failures, event detection protocols, background noise levels, and inaccuracies in velocity models, may limit the accuracy of the timing and location of the earliest precursory seismicity. To mitigate this issue, we filter all data to consider only “well-located” earthquakes, which we define as having an azimuthal gap < 180°, RMS < 0.20 s, and horizontal and vertical location error < 3 km. We combine the seismic data with all available petrologic, gas emission, and geodetic observations that help to constrain the depth(s) of pre-eruptive magma staging and timing of magmatic unrest.
We identified six case studies that meet the above criteria, including four eruptions in Alaska’s Aleutian arc (Crater Peak/Spurr 1992, Redoubt 2009, Augustine 2006, and Okmok 2008; Figure 2A), one eruption in the Cascade arc (Mt. St. Helens, Washington, 2004–2008; Figure 2B), and one in the Izu arc (Miyake-jima, Japan, 2000; Figure 2C). While these six case studies represent a range of magma compositions (from basalt to dacite) and settings (four in continental arcs and two in island arcs), all six volcanoes have experienced at least two eruptive episodes in the past 40–50 years (the main reason they have good seismic monitoring networks). Thus, together they present the opportunity to examine eruptive precursors in frequently active (i.e., erupting every few decades) systems, which may or may not be different from those in long-dormant (i.e., no eruption for centuries to millenia) volcanoes.
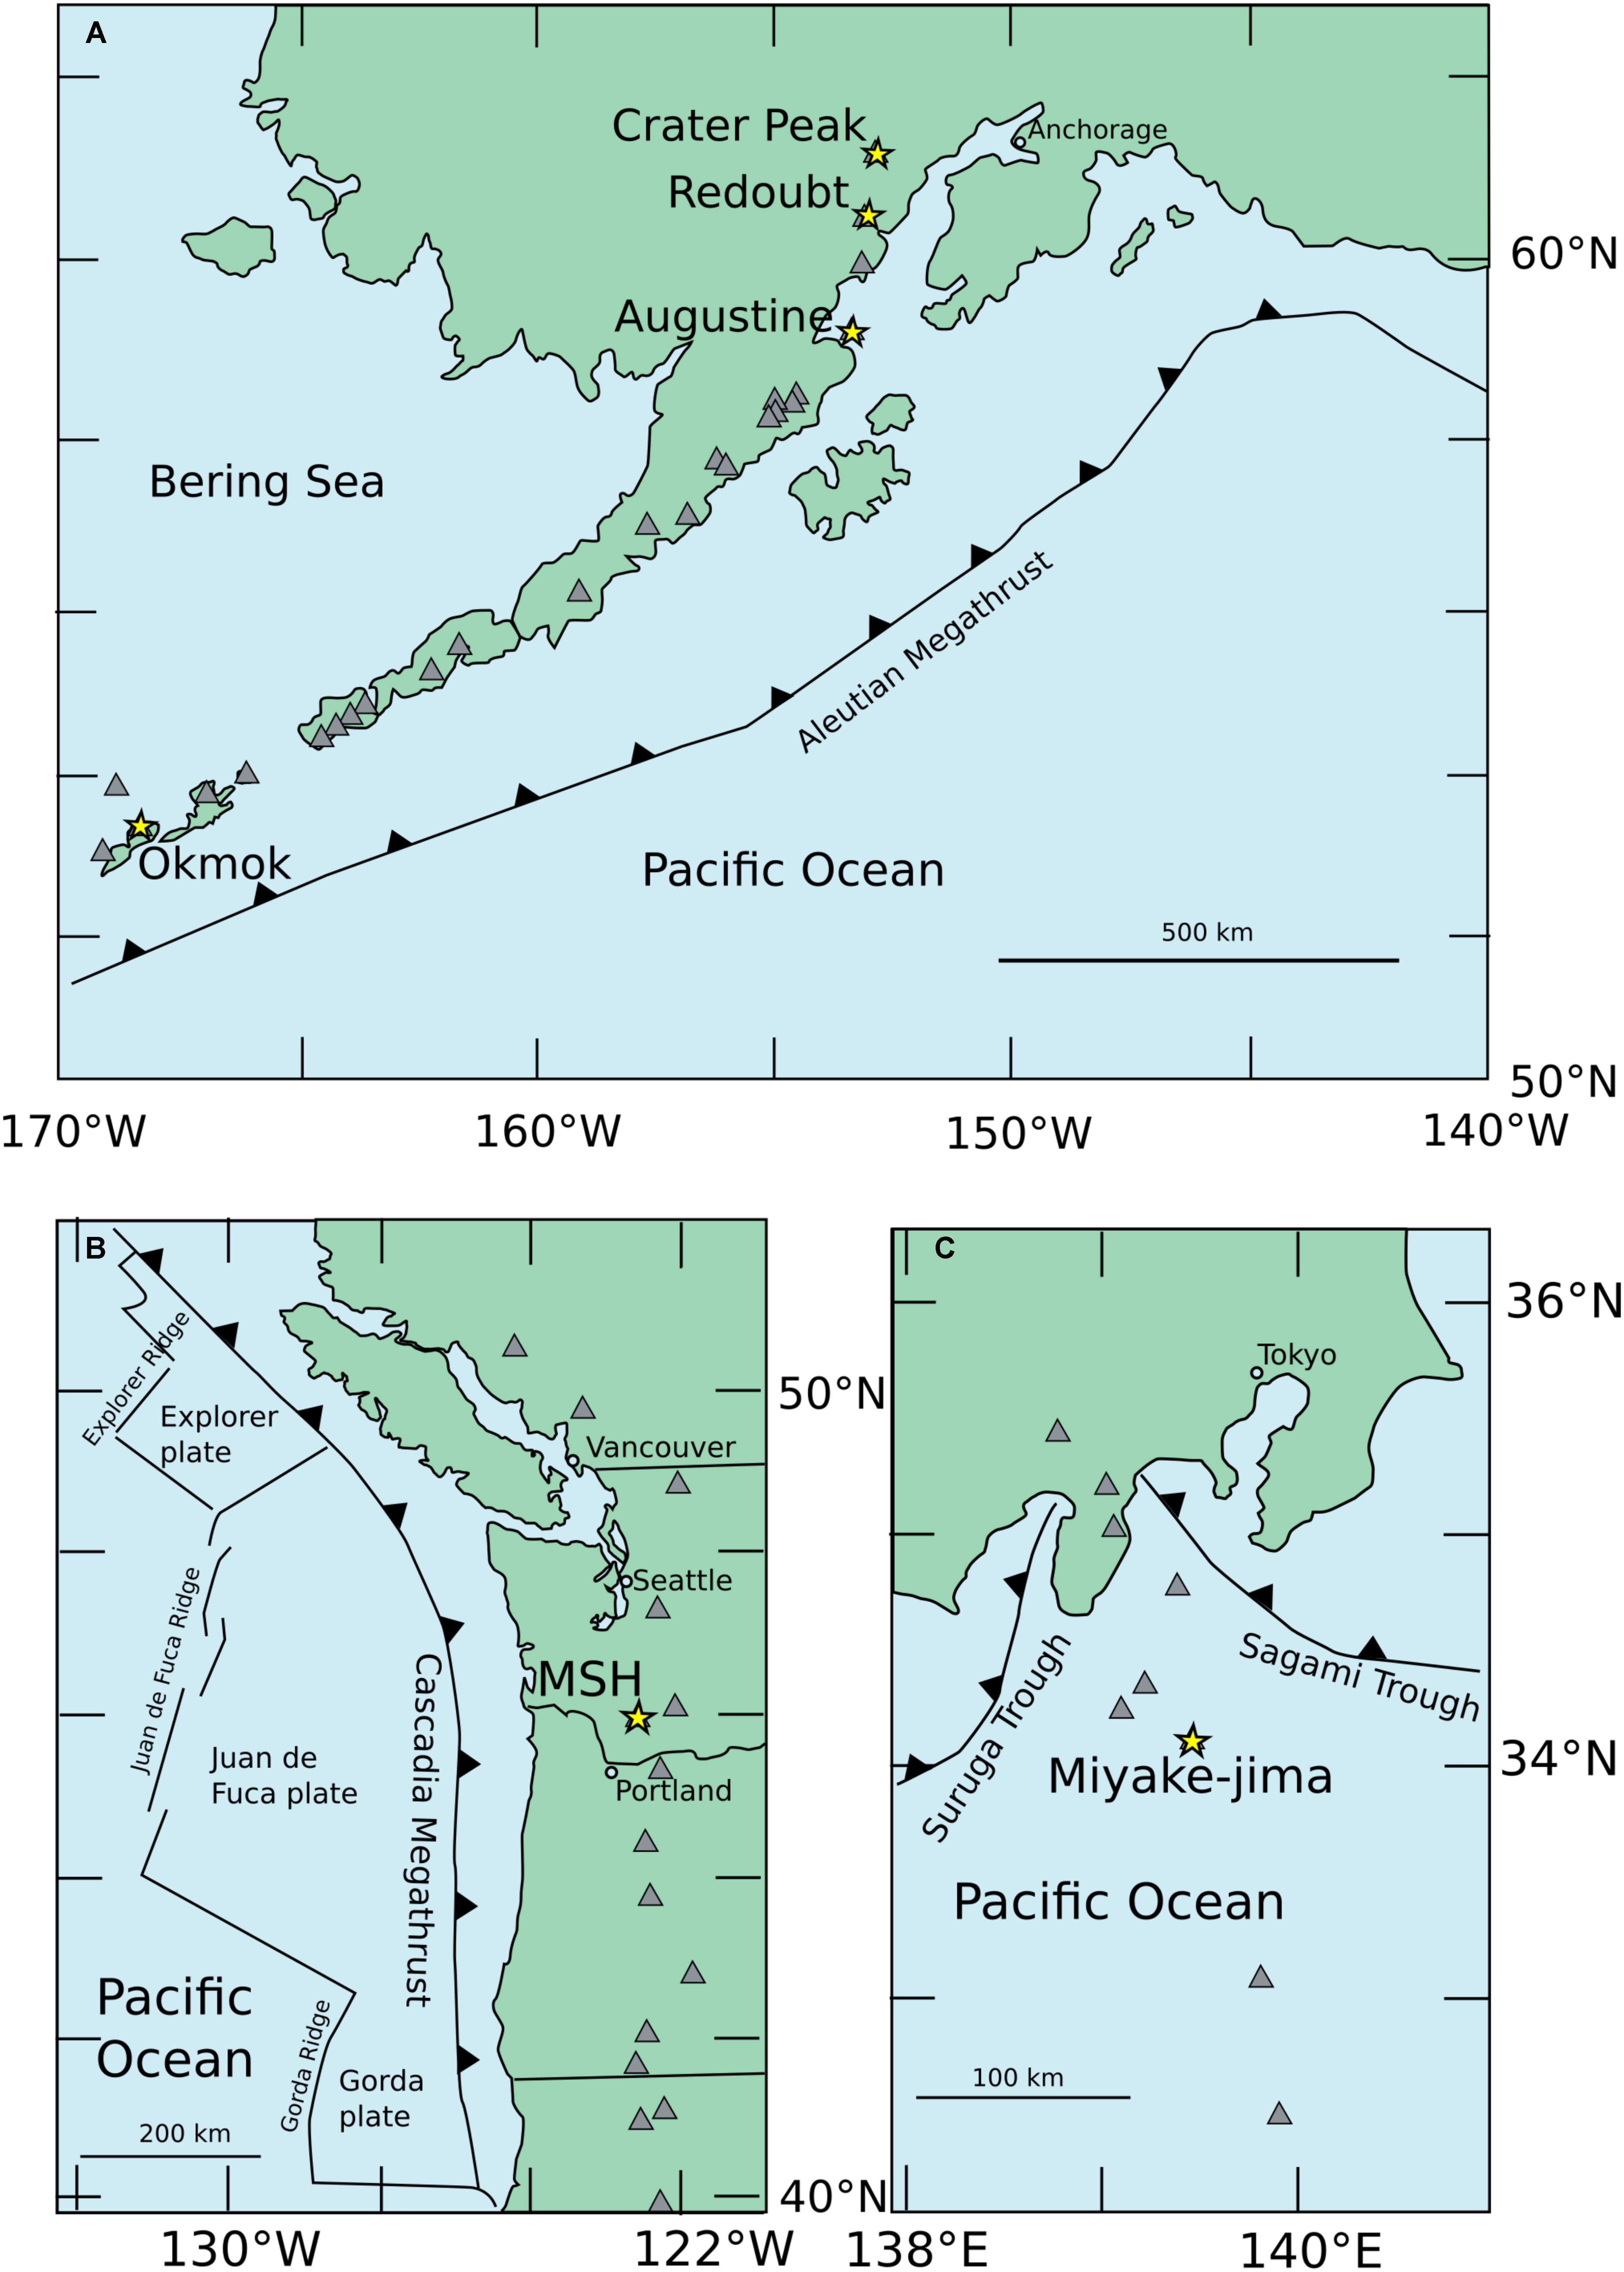
FIGURE 2. Map showing the location (yellow stars) and general tectonic setting of the six volcanoes discussed in this study. Gray inverted triangles show nearby volcanoes not considered in this study. (A) Map of Alaska (United States) showing the locations of Crater Peak (Mt. Spurr), Redoubt, Augustine, and Okmok volcanoes. (B) Map of the Pacific Northwest region (United States) showing the location of Mt. St. Helens. (C) Map of Japan showing the location of Miyake-jima Volcano.
We summarize key precursory observations of seismicity, gas emissions, and deformation, along with petrological constraints on the depth of magma genesis and storage, in the sections below. One important piece of ‘housekeeping’ necessary for accurate comparison of earthquake depths and petrologically-derived magma storage depths is reconciliation to the same reference depth. Volcano seismologists generally (though not always) report earthquake depths relative to sea level (e.g., 2 km BSL). A complication is that, for computational simplicity, the top of the seismic velocity model (the computational space in which the earthquakes are located) may be slightly above the actual summit height, resulting in occasional ‘airquakes’ located above the summit elevation. For example, most velocity models used for Alaskan volcanoes extend to 3 km ASL (e.g., Dixon et al., 2013) even though summit heights of Alaskan volcanoes range from 1 to 3 km ASL. Petrologists, in contrast, report depth by converting pressures (inferred from melt composition including maximum dissolved volatile contents, phase assemblages, and/or textural observations) through an assumed crustal density as P(z) = gρz (e.g., 100 MPa = 4 km depth for an average crustal density of 2500 kg/m3). Therefore, reported petrologic depths are generally relative to the summit elevation (the total overburden in km). To reconcile the two sets of depths, we correct (either add to seismic depth or subtract from petrologic depth) by the elevation of the vent.
In the sections below, we summarize key precursory observations of seismicity, gas emissions, and deformation, along with petrological constraints on the depth of magma genesis and storage. We also review what is known about the penultimate eruption at each volcano, including when it occurred, the eruption precursors, the petrology of the eruptive products, and the accepted interpretation of the magma storage conditions and/or eruption triggers. Our goal in these case study reviews is to build a picture of the magma storage system at each volcano, which we can then compare, in hindsight, to the information about the system provided by the eruption precursors.
Crater Peak, Alaska – 1992 Eruption (Vent Elev. 2.2 km ASL)
Crater Peak (Mt. Spurr), Alaska, experienced a series of three relatively quick (∼4 h) subplinian eruptions on June 27, August 18, and September 16–17, 1992 (Keith, 1995 and papers within this volume)) (Figure 3). The previous eruption of Spurr occurred on July 9, 1956 and comprised two main explosive phases (to a height of 20 km ASL) followed by steam and ash emissions. The erupted material was basaltic andesite which deposited mostly as ash, although an associated debris flow temporarily blocked the Chakachatna River (Eichelberger et al., 1995). There is no geophysical information on this eruption. Crater Peak has had a Level 3 seismic network since August 1989. The first sign of unrest preceding the eruptions was a swarm of volcano-tectonic (VT) earthquakes in August 1991 directly beneath the Crater Peak vent (1–4 km BSL) (Power et al., 1995). The rate of shallow VT seismicity then increased in the 7 months preceding the first (June) eruption, with a distal VT swarm ∼8 km NE of the vent in March including earthquakes located as deep as 10 km, and two particularly intense shallow VT swarms on June 5 and 27 (Power et al., 1995). Boiling, evaporation, and chemical changes (as denoted by changing color) of a small crater lake began in June, and the lake disappeared before the first eruption. No precursory gas emission data were collected, but lake water sampled on June 8 was found to have an elevated SO4 content (Keith et al., 1995). Syneruptive seismicity was relatively low (a maximum of 10 events/day), but the final (September) eruption was both accompanied and followed by a strong swarm of VT earthquakes at -2 to 11 km BSL (Power et al., 1995), and two non-eruptive swarms in November (-3 to 3 km BSL) and December (8–10 km BSL) of 1992 (Power et al., 1995). Several months of abundant deep-long period (DLP) seismicity followed the eruption. A major episode of caldera-wide seismic and fumarolic unrest in 2004–2005 did not culminate in an eruption and has been interpreted as the result of a magmatic intrusion (Coombs et al., 2006; Koulakov et al., 2013).
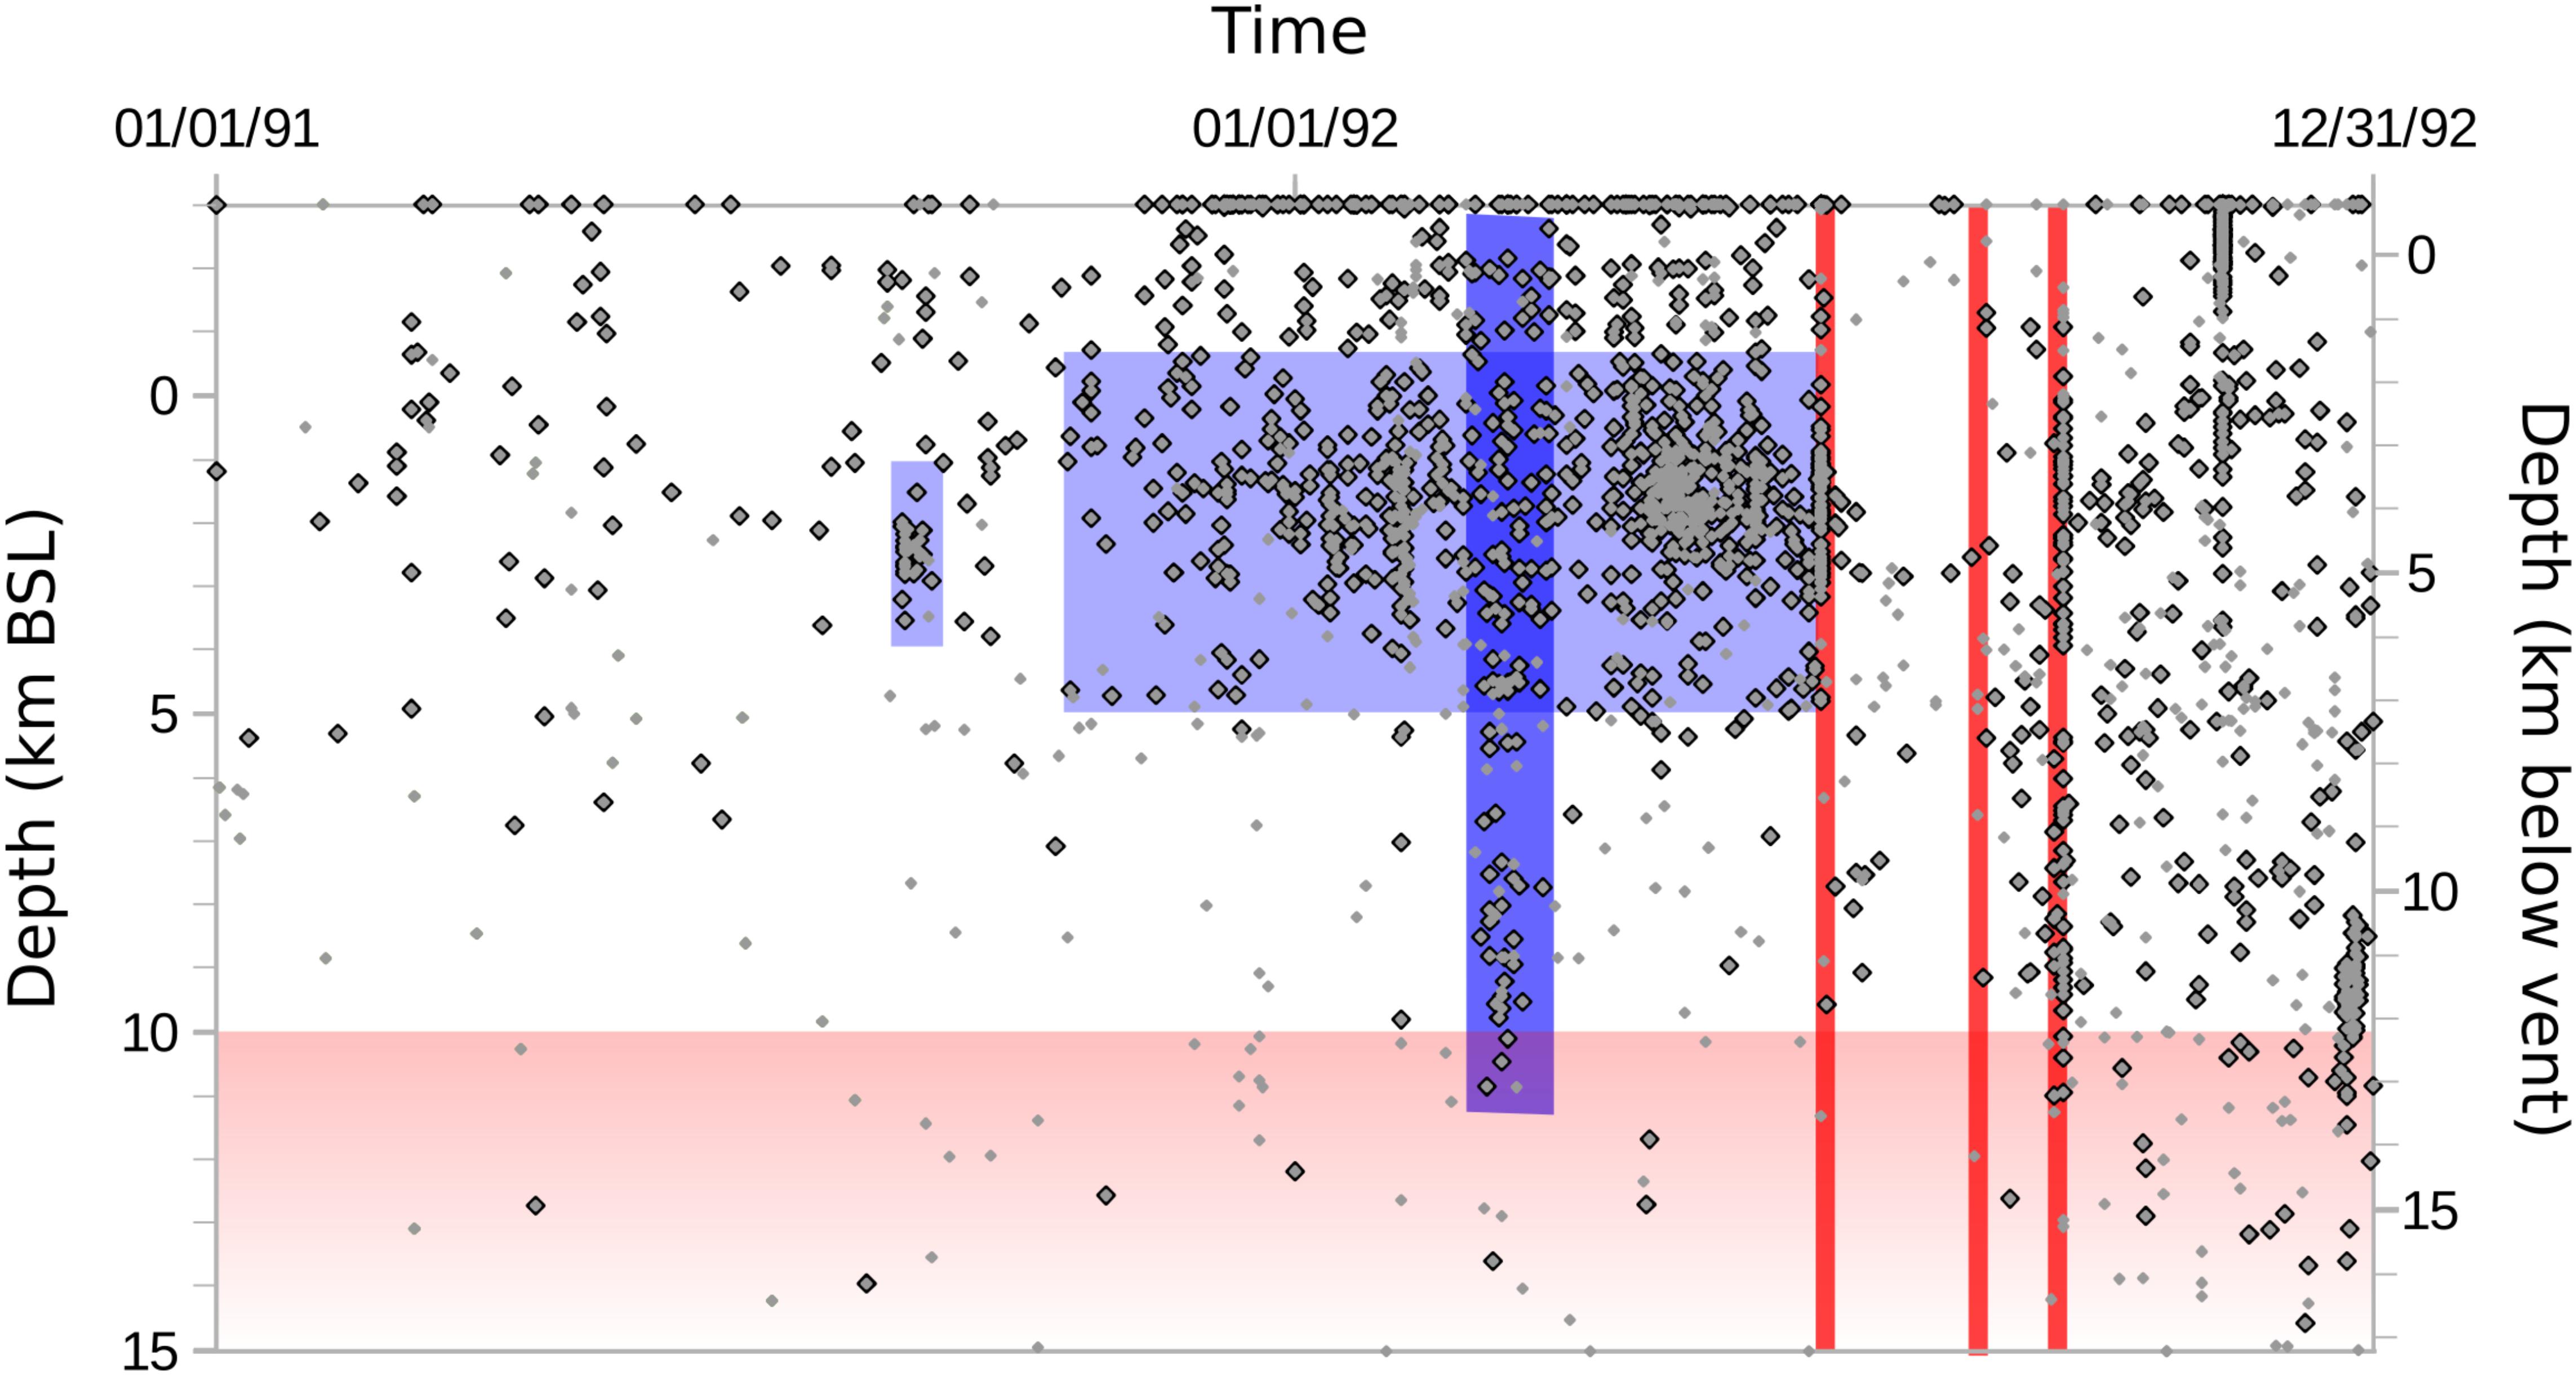
FIGURE 3. Time-depth plot for Crater Peak, Alaska from January 1991 to December 1992. Light red – petrologically-defined magma source. Dark red – eruptions. Light blue shading shows the timing and depth of proximal precursory seismicity. The dark blue shading indicates earthquakes belonging to a distal swarm located beneath the north caldera rim, approximately 8 km NE of the vent. Gray dots show all earthquakes and black outlined dots show earthquakes with well-constrained locations. In this and the following five figures, light red grading to white indicates that the depth of the base of the mid-crustal storage region is unknown.
There is no evidence for a mafic injection trigger for the 1992 Crater Peak eruption. That Crater Peak magmas were stored at mid-crustal depths immediately prior to eruption is indicated by the presence of abundant pristine hornblende phenocrysts in the erupted products (Harbin et al., 1995). The absence of hornblende breakdown rims also requires water contents of several percent (Grove et al., 1997; Gardner et al., 1998). Combined petrologic and seismic observations, therefore, indicate pre-eruptive magma storage at ∼10 km BSL (Power et al., 2002).
Redoubt Volcano, Alaska – 2009 Eruption (Vent Elev. 2.5 km ASL)
Redoubt Volcano erupted on March 23, 2009 (Waythomas and Webley, 2013 and papers within this volume) (Figure 4). The eruption lasted several months and consisted of multiple explosions that produced andesitic lava and tephra (Schaefer, 2012), culminating with the extrusion of a lava dome in the summit crater. It has had a Level 3 seismic network since September 1990.
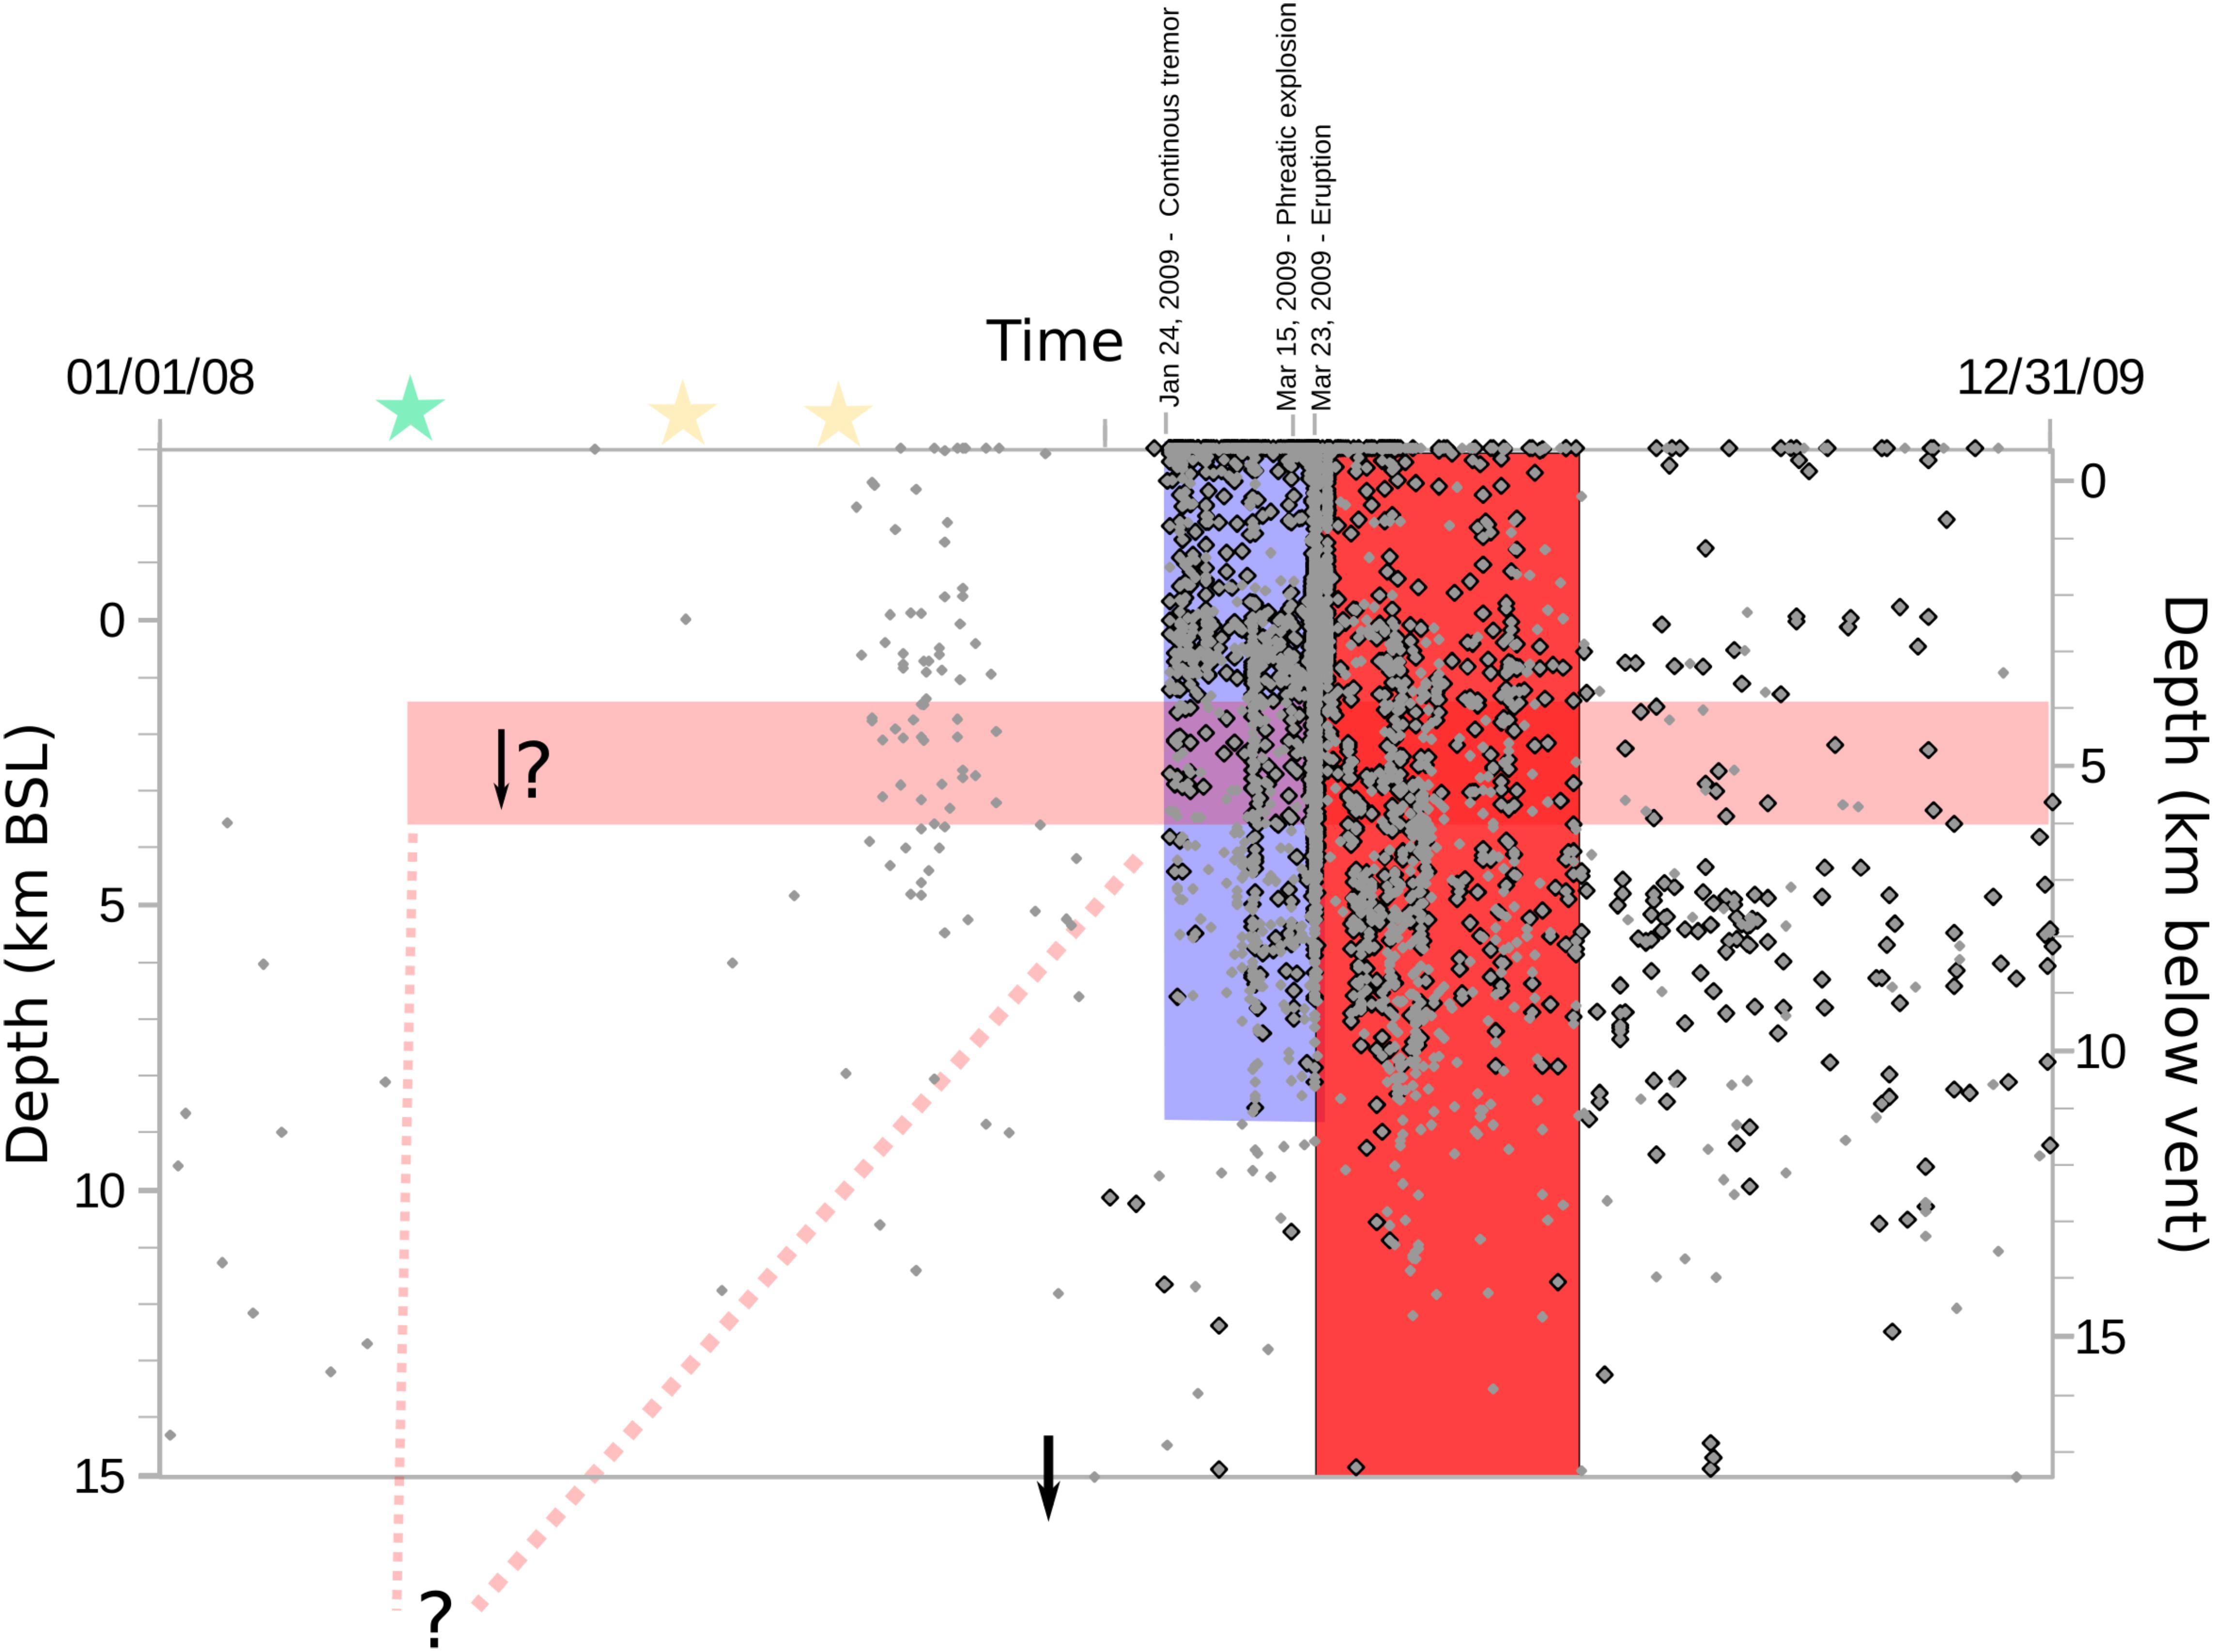
FIGURE 4. Time-depth plot for Redoubt Volcano, Alaska from January 2008 to December 2009. Light red – petrologically-defined magma source. Dark red – eruptions. Light blue shading shows the timing and depth of precursory seismicity. Gray dots show all earthquakes and black outlined dots show earthquakes with well-constrained locations. Green star indicates onset of GPS-detected deformation. Yellow stars indicate timing of first-detected gas and thermal anomalies. Black arrow at base of plot indicates the timing of the start of deep long-period seismicity (not shown in plot). Question marks indicate uncertainty in petrologically-constrained magma storage depths.
Its previous eruption was in 1989–1990, and a few small LP events were recorded once a local seismic network became operational in October 1989, but strong precursory seismicity began only ∼24 h before the eruption onset on December 14 (Power et al., 1994). Pilots reported steam plumes in late November and early December (Miller and Chouet, 1994. No geodetic monitoring existed at the time and the occurrence of the eruption in the middle of Alaskan winter may have limited opportunities to visually observe earlier surficial changes at the summit, such as increased ice melting. Early erupted material included both andesite and dacite (58.2–63.4 wt% SiO2); later products showed abundant evidence of mixing and trended toward an intermediate composition (58.5–60.5 wt% SiO2), suggesting that individual eruptions in the 1989–1990 sequence were fed by separate magma pulses from 6 to 10 km rather than tapping of a single large reservoir (Wolf and Eichelberger, 1997).
The first observed sign of unrest prior to the 2009 eruption, in retrospect, was anomalous ground deformation starting in April or May of 2008 at the continuous GPS station AC17 operated by EarthScope roughly 26 km northwest of the summit (Grapenthin et al., 2013). In mid-July, and again in mid-September of 2008, a strong sulfur smell was reported downwind of the volcano (Schaefer, 2012). Anomalous snow melt was observed in the Redoubt crater in mid-September, and increased fumarolic activity was observed through late 2008 (Bull and Buurman, 2013). Measured CO2 emissions in October and November 2008 (1220–1368 t/d CO2) were relatively high and noteworthy given there was little other indication of increasing unrest (aside from continuing subtle inflation) (Werner et al., 2012).
No unusual earthquake activity was observed in association with the earliest (April–July) signs of unrest on seismic stations close to the volcano (Ketner and Power, 2013). Redoubt seismometers recorded a tremor-like signal in late September, and a small number of LP events were identified in October and November of 2008, but were too small to be located. On December 12, 2008, AVO began to locate DLP events and VT earthquakes at 28–35 km depth beneath the volcano. Near-continuous shallow volcanic tremor began on January 24, 2009, accompanied by episodic swarms of both VT and LP earthquakes located from -3 to 3.8 km BSL (January 25), -3 to 4.9 km BSL (January 30–31), and -3 to 9.28 km BSL (February 26–27). Relative seismic quiescence began on March 1 and culminated in a phreatic explosion on March 15. The onset of the magmatic phase on March 23 was immediately preceded by a 58-h long swarm of seismic events located from -1 to 9.1 km BSL. Syneruptive seismicity was characterized by ongoing swarms of discrete events and gliding, high-frequency harmonic tremor (interpreted as the superposition of frequently-repeating stick-slip earthquakes) immediately preceding explosions (Hotovec et al., 2013). Following the end of the eruption, seismicity rates gradually declined to low background levels by July 2009.
Petrologic observations point to months of pre-eruptive staging of all magmas erupted in 2009 at a minimum of 4–6 km depth (100–160 MPa), or approximately 1.5–3.5 km BSL. Equilibrium phase assemblages, amphibole rim thicknesses, and plagioclase rim hygrometry suggest that the earliest erupted product, a low-silica andesite, ascended to a depth of 1.5–3.5 km BSL from an unknown depth (assumed to correspond to the cluster of DLP events located between 28 and 37 km BSL) in mid-2008 to early 2009; here it paused, equilibrated, and remobilized stagnant mushy magmas already present in the mid-crust to produce the higher-silica products of the later eruptive phases (Coombs et al., 2013). Petrologic depth estimates could, however, be increased by up to several km if the magmas contained appreciable CO2 (Coombs et al., 2013), as suggested by relatively high CO2 fluxes and high C/S ratios measured during the precursory phase (Werner et al., 2012, 2013). Additional evidence that the petrologic depth is underestimated comes from analytical models of observed precursory deformation, which suggest a deeper reservoir located at ∼13 km BSL, and models of observed syneruptive deflation, which suggest a reservoir at ∼9 km BSL (Grapenthin et al., 2013).
Augustine Volcano, Alaska – 2006 Eruption (Vent Elev. 1.1 km ASL)
Augustine Volcano, Alaska, began erupting on January 11, 2006 with a subplinian eruption followed by 2 months of andesitic dome-building activity (Power et al., 2010 and papers within this volume) (Figure 5). Its previous eruption was in 1986, and it has had a Level 3 seismic network since June 1988. The 1986 eruption was preceded by several distinct shallow VT swarms separated by periods of quiescence (Power, 1988) – gas and deformation were not monitored prior to the eruption. Material erupted in 1986 had a range of whole-rock compositions from basaltic andesite to dacite, with evidence for a mafic injection trigger (Roman et al., 2006). Lee et al. (2010) analyzed SAR data for the period 1992–2005 and found evidence for wholesale and steady uplift of the entire volcano during this 13-year period, which they model with two Mogi sources beneath the summit – an inflating source at 7–12 km BSL (interpreted as a long-term magma storage zone) and a contracting source at 2–4 km BSL (interpreted as a subsidiary reservoir tapped during the 2006 eruption).
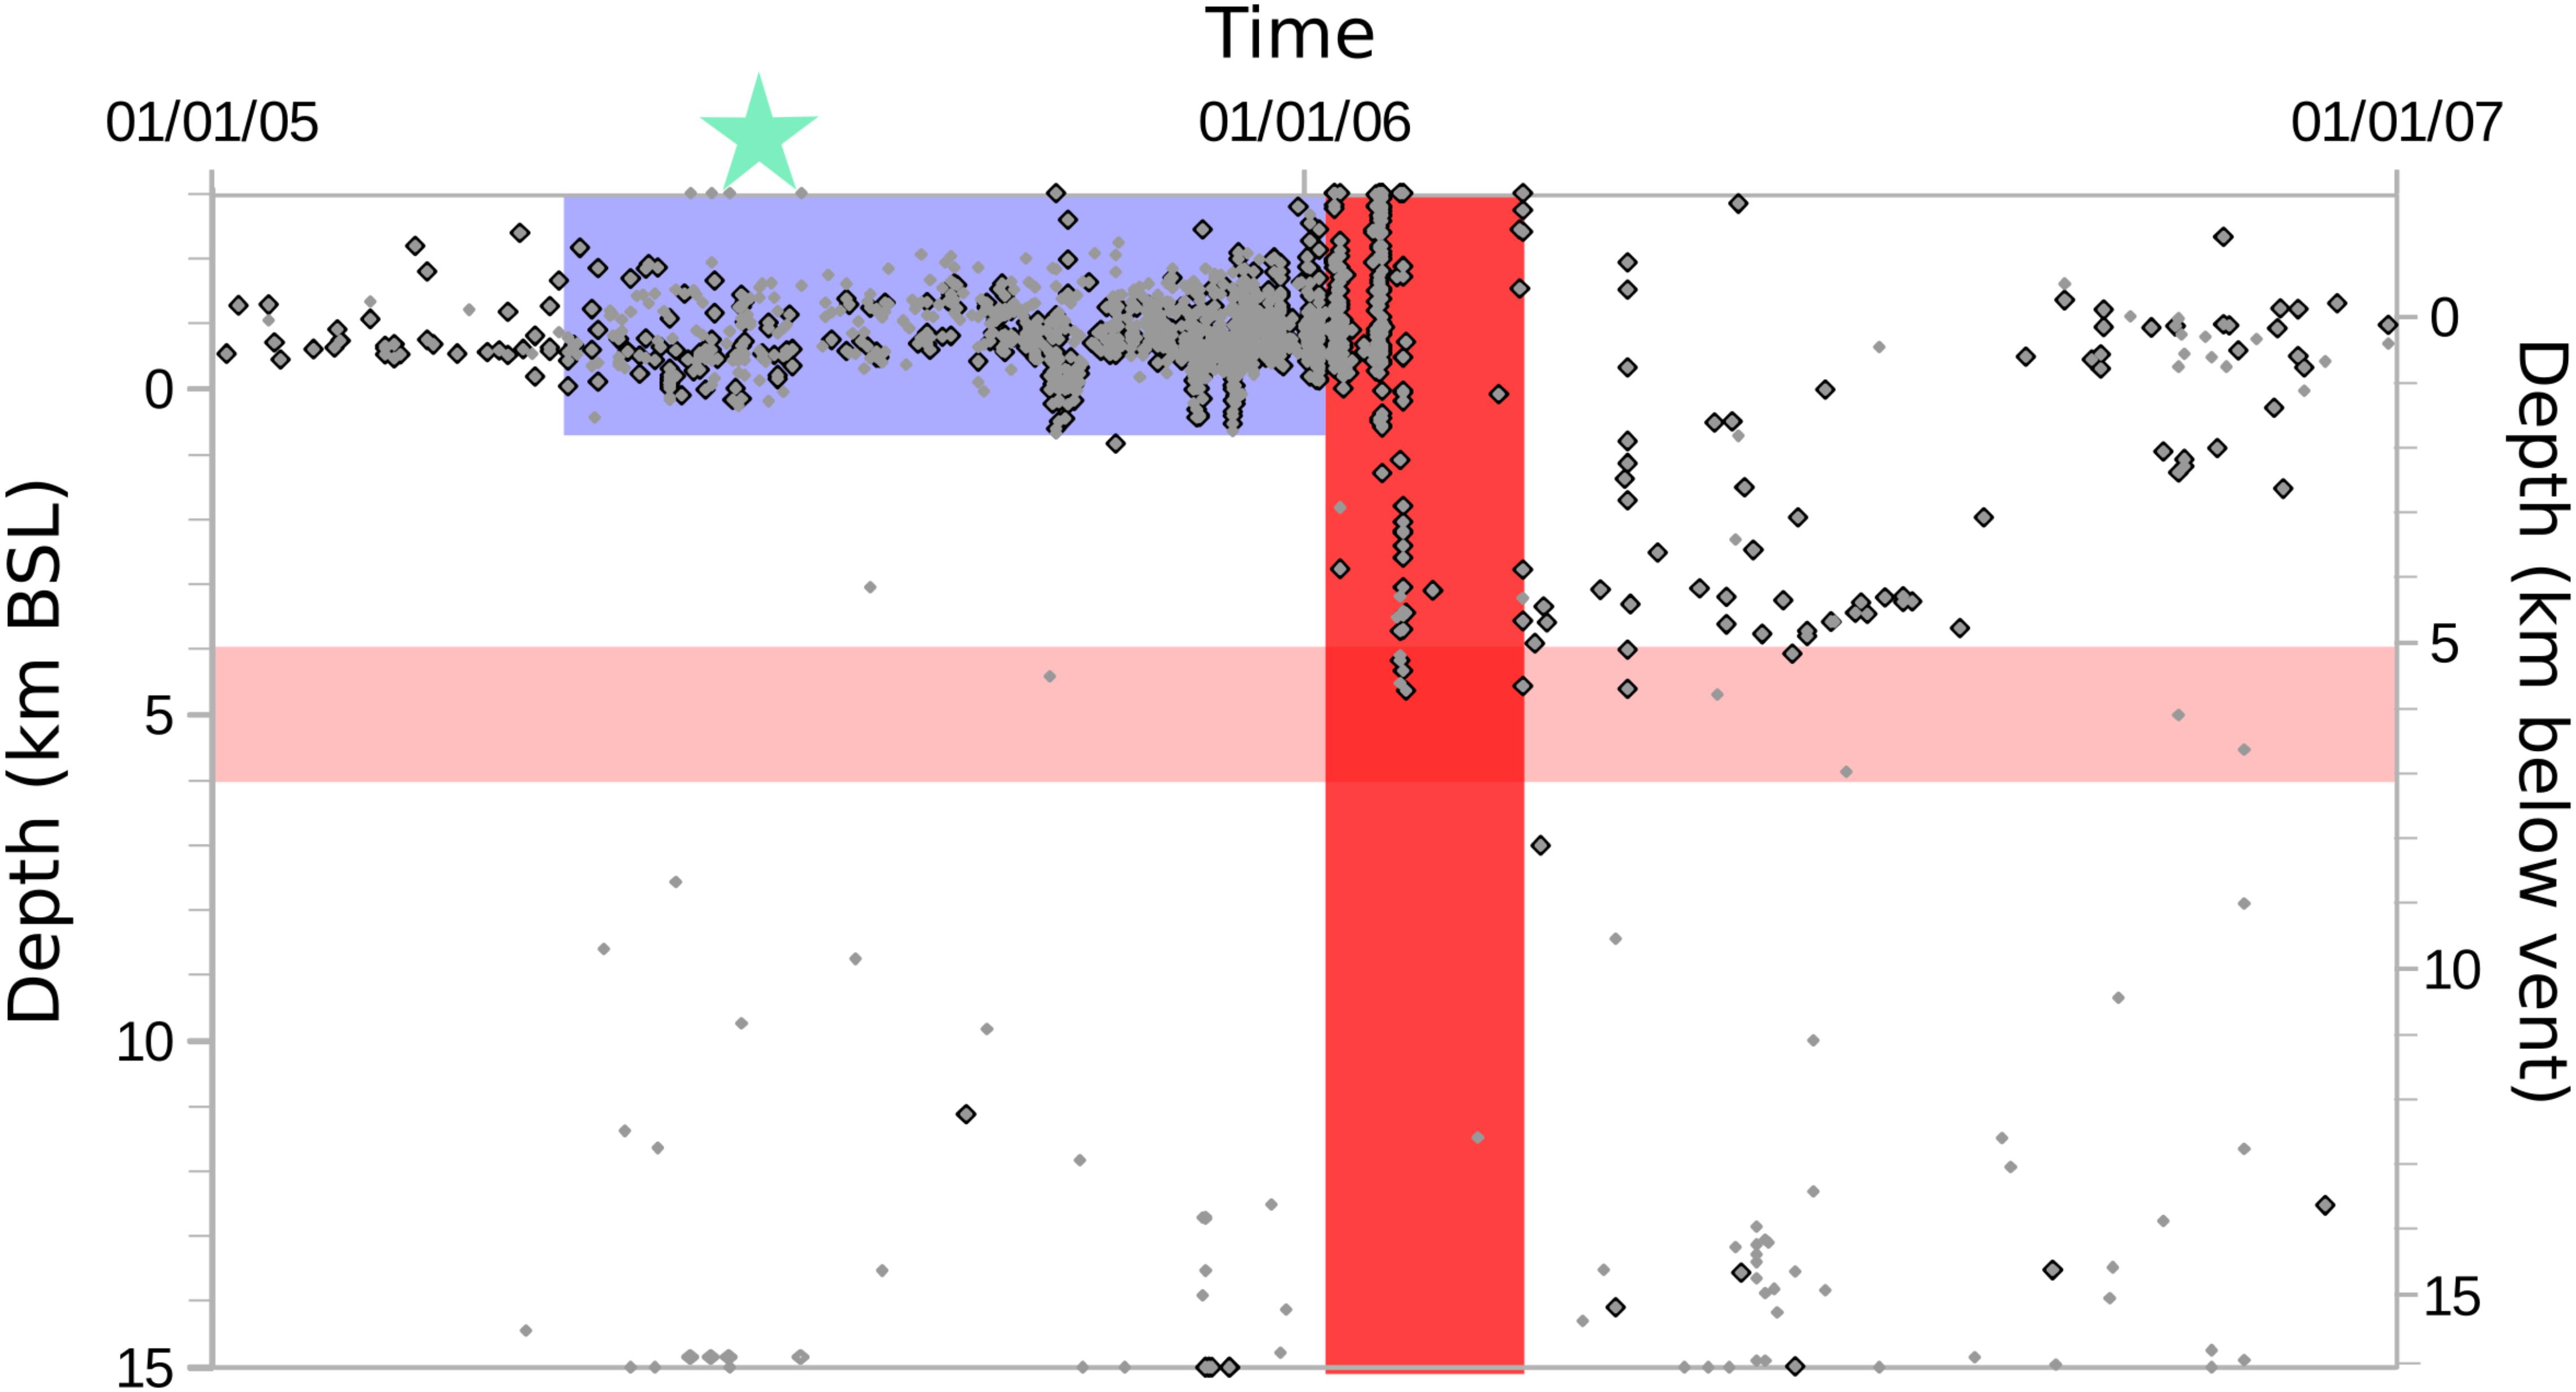
FIGURE 5. Time-depth plot for Augustine Volcano, Alaska from January 2005 to December 2006. Light red – petrologically-defined magma source. Dark red – eruptions. Light blue shading shows the timing and depth of precursory seismicity. Gray dots show all earthquakes and black outlined dots show earthquakes with well-constrained locations. Green star indicates onset of GPS-detected deformation.
The first sign of immediate unrest preceding the 2006 eruption was a slow, steady increase in the number of volcano-tectonic (VT) earthquakes beginning in May 2005 (Power and Lalla, 2010). Relocated hypocenters had depths between 0.1 and 0.6 km ASL (Power and Lalla, 2010). The rate of shallow VT seismicity increased through December. GPS-detected inflation began in mid-summer, with radial deformation in GPS baselines indicating an inflation source at approximately sea level (Cervelli et al., 2006). Steam explosions began in early December and continued through the precursory period, accompanied by strongly elevated rates of shallow seismicity (∼0–3 km ASL). Explosive activity began on January 11, 2006, immediately following a 13-h long swarm of shallow VT earthquakes with depths of 0.5–1 km ASL. The volcano began deflating on January 28 and continued through February 10, with the locus of deformation at approximately 3.5 km BSL (Cervelli et al., 2006). On February 3–4, during this deflation period, there was a swarm of VT earthquakes with depths 2–4 km BSL. From mid-February through the end of the eruption, the volcano was seismicially quiet, except for rockfall signals. Drumbeat seismicity accompanying lava extrusion emerged on March 8 and merged into a near continuous signal until March 13. Drumbeats ceased to be detected by March 16. There was little seismic activity through the rest of 2006.
The products of the 2006 eruption of Augustine are heterogeneous and record evidence for significant mixing of low- and high-silica andesite prior to the eruption (Larsen et al., 2010). Phenocrysts in the low-silica end member further suggest involvement of an unerupted basaltic magma. Together these data suggest that the high-silica endmember was stored in a mush region with its top at ∼5 km (4 km BSL) and that it was intruded by a basaltic magma that mixed to form the low-silica andesitic eruptive products (Larsen et al., 2010). Similar analyses from previous eruptions (e.g., Roman et al., 2006) suggest that this scenario is common for Augustine.
Okmok Volcano, Alaska – 2008 Eruption (Vent Elev. 700 m ASL)
Okmok Volcano, Alaska, experienced a 5-week-long phreatomagmatic eruption beginning at Cone D on July 12, 2008 (Figure 6). Its previous eruption in 1997, and all other historic eruptions of Okmok occurred at Cone A, a vent approximately 5 km to the southwest of the 2008 vents (Figure 6B). The 1997 eruption was completely unmonitored by ground-based instrumentation and included an explosive phase and emplacement of a basaltic lava flow. Okmok has had a Level 3 seismic network since January 2003. The 2008 eruption is notable for its lack of long-intermediate term seismic precursors despite the presence of a dense seismic network on and around the vent, although caldera-wide inflation resumed in early 2008 following a 3-year pause. The only detected seismic precursor to the eruption was a 5-h period of low-magnitude VT earthquakes immediately preceding the eruption, and occurring at an increasing rate in the hour before eruption (Johnson et al., 2010). Catalog locations for these events have epicenters distributed throughout the northern half of the caldera and depths ranging from -3 to 14 km BSL, with no apparent time progression in depth (Figure 6B). During the 5-week long eruption, the rate of seismic events was elevated (an average of 6 events/day), with most events located between 0 and 6 km BSL.
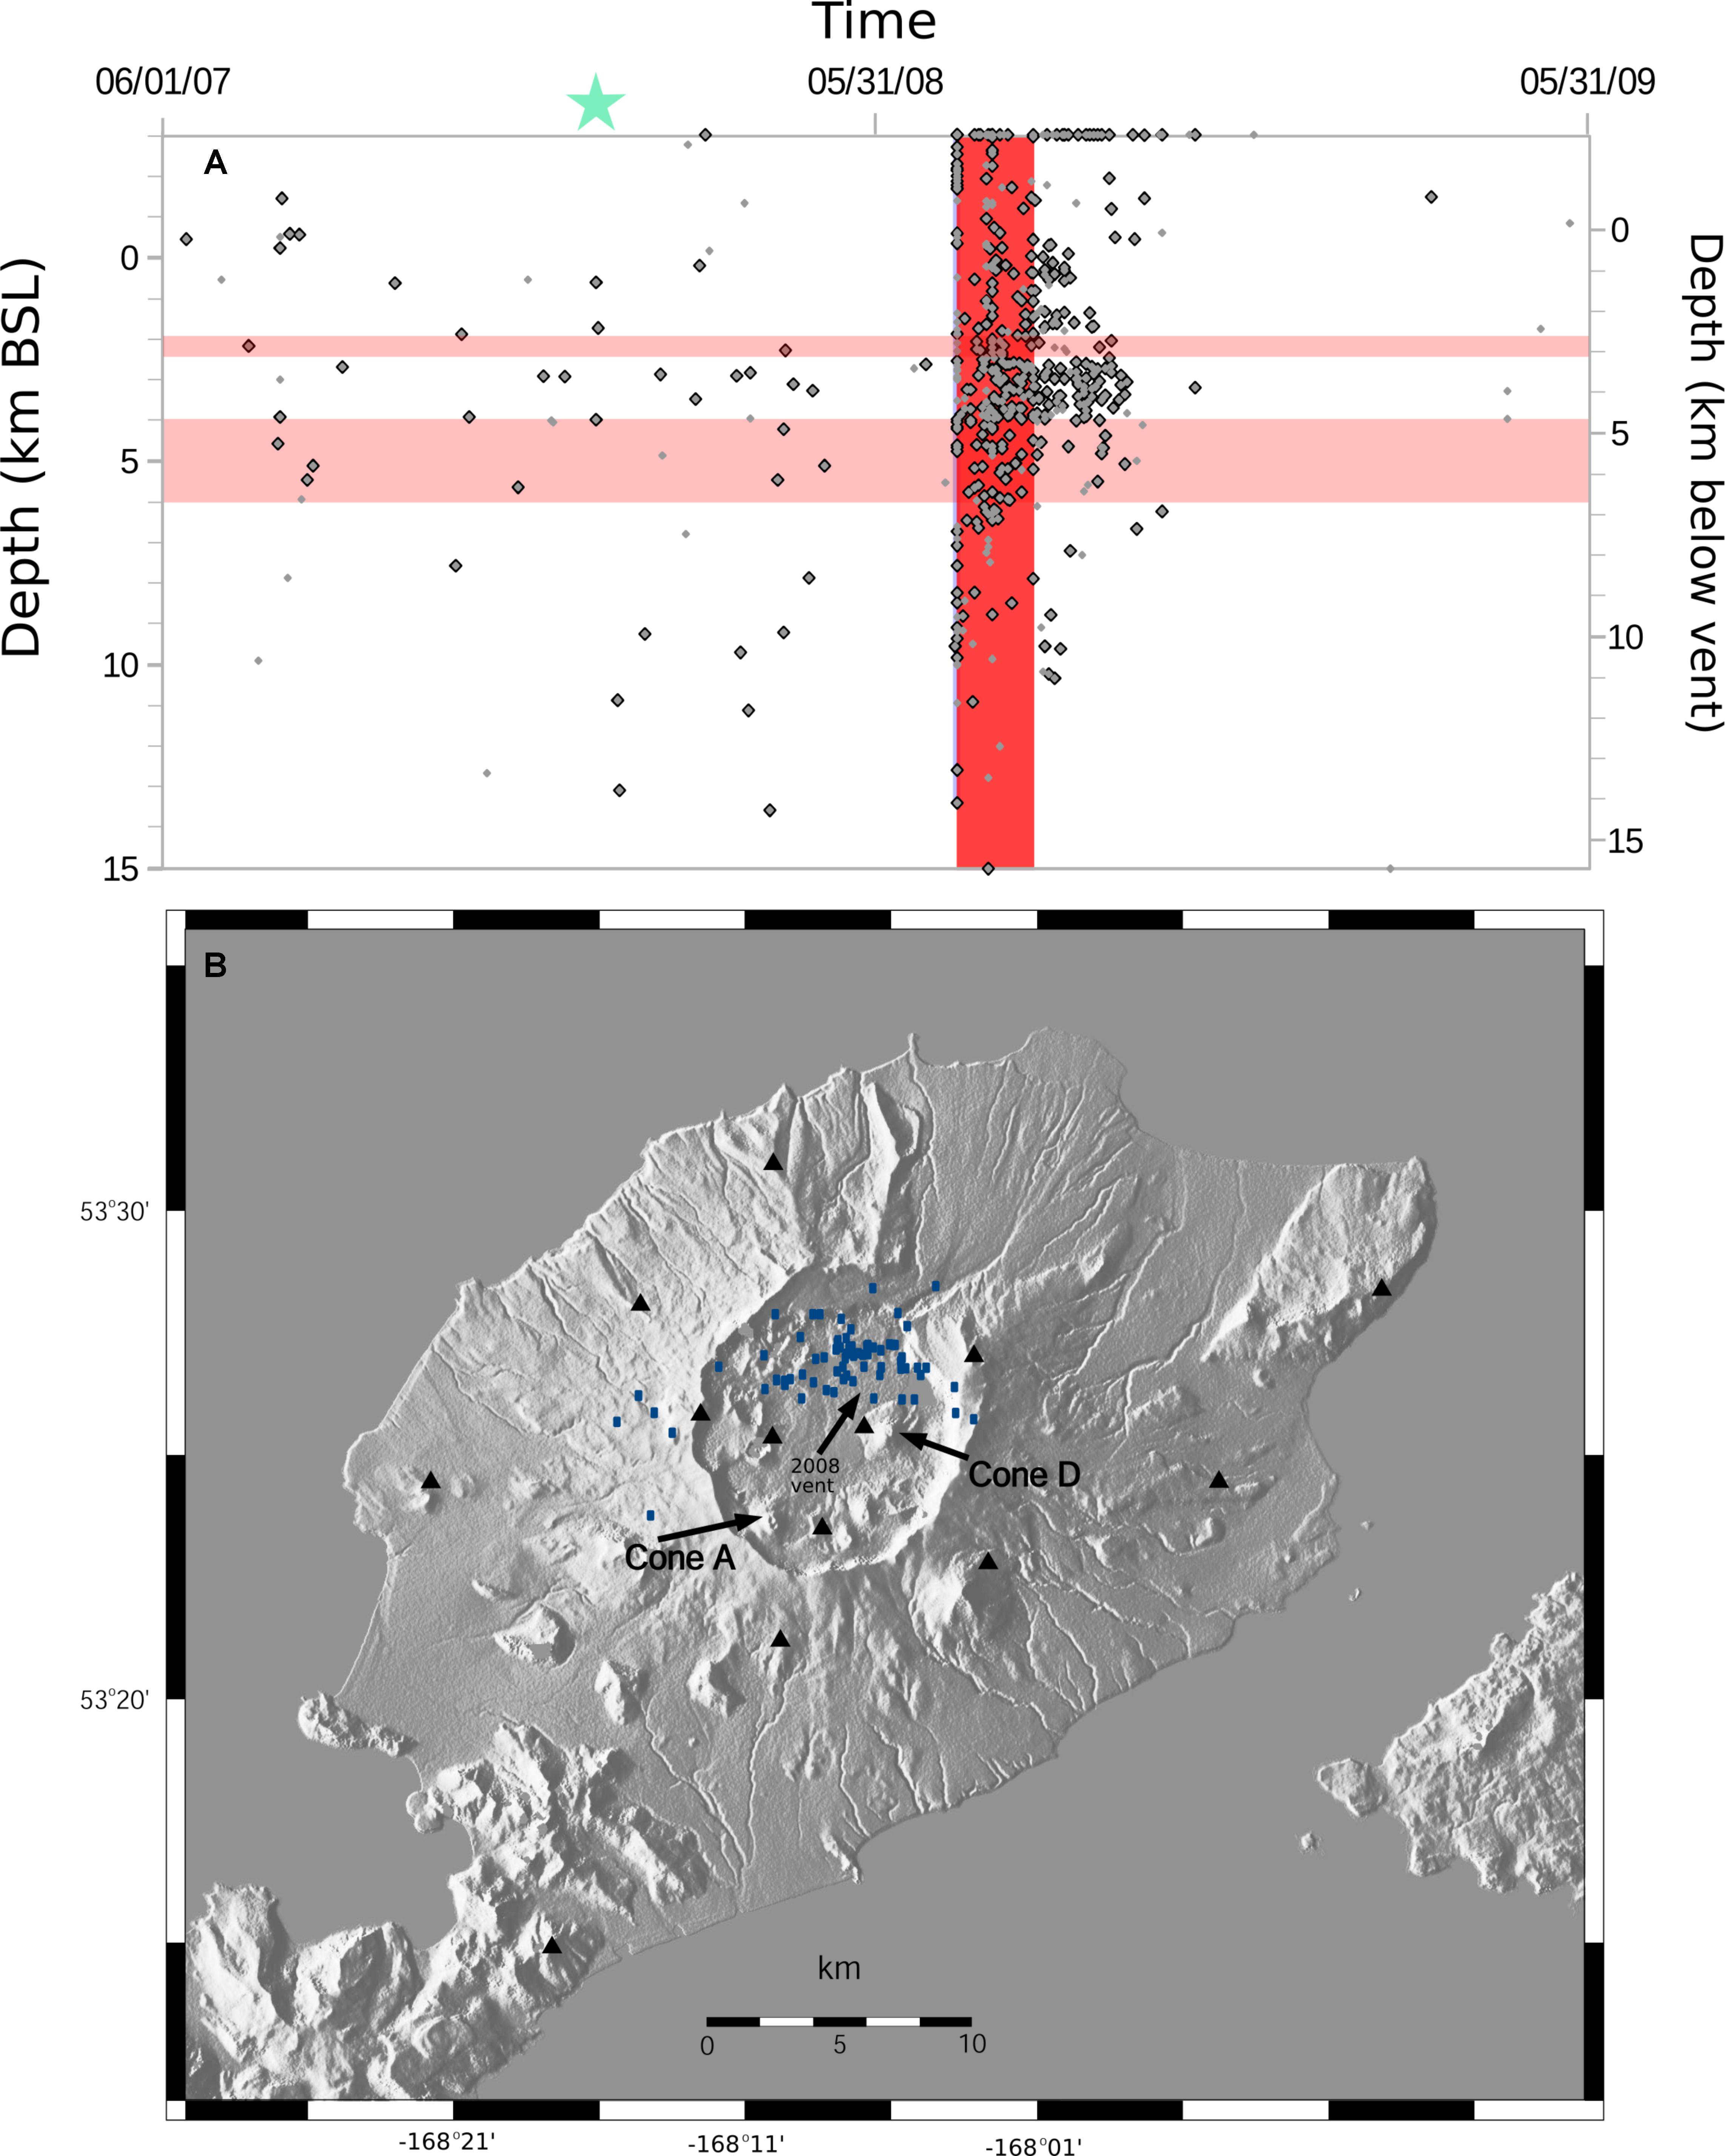
FIGURE 6. (A) Time-depth plot for Okmok Volcano, Alaska from June 2006 to May 2009. Light red – petrologically-defined magma sources. Dark red – eruptions. Light blue shading shows the timing and depth of precursory seismicity. Gray dots show all earthquakes and black outlined dots show earthquakes with well-constrained locations. Green star indicates onset of GPS-detected deformation. (B) Map of Okmok showing epicenters of precursory earthquakes (blue squares) occurring in the 5 h preceding eruption, and the location of the 2008 vent relative to historic vents. Black triangles show the location of seismic stations.
Several studies have assessed the depth of magma storage at Okmok using tomographic approaches. An analysis of ambient noise tomography in combination with InSAR data indicates that Okmok is underlain by two low-velocity zones, one extending from the surface to 2 km BSL and a second located at 4–6 km BSL (Masterlark et al., 2010). Finite-element models show consistency with an inflating magma body in the deeper zone and patterns of deformation spanning the 1997 eruption imaged by InSAR (Masterlark et al., 2010). Double-difference tomography spanning the 2008 eruption also finds a low Vp and Vs anomaly directly under the caldera in a shallow zone at 0–2 km BSL which is connected to a larger deeper zone that extends to about 6 km BSL (Ohlendorf et al., 2014). Using a newly developed 3D velocity model, Ohlendorf et al. (2014) produced relative locations for a subset of earthquakes spanning the 2008 eruption and show that relocated precursory earthquakes occur within the depth range spanned by catalog locations.
The 2008 eruption produced a phenocryst-poor tholeiitic basaltic andesite that is compositionally distinct from basaltic lavas erupted in 1997. Based on the presence of disequilibrated olivine phenocrysts and melt inclusion volatile contents, Larsen et al. (2013) conclude that the 2008 Okmok eruption was ultimately triggered by an influx of melt-rich basalt originating from a magma storage region at 3–6 km BSL into a shallower (∼2 km BSL) more evolved magma body located beneath Cone D and the 2008 vents.
Mt. St. Helens, Washington – 2004 Eruption (Vent Elev. 2.1 km ASL)
Mt. St. Helens, Washington, began erupting on October 6, 2004 (Sherrod et al., 2008 and papers within this volume) (Figure 7) with a week-long explosive phase that then transitioned into a period of dome growth and destruction that lasted until 2008. Mt. St. Helens has been Level 3 seismically monitored since June 1980 (Malone et al., 1981), shortly after the beginning of its previous eruption in 1980–1986.
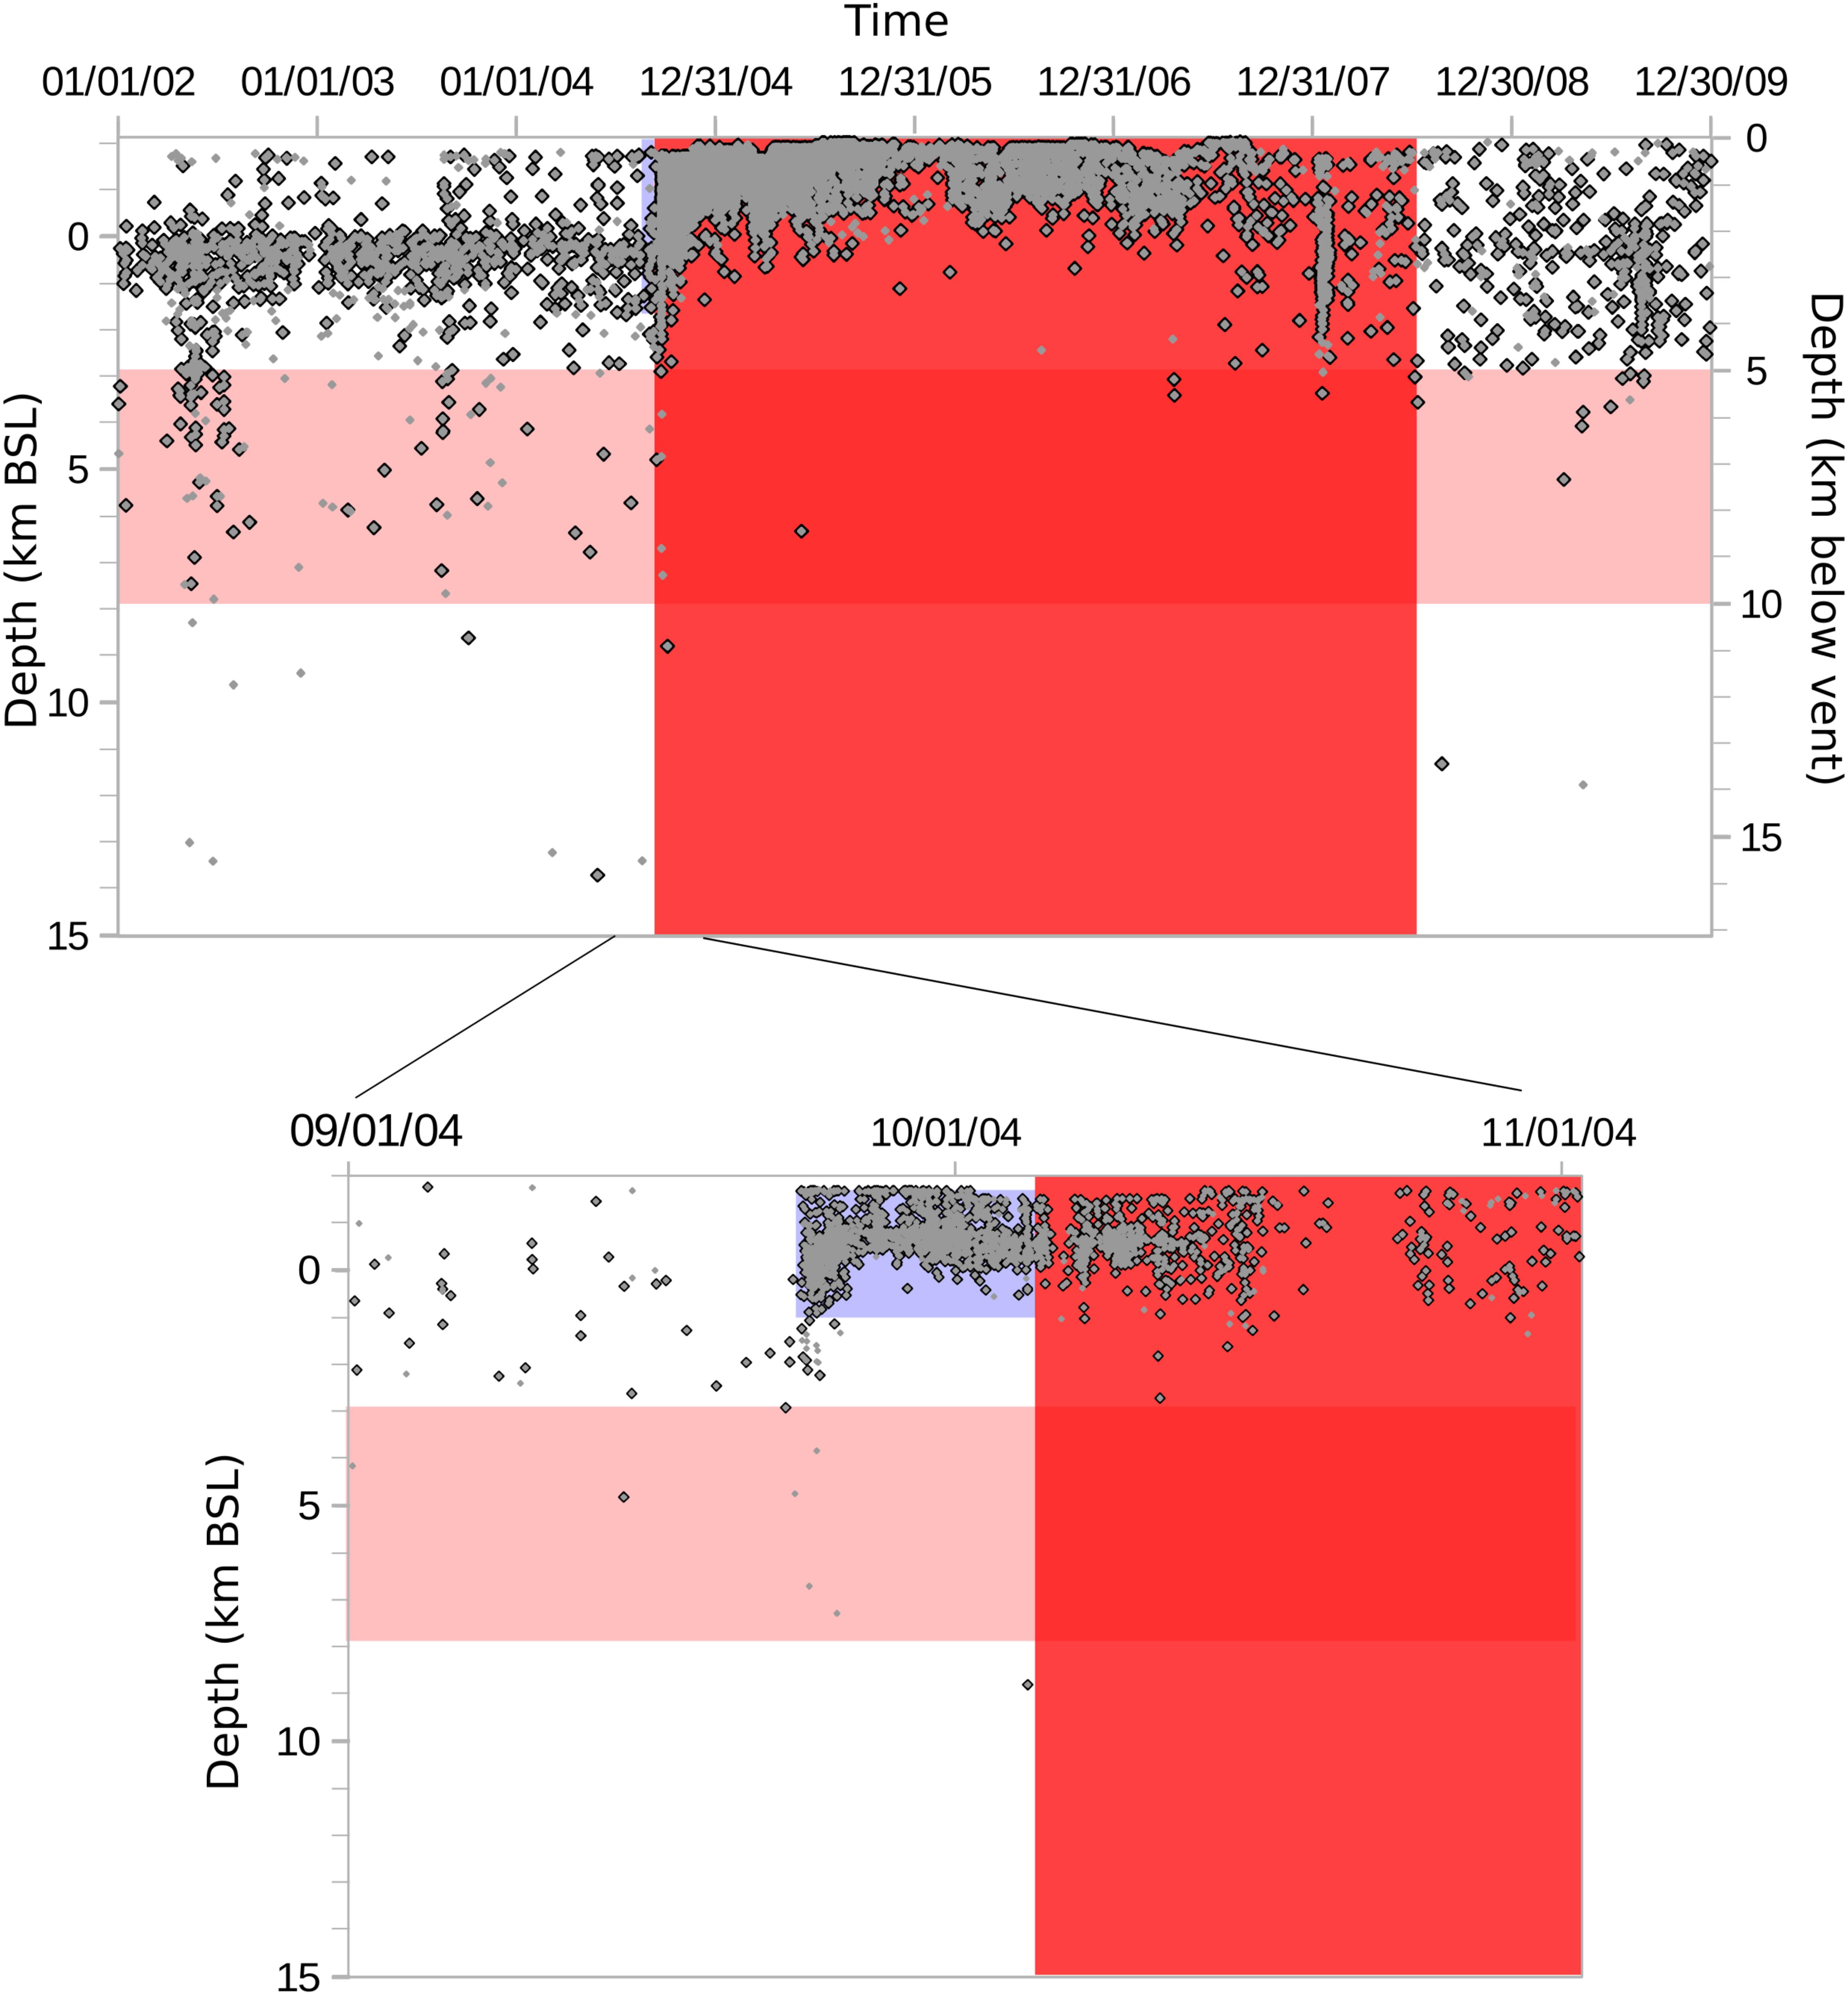
FIGURE 7. Time-depth plot for Mt. St. Helens, Washington, from January 2002 to December 2009. Light red – petrologically-defined magma source. Dark red – eruptions. Light blue shading shows the timing and depth of precursory seismicity. Gray dots show all earthquakes and black outlined dots show earthquakes with well-constrained locations. Inset panel shows detail of the runup and eruption onset. Earthquake data: University of Washington (1963) and Cascades Volcano Observatory [USGS] (2004).
The 1980 eruption was preceded by approximately 2 months of precursory seismic unrest and the growth of a conspicuous bulge on the north flank of the volcano. Although a Level 3 monitoring network did not exist during the precursory phase, initial seismicity and deformation appear to have been shallow (within and just below the edifice), and magma intrusion into the edifice appears to have occurred aseismically (Malone et al., 1981). Multiple phreatic explosions occurred during the precursory phase, and the eruption ultimately produced ∼0.2 km3 DRE of dacite. The eruption was triggered by edifice failure but required 3.5 h to construct a throughgoing conduit which ultimately tapped magma stored over a large vertical depth range (Blundy et al., 2008). Magma erupted in 1980 was low-Si dacite with no evidence for pre-eruptive mafic input (Blundy et al., 2008). Between 1987 and 2002, several swarms of VT earthquakes were recorded beneath the volcano at depths between 2 and 8 km BSL, and are interpreted as intrusions or pressurization of magma (Moran, 1994; Musumeci et al., 2002).
The first sign of unrest in 2004 was a swarm of shallow (<0 km BSL) VT earthquakes on September 23, 2004 (Moran et al., 2008b), approximately 1 km shallower than the location of long-term background microseismicity (Lehto et al., 2010). The swarm intensity increased and then declined over the next 48 h, leveling out at a steady rate by September 25. On September 25, LP seismicity joined continued VT seismicity, overtaking VT events as the dominant type of seismic event by October 5. The overall rate of seismicity continued to increase, with all events located above 2 km BSL. A small difference in P-wave arrival time differences between September 25 and 27 indicated either a decrease in shallow seismic velocities or a subtle shallowing of earthquake depths, which was followed by visible cracking in the crater glacier. Earthquake activity continued to the first phreatic explosion on October 1, which was immediately followed by seismic quiescence (Moran et al., 2008b). Shortly thereafter seismicity reintensified and was joined by strong tremor, leading to the onset of juvenile explosive activity on October 5. Syneruptive seismicity was dominated by less frequent and smaller shallow events, often comprising families of ‘drumbeat’ earthquakes (Moran et al., 2008b). VT events were relatively rare through the remainder of the eruption and those that were detected had shallow (<3 km BSL) depths, in contrast to syneruptive VTs during the 1980–1986 eruption which had depths to 8 km BSL.
The 2004–2008 eruption produced ∼0.1 km3 of homogeneous, crystal-rich dacitic magma, largely in the form of domes and spines extruded onto the crater floor (Pallister et al., 2008). The earliest erupted samples are glassier and more vesicular than later samples, but all have low volatile contents indicative of extensive shallow degassing-driven crystallization at around the level of VT seismicity (∼1 km BSL). The apparent low pressure of the latest phenocryst growth suggests that the magma was derived from depths of ∼5 km below the vent (∼3 km BSL). Temperatures, oxygen fugacities, PH2O (850°C, 10-12.4, and 130 MPa, respectively) also provide petrologic evidence for an origin depth of ∼3 km BSL (Rutherford and Devine, 2004), although the deep-sourced (∼5–12 km BSL) deflation of the volcano accompanying the precursory seismicity (Dzurisin et al., 2008; Lisowski et al., 2008) suggests a magma source at > ∼3 km BSL. The immediate triggering mechanism of the 2004 eruption is unclear – there is little evidence of a mafic intrusion beyond rare andesitic inclusions in some 2004 dacite samples indicative of mixing and quenching at some point in the dacite’s history. Magma erupted in 2004 is compositionally related to the 1980 magma, but slightly cooler and was stored at the upper depth (low pressure end) of the 1980 range.
Miyake-jima Volcano, Japan – 2000 Submarine/Summit Eruption and Dike Intrusion (Submarine Vent – 0 BSL, Summit Vent – 800 m ASL)
A submarine eruption occurred off the coast of Miyake-jima Volcano, Japan, on June 27, 2000 (Nakada and Druitt, 2005 and papers within this volume) (Figure 8). This eruption was followed by a large offshore dike intrusion and a phreatomagmatic eruption accompanying caldera formation at Miyake-jima’s summit in July and August 2000. Miyake-jima had not erupted since 1983, but was Level 3 monitored beginning in March 1999 (Ukawa et al., 2000). The 1983 eruption was preceded by a few hours of felt earthquakes (depth/location unknown) and involved basaltic fire fountaining on the flank of Miyake-jima island (Aramaki et al., 1986). On June 26, 2000, seismic activity began beneath the southwest flank of the island of Miyake-jima at a depth of ∼2–3 km BSL, with about 4,300 earthquakes registered within the first 24 h (Uhira et al., 2005). At the same time, GPS stations detected displacement on Miyake-jima island. On June 27, a strong earthquake to the west of Miyake-jima, coupled with observations of an area of discolored seawater and steam rising from the ocean surface, indicated that a submarine eruption had occurred approximately 1 km to the west of the island. ROV investigations later identified several craters on the ocean floor consisting of fresh spatter and lapilli (Kaneko et al., 2005). From June 27-July 1, a strong earthquake swarm propagated downwards and northwestward from Miyake-jima island, accompanied by deformation patterns suggesting offshore dike emplacement. Depths of these events range from 5 to 25 km BSL, with earthquake depths increasing with time. The intruded magma is thought to have been tapped partly from a chamber below Miyake-jima (Geshi et al., 2002), with additional magma sourced from beneath the dike (Yamaoka et al., 2005). On July 8, Miyake-jima volcano began a summit eruption, after which the summit collapsed as a caldera formed over the next 40 days. Seismicity accompanied caldera formation and summit eruptions extended from the vent down to approximately 5 km BSL. Continued eruptions at the summit ultimately produced 0.02 km3 of ejected tephra, and the eruption was followed by 4 years of elevated SO2 emissions.
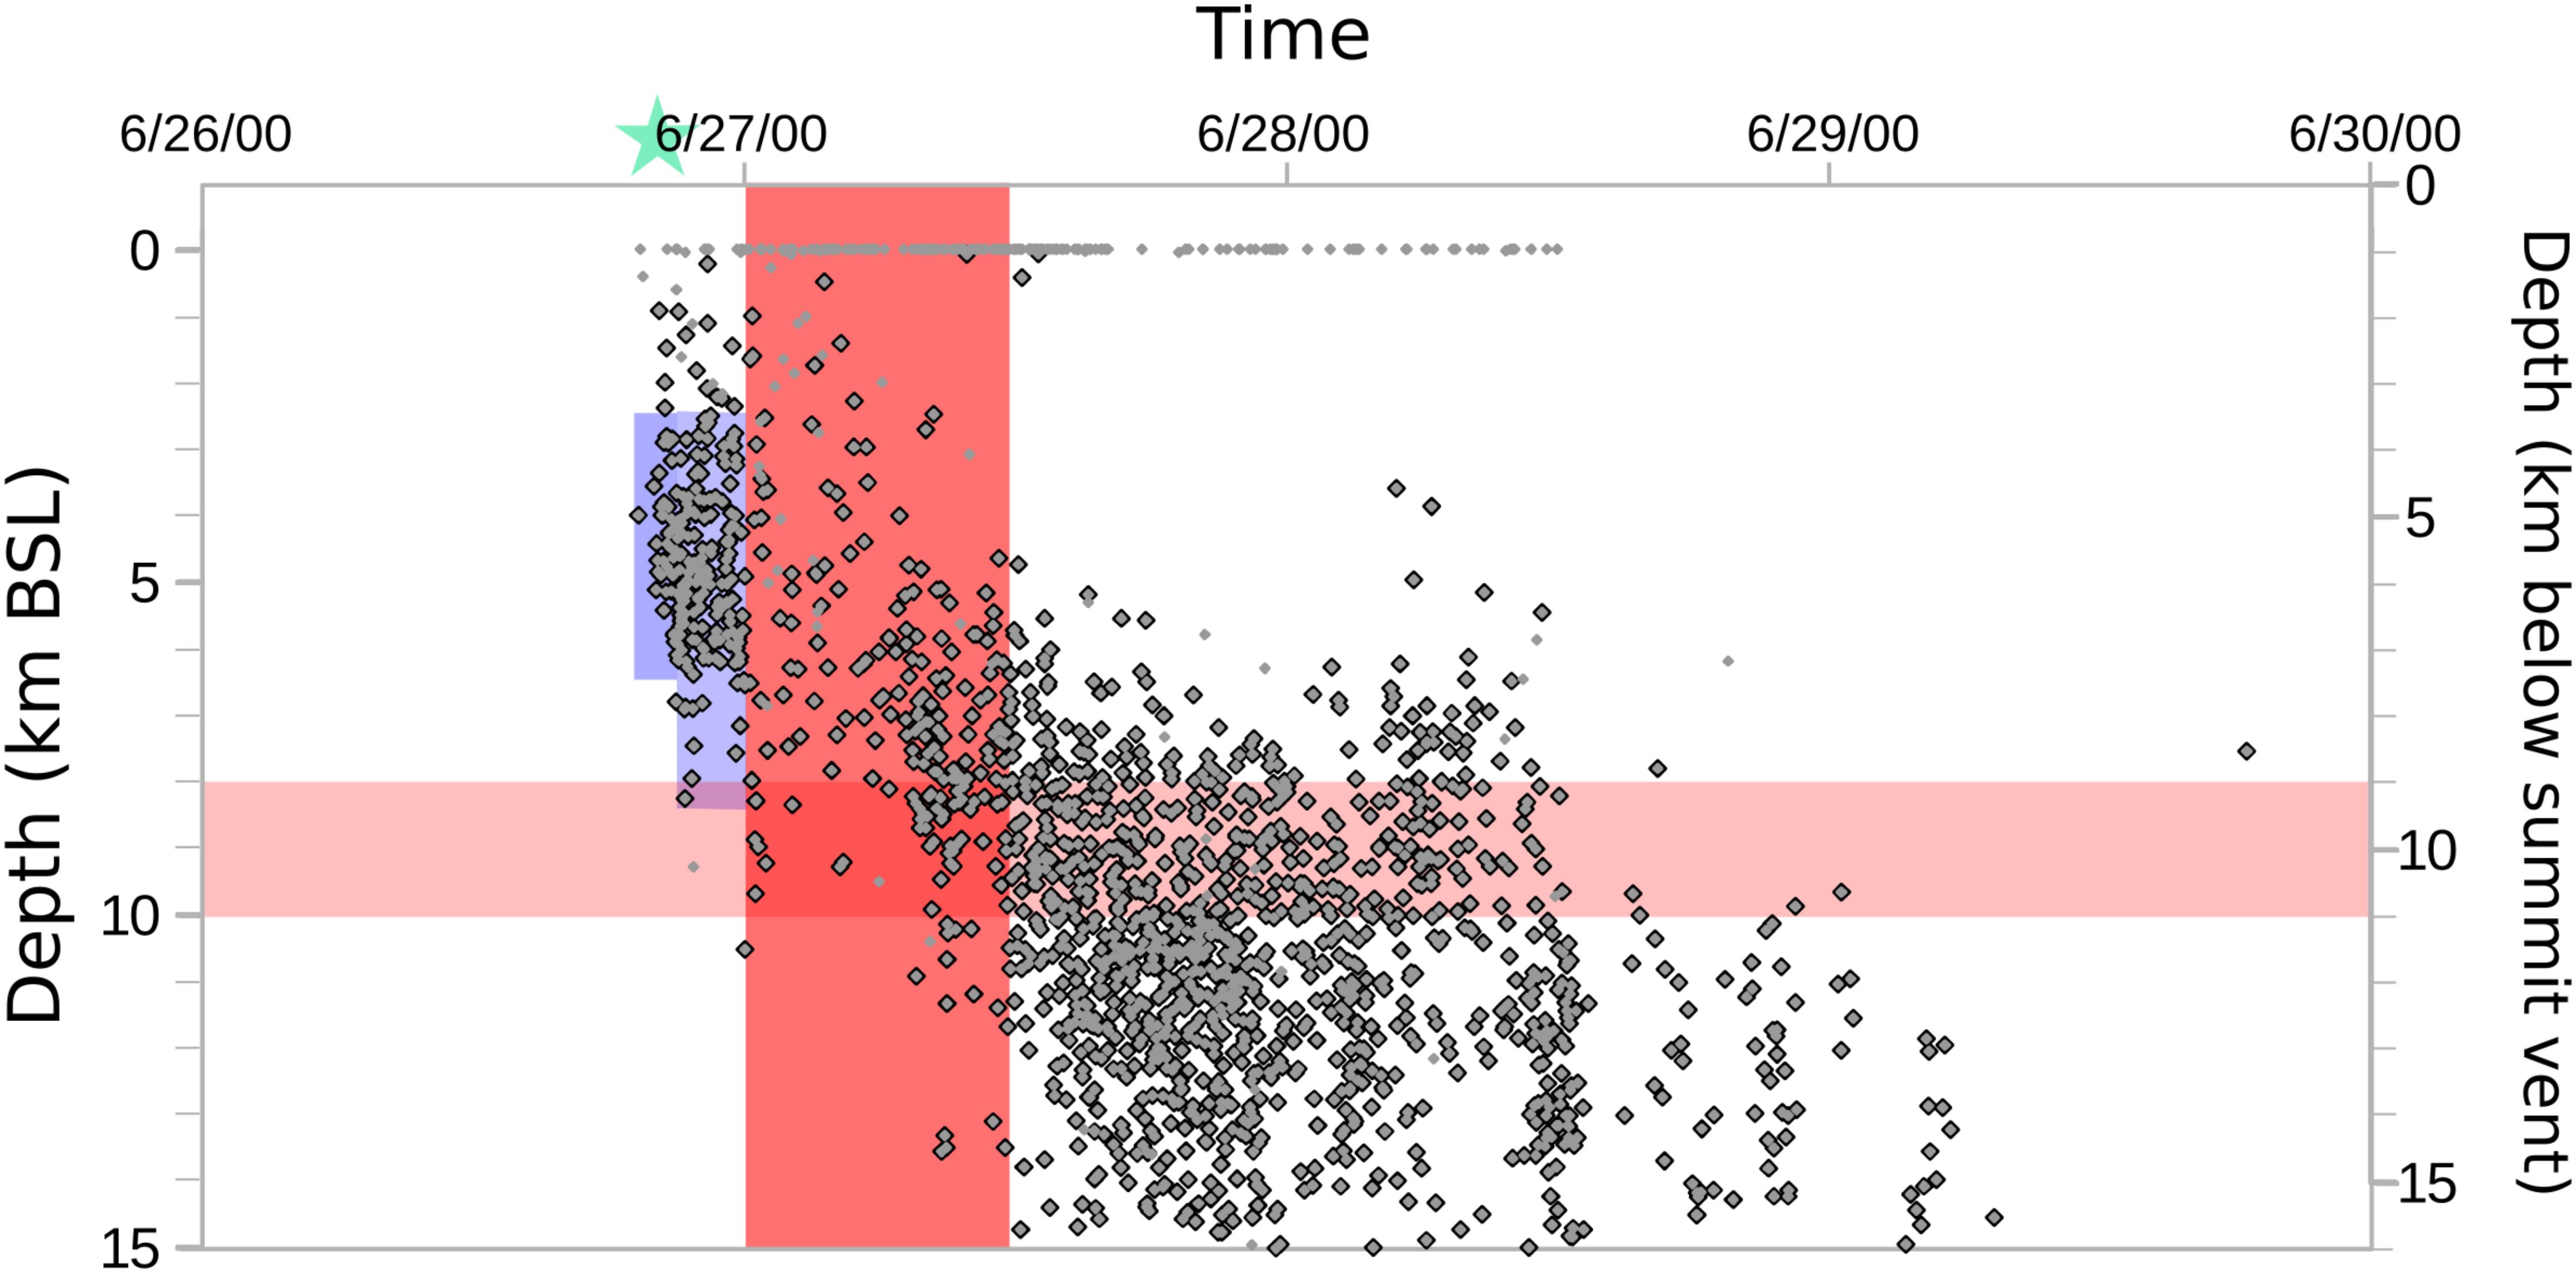
FIGURE 8. Time-depth plot for Miyake-jima Volcano, Japan, in late June 2000. Light red – petrologically-defined magma source. Dark red – eruptions. Light blue shading shows the timing and depth of precursory seismicity. Gray dots show all earthquakes and black outlined dots show earthquakes with well-constrained locations. Green star indicates onset of GPS-detected deformation.
The 2000 eruption of Miyake-jima produced both basaltic andesite (June 2000 submarine eruption) and basaltic (August 2000 summit eruption) juvenile material (Amma-Miyasaka et al., 2005; Kaneko et al., 2005). Petrological analyses indicate that a reservior of basaltic andesite magma containing residual magma from the 1983 eruption was intruded by a basalt sourced from a deeper reservoir at 8–10 km depth (Amma-Miyasaka et al., 2005; Kaneko et al., 2005; Saito et al., 2005). The depth of this reservoir is unconstrained by petrology; however, GPS vectors indicate a deflation source beneath Miyake-jima at 4.2 km BSL during the swarm (Nishimura et al., 2001). The injection of basalt from the deep magma chamber into the shallow chamber is thought to have occurred before the submarine eruption (Kaneko et al., 2005).
Discussion
Time-Depth Patterns of Precursory Unrest
Three of the six analyzed case studies demonstrate a clear ‘top–down’ pattern of precursory unrest, in which a shallow volume of crust hosts the earliest precursory seismicity, followed by seismicity over a wider range of depths. At Crater Peak, which was fed in 1992 by magma sourced from 10 km BSL, the earliest-detected precursory activity was a cluster of VT seismicity at 2–3 km BSL, with later precursory, syn- and post-eruptive seismic activity reaching depths of 10 km BSL. At Augustine, which was fed in 2006 by magma sourced from below 5 km BSL, the earliest-detected precursor was steadily-increasing VT seismicity at a depth of ∼1 km ASL, accompanied by shallow inflation. Seismic events with depths to 5 km were observed several weeks following the onset of eruptive activity. At Mt. St. Helens 2004–2008, the earliest-detected precursor was a swarm of shallow VTs at ∼1 km ASL, slightly above the depth of persistent background seismic events. No deep seismicity was observed during the 4-year-long eruption, but swarms in the 1986–2004 inter-eruptive period and 2008-present post-eruptive period have included earthquakes with depths down to 7 km BSL.
Observations at Redoubt and Miyake-jima also suggest a pattern of top–down precursory seismic activity associated with their most recent eruptions. Petrologic evidence suggests that magma erupted at Redoubt in 2009 migrated upward from an unknown depth to 1–4 km BSL approximately 6–8 months before the eruption, where it resided until erupting. The earliest seismic precursor for this eruption was a swarm of LP earthquakes in August–September 2008 that were too small to be located. Their occurrence coincided with the appearance of a thermal anomaly, suggesting activation of the shallow part of the plumbing system at this time. Later precursory and syneruptive seismicity reached 10 km BSL, below the depth of the initial LP swarm and the ultimate (inferred) staging region for the erupted magma. At Miyake-jima in 2000, both the precursory unrest and submarine eruption occurred within a 36-h period, followed by a months-long phase of dike intrusion and accompanying seismicity accompanied by caldera collapse and phreatic/phreatomagmatic eruptions. The eruption is thought to have been preceded by injection of basalt from a deep (8–10 km BSL) chamber into a shallower chamber containing residual magma before the submarine eruption. The initial seismic unrest constituted a cluster of VT earthquakes beneath the western flank of Miyake-jima at a depth of 2–3 km BSL (Uhira et al., 2005), with later seismicity beneath Miyake-jima reaching depths of ∼5 km BSL.
The 2008 eruption of Okmok shows no spatial pattern of seismic unrest. The few hours of seismicity that preceded this eruption spanned a depth range from the summit to 10 km BSL, well below the estimated 2–6 km BSL source region for this eruption. The epicenters of these events are located throughout the northern half of the caldera rather than clustered beneath the vent (Figure 6B), and it is possible that they represent slip on a ring fault rather than conduit formation, in which case conduit formation would have occurred aseismically. A study of precursory shear-wave splitting found no evidence for precursory aseismic magma ascent (Johnson et al., 2010), although additional work is required to understand the exact relationship of the precursory seismicity to magma transport. Regardless, while the Okmok example demonstrates that there is likely no single mechanism by which magma transport and eruption occurs, our survey indicates that a top–down pattern of precursory unrest may be predominant, at least at regularly erupting arc volcanoes. In the remainder of this paper we develop a model for this pattern and explore its implications for magma transport and eruption forecasting.
We note that, of our six case study eruptions, three of which (Crater Peak, Redoubt, and Augustine) had repose intervals of two decades or more, only two (Crater Peak and Augustine) were preceded by obvious distal VT seismicity. Furthermore, in both of these cases the distal VT seismicity was not the earliest reported seismic precursor – at Crater Peak a distal VT swarm occurred in March 1992 (Figure 3), 6 months after the onset of seismic unrest beneath the Crater Peak vent, and at Augustine a distal VT swarm occurred contemporaneously with proximal precursory seismicity (Fisher et al., 2010). Although Miyake-jima, 2000 is listed by White and McCausland (2016) as having precursory distal VT seismicity, the events in question actually occurred within 1 km of the submarine vent for this eruption (Kaneko et al., 2005; Uhira et al., 2005), highlighting ambiguities in their definition of what constitutes ‘distal’ VT seismicity.
Conceptual Model of Magma Ascent and Eruption
A key question in interpreting the apparent top–down pattern of precursory seismicity is the spatial relationship between VT earthquakes and magma. VT earthquakes may result from an increase in stress in the host rock surrounding an intruding or pressurizing magma body (e.g., Bonafede and Danesi, 1997). VTs may also result from an increase in the pore pressure caused by the addition of gas and/or heat, which creates a lower slip threshold on faults in response to ambient stresses. These two mechanisms produce VTs with differently-oriented fault-plane solutions. As magmatic conduits inflate in the direction of regional minimum compression, the fault-plane solution for a VT caused by magma intrusion will have a P-axis aligned with the regional minimum compressive stress. An increase in pore pressure, however, produces VTs with fault-plane solutions consistent with the regional stress field (P-axes parallel to regional maximum compression).
Several lines of evidence indicate that initial shallow VT seismicity at our case study volcanoes is the result of shallow magma intrusion (i.e., VT earthquakes are proximal to intruding magma) rather than advection of gas and heat into a shallow hydrothermal system. First, none of the six case study volcanoes have extensive hydrothermal systems such as those at Yellowstone and Long Valley Caldera, where seismic swarms are inferred to result from perturbations to the hydrothermal system (Waite and Smith, 2002; Hill and Prejean, 2005). Second, initial shallow VTs at Spurr (Roman et al., 2004), MSH (Lehto et al., 2010), and Okmok (Ohlendorf et al., 2014) have fault-plane solutions with P-axes that are rotated by 90° with respect to regional maximum compression, a pattern that has been linked to proximal dike inflation (Roman and Cashman, 2006). An in-depth analysis of fault-plane solution orientations at Augustine does not yet exist – however, the onset of shallow seismicity in 2005 was accompanied by GPS-detected inflation with a modeled source located within the volcanic edifice (Cervelli et al., 2006). At Redoubt, early stress field reorientation was detected through analysis of shear-wave splitting (Roman and Gardine, 2013) but the depth of the stressed rock cannot easily be localized along the raypath. Additional work to constrain the depth of the stressed region, using a technique such as seismic interferometry, is thus warranted but beyond the scope of the present study. At Miyake-jima, initial fault-plane solutions are not rotated with respect to the regional stress field; however, stress field rotations are generally not observed preceding basaltic eruptions (Roman and Cashman, 2006); again, additional analysis to constrain the depth of pressurizing magma are warranted. Overall, however, geophysical evidence points to co-located shallow VT seismicity and pressurizing magma in the majority of our analyzed case studies.
Observations of top–down seismicity/magmatic unrest thus suggest a three-phase process of unrest and eruption, which we illustrate in Figure 9. Phase 1 (the ‘Staging’ phase) involves movement of magma from the mid- to shallow crust. Staging may be accomplished seismically or aseismically depending on its timing relative to eruption. One possibility is that upward magma movement is accompanied by seismic unrest either at the end of the previous eruption or during an intereruptive period, but not during the immediate run-up to eruption. There is strong evidence for both the former and the latter case at (1) Mt. St. Helens in 2004, where strong seismic swarms in 1990–1991 and 1998 with earthquake depths ranging from 0 to 7 km BSL may represent upward transfer of magma intro a shallow reservoir (Moran, 1994; Musumeci et al., 2002), and (2) Augustine, where a swarm in December 1996 includes earthquakes with depths to 15 km BSL. Alternatively, magma may be shallow-staged by moving up immediately before the onset of precursory unrest, but at a rate or volume that is too slow/small to produce detectable seismicity. Evidence for slow aseismic magma ascent prior to the 2009 Redoubt eruption includes rotated fast split S-wavelets indicative of mid-crustal dike inflation starting in mid-2008 (Roman and Gardine, 2013). We note that the above staging mechanisms are not mutually exclusive and one or more may be active at a given volcano prior to eruption.
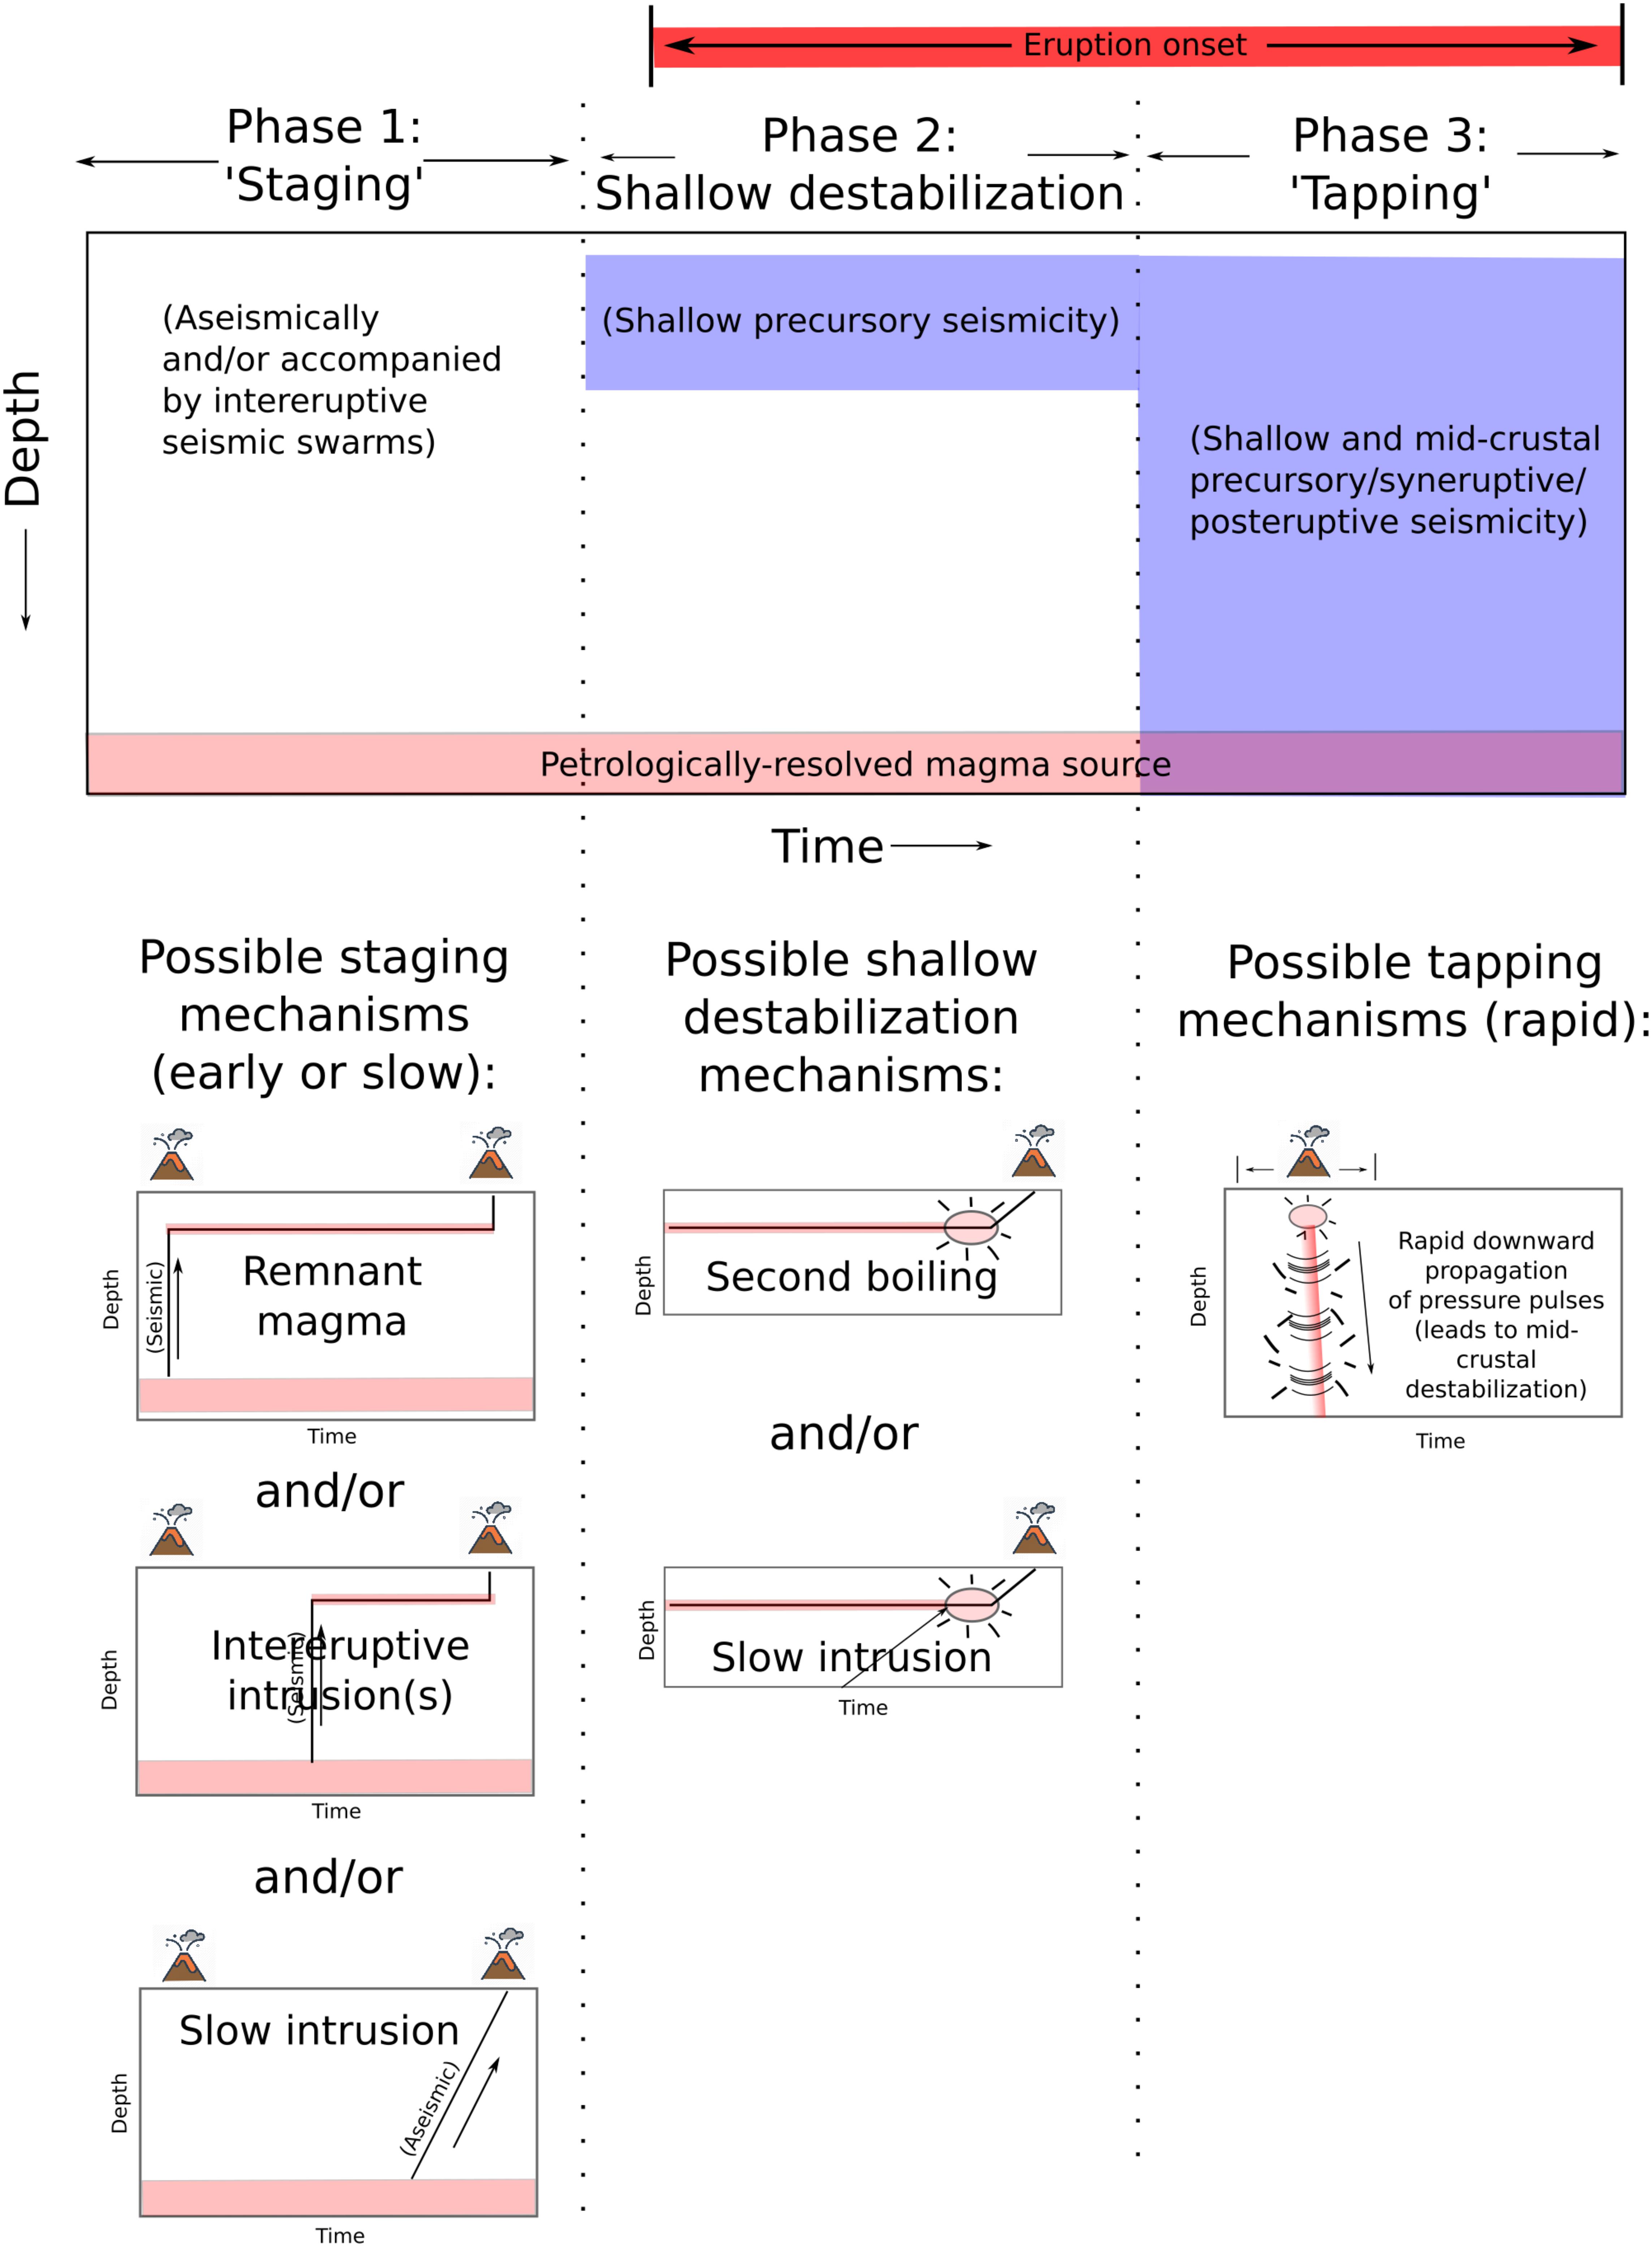
FIGURE 9. Cartoon illustrating a proposed three-phase model for magma ascent and eruption. Top panel shows a schematic time-depth plot illustrating observed patterns of seismicity relative to the magma source, which define three phases of magmatic activity. Bottom panel shows possible mechanisms for each phase, which are not mutually exclusive and can act alone or in combination. The upper red bar indicates the time window during which eruption may begin (i.e., eruption may start any time after the onset of Phase 2).
Phase 2 (the ‘Destabilization’ phase) triggers shallow seismic unrest through a marked increase in pressure in the shallowly-staged magma body. Destabilization may occur through primary magma vesiculation or second boiling because of continued crystallization (e.g., Stock et al., 2016), continued slow (aseismic) intrusion of shallow chamber that eventually exceeds the strength of the shallow host rock, or even quiescent degassing (Girona et al., 2015). Again, these processes are not mutually exclusive. Furthermore, both staging and subsequent shallow destabilization could be accomplished by a relatively small ‘quantum’ of vanguard magma (i.e., the ‘quanta’ of Scandone et al., 2007), with the deeper source ultimately providing the bulk of the erupted products.
Phase 3 involves upper-crustal reservoir destabilization and ultimately ‘tapping’ of that reservoir, leading to seismic unrest over a wide depth range, as well as upward movement and eruption of additional magma, which may by volume represent the bulk of the erupted products. Upper-crustal reservoir destabilization may occur by stress transfer from the shallow volume of staged/destabilized magma through host rock to a largely-disconnected deeper reservoir, or by transmission of a pressure pulse through a continuous mush column (e.g., Cashman et al., 2017; Shapiro et al., 2017; Sparks and Cashman, 2017), and occur either before the eruption onset or once the eruption has started (e.g., Tarasewicz et al., 2012).
As a caveat, we note that this conceptual model is based entirely on observations from volcanoes that are relatively frequently active (i.e., volcanoes that erupt every few decades) as this is the reason for the presence of a Level 3 seismic monitoring network prior to the onset of unrest. Thus, the proposed three-phase process of magma ascent and eruption may be specific to volcanoes with an already mechanically weakened or remnant conduit and shallow-stored magma from a previous eruption, and not to long-dormant volcanoes awakening for the first time in centuries or millenia. That said, there is evidence from much larger, and more infrequent, eruptions that early migration of magma to shallow levels may have ultimately helped to trigger eruptive activity. For example, the 1980 eruption of Mount St. Helens was preceded by intrusion of magma into the volcanic edifice at least 2 months prior to the eruption (e.g., Scandone et al., 2007), and lacked sufficient seismicity for detection on the regional seismic network. Similarly, the 1991 eruption of Mt. Pinatubo was clearly preceded by upward movement of magma, which first appeared at the surface as a dome, 2 days before the start of explosive activity. Much larger eruptions may also require initial ‘priming’ by either upward migration of small, and often hotter and/or more primitive magma (e.g., Cerro Galan: Wright et al., 2011; Druitt, 2014) or by rifting-assisted lateral magma migration (e.g., Allan et al., 2012).
Implications for Volcano Monitoring and Eruption Forecasting
Our proposed three-phase model for magma ascent and eruption has two main implications for eruption forecasting at volcanoes that erupt relatively frequently. The first is that it may be possible to detect precursory unrest before the onset of seismic activity. We note that at Redoubt, the earliest detected precursors were not seismic unrest, but deformation and increased gas emission. Even at a volcano that is only seismically monitored, aseismic staging via slow initial magma ascent may be detectable with continuous local stress field monitoring around the volcano, which may be expressed as changes in seismic velocity detectable using seismic interferometry or changes in shear-wave splitting of regional earthquakes (e.g., Brenguier et al., 2008; Roman and Gardine, 2013; Rasmussen et al., 2018). Alternatively, where staging is accomplished during the inter-eruptive cycle, as at Mt. St. Helens, relatively small-scale earthquake swarms may be taken as an indicator of the intermediate-term (e.g., years-long) eruption potential, as they may represent charging of a shallow reservoir. This implication is consistent with recent observations of precursory volcanic unrest worldwide, which indicate longer mean durations for precursory deformation (932 days) and degassing (282 days) than for precursory seismic unrest (197 days) (Phillipson et al., 2013). The second implication is that the onset of deeper seismicity during an unrest episode may function as a short-term indicator of impending eruption, although deeper seismicity preceded eruption at Redoubt and Spurr by almost 2 months, and occurred only after eruption onset at Augustine and MSH 1980, and not at all at Mt. St. Helens 2004. However, additional analysis is needed to fully explore this possibility.
A final point relates to attempts to reconcile geophysical and petrological constraints on pre-eruptive magma storage regions. First, as mentioned above, the shallow magma intrusion responsible for precursory activity may represent only a small fraction of the total erupted volume. Second, it is often preserved only in the early erupted units, and can be dense (degassed and partially crystalline); for this reason, such material is commonly overlooked, with more obvious juvenile vesicular pumice chosen for study. Third, growing evidence that many of the crystals found in magma are antecrysts (were entrained from different parts of the magmatic system) means that experimental pre-eruptive storage conditions should be designed to determine local, not total, chemical equilibrium (Pichavant et al., 2007). These points are illustrated by our case study volcanoes, where petrological estimates of bulk magma storage often agree with syn- and post-eruptive geophysical estimates from seismicity and deformation.
Summary
We compare time-depth patterns of precursory seismicity and petrologically-constrained magma reservoir depths and find that in the majority of six examined cases, initial precursory seismicity is proximal to the vent and several km shallower than estimated reservoir depths. The implication is that precursory seismicity does not reflect initial conduit formation, nor, by implication, reservoir destabilization. Rather, we suggest that reservoir destabilization and initial conduit formation may occur either aseismically, or long before the immediate seismic run-up to eruption. We propose a three-stage model of precursory magma ascent and eruption, involving a staging of magma at upper-crustal levels followed by a period of destabilization of the shallowly-staged magma, leading to tapping of deeper portions of the reservoir. Our model implies that the staging phase, if detectable, may provide long-term warning of an eruption compared to the onset of precursory seismicity. Furthermore, it is possible that precursory seismicity may be distinguishable from non-eruptive episodes of unrest by its characteristic shallow depth.
Author Contributions
Both authors contributed extensively to the work presented in this paper.
Conflict of Interest Statement
The authors declare that the research was conducted in the absence of any commercial or financial relationships that could be construed as a potential conflict of interest.
Acknowledgments
Thank you to John Power for insights into the Alaskan case studies and to Wes Thelen for providing seismic data for Mt. St. Helens. Thank you also to the two reviewers whose constructive comments greatly improved the manuscript.
References
Allan, A. S., Wilson, C. J., Millet, M. A., and Wysoczanski, R. J. (2012). The invisible hand: tectonic triggering and modulation of a rhyolitic supereruption. Geology 40, 563–566. doi: 10.1130/G32969.1
Amma-Miyasaka, M., Nakagawa, M., and Nakada, S. (2005). Magma plumbing system of the 2000 eruption of Miyakejima Volcano, Japan. Bull. Volcanol. 67, 254–267. doi: 10.1007/s00445-004-0408-0
Aramaki, S., Hayakawa, Y., Fujii, T., Nakamura, K., and Fukuoka, T. (1986). The October 1983 eruption of Miyakejima volcano. J. Volcanol. Geotherm. Res. 29, 203–229. doi: 10.1016/0377-0273(86)90045-4
Barker, S. J., Wilson, C. J., Morgan, D. J., and Rowland, J. V. (2016). Rapid priming, accumulation, and recharge of magma driving recent eruptions at a hyperactive caldera volcano. Geology 44, 323–326. doi: 10.1130/G37382.1
Battaglia, J., Ferrazzini, V., Staudacher, T., Aki, K., and Cheminée, J. L. (2005). Pre-eruptive migration of earthquakes at the piton de la Fournaise volcano (Réunion Island). Geophys. J. Int. 161, 549–558. doi: 10.1111/j.1365-246X.2005.02606.x
Blundy, J., Cashman, K. V., Berlo, K., Sherrod, D. R., Scott, W. E., and Stauffer, P. H. (2008). “Evolving magma storage conditions beneath Mount St. Helens inferred from chemical variations in melt inclusions from the 1980–1986 and current (2004–2006) eruptions,” in A Volcano Rekindled: The Renewed Eruption of Mount St. Helens, 2004-2006, eds D. R. Sherrod, W. E. Scott, and P. H. Stauffer (Reston, VA: U.S. Geol. Surv), 755–790.
Bonafede, M., and Danesi, S. (1997). Near-field modifications of stress induced by dyke injection at shallow depth. Geophys. J. Int. 130, 435–448. doi: 10.1111/j.1365-246X.1997.tb05659.x
Brenguier, F., Shapiro, N. M., Campillo, M., Ferrazzini, V., Duputel, Z., Coutant, O., et al. (2008). Towards forecasting volcanic eruptions using seismic noise. Nat. Geosci. 1, 126–130. doi: 10.1038/ngeo104
Bull, K. F., and Buurman, H. (2013). An overview of the 2009 eruption of Redoubt Volcano, Alaska. J. Volcanol. Geotherm. Res. 259, 2–15. doi: 10.1016/j.jvolgeores.2012.06.024
Caricchi, L., Annen, C., Blundy, J., Simpson, G., and Pinel, V. (2014). Frequency and magnitude of volcanic eruptions controlled by magma injection and buoyancy. Nat. Geosci. 7, 126–130. doi: 10.1038/ngeo2041
Cascades Volcano Observatory [USGS] (2004). Cascade Chain Volcano Monitoring. International Federation of Digital Seismograph Networks. Other Seismic Network. Reston, VA: USGS.
Cashman, K. V., and Giordano, G. (2014). Calderas and magma reservoirs. J. Volcanol. Geotherm. Res. 288, 28–45. doi: 10.1016/j.jvolgeores.2014.09.007
Cashman, K. V., Sparks, R. S. J., and Blundy, J. D. (2017). Vertically extensive and unstable magmatic systems: a unified view of igneous processes. Science 355:eaag3055. doi: 10.1126/science.aag3055
Cervelli, P. F., Fournier, T. J., Freymueller, J. T., Power, J. A., Lisowski, M., and Pauk, B. A. (2006). “Geodetic constraints on magma movement and withdrawal during the 2006 eruption of Augustine Volcano,” in The 2006 Eruption of Augustine Volcano, Alaska, eds J. A. Power, M. L. Coombs, and J. T. Freymueller (Reston, VA: U.S. Geol. Surv), 427–452.
Chouet, B. A., and Matoza, R. S. (2013). A multi-decadal view of seismic methods for detecting precursors of magma movement and eruption. J. Volcanol. Geotherm. Res. 252, 108–175. doi: 10.1016/j.jvolgeores.2012.11.013
Coombs, M. L., Neal, C. A., Wessels, R. L., and McGimsey, R. G. (2006). Geothermal Disruption of Summit Glaciers at Mount Spurr Volcano, 2004–6: An Unusual Manifestation of Volcanic Unrest. Reston, VA: U.S. Geol. Survey.
Coombs, M. L., Sisson, T. W., Bleick, H. A., Henton, S. M., Nye, C. J., Payne, A. L., et al. (2013). Andesites of the 2009 eruption of Redoubt Volcano, Alaska. J. Volcanol. Geotherm. Res. 259, 349–372. doi: 10.1016/j.jvolgeores.2012.01.002
Dixon, J. P., Stihler, S. D., Power, J. A., Haney, M., Parker, T., Searcy, C. K., et al. (2013). Catalog of Earthquake Hypocenters at Alaskan Volcanoes: January 1 through December 31, 2012. Reston, VA: U.S. Geol. Surv.
Druitt, T. H. (2014). New insights into the initiation and venting of the Bronze-Age eruption of Santorini (Greece), from component analysis. Bull. Volcanol. 76:794. doi: 10.1007/s00445-014-0794-x
Druitt, T. H., Costa, F., Deloule, E., Dungan, M., and Scaillet, B. (2012). Decadal to monthly timescales of magma transfer and reservoir growth at a caldera volcano. Nat. 482, 77–82. doi: 10.1038/nature10706
Dzurisin, D. (2006). Volcano Deformation: New Geodetic Monitoring Techniques. Berlin: Springer Science and Business Media. doi: 10.1007/978-3-540-49302-0
Dzurisin, D., Lisowski, M., Poland, M., Sherrod, D. R., and LaHusen, R. G. (2008). “Constraints and conundrums posed by Ground Deformation Measurements during the 2004–2005 dome-building eruption of Mount St. Helens, Washington,” in A Volcano Rekindled: The Renewed Eruption of Mount St. Helens, 2004-2006, eds D. R. Sherrod, W. E. Scott, and P. H. Stauffer (Reston, VA: U.S. Geol. Surv), 281–300.
Edmonds, M., and Wallace, P. J. (2017). Volatiles and exsolved vapor in volcanic systems. Elements 13, 29–34. doi: 10.2113/gselements.13.1.29
Eichelberger, J. C., Keith, T. E., Miller, T. P., and Nye, C. J. (1995). “The 1992 eruptions of Crater Peak vent, Mount Spurr volcano, Alaska: chronology and summary,” in The 1992 Eruptions of Crater Peak Vent, Mount Spurr Volcano, Alaska, ed. T. E. C. Keith (Reston, VA: U.S. Geol. Surv), 1–18.
Fisher, M. A., Ruppert, N. A., White, R. A., Sliter, R. W., and Wong, F. L. (2010). “Distal volcano-tectonic seismicity near Augustine Volcano,” in The 2006 Eruption of Augustine Volcano, Alaska, eds J. A. Power, M. L. Coombs, and J. T. Freymueller (Reston, VA: U.S. Geol. Surv), 119–128.
Gardner, C. A., Cashman, K. V., and Neal, C. A. (1998). Tephra-fall deposits from the 1992 eruption of Crater Peak, Alaska: implications of clast textures for eruptive processes. Bull. Volcanol. 59, 537–555. doi: 10.1007/s004450050208
Geshi, N., Shimano, T., Chiba, T., and Nakada, S. (2002). Caldera collapse during the 2000 eruption of Miyakejima Volcano, Japan. Bull. Volcanol. 64, 55–68. doi: 10.1007/s00445-001-0184-z
Girona, T., Costa, F., and Schubert, G. (2015). Degassing during quiescence as a trigger of magma ascent and volcanic eruptions. Sci. Rep. 5:18212. doi: 10.1038/srep18212
Grapenthin, R., Freymueller, J. T., and Kaufman, A. M. (2013). Geodetic observations during the 2009 eruption of Redoubt Volcano. Alaska. J. Volcanol. Geotherm. Res. 259, 115–132. doi: 10.1016/j.jvolgeores.2012.04.021
Grove, T. L., Donnelly-Nolan, J. M., and Housh, T. (1997). Magmatic processes that generated the rhyolite of Glass Mountain, Medicine Lake volcano, N. California. Contrib. Mineral. Petr. 127, 205–223. doi: 10.1007/s004100050276
Hammer, J. E., and Rutherford, M. J. (2003). Petrologic Indicators of preeruption magma dynamics. Geology 31, 79–82 doi: 10.1130/0091-7613(2003)031<0079:PIOPMD>2.0.CO;2
Harbin, M. L., Swanson, S. E., Nye, C. J., and Miller, T. P. (1995). “Preliminary petrology and chemistry of proximal eruptive products; 1992 eruptions of Crater Peak, Mount Spurr Volcano, Alaska,” in The 1992 Eruptions of Crater Peak Vent, Mount Spurr Volcano, Alaska, ed. T. E. C. Keith (Reston VA: U.S. Geol. Surv), 139–148.
Hill, D. P., and Prejean, S. (2005). Magmatic unrest beneath Mammoth Mountain, California. J. Volcanol. Geotherm. Res. 146, 257–283. doi: 10.1016/j.jvolgeores.2005.03.002
Hotovec, A. J., Prejean, S. G., Vidale, J. E., and Gomberg, J. (2013). Strongly gliding harmonic tremor during the 2009 eruption of Redoubt Volcano. J. Volcanol. Geotherm. Res. 259, 89–99. doi: 10.1016/j.jvolgeores.2012.01.001
Johnson, J. H., Prejean, S., Savage, M. K., and Townend, J. (2010). Anisotropy, repeating earthquakes, and seismicity associated with the 2008 eruption of Okmok volcano, Alaska. J. Geophys. Res. 115:B00B04. doi: 10.1029/2009JB006991
Kaneko, T., Yasuda, A., Shimano, T., Nakada, S., Fujii, T., Kanazawa, T., et al. (2005). Submarine flank eruption preceding caldera subsidence during the 2000 eruption of Miyakejima Volcano, Japan. Bull. Volcanol. 67, 243–253. doi: 10.1007/s00445-004-0407-1
Keith, T. E. C. (1995). The 1992 Eruptions of Crater Peak Vent, Mount Spurr Volcano, Alaska. Reston, VA: U.S. Geol. Surv.
Keith, T. E. C., Thompson, J. M., and McGimsey, R. G. (1995). “Chemistry of Crater Lake Waters Prior to the 1992 Eruptions of Crater Peak, Mount Spurr Volcano, Alaska,” in The 1992 Eruptions of Crater Peak Vent, Mount Spurr Volcano, Alaska, ed. T. E. C. Keith (Reston VA: U.S. Geol. Surv), 59–64.
Ketner, D., and Power, J. (2013). Characterization of seismic events during the 2009 eruption of Redoubt Volcano, Alaska. J. Volcanol. Geotherm. Res. 259, 45–62. doi: 10.1016/j.jvolgeores.2012.10.007
Kilburn, C. R. (2003). Multiscale fracturing as a key to forecasting volcanic eruptions. J. Volcanol. Geotherm. Res. 125, 271–289. doi: 10.1016/S0377-0273(03)00117-3
Kilgour, G. N., Saunders, K. E., Blundy, J. D., Cashman, K. V., Scott, B. J., and Miller, C. A. (2014). Timescales of magmatic processes at Ruapehu volcano from diffusion chronometry and their comparison to monitoring data. J. Volcanol. Geotherm. Res. 288, 62–75. doi: 10.1016/j.jvolgeores.2014.09.010
Koulakov, I., West, M., and Izbekov, P. (2013). Fluid ascent during the 2004-2005 unrest at Mt. Spurr inferred from seismic tomography. Geophys. Res. Lett. 40, 4579–4582. doi: 10.1002/grl.50674
Larsen, J. F., Nye, C. J., Coombs, M. L., Tilman, M., Izbekov, P., and Cameron, C. (2010). “Petrology and geochemistry of the 2006 eruption of Augustine Volcano,” in The 2006 Eruption of Augustine Volcano, Alaska, eds J. A. Power, M. L. Coombs, and J. T. Freymueller (Reston VA: U.S. Geol. Surv), 335–382.
Larsen, J. F., Śliwiński, M. G., Nye, C., Cameron, C., and Schaefer, J. R. (2013). The 2008 eruption of Okmok Volcano, Alaska: petrological and geochemical constraints on the subsurface magma plumbing system. J. Volcanol. Geotherm. Res. 264, 85–106. doi: 10.1016/j.jvolgeores.2013.07.003x
Lee, C.-W., Lu, Z., Jong, H.-S., Won, J.-S., and Dzurisin, D. (2010). “Surface Deformation of Augustine Volcano, 1992-2005, from Multiple-Interferogram Processing Using a Refined Small Baseline Subset (SBAS) Interferometric Synthetic Aerture Radar (InSAR) Approach,” in The 2006 Eruption of Augustine Volcano, Alaska, eds J. A. Power, M. L. Coombs, and J. T. Freymueller (Reston VA: U.S. Geol. Surv), 453–464.
Lehto, H. L., Roman, D. C., and Moran, S. C. (2010). Temporal changes in stress preceding the 2004–2008 eruption of Mount St. Helens, Washington. J. Volcanol. Geotherm. Res. 198, 129–142. doi: 10.1016/j.jvolgeores.2010.08.015
Lisowski, M., Dzurisin, D., Denlinger, R. P., and Iwatsubo, E. Y. (2008). “Analysis of GPS-measured deformation associated with the 2004–2006 dome-building eruption of Mount St. Helens, Washington,” in A Volcano Rekindled: The Renewed Eruption of Mount St. Helens, 2004-2006, eds D. R. Sherrod, W. E. Scott, and P. H. Stauffer (Reston VA: U.S. Geol. Surv), 301–316.
Lowenstern, J. B. (2003). Melt inclusions come of age: volatiles, volcanoes, and Sorby’s legacy. Devel. Volcanol. 5, 1–21. doi: 10.1016/S1871-644X(03)80021-9
Malone, S. D., Weaver, C., and Endo, E. (1981). Seismic details of the May 18, 1980 cataclysmic eruption of Mount St. Helens. Eos 62, 62.
Masterlark, T., Haney, M., Dickinson, H., Fournier, T., and Searcy, C. (2010). Rheologic and structural controls on the deformation of Okmok volcano, Alaska: FEMs, InSAR, and ambient noise tomography. J. Geophys. Res. 115:B02490. doi: 10.1029/2009JB006324
Miller, T. P., and Chouet, B. A. (1994). The 1989–1990 eruptions of Redoubt Volcano: an introduction. J. Volcanol. Geotherm. Res. 62, 1–10. doi: 10.1016/0377-0273(94)90025-6
Moran, S. C. (1994). Seismicity at Mount St. Helens, 1987–1992: evidence for repressurization of an active magmatic system. J. Geophys. Res. 99, 4341–4354. doi: 10.1029/93JB02993
Moran, S. C., Freymueller, J. T., LaHusen, R. G., McGee, K. A., Poland, M. P., Power, J. A., et al. (2008a). Instrumentation Recommendations for Volcano Monitoring at US Volcanoes Under the National Volcano Early Warning System. Reston VA: U.S. Geol. Surv,
Moran, S. C., Malone, S. D., Qamar, A. I., Thelen, W. A., Wright, A. K., and Caplan-Auerbach, J. (2008b). “Seismicity associated with renewed dome building at Mount St. Helens, 2004–2005,” in A Volcano Rekindled: The Renewed Eruption of Mount St. Helens, 2004–2006, eds D. R. Sherrod, W. E. Scott, and P. H. Stauffer (Reston VA: U.S. Geol. Surv), 27–60.
Moran, S. C., Newhall, C., and Roman, D. C. (2011). Failed magmatic eruptions: late-stage cessation of magma ascent. Bull. Volcanol. 73, 115–122. doi: 10.1007/s00445-010-0444-x
Morgan, D. J., Blake, S., Rogers, N. W., DeVivo, B., Rolandi, G., Macdonald, R., et al. (2004). Time scales of crystal residence and magma chamber volume from modelling of diffusion profiles in phenocrysts: Vesuvius 1944. Earth Planet Sci. Lett. 222, 933–946. doi: 10.1016/j.epsl.2004.03.030
Musumeci, C., Gresta, S., and Malone, S. D. (2002). Magma system recharge of Mount St. Helens from precise relative hypocenter location of microearthquakes. J. Geophys. Res. 107, 2264. doi: 10.1029/2001JB000629
Nakada, S., and Druitt, T. (2005). Special issue: The 2000 eruption of Miyakejima volcano, Japan. Bull. Volcanol. 67, 203–204. doi: 10.1007/s00445-004-0403-5
Nishimura, T., Ozawa, S., Murakami, M., Sagiya, T., Tada, T., Kaidzu, M., et al. (2001). Crustal deformation caused by magma migration in the northern Izu Islands, Japan. Geophys. Res. Lett. 28, 3745–3748. doi: 10.1029/2001GL013051
Ohlendorf, S. J., Thurber, C. H., Pesicek, J. D., and Prejean, S. G. (2014). Seismicity and seismic structure at Okmok Volcano, Alaska. J. Volcanol. Geotherm. Res. 27, 103–119. doi: 10.1016/j.jvolgeores.2014.04.002
Pallister, J. S., Thornber, C. R., Cashman, K. V., Clynne, M. A., Lowers, H., Mandeville, C. W., et al. (2008). “Petrology of the 2004-2006 Mount St. Helens lava dome–implications for magmatic plumbing and eruption triggering,” in A Volcano Rekindled: The Renewed Eruption of Mount St. Helens, 2004-2006, eds D. R. Sherrod, W. E. Scott, and P. H. Stauffer (Reston VA: U.S. Geol. Surv), 647–702.
Parks, M. M., Biggs, J., England, P., Mather, T. A., Nomikou, P., Palamartchouk, K., et al. (2012). Evolution of santorini volcano dominated by episodic and rapid fluxes of melt from depth. Nat. Geosci. 5, 749–754. doi: 10.1038/ngeo1562
Patane, D., Chiarabba, C., Cocina, O., De Gori, P., Moretti, M., and Boschi, E. (2002). Tomographic images and 3D earthquake locations of the seismic swarm preceding the 2001 Mt. Etna eruption: Evidence for a dyke intrusion. Geophys. Res. Lett. 29, 135-1–135-4.
Phillipson, G., Sobradelo, R., and Gottsmann, J. (2013). Global volcanic unrest in the 21st century: An analysis of the first decade. J. Volcanol. Geotherm. Res. 264, 183–196. doi: 10.1016/j.jvolgeores.2013.08.004
Pichavant, M., Costa, F., Burgisser, A., Scaillet, B., Martel, C., and Poussineau, S. (2007). Equilibration scales in silicic to intermediate magmas – Implications for experimental studies. J. Petrol. 48, 1955–1972. doi: 10.1093/petrology/egm045
Plail, M., Edmonds, M., Woods, A. W., Barclay, J., Humphreys, M. C., Herd, R. A., et al. (2018). Mafic enclaves record syn-eruptive basalt intrusion and mixing. Earth Planet Sci. Lett. 484, 30–40. doi: 10.1016/j.epsl.2017.11.033
Power, J. (1988). Seismicity Associated With the 1986 Eruption of Augustine Volcano, Alaska. Ph.D. thesis, University of Alaska Fairbanks, Fairbanks, AK.
Power, J., Jolly, A., Nye, C., and Harbin, M. (2002). A conceptual model of the Mount Spurr magmatic system from seismic and geochemical observations of the 1992 Crater Peak eruption sequence. Bull. Volcanol. 64, 206–218. doi: 10.1007/s00445-002-0201-x
Power, J. A., Coombs, M. L., and Freymueller, J. T. (eds) (2010). The 2006 eruption of Augustine volcano, Alaska. Washington, DC: US Department of the Interior.
Power, J. A., Jolly, A. D., Page, R. A., and McNutt, S. R. (1995). “Seismicity and forecasting of the 1992 eruptions of Crater Peak vent, Mount Spurr Volcano, Alaska: an overview,” in The 1992 Eruptions of Crater Peak Vent, Mount Spurr Volcano, Alaska, ed. T. E. C. Keith (Reston VA: U.S. Geol. Surv), 149–159.
Power, J. A., Lahr, J. C., Page, R. A., Chouet, B. A., Stephens, C. D., Harlow, D. H., et al. (1994). Seismic evolution of the 1989–1990 eruption sequence of Redoubt Volcano, Alaska. J. Volcanol. Geotherm. Res. 62, 69–94. doi: 10.1016/0377-0273(94)90029-9
Power, J. A., and Lalla, D. J. (2010). “Seismic observations of Augustine volcano, 1970–2007,” in The 2006 Eruption of Augustine Volcano, Alaska, eds J. A. Power, M. L. Coombs, and J. T. Freymueller (Reston VA: U.S. Geol. Surv), 3–40.
Rasmussen, D. J., Plank, T. A., Roman, D. C., Power, J. A., Bodnar, R. J., and Hauri, E. H. (2018). When does eruption run-up begin? Multidisciplinary insight from the 1999 eruption of Shishaldin volcano. Earth Planet Sci. Lett. 486, 1–14. doi: 10.1016/j.epsl.2018.01.001
Ripepe, M., Delle Donne, D., Genco, R., Maggio, G., Pistolesi, M., Marchetti, E., et al. (2015). Volcano seismicity and ground deformation unveil the gravity-driven magma discharge dynamics of a volcanic eruption. Nat. Comm. 6:6998. doi: 10.1038/ncomms7998
Rivalta, E., Taisne, B., Bunger, A. P., and Katz, R. F. (2017). A review of mechanical models of dike propagation: Schools of thought, results and future directions. Tectonophysics 638, 1–42. doi: 10.1016/j.tecto.2014.10.003
Roman, D. C., and Cashman, K. V. (2006). The origin of volcano-tectonic earthquake swarms. Geology 34, 457–460. doi: 10.1130/G22269.1
Roman, D. C., Cashman, K. V., Gardner, C. A., Wallace, P. J., and Donovan, J. J. (2006). Storage and interaction of compositionally heterogeneous magmas from the 1986 eruption of Augustine Volcano, Alaska. Bull. Volcanol. 68, 240–254. doi: 10.1007/s00445-005-0003-z
Roman, D. C., and Gardine, M. D. (2013). Seismological evidence for long-term and rapidly accelerating magma pressurization preceding the 2009 eruption of Redoubt Volcano, Alaska. Earth Planet. Sci. Lett. 371, 226–234. doi: 10.1016/j.epsl.2013.03.040
Roman, D. C., Moran, S. C., Power, J. A., and Cashman, K. V. (2004). Temporal and spatial variation of local stress fields before and after the 1992 eruptions of Crater Peak vent, Mount Spurr volcano, Alaska. Bull. Seismol. Soc. Am. 94, 2366–2379. doi: 10.1785/0120030259
Rubin, A. M., Gillard, D., and Got, J. L. (1998). A reinterpretation of seismicity associated with the January 1983 dike intrusion at Kilauea Volcano, Hawaii. J. Geophys. Res. 103, 10003–10015. doi: 10.1029/97JB03513
Rutherford, M. J., and Devine, J. D. (2004). “Magmatic conditions and processes in the storage zone of the 2004–2006 Mount St. Helens dacite,” in A Volcano Rekindled: The Renewed Eruption of Mount St. Helens, 2004-2006, eds D. R. Sherrod, W. E. Scott, and P. H. Stauffer (Reston VA: U.S. Geol. Surv), 703–725.
Saito, G., Uto, K., Kazahaya, K., Shinohara, H., Kawanabe, Y., and Satoh, H. (2005). Petrological characteristics and volatile content of magma from the 2000 eruption of Miyakejima Volcano. Japan. Bull. Volcanol. 67, 268–280. doi: 10.1007/s00445-004-0409-z
Sandri, L., Acocella, V., and Newhall, C. (2017). Searching for patterns in caldera unrest. Geochem. Geophys. Geosyst. 18, 2748–2768. doi: 10.1002/2017GC006870
Saunders, K., Blundy, J., Dohmen, R., and Cashman, K. V. (2012). Linking petrology and seismology at an active volcano. Science 336, 1023–1027. doi: 10.1126/science.1220066
Scaillet, B., Pichavant, M., and Cioni, R. (2008). Upward migration of Vesuvius magma chamber over the past 20,000 years. Nature 455, 216–220. doi: 10.1038/nature07232
Scandone, R., Cashman, K. V., and Malone, S. D. (2007). Magma supply, magma ascent and the style of volcanic eruptions. Earth Planet. Sci. Lett. 253, 513–529. doi: 10.1016/j.epsl.2006.11.016
Schaefer, J. R. (2012). The 2009 Eruption of Redoubt Volcano, Alaska. Reston, VA: US Geological Survey. doi: 10.1038/ncomms8860
Segall, P. (2010). Earthquake and Volcano Deformation. Princeton, NY: Princeton University Press. doi: 10.1515/9781400833856
Shapiro, N. M., Droznin, D. V., Droznina, S. Y., Senyukov, S. L., Gusev, A. A., and Gordeev, E. I. (2017). Deep and shallow long-period volcanic seismicity linked by fluid-pressure transfer. Nat. Geosci. 10, 442–446. doi: 10.1038/ngeo2952
Sherrod, D. R., Scott, W. E., and Stauffer, P. H. (2008). A Volcano Rekindled: The Renewed Eruption of Mount St. Helens, 2004-2006. Reston, VA: US Geological Survey.
Sigmundsson, F., Hooper, A., Hreinsdóttir, S., Vogfjörd, K. S., Ófeigsson, B. G., Heimisson, E. R., et al. (2015). Segmented lateral dyke growth in a rifting event at Bárarbunga volcanic system, Iceland. Nature 517, 191–195. doi: 10.1038/nature14111
Sparks, R. S. J., and Cashman, K. V. (2017). Dynamic magma systems: Implications for forecasting volcanic activity. Elements 13, 35–40. doi: 10.2113/gselements.13.1.35
Stock, M. J., Humphreys, M. C., Smith, V. C., Isaia, R., and Pyle, D. M. (2016). Late-stage volatile saturation as a potential trigger for explosive volcanic eruptions. Nat. Geosci. 9, 249–254. doi: 10.1038/ngeo2639
Taisne, B., Brenguier, F., Shapiro, N. M., and Ferrazzini, V. (2011). Imaging the dynamics of magma propagation using radiated seismic intensity. Geophys. Res. Lett. 38:L04304. doi: 10.1029/2010GL046068
Tait, S., Jaupart, C., and Vergniolle, S. (1989). Pressure, gas content and eruption periodicity of a shallow, crystallising magma chamber. Earth Planet. Sci. Lett. 92, 107–123. doi: 10.1016/0012-821X(89)90025-3
Tarasewicz, J., White, R. S., Woods, A. W., Brandsdóttir, B., and Gudmundsson, M. T. (2012). Magma mobilization by downward-propagating decompression of the Eyjafjallajökull volcanic plumbing system. Geophys. Res. Lett. 39:L19309. doi: 10.1029/2012GL053518
Till, C. B., Vazquez, J. A., and Boyce, J. W. (2015). Months between rejuvenation and volcanic eruption at Yellowstone caldera, Wyoming. Geology 43, 695–698. doi: 10.1130/G36862.1
Uhira, K., Baba, T., Mori, H., Katayama, H., and Hamada, N. (2005). Earthquake swarms preceding the 2000 eruption of Miyakejima volcano, Japan. Bull. Volcanol. 67, 219–230. doi: 10.1007/s00445-004-0405-3
Ukawa, M., Fujita, E., Yamamoto, E., Okada, Y., and Kikuchi, M. (2000). The 2000 Miyakejima eruption: crustal deformation and earthquakes observed by the NIED Miyakejima observation network. Earth Planet. Space 52, XIX–XXVI. doi: 10.1186/BF03351659
University of Washington (1963). Pacific Northwest Seismic Network. International Federation of Digital Seismograph Networks. Other/Seismic Network. Bothell, DC: University of Washington.
Waite, G. P., and Smith, R. B. (2002). Seismic evidence for fluid migration accompanying subsidence of the Yellowstone caldera. J. Geophys. Res. 107:2177. doi: 10.1029/2001JB000586
Waythomas, C. F., and Webley, P. W. (2013). Preface to the special issue of JVGR on the 2009 eruption of Redoubt Volcano, Alaska. J. Volcanol. Geother. Res. 259:1. doi: 10.1016/j.jvolgeores.2013.05.013
Werner, C., Evans, W. C., Kelly, P. J., McGimsey, R., Pfeffer, M., Doukas, M., et al. (2012). Deep magmatic degassing versus scrubbing: elevated CO2 emissions and C/S in the lead-up to the 2009 eruption of Redoubt Volcano, Alaska. Geochem. Geophys. Geosyst. 13:Q03015. doi: 10.1029/2011GC003794
Werner, C., Kelly, P. J., Doukas, M., Lopez, T., Pfeffer, M., McGimsey, R., et al. (2013). Degassing of CO2, SO2, and H2S associated with the 2009 eruption of Redoubt Volcano, Alaska. J. Volcanol. Geotherm. Res. 259, 270–284. doi: 10.1016/j.jvolgeores.2012.04.012
White, R., and McCausland, W. (2016). Volcano-tectonic earthquakes: A new tool for estimating intrusive volumes and forecasting eruptions. J. Volcanol. Geotherm. Res. 309, 139–155. doi: 10.1016/j.jvolgeores.2015.10.020
Wolf, K. J., and Eichelberger, J. C. (1997). Syneruptive mixing, degassing, and crystallization at Redoubt Volcano, eruption of December, 1989 to May 1990. J. Volcanol. Geotherm. Res. 75, 19–37. doi: 10.1016/S0377-0273(96)00055-8
Wright, H. M., Folkes, C. B., Cas, R. A., and Cashman, K. V. (2011). Heterogeneous pumice populations in the 2.08-Ma Cerro Galán Ignimbrite: implications for magma recharge and ascent preceding a large-volume silicic eruption. Bull. Volcanol. 73, 1513–1533. doi: 10.1007/s00445-011-0525-5
Yamaoka, K., Kawamura, M., Kimata, F., Fujii, N., and Kudo, T. (2005). Dike intrusion associated with the 2000 eruption of Miyakejima Volcano, Japan. Bull. Volcanol. 67, 231–242. doi: 10.1007/s00445-004-0406-2
Keywords: volcanic conduit formation, seismic precursors, VT seismicity, volcanic eruption, magma ascent
Citation: Roman DC and Cashman KV (2018) Top–Down Precursory Volcanic Seismicity: Implications for ‘Stealth’ Magma Ascent and Long-Term Eruption Forecasting. Front. Earth Sci. 6:124. doi: 10.3389/feart.2018.00124
Received: 14 March 2018; Accepted: 10 August 2018;
Published: 04 September 2018.
Edited by:
Corentin Caudron, Ghent University, BelgiumReviewed by:
Stephanie Prejean, United States Geological Survey, United StatesJurgen Neuberg, University of Leeds, United Kingdom
Copyright © 2018 Roman and Cashman. This is an open-access article distributed under the terms of the Creative Commons Attribution License (CC BY). The use, distribution or reproduction in other forums is permitted, provided the original author(s) and the copyright owner(s) are credited and that the original publication in this journal is cited, in accordance with accepted academic practice. No use, distribution or reproduction is permitted which does not comply with these terms.
*Correspondence: Diana C. Roman, droman@carnegiescience.edu